27

THE EFFECT OF MERGERS AND ACQUISITIONS ON BANK EFFICIENCY: EVIDENCE FROM BANK
CONSOLIDATION IN EGYPT
Malak Reda
Working Paper 770
September 2013
Send correspondence to: Malak Reda The Egyptian Center for Economic Studies [email protected]

First published in 2013 by The Economic Research Forum (ERF) 21 Al-Sad Al-Aaly Street Dokki, Giza Egypt www.erf.org.eg Copyright © The Economic Research Forum, 2013 All rights reserved. No part of this publication may be reproduced in any form or by any electronic or mechanical means, including information storage and retrieval systems, without permission in writing from the publisher. The findings, interpretations and conclusions expressed in this publication are entirely those of the author(s) and should not be attributed to the Economic Research Forum, members of its Board of Trustees, or its donors.

1
Abstract
The paper examines the impact of mergers and acquisitions on the efficiency and profitability of Egyptian banks by using Data Envelopment Analysis (DEA) to measure managerial efficiency and by traditional financial measures to capture changes in profitability and financial performance. The study compares the results of two periods, (2000-2003) as the pre consolidation period and (2007-2010) as the post consolidation period. The assumption is that banking efficiency improved post mergers and acquisitions and the empirical investigation aimed at verifying the empirical validity of the proposed hypothesis. The results showed that despite the fact that consolidation had a positive effect on managerial efficiency, banks’ capitalization and risk management practices, the banks’ intermediation function and banks’ profitability remained weak. Policy makers should design a strategy that promotes the channeling of deposits to productive lending by further promoting small and medium size enterprise lending and designing new innovative lending instruments that are well suited to the Egyptian market needs.
JEL Classification: G21, D24.
Keywords: Bank Mergers, Acquisitions, DEA, Financial Ratios, Egypt.
ملخص
ات ھذه تبحث تخدام بیان وك المصریة باس ة البن اءة (DEA)الورقة تأثیر عملیات االندماج واالستحواذ على كفاءة وربحی اس الكف لقی
الي ائج فترتین، . اإلداریة والتدابیر المالیة التقلیدیة اللتقاط التغیرات في الربحیة واألداء الم ین نت ارن الدراسة ب ) 2003-2000(وتق
دماج دت الى تحسناد قالمصرفیة الكفاءةواالفتراض ھو أن . فترة مجمعة الحقةك) 2010-2007(و فترة مجمعة سابقةك عملیات االن
أظھرت النتائج أنھ على الرغم من حقیقة . الفرضیة المقترحةھدف إلى التحقق من صالحیة ی يذال واالستحواذ آخر والتحقیق التجریبي
عاأن ھ أث لتجمی ان ل ةك اءة اإلداری ى الكف ابي عل ملةو ر إیج وك رس اطر، البن ات إدارة المخ اطة اال ان وممارس ة الوس وك للوظیف بن
اجي. ضعیفةظلت وربحیتھا راض اإلنت ادة وینبغي لصانعي السیاسات وضع استراتیجیة تعزز توجیھ الودائع إلى اإلق ق زی عن طری
ا الحتیاجات تعزیز حجم اإلقراض للمشاریع الصغیرة والمتوسطة، بة تمام ي ھي مناس وتصمیم أدوات اإلقراض المبتكرة الجدیدة الت
.السوق المصریة

2
1. Introduction With increased globalization, banking productivity and efficiency are essential for the survival of banks. Within this context, over the last decade, the Egyptian banking sector was subject to several reforms aiming at increasing both the efficiency and competitiveness of the banking sector. Perhaps, one of the key legislative reforms was the issuance of Banking Law 88 of 2003 which mandated that banks raise their capital over a period of three years ending 2006. This requirement, in turn, led to a massive wave of mergers and acquisitions and thus led to the reduction of the number of operating banks. Motivated by the catalytic role that banks play in the economy in terms of intermediation between depositors and borrowers—that is turning deposits into productive investments—and the need to have a strong banking sector to achieve greater economic development, the current study aims to assess the efficiency and profitability of Egyptian banks pre and post consolidation (pre-consolidation, 2000-2003 and post-consolidation, 2008-2010).
In order to measure the efficiency of banks, we used a non-parametric technique, namely Data Envelopment Analysis (DEA) to calculate the overall banking sector efficiency pre and post consolidation. The study covered a homogenous set of units, namely the pool of commercial banks in Egypt1. Our hypothesis is that the wave of consolidation has led to greater overall banking efficiency. Moreover, the study used traditional financial ratios to assess changes in other factors that are unaccounted for, such as profitability change or profit efficiency. The current study is important for two reasons. On one hand, it is the first study that uses a nonparametric technique to assess the banking sector efficiency in Egypt pre- and post- consolidation, and it complements the international banking efficiency literature, which is substantially skewed towards the banks of developed countries (Yildirim and Philippatos 2007).
This study is organized as follows: section 2 provides a brief literature review on banking efficiency; section 3 presents the key Egyptian banking sector developments over the last decade; section 4 reviews the methodology; section 5 presents the results; and section 6 offers concluding remarks.
2. Literature Review The empirical literature analyzing the effects of mergers and acquisitions on bank performance follows two major approaches. The first major approach follows the event study type methodology, which is usually based on changes occurring to stock prices around the period of the announcement of a merger (Campa and Hernando 2005; Alexandridis et al. 2010; and Antonio et al. 2008). These studies examine the effect of a bank merger announcement on the creation of shareholder’s value and the impact on the target, the bidder, or the combined new entity. The second strand of the literature, the operational performance approach, comprises studies that assess the link between mergers and acquisitions and the productive efficiency of the banks involved, either measured through accounting data or through the estimation of cost and profit functions. The increased interest in cost cutting and efficiency in the banking industry, particularly through mergers and acquisitions, has rendered this approach attractive.
Berger et al. (1999) indicated that mergers and acquisitions may lead to changes in efficiency, market power, economies of scale and scope, availability of services to customers and payment systems efficiency. Besides improvement in cost and profit efficiency, mergers and 1 The study does not cover Islamic banks nor does it cover foreign banks’ branches in Egypt. Islamic banks are not included as their inputs and outputs are different from traditional banks (in the sense that they do not deal with interest rates).
3
acquisitions may also lead to higher profits. Daley and Matthews (2009), explore the relationships between bank efficiency estimates using accounting ratios and non-parametric DEA in the case of Jamaican banks. Their findings suggest an advantage in favor of the DEA.
A growing number of studies used a non-parametric technique, namely Data Envelopment Analysis (DEA) to assess the impact of mergers and acquisitions. Allen and Boobal-Batchelor (2005) assessed the efficiency of the Malaysian banking sector pre and post mergers during the period (1996-2002), following the Asian financial crisis, using DEA. They found that acquiring banks was more technically efficient but less scale efficient than target banks at the time of merger. Nevertheless, the acquiring banks did not maintain their pre-merger efficiency levels. Inefficiencies grew during the first post-merger year but the results were inconclusive during the subsequent post-merger years. Abd-Kadir et al. (2010) studied the effect of mergers and acquisitions on Malaysian banks’ productivity over the period 2003-2007 using DEA. Yet, contrary to the finding of Allen and Boobal-Batchelor (2005), they found that the process of mergers and acquisitions has actually increased the efficiency and productivity growth of banks in Malaysia. Mautin (2011) investigated the scale economies in banks before, during and after consolidation in the Nigerian case using DEA for the period 2001-2008. The results revealed that on average more banks enjoy economies of scale during the consolidation period than during the period of three years prior and post consolidation.
Several studies were conducted on the Egyptian banking system, each analyzing it from a different angle, yet to our knowledge, none have used DEA to assess the effect of mergers and acquisitions on the efficiency of the banking sector. Badreldin and Kalhoefer (2009) studied the effect of mergers and acquisitions on bank performance in Egypt. They measured the performance of Egyptian banks that had undergone mergers or acquisitions during the period 2002-2007 by calculating their return on equity. Their findings indicate that not all banks that have undergone deals of mergers or acquisitions have shown significant improvements in performance as compared to pre consolidation. They concluded that mergers and acquisitions have not had a clear effect on the profitability of banks in Egypt. Nasr (2009) raised the question about the role of banks in Egypt as a catalyst for economic development and found that although significant progress has been made in the implementation of financial sector reform measures in Egypt since mid 2004, challenges still remain. Moreover, various financial indicators put the Egyptian financial system at a moderate level in terms of financial intermediation over the period 2000-2008 as compared to other developing and developed countries. Moreover, concerns have surfaced that finance has been mainly going to the privileged enterprises, while small and medium enterprises, as well as start-ups, have limited access to finance. Ben Naceur and Kandil (2009) studied the impact of capital requirements on banks’ cost of intermediation and performance in Egypt. The results of the study supported Egypt’s Central Bank efforts to enforce capital regulations as of 1991 towards improving the performance of the banking sector in Egypt.
Reda and Isik (2006) measured the efficiency and productivity change of Egyptian commercial banks during the period 1995-2003 using DEA and Malmiquist productivity index. They found that over the period under study, Egyptian commercial banks’ technical inefficiency was 22 percent and that productivity deteriorated on average by 4 percent annually over the period. The study recommended that the government adopt policies that would foster competition and for the industry to devise incentive schemes to improve managerial efficiency through greater investment in technology and skill enhancements.
4
Abdel-Baki (2010) assessed the effectiveness of the banking reform endeavor on the performance of Egyptian banks by analyzing banking efficiency of 26 banks over the period 2004-2009. The research culminated in proposing guidelines to steer the banking sector towards enhanced efficiency. Poshakwale and Qian (2009) investigated whether the financial reforms introduced in Egypt have had a significant impact on improving financial sector’s competitiveness and production efficiency. Also, they questioned whether increased banking competitiveness and efficiency had short and or long-term impact on Egypt’s economic growth over the period 1992-2007. They found that financial sector reforms appear to have a positive and significant effect on improving competitiveness and production efficiency of the Egyptian banking sector and that there is evidence to suggest a significant relationship between the financial sector’s economic and productive efficiency in the short run. However, they could not find any evidence of a long-run relationship between increased banking efficiency and economic growth.
3. Developments in the Egyptian Banking Sector Over the last decade, the Egyptian banking sector has gone through major reforms with the aim to raise efficiency and soundness of the banking sector. The government developed specific banking restructuring reform programs to increase banking competition, reduce non-performing loans, raise capital adequacy and ensure adherence to prudential regulations. Key reforms of the banking sector included the following: consolidation of banking systems through mergers and acquisitions of small and weak banks; restructuring of state-owned banks; financial resolution and resolution of non-performing loans (NPLs); privatization of one of the state-owned banks; divesting public sector shares in joint venture banks and strengthening the supervisory authority of the Central Bank. As of 2004, a NPL monitoring unit was established in the Central Bank. The unit helped banks in making collective settlements with their major problem customers through using its moral suasion. From 2004 to 2010, the unit was able to help in settling more than 90 percent of NLPs (excluding the debts of the public business sector). With regards to the NPLs of public business sector enterprises to banks, about 62 percent was repaid in cash to the public commercial banks. As for the remaining 38 percent, they are supposed to be settled in kind.
The government aimed to consolidate banks as to raise banks’ competitiveness and eliminate low performers. An important factor contributing to the consolidation of the banking sector was the issuance of the Unified Banking Law of 2003 which raised the minimum required paid-in capital of national banks from LE100 million to LE500 million. Also, the capital adequacy ratio requirement was increased to 10 percent as opposed to 8 percent for the risk-weighted assets. As a result, over the period 2004 to 20062, the Egyptian banking sector witnessed a major wave of consolidation. Small banks and poor performers were easy acquisition targets, as they could not abide by the modified regulations. In contrast, foreign banks were involved in acquisition actions, in an attempt to enter the Egyptian banking sector, especially after the government refrained from issuing new banking licenses3. Foreign interest was illustrated by the participation of foreign players in the bids that took place to acquire stakes in Egyptian banks. These banks include BNP Paribas, Barclays, Piraeus, Credit Agricole, Societe Generale, BLOM and Audi among others. Table 1 portrays the structure of the banking sector over time, whereas table A1 in appendix reports key mergers and acquisitions that took place in the Egyptian banking sector.
2The exception is the acquisition that took place in January 2008, whereby The Societe Arabe Internationale De Banque acquired Port Said National Bank. 3 Bank licensing is subject to economic needs but in reality no new licenses were issued over the last two decades.

5
The government also attempted to reduce the public sector dominance in the banking sector by privatizing one of the public banks, namely Bank of Alexandria, which was acquired by the Italian Intesa San Paolo Bank in 2006. Banque du Caire, another public bank, was also about to be privatized in 2008, but the deal was cancelled as the bids did not match the value of the bank. Moreover, the government sold its stakes in public banks in joint ventures.
The lender of last resort has been a feature of the Egyptian banking system since the issuance of law 163 of 1957, which made the CBE responsible for providing troubled banks with emergency funds. Although law 1992 allowed for a deposit insurance fund to be established, it has not yet been implemented.
Other banking reforms that took place over the last decade included the establishment of a credit bureau, under the supervision of the CBE, with the aim to provide accurate information to banks regarding personal and financial information on borrowers, as well as their financial history.
Pressing forward with banking reform plans, and following the completion of the first stage of banking reforms4, the Central Bank of Egypt (CBE) focused on several pillars during the period 2009 and 2011. The key reforms included financial and administrative restructuring of specialized state-owned banks5; applying Basel II standards to Egyptian banks with the aim of enhancing risk management practices; applying international governance rules and adopting an initiative promoting the development and growth of banking services and access to finance for various sectors, especially small and medium-sized enterprises (SMEs).
In this context, to encourage banking credit to small and medium sized enterprises, the CBE exempted banks’ deposits of the reserve requirement of 14% (for an amount equal to that granted to SMEs).6 During the first half of 2009, finance extended to SMEs mounted to a mere LE305 million. According to the CBE the poor access to adequate, timely and reliable statistical data and information is one of the main obstacles to improving and financing SMEs (CBE 2009/10). In this respect, the CBE and The Egyptian Banking Institute (EBI) are collaborating with CAPMAS to set up a database to provide a full count of Egyptian SMEs. Moreover, the CBE has required banks in 2010 to obtain data and information from the Egyptian Credit Bureau (I-Score) on the credit history of natural persons and SMEs, as part of the process of analyzing information on, and determining the creditworthiness of each customer. Other reforms in place included setting up the rules and regulations governing the operation of payment orders via mobile phones (mobile-banking and money transfers); approvals for e-banking; and increased risk reserves and required security deposits when opening documentary credits. Moreover, banks’ branching rules and guidelines were revised.
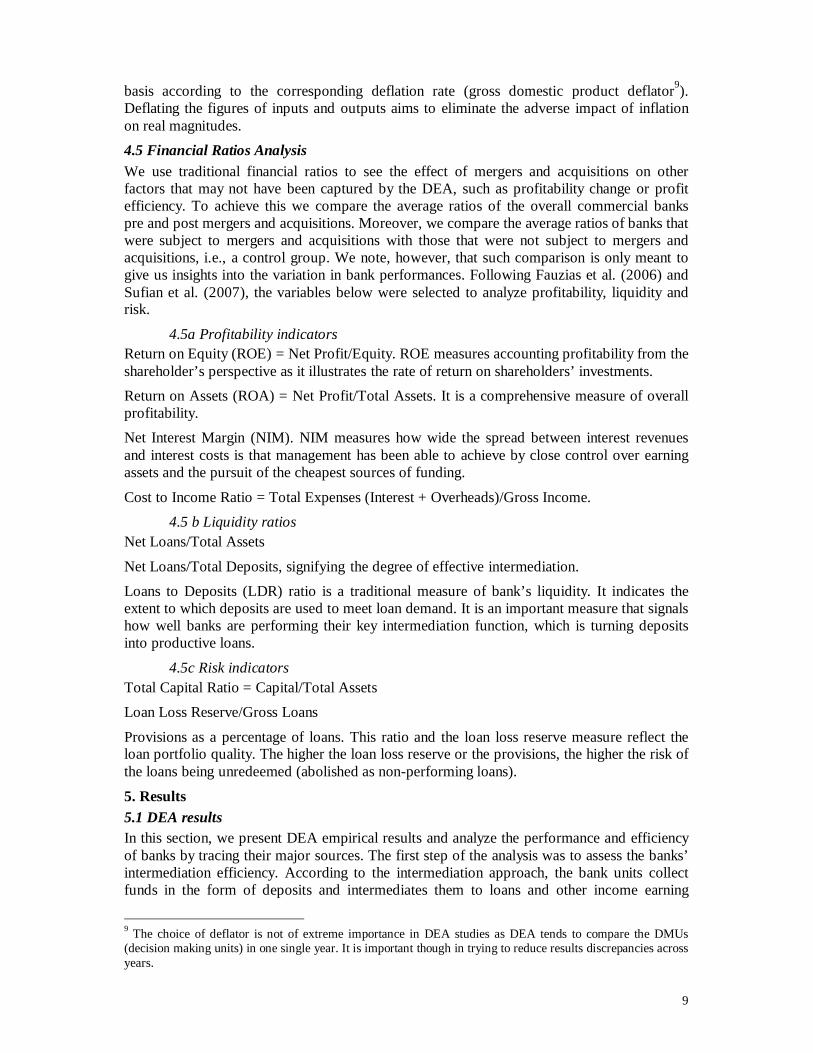
Figure 1 shows the aggregate deposits and lending in the Egyptian banking system from 2000 to 2010. In nominal terms, over the last decade, aggregate deposits quadrupled while aggregate lending only doubled. During that period the lending to deposits ratio declined 4 The first stage of reforms focused on consolidating and privatizing the banking sector; financial and managerial restructuring of state owned banks; addressing non-performing loans and upgrading of the supervision sector at the CBE. This stage was successfully implemented. 5Specialized state owned banks include the Principal Bank for Development and Agricultural Credit, Egyptian Arab Land Bank, and Industrial Development and Workers Bank of Egypt. 6 Recognizing the key role played by the banking sector in enhancing the national economy and in developing and promoting firms, particularly SMEs that could hardly access banking finance, CBE’s Board of Directors decided on its session of 16th December 2008, to exempt banks extending loans and credit facilities to SMEs from the reserve requirement ratio (14 percent). The exemption is proportional to the volume of credit granted by banks to SMEs as of January 2009. It is noteworthy that in a recent development in March 2012, the CBE decided to reduce the required reserve ratio on domestic currency deposits to 12 percent to boost liquidity.

6
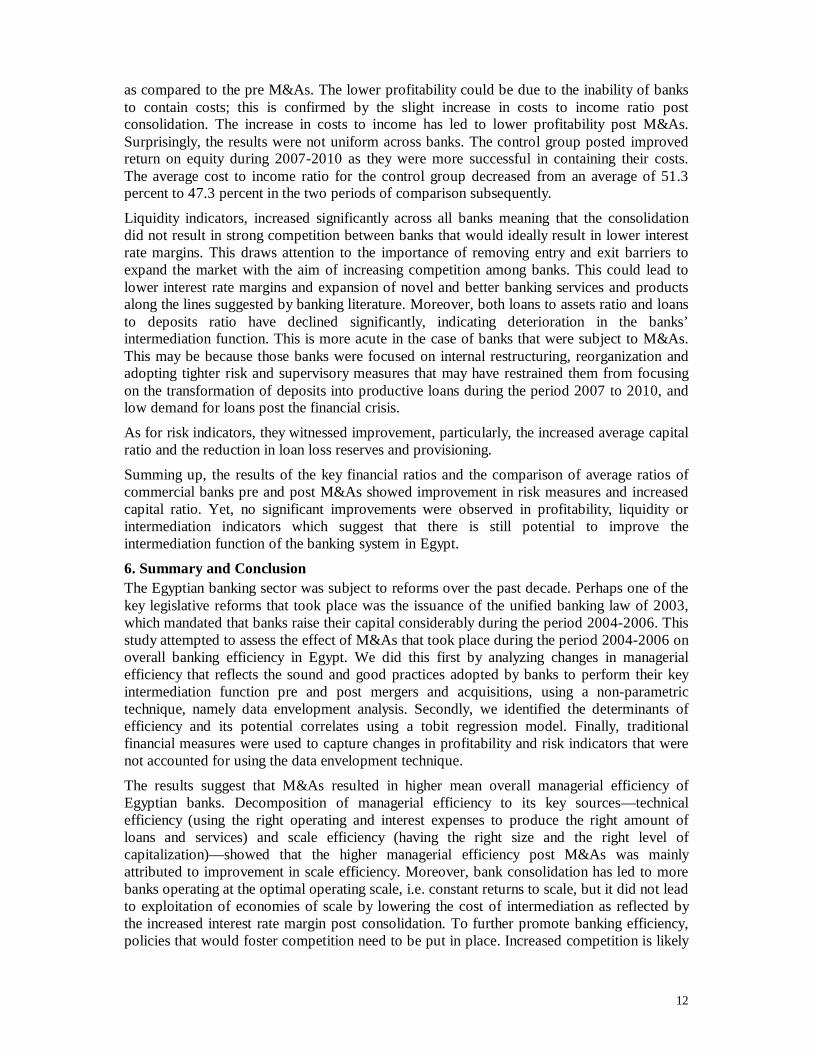
from 87 percent in 2000 to just 52 percent in 2010. This decreased intermediation role is striking and requires a closer look at the banking sector developments and changes in legislations to adequately explain this phenomenon. Moreover, if we look at the deposits structure at two points in time, year 2000 and 2010 as shown in figure (2), we note that more than 75% of deposits come from the household and private business sectors and that the government and public business sector contribution to deposits has been shrinking from 21 percent in 2000 to 16 percent in 2010. On the lending side, we note that lending to the private business sector slightly decreased on the account of increased household lending. This could be due to banks trying to diversify their lending to corporate and individuals which may have been reinforced by the effect of the financial crisis as of 2008 which decreased firms’ appetite in getting involved in new investments and increased risk aversion by banks. As of 2004, the retail banking started to flourish with new retail products made available in the market such as car loans, personal loans, and educational loans. Retail lending has been increasing over time since 2005 onwards (figure A2 in the appendix). Households lending reached 19.9 percent of total lending in 2010, up from a low of 12.5 percent in 2004. Lending to government and public business sectors decreased from 20 percent of total lending in 2000 to 14 percent of total lending in 2010 (figure 3). The distribution of loans by economic activity shows the manufacturing sector to be the major recipient of loans with a share of 37 percent of total loans extended by banks in 2010, followed by unclassified sectors7, then services, trade and finally agriculture (figure 4 and figure A3 in the appendix). Over the last decade, the share of lending directed to agriculture has been small, not exceeding the 2 percentage points of total loans offered by banks. Moreover, according to the CBE’s annual report 2009/10, small size economic activities have received only 3.5 percent of total credit whereas businesses and consumer credit have received 85.4 and 11.1 percent of total credit, respectively (figure 5).
4. Methodology 4.1 The Concept of Efficiency Efficiency relates to how well an organization transforms inputs into outputs. In order to measure efficiency, it is necessary to compare actual organizational production to some standard or benchmark that, if achieved, is considered efficient. Production functions generally serve as this benchmark, defined as a function, algorithm, or "black box" by which a given amount of inputs is converted into some maximal quantity of output. Frontier analysis is a sophisticated way by which one could “benchmark” the relative performance of production units. Frontier analysis provides an overall, objectively determined, numerical efficiency value and ranking of firms (also called X-efficiency in the economics literature) that is not otherwise available. This attribute makes frontier analysis particularly valuable in assessing and informing government policy regarding financial institutions.
Following the terminology adopted by Reda and Isik (2006), the term technical efficiency is used to describe managerial efficiency in banking. Managerial efficiency (ME) consists of two mutually exclusive and exhaustive components: pure technical efficiency (PTE) and scale efficiency (SE). Pure technical efficiency is defined as managerial efficiency devoid of scale effects. When the scale issues are dismantled, managerial efficiency (ME) and pure technical efficiency (PTE) scores are the same, as the difference between them refers to scale inefficiency. Thus PTE refers to proportional reduction in input usage that can be obtained if the bank operates on the efficient frontier. As it results directly from management errors, it is considered one form of managerial inefficiency. Scale inefficiency refers to non-optimal choice of production scale in terms of cost control. A scale efficient firm will produce where there are constant returns to scale (CRS). Thus, when there are increasing returns to scale 7 Unclassified include companies that are not easily classified such as crafts shops.

7
(IRS), efficiency gains could be obtained by expanding production levels. If decreasing returns to scale (DRS) exist, efficiency gains could be achieved by reducing production levels. As it involves the choice of an inefficient level by management, scale inefficiency is also considered a form of managerial inefficiency. 4.2 Efficiency and DEA In order to measure managerial efficiency we use DEA, with the variable returns to scale assumption to measure input-oriented managerial efficiency for each period 2000-2003 (pre consolidation) and 2007-20108 (post consolidation). Our null hypothesis is that the Egyptian banking sector’s efficiency improved post consolidation as banks are able to become more efficient, using fewer resources to produce the same amount of output (loans and services).
DEA has proved a popular technique for performance analysis in general but particularly for the banking sector. In this regard, the banking sector has a series of characteristics that make it particularly suitable for study through DEA: the nature of its multiple inputs and outputs, the non-linearity of its input-output relationships, the non-physical nature of some resources and products, and the impossibility of drawing on market price mechanism for some of them.
Broadly speaking, the DEA technique defines an efficiency measure of a production unit by its position relative to the frontier of the best performance established mathematically by the ratio of weighted sum of outputs to weighted sum of inputs. For a detailed description of the DEA technique, please refer to studies such as Coelli et al. (1998); Casu and Molyneux (1999); and Reda and Isik (2006). Also, please refer to appendix B.
4.3 Variables and Data Selection The number of variables used in DEA is critical and the inclusion of many variables is not a viable option. As the number of variables in the model increases, more and more production units become efficient. On the other hand, when relevant variables are omitted, DEA underestimates efficiency and the effect of this is more severe than when irrelevant variables are included in the DEA model. Lack of a standard structured approach to variable selection in DEA makes the task more difficult. Berger and Humphrey (1997) commented on the difficulty of variable selection in performance appraisal of banks using the DEA technique that there is no ‘perfect approach’ on the explicit definition and measurement of banks’ inputs and outputs. 4.4 Definition of a Commercial Bank’s Function The definition of a bank’s function is one complication in bank efficiency studies that affects variable selection and the associated results. In order to provide guidelines for variable selection and application, it is useful to define the banking process.
One of the key approaches used in the literature to conceptualize the flow of services provided by banks in order to identify inputs and outputs is the intermediation approach. This approach describes banking activities as transforming money borrowed from depositors into money lent to borrowers. This transformation activity originates from the different characteristics of deposits and loans. Deposits are typically liquid and less risky, while loans, on the other hand, are regarded as illiquid and more risky. In this approach, the deposits collected and funds borrowed from financial markets constitute inputs while outputs are measured by the volume of outstanding loans and investments.
We prefer using the intermediation approach for the following reasons: its use in bank productivity presents fewer data problems than with the production approach and its the more appropriate approach for evaluating the entire banking industry because it is inclusive of 8 Although a couple of merger and acquisition deals were concluded in 2007, they were Islamic banks deals and are thus excluded from our study as the study focuses on the pool of homogenous traditional commercial banks.
8
interest expenses, which accounts for 50-66% of total costs of banks Rao (2002). Further, the intermediation approach may be superior for evaluating the importance of frontier efficiency to the profitability of financial institutions since minimization of total costs (not just production costs) is needed to maximize profits. The production approach may be somewhat better for evaluating the efficiencies of bank branches, because branches primarily process customer documents and branch managers typically have little influence over bank funding and investment decisions (Berger and Hannan 1998). The final reason relates to the structure of the Egyptian banking sector and the nature of the assessment we wish to undertake. The banking sector in Egypt is dominated by the public sector. We believe that assessing the efficiency of the transformation process of deposits to loans ( i.e. the intermediation role) is of greater importance in the assessment of Egyptian banks.
Similar to many studies on banking efficiency (Isik and Hassan 2002; Pasiouras 2007; Sufian and Habibullah 2009), we adopt the intermediation approach. The use of the intermediation approach in bank productivity presents fewer data problems than the production approach. Literature suggests that it is the most appropriate approach for evaluating the entire banking industry, as it includes interest expenses, which account for 50-66 percent of total costs of banks as confirmed by Rao (2002). Accordingly, we will model commercial banks as multi-product firms, producing three outputs and using two inputs. Table 2 presents a summary of the inputs and outputs used in the study.
The input vector includes:
1) Operating expenses or non-interest expenses [OPE], which are expenses incurred for running the bank’s operations that include personnel costs, establishment costs, marketing expenses and also administrative and general expenses. Personnel cost represents bank expenses for its regular activities and daily operations such as salaries and wages of the bank’s operating staff. These expenses can indirectly reflect the efficiency of banks in management. If a bank’s personnel costs increase, the operating expenses will also increase, and the results will mirror the bank management’s efficiency in controlling the operating costs. Establishment costs are expenses contributed to the rental of premises, equipment, repair and maintenance of machines and premises and depreciation.
2) Interest expenses [IE] represent expenses that the bank pays out in interest on deposits, the cost of the bank’s loans or cost of borrowing money. They include deposits from customers and other financial institutions, and subordinated notes and bonds. It is important to keep track of the interest the bank pays out in relation to its revenue and earnings.
The output vector includes: 1) Net interest income [NIE].
2) Non-interest income (NONE) includes revenue from sundry services, fiduciary fees and deposit service charges. Non-interest income plays an important part in calculating the bank’s earnings and management of risks. The bank’s income is generated from only two sources, namely, the fee income and the non-interest income. With increasing inflation, the non-interest income must be monitored constantly. 3) Total amount of loans and advances [L&A], which includes overdraft, term loans or financing, bills receivable, trust receipts and claims on customers under acceptance credit. In order to account for heterogeneous business operations among banks, such as additional overhead costs that may result from operating large branch networks, we normalized all production variables by the number of branch offices. This treatment is in accordance with Berger and Mester (1997) and Denizer et al. (2000). We also deflated all variables on a yearly
9
basis according to the corresponding deflation rate (gross domestic product deflator9). Deflating the figures of inputs and outputs aims to eliminate the adverse impact of inflation on real magnitudes. 4.5 Financial Ratios Analysis We use traditional financial ratios to see the effect of mergers and acquisitions on other factors that may not have been captured by the DEA, such as profitability change or profit efficiency. To achieve this we compare the average ratios of the overall commercial banks pre and post mergers and acquisitions. Moreover, we compare the average ratios of banks that were subject to mergers and acquisitions with those that were not subject to mergers and acquisitions, i.e., a control group. We note, however, that such comparison is only meant to give us insights into the variation in bank performances. Following Fauzias et al. (2006) and Sufian et al. (2007), the variables below were selected to analyze profitability, liquidity and risk.
4.5a Profitability indicators Return on Equity (ROE) = Net Profit/Equity. ROE measures accounting profitability from the shareholder’s perspective as it illustrates the rate of return on shareholders’ investments. Return on Assets (ROA) = Net Profit/Total Assets. It is a comprehensive measure of overall profitability. Net Interest Margin (NIM). NIM measures how wide the spread between interest revenues and interest costs is that management has been able to achieve by close control over earning assets and the pursuit of the cheapest sources of funding.
Cost to Income Ratio = Total Expenses (Interest + Overheads)/Gross Income. 4.5 b Liquidity ratios
Net Loans/Total Assets
Net Loans/Total Deposits, signifying the degree of effective intermediation. Loans to Deposits (LDR) ratio is a traditional measure of bank’s liquidity. It indicates the extent to which deposits are used to meet loan demand. It is an important measure that signals how well banks are performing their key intermediation function, which is turning deposits into productive loans.
4.5c Risk indicators Total Capital Ratio = Capital/Total Assets Loan Loss Reserve/Gross Loans
Provisions as a percentage of loans. This ratio and the loan loss reserve measure reflect the loan portfolio quality. The higher the loan loss reserve or the provisions, the higher the risk of the loans being unredeemed (abolished as non-performing loans).
5. Results 5.1 DEA results In this section, we present DEA empirical results and analyze the performance and efficiency of banks by tracing their major sources. The first step of the analysis was to assess the banks’ intermediation efficiency. According to the intermediation approach, the bank units collect funds in the form of deposits and intermediates them to loans and other income earning
9 The choice of deflator is not of extreme importance in DEA studies as DEA tends to compare the DMUs (decision making units) in one single year. It is important though in trying to reduce results discrepancies across years.

10
activities (Thanassoulis 1999). For this point of view, the basic input and output are the value of the deposit accounts and the value of the loan accounts, respectively.
5.1a Have mergers and acquisitions made the banking sector more efficient? As shown in table 3, the yearly frontier results demonstrate that the average managerial efficiency increased from 62.4 percent pre consolidation to 69.9 percent post consolidation. This indicates that together consolidation and increased capitalization have led to increased banking efficiency. A plausible reason could be the advantages that the large banks have in attracting a larger amount of deposits and providing larger amounts of loans, which in turn command larger interest rate spreads.10 The reason behind that may be that large banks tend to be more secure from a depositors’ point of view and are able to set the interest rate on loans they offer because they are market leaders. Additionally, large banks may offer more services and in the process derive substantial non-interest income from commissions, fees and other treasury activities. To examine the difference in the efficiency of the Egyptian commercial banking sector between the two periods (before and after M&As), we perform a series of parametric (t-tests) and non-parametric (Mann-Whitney [Wilcoxon] tests). The results are presented in table 4. Results from both tests demonstrate that managerial efficiency has significantly improved post M&As at the 5 percent level. The decomposition of the managerial efficiency changes into its two components (PTE and SE) suggests that the improvement in the Egyptian banking sector’s managerial efficiency post M&As was mainly attributed to higher scale efficiency and is statistically significant at the 5 percent level. In other words, the increase in bank capitalization has helped banks to become more scale efficient.
The empirical finding that managerial efficiency had improved post M&As in Egypt’s case is similar to the findings of Sufian and Habibullah (2009) for Malaysia during the period 1997-2003.
The yearly frontier results also showed that the managerial inefficiency11 has been as high as 61 percent pre M&As and that despite considerable decrease in inefficiency to 45 percent post M&As, there is considerable room for improvement as this figure implies that Egyptian banks could have produced the same output (loans and services) using less than half of the resources used (interest and operating expenses).
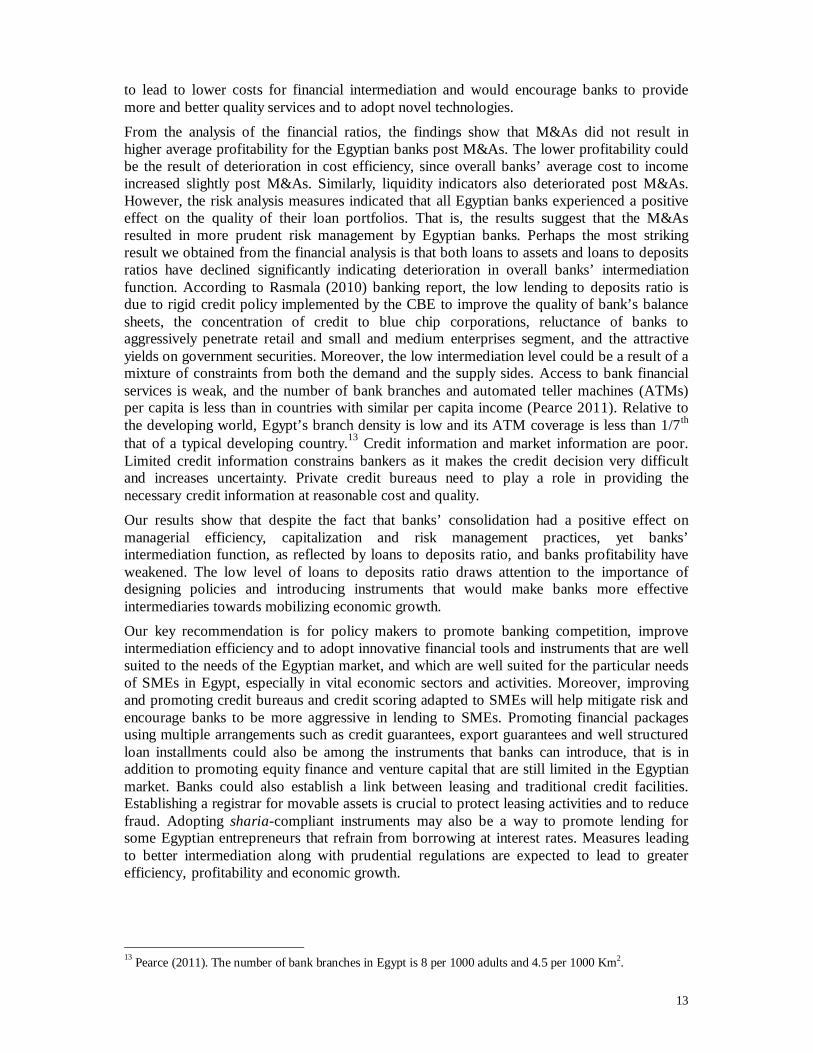
Looking at the difference between the average results obtained by the grand frontiers, pre and post M&As, we realize that managerial inefficiency was mainly due to pure technical inefficiency rather than scale inefficiency post M&As. That is the underperformance of Egyptian banks with respect to the frontier banks, which are operating under similar conditions, can be mainly attributed to internal problems and “poor” management practices. Whereas in case of pre M&As, the managerial inefficiency is driven by scale inefficiency.12 That is, the inefficiency was attributed to lower level of output, banks producing loans and services. We also note that both pure technical and scale inefficiencies have decreased considerably post M&As implying better management and improved practices. The improvements in managerial and scale efficiencies are clearly observed as per figure 6, which demonstrates the results on a bank- by-bank basis pre and post M&As.
Among the banks under investigation, there are seven banks that were not subject to mergers and acquisitions themselves (a control group), however, they did abide by the new provision 10 The interest rate margins increased post mergers and acquisitions. Evidence of that is discussed in the section on financial ratios (liquidity ratios). 11 The association between efficiency (Eff) and inefficiency (Ineff) is Ineff = (1-Eff)/Eff (Isik and Hassan 2002). 12 Pre M&As, pure technical inefficiency was 41 percent and scale inefficiency was 31 percent, whereas post M&As they became 9 percent and 11 percent, respectively.

11
of raising their capital. One interesting thing to explore is the difference in efficiency and performance change for the control group and the other banks that were subject to M&As before and after M&As took place and discern if there is any difference between the two groups. As shown in table 5, managerial efficiency increased for the two groups post M&As, yet the managerial efficiency was higher in the case of banks subject to M&As. This improvement stems mainly from improvement in pure technical efficiency. Coincidently, scale efficiency for the two groups post M&As was identical at 91 percent. We can infer from the above that the improvement in managerial efficiency post M&As for the banks that have been consolidated was a result of improvement in input usage and the production of greater output (loans and services) using lesser inputs (interest and operating expenses)—neutralizing the scale efficiency, which increased considerably for both groups.
5.2 Returns to Scale in the Egyptian Banking Sector Scale inefficiency, i.e. functioning at the wrong size, appears to affect negatively the overall managerial inefficiency of Egyptian banks. It is worthwhile to examine returns to scale with the increase in banks’ size. The law of diminishing returns to scale indicates what happens to output when a bank changes only one input, say labor or capital, and holds all other inputs constant, whereas returns to scale (RTS) tell us what happens to a bank’s output if it changes all inputs. Thus, we define RTS as the increases in output that result from increasing all inputs by the same percentage. Increasing returns to scale (IRS) takes place in cases where increased output enables banks to increase the division of labor and equipment or to use more specialized labor and capital. In these circumstances, bank employees specialize in a small number of tasks at which they become highly proficient. Decreasing returns to scale (DRS) happen in all production and service technologies at some output rate, especially at a very large one. The larger the production and service levels of banks, the more complex are their management and organizational structure. The bigger the size of a bank, the more likely that many managerial layers will exist in its organizational structure, and therefore the more difficult and costly it becomes to operate, monitor and control the operations and marketing processes.
Table 6 displays the returns to scale of Egyptian banks pre M&As (2000 to 2003) and post M&As (2007-2010) according to the intermediation model. As it appears from the table, pre M&As and the increase in banks’ capital as required by the regulation adopted in 2003, 37 percent of banks experienced increasing returns to scale, implying improvement in efficiency with size. IRS decreased considerably to 17 percent of banks post the implementation of the mandatory increase in capital and M&As during the period 2004-2006. That is, more banks were able to operate under constant returns to scale (CRS) (42 percent of banks). The results also show that DRS also increased post M&As to 41 percent. The scale inefficiency due to DRS might be related to established large banks, which transgressed the ‘right’ scale of operation. It is evident that despite improvements following the increase in required paid-in capital and the resulting wave of consolidations, there is still room for improvement. It is evident that absence of effective competition allows inefficient banks to remain in business despite the weak efficiency. This implies that there is a need for policy makers to adopt policies that would foster competition. So far, new entry to the banking sector is subject to economic needs and no new licenses have been issued over the past two decades. Furthermore, banks are not allowed to exit the market since the Central Bank of Egypt, acting as a lender of last resort, does not allow this. 5.3 Financial Ratios Analysis Table 7 presents the results of financial ratios for commercial banks before and after consolidation. Examining the most commonly used profitability ratios, namely ROA and ROE, we note that commercial banks posted lower ROA and ROE in the period post M&As
12
as compared to the pre M&As. The lower profitability could be due to the inability of banks to contain costs; this is confirmed by the slight increase in costs to income ratio post consolidation. The increase in costs to income has led to lower profitability post M&As. Surprisingly, the results were not uniform across banks. The control group posted improved return on equity during 2007-2010 as they were more successful in containing their costs. The average cost to income ratio for the control group decreased from an average of 51.3 percent to 47.3 percent in the two periods of comparison subsequently.
Liquidity indicators, increased significantly across all banks meaning that the consolidation did not result in strong competition between banks that would ideally result in lower interest rate margins. This draws attention to the importance of removing entry and exit barriers to expand the market with the aim of increasing competition among banks. This could lead to lower interest rate margins and expansion of novel and better banking services and products along the lines suggested by banking literature. Moreover, both loans to assets ratio and loans to deposits ratio have declined significantly, indicating deterioration in the banks’ intermediation function. This is more acute in the case of banks that were subject to M&As. This may be because those banks were focused on internal restructuring, reorganization and adopting tighter risk and supervisory measures that may have restrained them from focusing on the transformation of deposits into productive loans during the period 2007 to 2010, and low demand for loans post the financial crisis.
As for risk indicators, they witnessed improvement, particularly, the increased average capital ratio and the reduction in loan loss reserves and provisioning.
Summing up, the results of the key financial ratios and the comparison of average ratios of commercial banks pre and post M&As showed improvement in risk measures and increased capital ratio. Yet, no significant improvements were observed in profitability, liquidity or intermediation indicators which suggest that there is still potential to improve the intermediation function of the banking system in Egypt.
6. Summary and Conclusion The Egyptian banking sector was subject to reforms over the past decade. Perhaps one of the key legislative reforms that took place was the issuance of the unified banking law of 2003, which mandated that banks raise their capital considerably during the period 2004-2006. This study attempted to assess the effect of M&As that took place during the period 2004-2006 on overall banking efficiency in Egypt. We did this first by analyzing changes in managerial efficiency that reflects the sound and good practices adopted by banks to perform their key intermediation function pre and post mergers and acquisitions, using a non-parametric technique, namely data envelopment analysis. Secondly, we identified the determinants of efficiency and its potential correlates using a tobit regression model. Finally, traditional financial measures were used to capture changes in profitability and risk indicators that were not accounted for using the data envelopment technique.
The results suggest that M&As resulted in higher mean overall managerial efficiency of Egyptian banks. Decomposition of managerial efficiency to its key sources—technical efficiency (using the right operating and interest expenses to produce the right amount of loans and services) and scale efficiency (having the right size and the right level of capitalization)—showed that the higher managerial efficiency post M&As was mainly attributed to improvement in scale efficiency. Moreover, bank consolidation has led to more banks operating at the optimal operating scale, i.e. constant returns to scale, but it did not lead to exploitation of economies of scale by lowering the cost of intermediation as reflected by the increased interest rate margin post consolidation. To further promote banking efficiency, policies that would foster competition need to be put in place. Increased competition is likely
13
to lead to lower costs for financial intermediation and would encourage banks to provide more and better quality services and to adopt novel technologies. From the analysis of the financial ratios, the findings show that M&As did not result in higher average profitability for the Egyptian banks post M&As. The lower profitability could be the result of deterioration in cost efficiency, since overall banks’ average cost to income increased slightly post M&As. Similarly, liquidity indicators also deteriorated post M&As. However, the risk analysis measures indicated that all Egyptian banks experienced a positive effect on the quality of their loan portfolios. That is, the results suggest that the M&As resulted in more prudent risk management by Egyptian banks. Perhaps the most striking result we obtained from the financial analysis is that both loans to assets and loans to deposits ratios have declined significantly indicating deterioration in overall banks’ intermediation function. According to Rasmala (2010) banking report, the low lending to deposits ratio is due to rigid credit policy implemented by the CBE to improve the quality of bank’s balance sheets, the concentration of credit to blue chip corporations, reluctance of banks to aggressively penetrate retail and small and medium enterprises segment, and the attractive yields on government securities. Moreover, the low intermediation level could be a result of a mixture of constraints from both the demand and the supply sides. Access to bank financial services is weak, and the number of bank branches and automated teller machines (ATMs) per capita is less than in countries with similar per capita income (Pearce 2011). Relative to the developing world, Egypt’s branch density is low and its ATM coverage is less than 1/7th that of a typical developing country.13 Credit information and market information are poor. Limited credit information constrains bankers as it makes the credit decision very difficult and increases uncertainty. Private credit bureaus need to play a role in providing the necessary credit information at reasonable cost and quality. Our results show that despite the fact that banks’ consolidation had a positive effect on managerial efficiency, capitalization and risk management practices, yet banks’ intermediation function, as reflected by loans to deposits ratio, and banks profitability have weakened. The low level of loans to deposits ratio draws attention to the importance of designing policies and introducing instruments that would make banks more effective intermediaries towards mobilizing economic growth. Our key recommendation is for policy makers to promote banking competition, improve intermediation efficiency and to adopt innovative financial tools and instruments that are well suited to the needs of the Egyptian market, and which are well suited for the particular needs of SMEs in Egypt, especially in vital economic sectors and activities. Moreover, improving and promoting credit bureaus and credit scoring adapted to SMEs will help mitigate risk and encourage banks to be more aggressive in lending to SMEs. Promoting financial packages using multiple arrangements such as credit guarantees, export guarantees and well structured loan installments could also be among the instruments that banks can introduce, that is in addition to promoting equity finance and venture capital that are still limited in the Egyptian market. Banks could also establish a link between leasing and traditional credit facilities. Establishing a registrar for movable assets is crucial to protect leasing activities and to reduce fraud. Adopting sharia-compliant instruments may also be a way to promote lending for some Egyptian entrepreneurs that refrain from borrowing at interest rates. Measures leading to better intermediation along with prudential regulations are expected to lead to greater efficiency, profitability and economic growth.
13 Pearce (2011). The number of bank branches in Egypt is 8 per 1000 adults and 4.5 per 1000 Km2.

14
References Abdel-Baki, M. 2010. Assessing the effectiveness of banking reforms endeavors on the
performance of Egyptian banks. International Research Journal of Finance and Economics, 41: 19-32.
Abd-kadir, H., Z. Selamat, and M. Idros. 2010. Productivity of Malaysian banks after mergers and acquisition. European Journal of Economics, Finance and Administrative Sciences, 24.
Alexandridis, G., P. Dimitris, and N. Travlos. 2010. Gains from M&As around the world: New evidence. Financial Management 39(4): 1671–95.
Allen, D., and V. Boobal-Batchelor. 2005. Enhancing efficiency gains and benefits to the public in the context of a developing economy: Evidence from Malaysia. Conference Proceeding Modeling and Simulation Society of Australia and New Zealand. http://www.mssanz.org.au/modsim05/papers/allen_2.pdf.
Antonio, A., G. (Jie) Michael, and P. Dimitris 2008. Merger momentum and market valuations: The UK evidence. Applied Financial Economics 18(17): 1411–23.
Badreldin, A., and C. Kalhoefer. 2009. The effect of mergers and acquisitions on bank performance in Egypt. German University in Cairo, Faculty of Management Technology Working Paper no.18. Egypt, Cairo: German University in Cairo.
Ben Naceur, S., and M. Kandil. 2009. The impact of capital requirements on banks’ cost of intermediation and performance: The case of Egypt. Journal of Economics and Business 61: 70–89.
Berger, A.N., and D. B. Humphrey. 1997. Efficiency of financial institutions: International survey and directions for future research. European Journal of Operations Research 98: 175–212.
Berger, A. N., and L. J. Mester. 1997. Inside the black box: What explains differences in the efficiencies of financial institutions? Journal of Banking and Finance 21: 895–947.
Berger, A. N., R. Demsetz, and P. Strahan. 1999. The consolidation of the financial services industry: Causes, consequences and implications for the future. Journal of Banking and Finance 23(2-4) (February): 135–94.
Berger, A. N., and T. H. Hannan. 1998. The efficiency cost of market power in the banking industry: A test of the quiet life and related hypotheses. Review of Economics and Statistics 80: 454–65.
Campa, J., and I. Hernando. 2005. M&As performance in the European financial industry. Banco de Espana Working Papers no. 0516.
Casu, B., and B. Molyneux. 2000. A comparative study of efficiency in European banking. University of Wales, UK, School of Accounting, Banking and Economics Working Paper No. #00-17.
Central Bank of Egypt (CBE). 2011. Annual Report 2010/11. Cairo, Egypt: The Central Bank of Egypt.
Coelli T., D.S. Prasada Rao, and G. E. Battese. 1998. An introduction to efficiency and productivity analysis. Kluwer Academic Publishers.
Daley, J. and K. Matthews. 2009. Measuring banking efficiency: Tradition or sophistication? A note. Cardiff University, Cardiff Business School Working Paper E2009/24.

15
Denizer, C. A., M. Dinc, and M. Tarimcilar. 2000. Measuring banking efficiency in the pre- and post- liberalization environment: evidence from the Turkish banking system. World Bank Working Paper no. 2476. Washington, D.C.: The World Bank.
Fauzias M. N., R. M. Said, and M. H. Yahya. 2006. Financial performance and efficiency changes of Malaysian banking institutions in mergers and acquisitions. Banks and Bank Systems 1(1).
Global Research-Egypt, Banking Sector Report (2008), Global Investment House.
Isik, I., and M. K. Hassan. 2002. Technical, scale and allocative efficiencies of Turkish banking industry. Journal of Banking and Finance 26:719–66.
Mautin, D. 2011. Bank consolidation and scale economies trend of banks in a developing country. Journal of Economic Theory 5(1): 15–21.
Nasr, S. 2009. Are banks in Egypt catalysts for economic development? Oxford Business and Economics Conference Proceedings.
Pasiouras, F., E. Sifodaskalatis, and C. Zopunidis. 2007. Estimating and analyzing the cost efficiency of Greek cooperative banks: An application of two-stage data envelopment analysis. University of Bath, School of Management Working Paper no. 12.
Poshakwale, S., and B. Qian. 2009. Competitiveness and efficiency of the banking sector and economic growth in Egypt. Paper prepared by the African Development Bank (ADB), in the workshop on Competitiveness of the Financial Services Sector in Africa, Johannesburg.
Pearce, D. 2011. Financial inclusion in the Middle East and North Africa: Analysis and roadmap recommendations. World Bank Policy Research Working Paper 5610. Washington, D.
Rao, A. 2002. Estimation of efficiency, scale and scope and productivity measures of U.A.E. banks. Proceedings of the European Conference of Financial Management Association International, June 6, Copenhagen, Denmark, 1–44.
Rasmala. 2010. Egyptian Banks Initiation of Coverage. http://www.rasmala.com.
Reda, M., and I. Isik. 2006. Efficiency and productivity change of Egyptian commercial banks (1995-2003). Economic Research Forum 13th Annual Conference Proceedings.
Sufian, F., M. Z. Abdul Majid, and R. Haron . 2007. Efficiency and bank merger in Singapore: a joint estimation of non-parametric, parametric and financial ratios analysis. Munich Personal RePEc Archive (MPRA) Working Paper, no. 12129, University Library of Munich, Germany, revised 01 Oct 2007.
Sufian, F., and M. Sh. Habibullah. 2009. Asian financial crisis and the evolution of Korean banks efficiency: A DEA approach. Global Economic Review, Taylor and Francis Journals 38(4): 335–69.
Thanassoulis, E. 1999. Introduction to the theory and application of data envelopment analysis. Kluwer Academic Publishers.
Yildirim, S. H., and G. Philippatos. 2007. Efficiency of banks: Recent evidence from the transition economies of Europe, 1993-2000. European Journal of Finance, Taylor and Francis Journals, 13(2):123–43.

16
Figure 1: Key Banking Sector Indicators (deposits and loans over time)
Source: Central Bank of Egypt Data, Annual Reports and website data: http://www.cbe.org.eg
Figure 2: Deposits by Sector in 2000 and 2010
Source: Author’s calculations using CBE data.
226,776
465,990
260,429
892,492 87%
78%
64%57% 52%
0%
10%
20%
30%
40%
50%
60%
70%
80%
90%
100%
-
100,000
200,000
300,000
400,000
500,000
600,000
700,000
800,000
900,000
1,000,000
2000 2001 2002 2003 2004 2005 2006 2007 2008 2009 2010
L.E Million
Lending In LE million Deposits in LE million Lending to Deposits ratio
Governnent
sector15% Public
business
sector6%
Private busine
ss sector 17%
Houshold
sector62%
0.5%
Deposits by Sector in 2000
Governnent sector
12%Public
business sector
4%
Private business
sector 19%
Houshold sector64%
Foreign sector
1%
Deposits by Sector in 2010

17
Figure 3: Lending and Discount Balances by Sector in 2000 and 2010
Source: Author’s calculations using CBE data.
Figure 4: Lending by Economic Activity
Source: Author’s calculations using CBE data.
Governnent sector
6%
Public business
sector14%
Private business
sector 66%
Houshold sector13%
Foreign sector
1%
Lending and Discount Balances by Sector in 2000
Governnent sector
8%
Public business
sector6%
Private business
sector 62%
Houshold sector20%
Foreign sector
4%
Lending and Discount Balances by Sector in 2010
Agriculture, 2%
Industry, 34%
Trade, 23%
Services, 27%
Unclassified sectors,
14%
Lending by Economic Activity in 2000
Agriculture Industry
Trade Services
Unclassified sectors
Agriculture, 1%
Industry, 37%
Trade, 14%
Services, 23%
Unclassified sectors,
24%
Lending by Economic Activity in 2010

18
Figure 5: Credit Facility by Beneficiary (2010)
Source: CBE, Annual Report 2009/10. Figure 6: Technical and Scale Efficiency Scores on a Bank-by-Bank Basis Pre and Post Mergers and Acquisitions
Notes: * Number of banks before M&As = 24 and number of banks after M&As= 16. The number of banks decreased due to mergers and acquisitions. A detailed table in appendix includes all mergers and acquisitions that occurred. Source: Author’s calculations.
Consumer-purpose loans, real estate loans for personal
housing, 11.1%
Lending to businesses,
85.4%
Loans to small-sized economic activities,
3.5%
Banks' Contingent Liabilities and Loans in 2010
0
0.2
0.4
0.6
0.8
1
1.2
0
0.2
0.4
0.6
0.8
1
1.2
0 5 10 15 20 25 30
Technical efficiency
TE pre M&A TE post M&A
0
0.2
0.4
0.6
0.8
1
1.2
0
0.2
0.4
0.6
0.8
1
1.2
0 5 10 15 20 25 30
Sca le efficiency
SE pre M&A SE post M&A
Score Score

19
Table 1: The Structure of the Egyptian Banking Sector
End of June
Commercial state-owned
banks
Commercial private & joint venture banks
Total commercial
banks Off-shore banks Specialized
banks Total number
of banks
2000 4 35 39 20 3 62 2001 4 35 39 20 3 62 2002 4 35 39 20 3 62 2003 4 35 39 20 3 62 2004 4 35 39 19 3 61 2005 4 34 38 18 3 59 2006 4 29 33 7 3 43 2007 3 28 31 7 3 41 2008 3 27 30 7 3 40 2009 2 27 30 7 3 39 2010 2 27 30 7 3 39 2011 2 27 30 7 3 39
Source: Central Bank of Egypt Annual Reports, various issues.
Table 2: DEA Inputs and Outputs Inputs Outputs - Operating expenses - Net interest income - Interest expenses - Non-interest income* - Total amount of loans and advances Notes: * Non-interest income includes fees and commissions, foreign exchange gains, stock dividends and investment sales gains
Table 3: DEA Results
Pre M&A (2000-2003) Post M&A (2007-2010)
ME PTE SE ME PTE SE Grand frontier average score 0.599 0.709 0.765 0.817 0.916 0.897 Yearly frontier average score 0.624 0.756 0.776 0.699 0.770 0.897 Number of observations 24 16
Source: Author’s calculations.
Table 4: Testing the Significance of Results Pre and Post M&As
Individual tests Test group
Parametric test Non-parametric test t-test Wilcoxon signed-rank test
Hypotheses Median pre merger=Median post merger
Test statistics t(Prb>t) z(Prb>z) Mean t sum ranks z
Managerial efficiency (ME) Pre M&As 0.599 -2.019** 27 -1.880** Post M&As 0.817 99 Pure technical efficiency (PTE) Pre M& As 0.709 -1.938 23 -1.293 Post M& As 0.916 68 Scale efficiency (SE) Pre M&As 0.765 -1.939** 26 -1.933** Post M&As 0.897 100
Source: Author’s calculations.

20
Table 5: Managerial Efficiency - Control Group versus Banks Subject to M&As Pre M&As (2000 to 2003) Post M&As (2007 to 2010) ME PTE SE ME PTE SE
Average control group 0.59 0.74 0.74 0.70 0.76 0.91 Min. 0.20 0.33 0.52 0.22 0.24 0.85 Max. 0.98 1.00 0.98 1.00 1.00 1.00 Average others** 0.65 0.77 0.79 0.79 0.85 0.91 Min. 0.12 0.20 0.45 0.57 0.62 0.77 Max. 0.99 1.00 0.99 1.00 1.00 1.00
Notes: Control group of 7 banks; others include 15 banks pre M&As and 12 banks post M&As. ** By others we mean all banks that were subject to mergers and acquisitions. Source: Author’s calculations. Table 6: Returns to scale in the Egyptian Banking Sector Pre and Post M&As
Pre M&As (%) Post M&As (%) Increasing returns to scale (IRS) 37 17 Constant returns to scale (CRS) 33 42 Decreasing returns to scale (DRS) 30 41 All banks 100 100
Source: Author’s calculations
Table 7: Financial Results Pre and Post M&As Based on Accounting Data Control group Banks subject to M&As Overall averages
Pre M&As (2000-2003)
Post M&As (2007-2010) t-test
Pre M&As (2000-2003)
Post M&As (2007-2010) t-test
Pre M&As (2000-2003)
Post M&As (2007-2010) t-test
Profitability Return on equity (ROE) 4.9 5.69 1.7** 6.8 4.38 1.8** 5.85 5.035 -2.4*** Return on assets (ROA) 1 1 0.01 2 1.5 1.7** 1.5 1.25 -2.2** Net interest margin (NIM) 2.03 3 2.4*** 2 2.68 2.1* 2.015 2.84 3.2*** Cost to income ratio 51.3 47.32 -0.6 55.52 60.19 0.2 53.41 53.755 0.11 Liquidity Net loans/total assets 37.8 34 -1.2 49.5 38.34 -2.6*** 43.65 36.17 -2.7** Net loans/total deposits 41.6 40 -0.2 53.2 43.81 -1.6** 47.4 41.905 -1.3* Loans/deposits 0.58 0.42 -4.3*** 0.7 0.47 -6.1*** 0.64 0.445 -7.4*** Risk Total capital ratio 10.02 21.63 N/A 12.55 17.28 N/A 11.285 19.455 N/A Loan loss res/gross loans 13.1 9.21 -1.9** 20.1 11.8 -1.8** 16.6 10.505 -2.3*** Provisions as % of loans 12 % 11% 0.08 9 % 8 % -0.5 11% 10 % -0.08
Source: Author’s calculations.

21
Appendix A
Figure A1. Deposits by Sector (2000 to 2010)
Source: Central Bank of Egypt annual reports (various issues).
Figure A2: Lending and Discount Balances by Sector (2000 to 2010)
Source: Central Bank of Egypt annual reports (various issues).
Figure A3: Lending by Economic Activity (2000 to 2010)
Source: Central Bank of Egypt annual reports (various issues).
0
20
40
60
80
100
120
2000 2001 2002 2003 2004 2005 2006 2007 2008 2009 2010
Foreign sector Household sector Private business sector Public business sector Government sector%
0
10
20
30
40
50
60
70
80
90
100
2000 2001 2002 2003 2004 2005 2006 2007 2008 2009 2010
Government sector Public business sectorPrivate business sector Household sector
0%
20%
40%
60%
80%
100%
120%
2000 2001 2002 2003 2004 2005 2006 2007 2008 2009 2010
Unclassified sectors Services Trade Industry Agriculture

22
Table A1: Key Banking Mergers and Acquisitions
(A) Mergers
First bank Second bank New entity Date (Yr-month)
American Express Bank (Branches in Egypt) Egyptian American Bank Egyptian American Bank 2004-Sep Misr Exterior Bank Banque Misr Banque Misr 2004-Sep Credit Lyonnais Branch Credit Agricole Indosuez Calyon 2005-Mar Misr America International Bank Arab African International Bank Arab African International Bank 2005-Sep Mohandes Bank National Bank of Egypt National Bank of Egypt 2005-Oct Bank of Commerce and Development National Bank of Egypt National Bank of Egypt 2005-Dec Nile Bank with Islamic International Bank for Investment and Development United Bank of Egypt United Bank of Egypt 2006-Jun Egyptian American Bank Calyon Credit Agricole Egypt 2006-Sep Misr International Bank National Societe Generale Bank National Societe Generale Bank 2006-Nov Banque du Caire Banque Misr Banque Misr 2007-Feb
(B) Acquisitions Acquired bank Acquirer Acquisition date (Yr-month) Misr America International Bank Arab African International 2005-May Egyptian Commercial Bank* Piraeus 2005-Jun Suez Canal Bank Arab International Bank 2005-Aug Misr International Bank NSGB 2005-Sep Misr Romania ** BLOM Bank 2005-Dec Egyptian American Bank Credit Agricole 2006-Feb CIB A consortium led by Ripplewood Holdings 2006-Feb Cairo Far East Audi Bank 2006-Mar Misr Iran Development Bank National Investment Bank 2006-Apr Delta International Bank A consortium led by Ahli United Bank 2006-Aug Alexandria Commercial Maritime Union National Bank 2006-Aug Bank of Alexandria San Paolo 2006-Dec National Development Bank Abu Dabi Islamic Bank 2007-Jul Al Watany Bank of Egypt A consortium led by National Bank of Kuwait 2007-Dec
Notes: * In June 2005, Piraeus acquired around 69 percent of the Egyptian Commercial Bank, bringing its total stake to 88.0 percent. ** In December 2005, Blom Bank acquired around 84 percent of Misr Romania Bank, in which it originally owned 12.5 percent, bringing its total stake to 96.7 percent. Later on, it raised its stake to 99.4 percent. Source: Global Research-Egypt, Banking Sector Report (2008), Global Investment House.

23
Appendix B
Basic DEA Models DEA begins with a relatively simple fractional programming formulation. Assume that there are (n) DMUs to be evaluated. Each consumes different amounts of inputs i and produces different outputs r, i.e. DMUj consumes xij amounts of input to produce yrj amounts of output. It is assumed that these inputs, xij and outputs, yrj, are non-negative, and each DMU has at least one positive input and output value. The productivity of a DMU can be written as:
m
iiji
s
rrjr
j
xv
yuh
1
1 (1)
Where h refers to the efficiency, j is the DMU under study, xij the amounts of input consumed by DMUj to produce yrj amounts of output. U and V weights assigned to each input and output.
In this formulation, u and v are the weights assigned to each input and output. By using mathematical programming techniques, DEA optimally assigns the weights subject to two constraints respectively: The weights for each DMU are assigned subject to the constraint that no other DMU has an efficiency greater than 1 if it uses the same weights, implying that efficient DMUs will have a ratio value of 1.
The derived weights, u and v are not negative. The objective function of DMUK is the ratio of the total weighted output divided by the total weighted input:
Maximize
m
iiki
s
rrkr
k
xv
yuh
1
1 (2)
Subject to 1
1
1
m
iiji
s
rrjr
xv
yu for j=1..n
0iv for i =1…m, and 0ru for r =1…s
This is a simple presentation of basic DEA model. According to Denizer, et al. (2000), Charnes, Cooper and Rhodes (1978) employed the optimization method of mathematical programming to generalize the Farrel (1957) single-output/input technical-efficiency measure to multiple-output/multiple-input case. The characteristic of the Charnes, Cooper and Rhodes (CCR) ratio model is the reduction of the multiple-output/multiple-input situation for each DMU to a single virtual output and a single virtual input ratio. This ratio provides a measure of efficiency for a given DMU, which is a function of multipliers. The objective is to find the largest sum of weighted outputs of DMUk, while keeping the sum of its weighted inputs at the unit value, thereby forcing the ratio of the weighted output to the weighted input for any DMU to be less than one. The CCR model is also known as the constant return to scale model, and it identifies inefficient units regardless of their scale size. In the CCR models, both technical and scale inefficiency are present.
Banker, Charnes and Cooper (1984) take into account the effect of returns to scale within the group of DMUs to be analyzed. The purpose here is to point out the most efficient scale size

24
for each DMU and at the same time to identify its technical efficiency. To do so, the Banker, Charnes and Cooper (BCC) model introduces another restriction, convexity, to the envelopment requirements. This model requires that the reference point on the production function for DMUk will be a convex combination of the observed efficient DMUs. The BCC model, known as variable returns to scale model, gives the technical efficiency of DMUs under investigation without any scale effect. It is possible to use models that provide input-oriented or output-oriented projections for both CCR (constant returns to scale) and BCC (variable returns to scale) envelopment. An input-oriented model attempts to maximize the proportional decrease in input variables while remaining within the envelopment space. On the other hand, an output-oriented model maximizes the proportional increase in the output variables, while remaining within the envelopment space. Scale Issue Although commercial banks are homogeneous with respect to their organizational structure and objectives, they vary significantly in size and production level. Even after normalizing the data, this suggests that the scale of banks plays an important role in their relative efficiency or inefficiency. As previously stated, the CCR model comprehends both technical and scale efficiency. The BCC model, introduced by Banker, Charnes and Cooper (1984), separates technical efficiency and scale efficiency. BCC also modified the original CCR linear programming formulation by adding a convexity constraint for the production possibility set to estimate not only technical efficiency, but also returns to scale. Banker, Charnes and Cooper (1984) showed that the CCR measure captures not only the productive inefficiency of a DMU at its actual scale size, but also any inefficiency resulting from its actual scale size being different from the most productive scale size. A most productive scale size maximizes average productivity in the long run. In order to maximize average productivity, a DMU would have to increase its scale size if increasing returns to scale were prevailing, and decrease the scale size if decreasing returns to scale were prevailing. It follows that a technically efficient and scale efficient DMU will be in the most productive scale size. Given that the CCR efficiency score is a product of technical and scale efficiency, and BCC measures pure technical efficiency, then the ratio of the efficiency scores
BCCqCCRqS
k
kk ,
, (3)
Yields a measure of the relative scale efficiency of bank k. If S=1 it is said that bank k is operating at the most efficient scale size. If it is less than unity, this means there is scale inefficiency for bank k. Thus, (1-S) represents the relative scale inefficiency of a bank (Banker et al. 1984). The units that are CCR efficient will also be scale efficient, since scale was already factored in the CCR model. Thus, the two are equal. The units that are BCC efficient, but inefficient based on the CCR model, have a scale inefficiency. Since they were technically efficient, all of the inefficiencies picked by CCR are due to scale. Those units that are CCR efficient are considered most productive scale sizes, as the average productivity of each of those units is maximized. This can serve as a useful diagnostic tool for decision makers and bank directors. Once technical and scale efficiencies are isolated, the next step is to determine the share of the overall inefficiency that is attributable to technical inefficiency and scale inefficiency.


