The effect of MFC on the pressability and paper properties of TMP and GCC based sheets Collin Hii, Øyvind W. Gregersen, Gary Chinga-Carrasco, Øyvind Eriksen KEYWORDS: MFC, microfibrillated cellulose, Field Emission SEM, Air resistance, Tensile index, Z- directional strength, Gurley, Pressability, Fines, Drainage, Wet pressing SUMMARY: Different qualities of microfibrillated cellulose (MFC) were blended with thermomechanical pulp (TMP) and ground calcium carbonate (GCC) filler. The addition of MFC reduced the drainage of the pulp suspension but improved strength properties. Wet pressing experiments showed that optimal use of MFC and filler could enhance the strength and optical properties without reducing the solids content after wet pressing. Field-emission scanning electron microscopy (FESEM) revealed that MFC adsorbed onto and contributed to the bonding of the filler particles and fibres. The MFC binds the filler-MFC-fines aggregates to the fibre network and partially filled the pore network. As a result, MFC addition increased the air resistance and internal bonding of the sheet. ADDRESSES OF THE AUTHORS: Collin Hii ([email protected]) Øyvind W. Gregersen ([email protected]) Norwegian University of Science and Technology, NTNU, Trondheim, Norway Gary Chinga-Carrasco ([email protected]) Øyvind Eriksen ([email protected]) Paper and Fibre Research Institute, PFI, NO-7491 Trondheim, Norway Corresponding author: Collin Hii The drive to reduce production cost and increasing the opacity, brightness and surface smoothness has encouraged the use of fillers in papermaking. However, fillers reduce fibre bonding and paper’s strength properties. Addition of fillers to pulp slurry without retention aid increases the filtration resistance of the slurry by plugging of the fibre cake (Springer, Kuchibhotla 1992; Hubbe, Heitmann 1997). The optimal use of retention aid has enabled high filler retention and even filler distribution in the sheet thickness direction (Tanaka et al. 1982). Filler addition has improved dewatering in the wet end (Liimatainen et al 2006). Filler usage also improves optical properties, but reduces strength properties (Mohlin, Ölander 1986; Hjelt et al. 2008). Fillers that agglomerate to clusters could resist pressure during wet pressing and maintain the bulk of the sheet (Hjelt et al. 2008). However, filler particles may also form strong agglomerates between fibres and hence prevent fibre-fibre bonds (Hjelt et al. 2008). Addition of kraft pulp fines counteracts negative effects of fillers on strength properties but affects the drainage of the pulp (Sandgren, Wahren 1960a, 1960b; Htun, Ruvo 1978; Seth 2003; Lin et al. 2007). Fines are inhomogeneous complex particles that passes through a 200 mesh (76 μm) wire in the solid-liquid separation method as stated in TAPPI T261 cm-00. Kraft pulp fines possess high degree of swelling and thus enable the fines to bind well to the fibre structure (Htun, Ruvo 1978). Pre- mixing fillers with fines in a controlled fashion, prior to its addition to the pulp furnish, improves strength and optical properties of the sheet (Lin et al. 2007). Microfibrillated cellulose In recent years, studies have shown that microfibrillated cellulose (MFC) can be used as strength enhancer (Iwamoto et al. 2007; Eriksen et al. 2008; Ahola et al. 2008; Subramaniam 2008; Mörseburg, Chinga-Carrasco 2009; Zimmermann et al. 2010; Taipale et al. 2010). Eriksen et al. (2008) found significant tensile index increase at 4% addition of MFC to TMP handsheets independent of the production method. Mörseburg, Chinga-Carrasco (2009) added MFC to clay loaded layered TMP sheets and found that the strength properties improved. Addition of MFC also increased the air resistance (Eriksen et al. 2008; Subramaniam 2008). Taipela et al. (2010) found that the optimal level of MFC addition would maintain or improve strength properties without impeding dewatering. Synergy effects of MFC– filler interactions can counteract the reduction in strength properties from filler addition while improving light scattering (Mörseburg, Chinga-Carrasco 2009). MFC has been prepared by mechanically disintegrating cellulose fibres through homogenization (Turbak et al. 1983; Herrick et al. 1983; Pääkkö et al. 2007; Syverud et al. 2011), grinding (Iwamoto et al. 2005; Iwamoto et al. 2007; Eriksen et al. 2008; Abe, Yano 2009), fluidization (Taipale et al. 2010) and combined homogenizer treat- ment and grinding processes (Iwamoto et al. 2005). Others have pre-treated the fibres chemically before a mechanical disintegration (Saito et al. 2006, 2007; Pääkkö et al. 2007; Henriksson, Berglund 2007; Wågberg et al. 2008; Syverud et al. 2011). MFC produced from mechanical disintegration is heterogeneous in size and forms entangled and disordered networks. Mechanically produced MFC, without pre- treatment, is commonly composed of micro- and nano- structural components, e.g. poorly fibrillated fibres, fines and nanofibrils (Chinga-Carrasco, 2011). The nanofibrils have diameters less than 100 nanometres and lengths in the micrometre scale. Increasing the number of passes in the homogenization and fluidization processes produces more nanofibrils. MFC may thus be considered a subset of kraft pulp fines. Taipale et al. (2010) found that increa- sing the number of passes in a fluidization process pro- duced MFC with more nano-sized fibrils. Enzymatic pre- treatment reduces the fibrils diameter down to below 20 nm range (Pääkkö et al. 2007). MFC produced with TEMPO-mediated oxidation as pre-treatment has exhi- bited more homogeneous nanofibril diameters (< 10 nm) PAPER PHYSICS 388 Nordic Pulp and Paper Research Journal Vol 27 no.2/2012
Transcript
The effect of MFC on the pressability and paper properties of TMP and GCC based sheets Collin Hii, Øyvind W. Gregersen, Gary Chinga-Carrasco, Øyvind Eriksen
Sprague 1987; Szikla, Paulapuro 1989b; Burns et al.
1992). The exit layer densification is caused by the shear
force from liquid flow (Chang 1978; Macgregor 1989,
2001; Szikla 1992). The densification of the exit layer
will increase the hydraulic pressure in the web and results
in a more flow controlled nip.
MFC has a strong water retention property and a high
specific surface area. (Herrick et al. 1983; Pääkkö et al.
2007). As a result, MFC addition into a given pulp will
reduce dewatering by increasing the hydraulic pressure,
Ph. Taipale et al. (2010) found that optimum selection of
MFC and kraft pulp components and process conditions
can enhance the strength properties without negative
effects on drainage.
There is a lack of published results on the effects of
MFC on the pressability of ground calcium carbonate
(GCC) filled TMP sheets. Hence, the purposes of this
study are:
1. Determine the optimal MFC addition in 30% filler
loaded TMP sheets to yield similar or better pressability
as compared to TMP samples with 15% filler content.
2. Determine the effects of MFC and high filler loading,
up to 30%, on paper properties.
Materials and Methods Production of microfibrillated cellulose
Never-dried Pinus radiata kraft pulp was used to produce
the MFC. The pulp fibres were homogenized with a
Rannie 15 type 12.56x homogenizer operated at 1000 bar
pressure drop. The pulp consistency during homogeni-
zation was kept at 0.5% to avoid plugging problems
PAPER PHYSICS
Nordic Pulp and Paper Research Journal Vol 27 no.2/2012 389
Table 1. Standards for the tests carried out in the experiment..
Test methods Standards
Closed water sheet making ISO 5269-1:2005 Sample conditioning ISO 187:1900 Laboratory wet disintegration ISO 5263:1995 Determination of dry matter ISO 638:1978 Determination of stock consistency ISO 4119:1995 Freeness ISO 5267-2:2001 Grammage ISO 536:1995 Thickness and apparent density ISO 534:1998 Ash content 525°C ISO 1762:2001 Air permeance (Gurley) ISO 5636-5:2003 Tensile strength-constant elongation ISO 1924-2:1994 Z-strength T541 om-99 Light scattering ISO 9416:1998
Table 2. TMP freeness (ml), pulp coarseness (μg/m) and WRV(g/g). The values are reported as average ±1 standard deviation.
Table 4. Dewatering data for the different sample series. The maximum pressure is set at 3.5 MPa. The values are reported as average±1 standard deviation. The labels for the different furnish mixes are explained in Table 3.
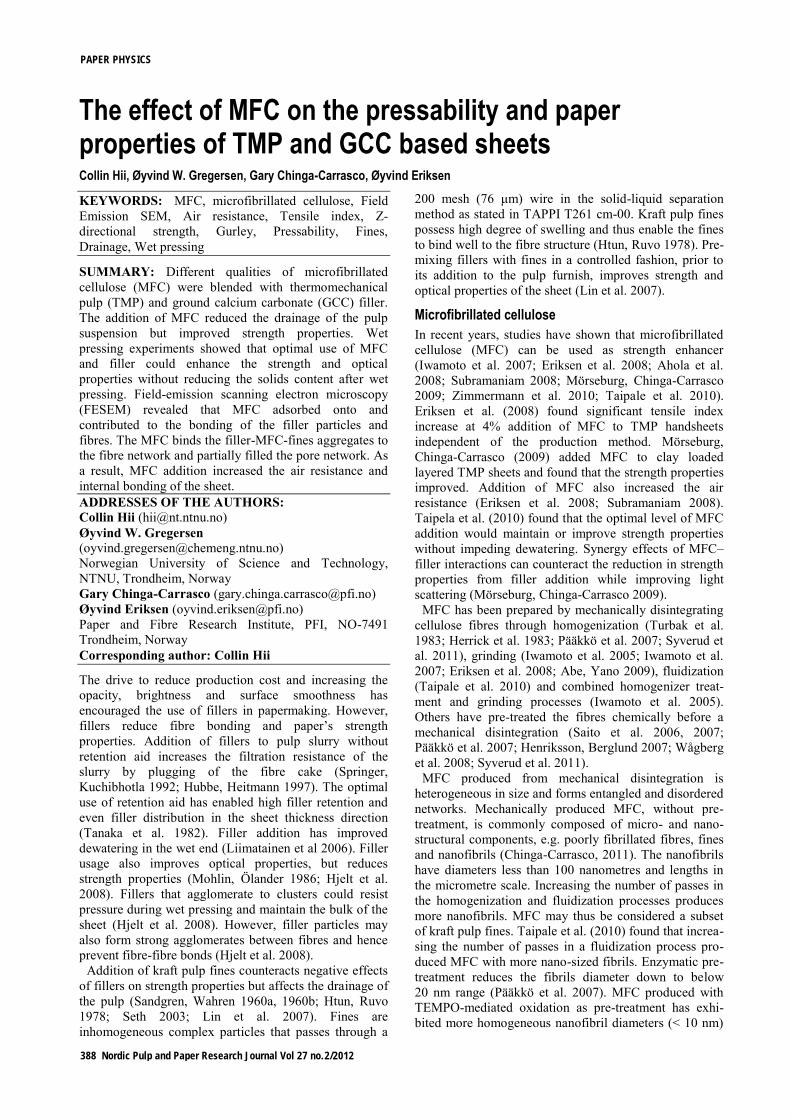
Fig 1. The FiberXpress used to make 60 g/m2 samples.
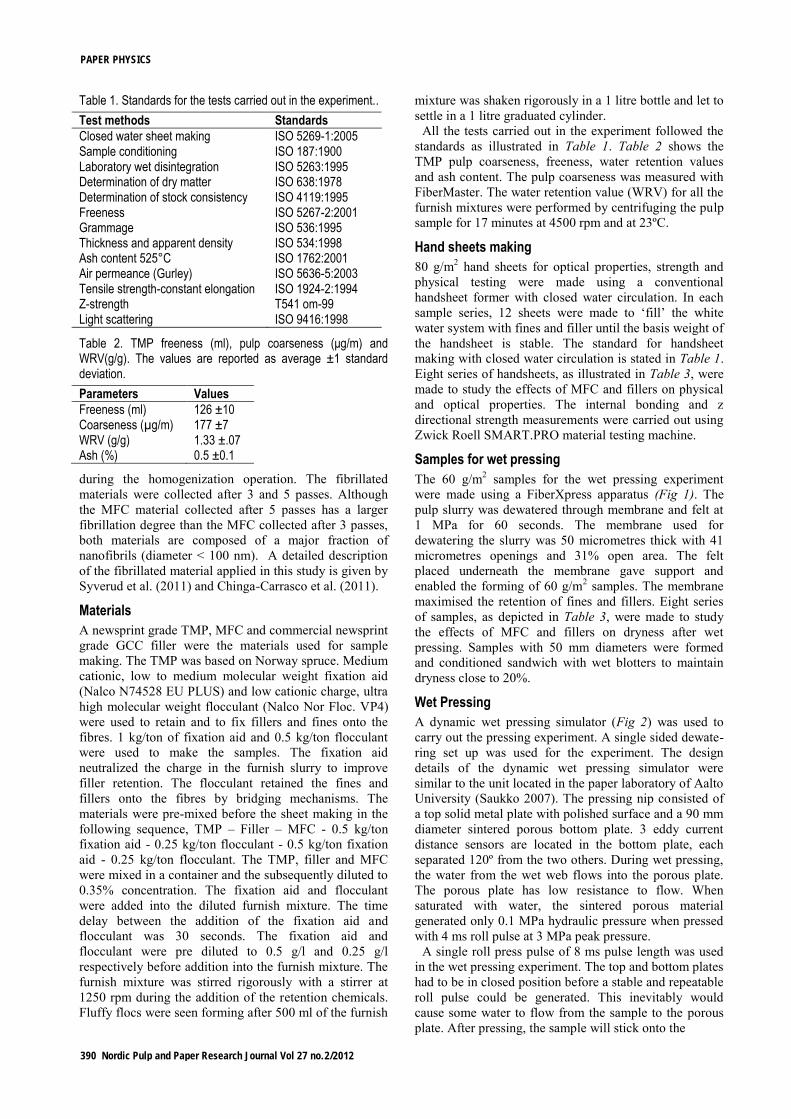
Fig 3. Average solids content (%) after wet pressing vs. pressure (MPa) during wet pressing for 15% filler and 85% TMP mixture pressed at 25ºC and 50ºC. The error bars are 1 standard deviation.
smooth polished surface of the top plate as the nip opened
thus minimising rewetting. 20 ms after the nip opened, a
vacuum was generated in the bottom plate to clean and
dry the porous plate.
To determine the pressure set point where the nip was
reasonably flow controlled for wet pressing samples at
50ºC, F15T85 samples were wet pressed with 5 different
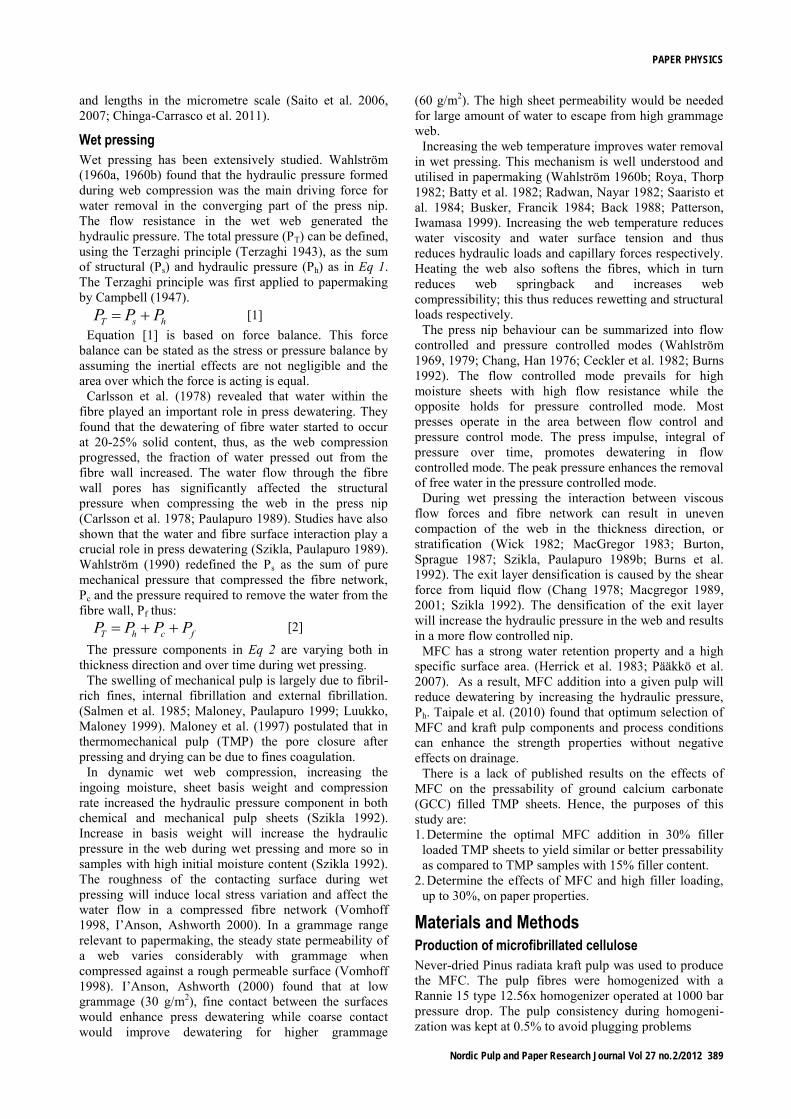
Fig 2. The dynamic wet pressing simulator for the wet pressing experiments. (A) Pressing cones with internal heating element (B) Bottom plate (C) Top plate (D) Distance sensor.
peak pressures at 25ºC. The solids content versus
pressure response curve was constructed (Fig 3). The
pressure at 25ºC when the maximum solids content first
occurred was used as set point for wet pressing the other
sample series at 50ºC. The wet pressing at 50ºC was done
by heating the top and bottom plates to 50ºC with heating
elements attached inside the pressing cones.
At around 3.5 MPa the solids content flattened out
(Fig 3). The maximum pressure represents the setting
with the maximum fraction of flow control until some
type of sheet crushing problem is encountered (crush
point). Fig 3 shows that the pressing pressure to achieve
maximum solids content for F15T85 sample wet pressed
at 25ºC is at around 3.5 MPa. Thus 3.5 MPa was used as
pressure set point for pressing samples at 50ºC. As
expected, wet pressing with 3.5 MPa at 50ºC yields
higher solids content, 36%, as compared to the 33.5% at
25ºC.
29
30
31
32
33
34
35
36
37
38
1 2 3 4 5 6
Pressure (MPa)
So
lid
s c
on
ten
t (%
)
average 25 ºC average 50 ºC
A
A
B
C
D
Controlled press pulse
PAPER PHYSICS
Nordic Pulp and Paper Research Journal Vol 27 no.2/2012 391
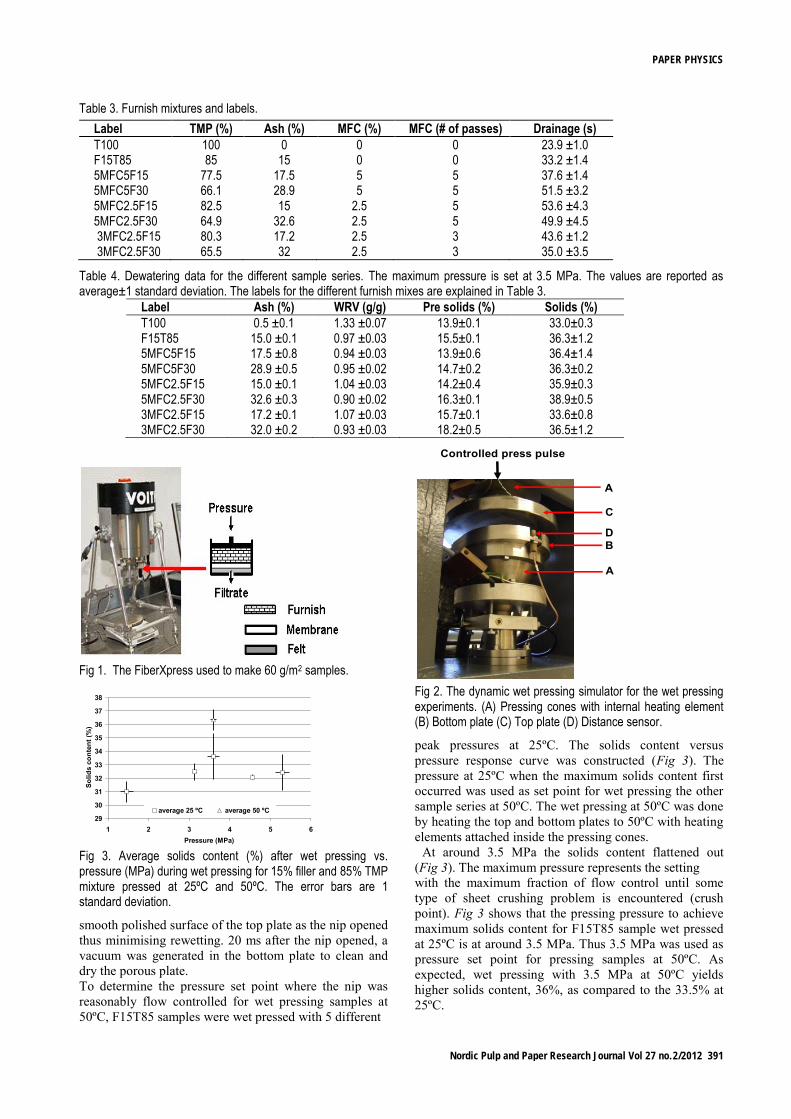
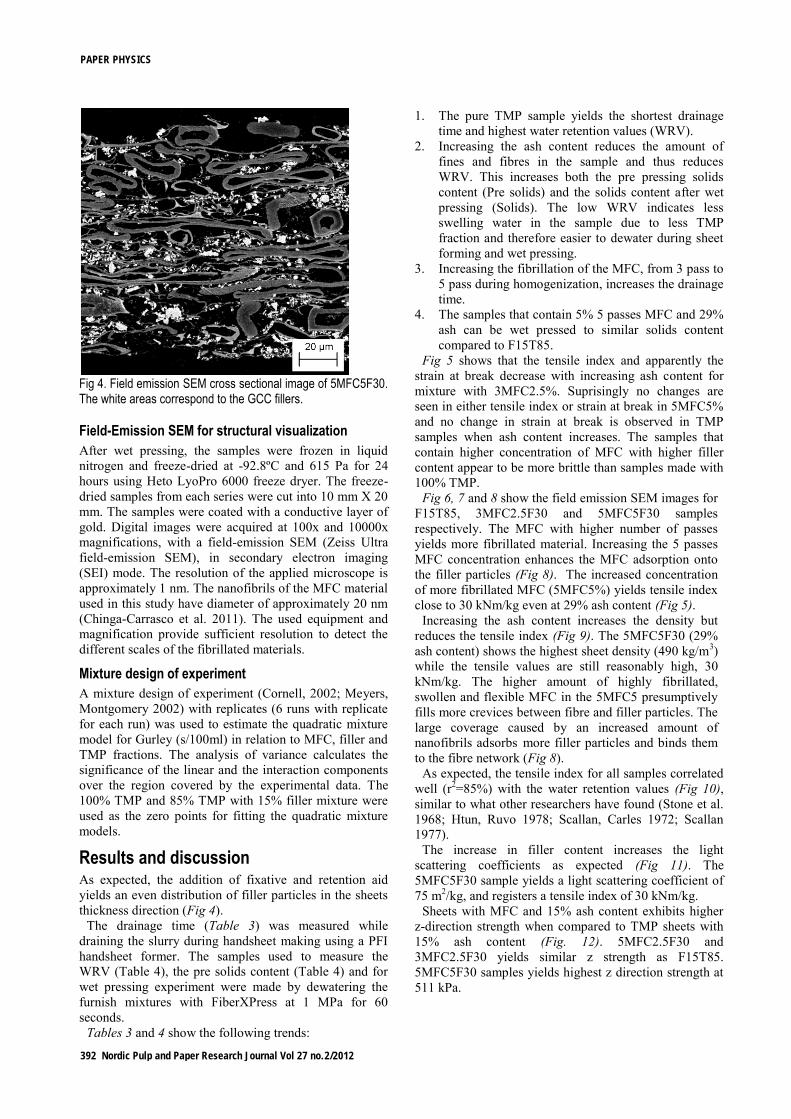
Fig 4. Field emission SEM cross sectional image of 5MFC5F30. The white areas correspond to the GCC fillers.
Field-Emission SEM for structural visualization
After wet pressing, the samples were frozen in liquid
nitrogen and freeze-dried at -92.8ºC and 615 Pa for 24
hours using Heto LyoPro 6000 freeze dryer. The freeze-
dried samples from each series were cut into 10 mm X 20
mm. The samples were coated with a conductive layer of
gold. Digital images were acquired at 100x and 10000x
magnifications, with a field-emission SEM (Zeiss Ultra
field-emission SEM), in secondary electron imaging
(SEI) mode. The resolution of the applied microscope is
approximately 1 nm. The nanofibrils of the MFC material
used in this study have diameter of approximately 20 nm
(Chinga-Carrasco et al. 2011). The used equipment and
magnification provide sufficient resolution to detect the
different scales of the fibrillated materials.
Mixture design of experiment
A mixture design of experiment (Cornell, 2002; Meyers,
Montgomery 2002) with replicates (6 runs with replicate
for each run) was used to estimate the quadratic mixture
model for Gurley (s/100ml) in relation to MFC, filler and
TMP fractions. The analysis of variance calculates the
significance of the linear and the interaction components
over the region covered by the experimental data. The
100% TMP and 85% TMP with 15% filler mixture were
used as the zero points for fitting the quadratic mixture
models.
Results and discussion As expected, the addition of fixative and retention aid
yields an even distribution of filler particles in the sheets
thickness direction (Fig 4).
The drainage time (Table 3) was measured while
draining the slurry during handsheet making using a PFI
handsheet former. The samples used to measure the
WRV (Table 4), the pre solids content (Table 4) and for
wet pressing experiment were made by dewatering the
furnish mixtures with FiberXPress at 1 MPa for 60
seconds.
Tables 3 and 4 show the following trends:
1. The pure TMP sample yields the shortest drainage
time and highest water retention values (WRV).
2. Increasing the ash content reduces the amount of
fines and fibres in the sample and thus reduces
WRV. This increases both the pre pressing solids
content (Pre solids) and the solids content after wet
pressing (Solids). The low WRV indicates less
swelling water in the sample due to less TMP
fraction and therefore easier to dewater during sheet
forming and wet pressing.
3. Increasing the fibrillation of the MFC, from 3 pass to
5 pass during homogenization, increases the drainage
time.
4. The samples that contain 5% 5 passes MFC and 29%
ash can be wet pressed to similar solids content
compared to F15T85.
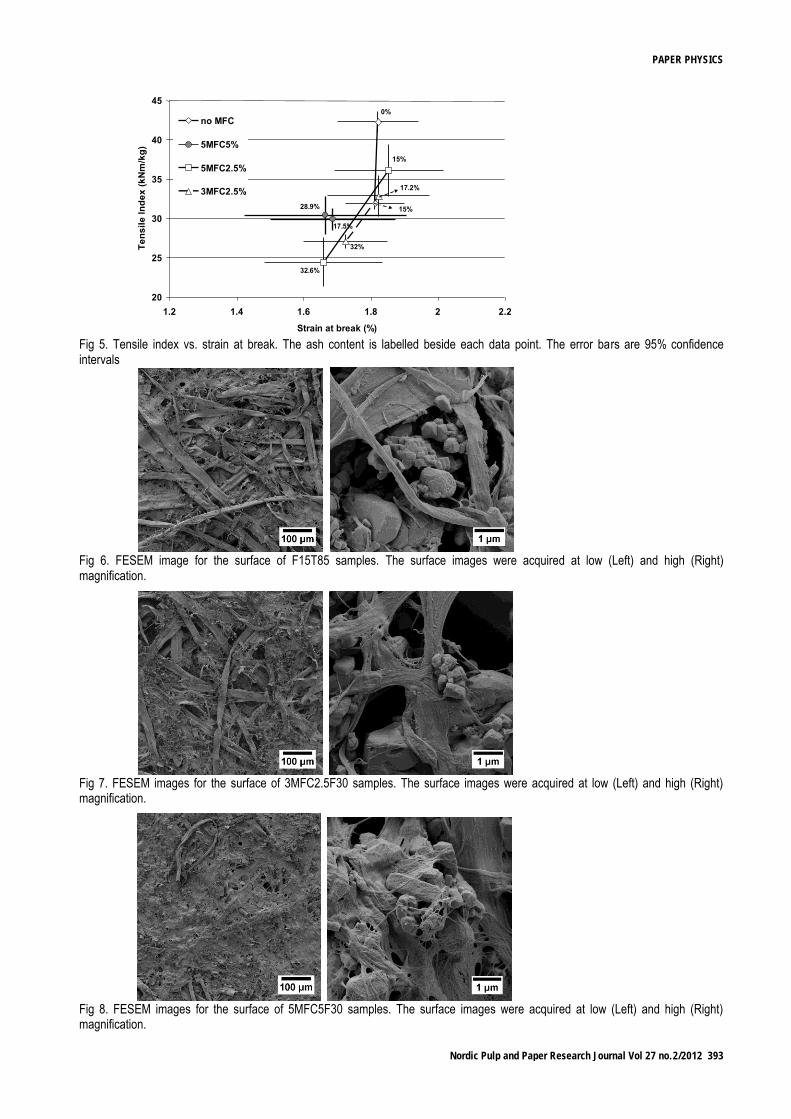
Fig 5 shows that the tensile index and apparently the
strain at break decrease with increasing ash content for
mixture with 3MFC2.5%. Suprisingly no changes are
seen in either tensile index or strain at break in 5MFC5%
and no change in strain at break is observed in TMP
samples when ash content increases. The samples that
contain higher concentration of MFC with higher filler
content appear to be more brittle than samples made with
100% TMP.
Fig 6, 7 and 8 show the field emission SEM images for
F15T85, 3MFC2.5F30 and 5MFC5F30 samples
respectively. The MFC with higher number of passes
yields more fibrillated material. Increasing the 5 passes
MFC concentration enhances the MFC adsorption onto
the filler particles (Fig 8). The increased concentration
of more fibrillated MFC (5MFC5%) yields tensile index
close to 30 kNm/kg even at 29% ash content (Fig 5).
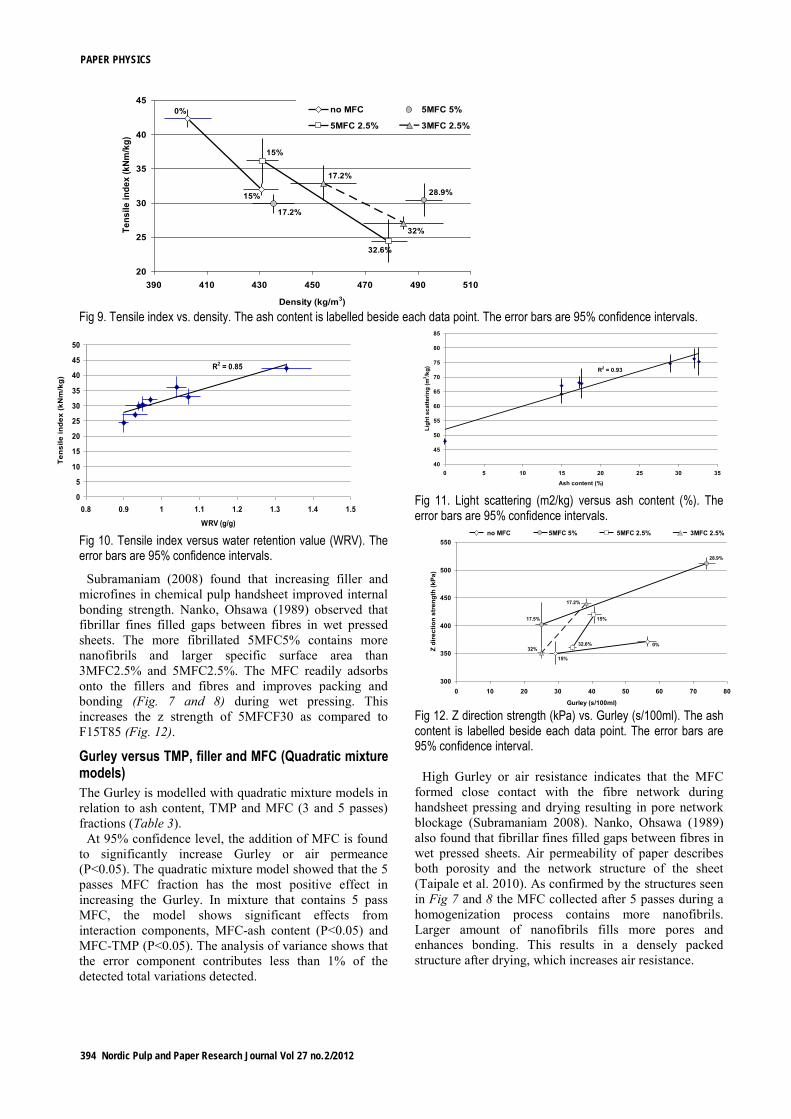
Increasing the ash content increases the density but
reduces the tensile index (Fig 9). The 5MFC5F30 (29%
ash content) shows the highest sheet density (490 kg/m3)
while the tensile values are still reasonably high, 30
kNm/kg. The higher amount of highly fibrillated,
swollen and flexible MFC in the 5MFC5 presumptively
fills more crevices between fibre and filler particles. The
large coverage caused by an increased amount of
nanofibrils adsorbs more filler particles and binds them
to the fibre network (Fig 8).
As expected, the tensile index for all samples correlated
well (r2=85%) with the water retention values (Fig 10),
similar to what other researchers have found (Stone et al.
The increase in filler content increases the light
scattering coefficients as expected (Fig 11). The
5MFC5F30 sample yields a light scattering coefficient of
75 m2/kg, and registers a tensile index of 30 kNm/kg.
Sheets with MFC and 15% ash content exhibits higher
z-direction strength when compared to TMP sheets with
15% ash content (Fig. 12). 5MFC2.5F30 and
3MFC2.5F30 yields similar z strength as F15T85.
5MFC5F30 samples yields highest z direction strength at
511 kPa.
PAPER PHYSICS
392 Nordic Pulp and Paper Research Journal Vol 27 no.2/2012
Fig 5. Tensile index vs. strain at break. The ash content is labelled beside each data point. The error bars are 95% confidence intervals
Fig 6. FESEM image for the surface of F15T85 samples. The surface images were acquired at low (Left) and high (Right) magnification.
Fig 7. FESEM images for the surface of 3MFC2.5F30 samples. The surface images were acquired at low (Left) and high (Right) magnification.
Fig 8. FESEM images for the surface of 5MFC5F30 samples. The surface images were acquired at low (Left) and high (Right) magnification.
15%
0%
17.5%
28.9%
15%
32.6%
17.2%
32%
20
25
30
35
40
45
1.2 1.4 1.6 1.8 2 2.2
Strain at break (%)
Te
ns
ile
In
de
x (
kN
m/k
g)
no MFC
5MFC5%
5MFC2.5%
3MFC2.5%
PAPER PHYSICS
Nordic Pulp and Paper Research Journal Vol 27 no.2/2012 393
Fig 9. Tensile index vs. density. The ash content is labelled beside each data point. The error bars are 95% confidence intervals.
Fig 10. Tensile index versus water retention value (WRV). The error bars are 95% confidence intervals.
Subramaniam (2008) found that increasing filler and
microfines in chemical pulp handsheet improved internal
bonding strength. Nanko, Ohsawa (1989) observed that
fibrillar fines filled gaps between fibres in wet pressed
sheets. The more fibrillated 5MFC5% contains more
nanofibrils and larger specific surface area than
3MFC2.5% and 5MFC2.5%. The MFC readily adsorbs
onto the fillers and fibres and improves packing and
bonding (Fig. 7 and 8) during wet pressing. This
increases the z strength of 5MFCF30 as compared to
F15T85 (Fig. 12).
Gurley versus TMP, filler and MFC (Quadratic mixture models)
The Gurley is modelled with quadratic mixture models in
relation to ash content, TMP and MFC (3 and 5 passes)
fractions (Table 3).
At 95% confidence level, the addition of MFC is found
to significantly increase Gurley or air permeance
(P<0.05). The quadratic mixture model showed that the 5
passes MFC fraction has the most positive effect in
increasing the Gurley. In mixture that contains 5 pass
MFC, the model shows significant effects from
interaction components, MFC-ash content (P<0.05) and
MFC-TMP (P<0.05). The analysis of variance shows that
the error component contributes less than 1% of the
detected total variations detected.
Fig 11. Light scattering (m2/kg) versus ash content (%). The error bars are 95% confidence intervals.
Fig 12. Z direction strength (kPa) vs. Gurley (s/100ml). The ash content is labelled beside each data point. The error bars are 95% confidence interval.
High Gurley or air resistance indicates that the MFC
formed close contact with the fibre network during
handsheet pressing and drying resulting in pore network
blockage (Subramaniam 2008). Nanko, Ohsawa (1989)
also found that fibrillar fines filled gaps between fibres in
wet pressed sheets. Air permeability of paper describes
both porosity and the network structure of the sheet
(Taipale et al. 2010). As confirmed by the structures seen
in Fig 7 and 8 the MFC collected after 5 passes during a
homogenization process contains more nanofibrils.
Larger amount of nanofibrils fills more pores and
enhances bonding. This results in a densely packed
structure after drying, which increases air resistance.
15%
0%
17.2%
28.9%
32.6%
15%
32%
17.2%
20
25
30
35
40
45
390 410 430 450 470 490 510
Density (kg/m3)
Te
ns
ile
in
de
x (
kN
m/k
g)
no MFC 5MFC 5%
5MFC 2.5% 3MFC 2.5%
R2 = 0.85
0
5
10
15
20
25
30
35
40
45
50
0.8 0.9 1 1.1 1.2 1.3 1.4 1.5
WRV (g/g)
Te
ns
ile
in
de
x (
kN
m/k
g)
R2 = 0.93
40
45
50
55
60
65
70
75
80
85
0 5 10 15 20 25 30 35
Ash content (%)
Lig
ht
sc
att
eri
ng
(m
2/k
g)
15%
0%
17.5%
28.9%
32.6%
15%
32%
17.2%
300
350
400
450
500
550
0 10 20 30 40 50 60 70 80
Gurley (s/100ml)
Z d
ire
cti
on
str
en
gth
(k
Pa
)
no MFC 5MFC 5% 5MFC 2.5% 3MFC 2.5%
PAPER PHYSICS
394 Nordic Pulp and Paper Research Journal Vol 27 no.2/2012
Conclusions Optimal selection of MFC quality and filler content
may maintain or improve strength properties without
affecting the pressability of the sheet in the wet end.
both the light scattering and the strength properties of a
given sheet. Increasing both filler and more fibrillated
MFC concentration increased the density and the air
resistance. MFC readily adsorbs onto the filler particles
and fibres thus binding the fillers effectively with the
fibre network. MFC produced through higher number
of passes, 5 passes in this study, at 5% concentration
improved the z direction strength even at 30% filler
loading. This study shows the potential use of MFC and
filler for engineering sheet structures with optimal
properties, i.e. strength, light scattering and air
resistance, without impeding dewatering at press.
Acknowledgements
Tony Lehto and Jani Yli-Alho from Kenttäviiva Oy Automaatio for designing, constructing and commissioning of the dynamic wet pressing simulator. The Research Council of Norway, Norske Skog, PFI, Voith, News International, Omya and Sun Chemical for funding this work through the grant no. 187990 - ENergy efficient PAPer production of wood containing paper for next generation printing presses.
Literature Ahola, S., Österberg, M., Laine, J. (2008): Cellulose nanofibrils – adsorption with poly(amideamine) epichlorohydrin studied by QCM-D and application as a paper strength additive. Cellulose, 14, 303-314.
Abe, K., Yano, H. (2009): Comparison of the characteristics of cellulose microfibril aggregates of wood, rice straw and potato tuber. Cellulose, 16, 1017-1023.
Back, E. L. (1988): Steam boxes in press section – possibilities and limitations. Appita J., 41(3), 217–223.
Burns, J.R. (1992): An investigation of z-direction density distribution of paper in wet pressing. Ph.D. Thesis. IPST, Atlanta.
Burton, S.W., Sprague, C.H. (1987): The instantaneous Measurement of Density Profile Development during Web Consolidation, J. Pulp Pap. Sci., 13(5), J145-150.
Busker, L. H., Francik, C. J. (1984): Laboratory study of the effects of sheet temperature on wet press dewatering. CPPA Annual Meeting Preprints. CPPA, Montreal, 83-95.
Campbell, W.B. (1947): The physics of water removal. Pulp Paper Mag. Can., 48(3), 13-16.
Carlsson, G., Lindström, T., Söremark, C. (1978): “Expression of water from cellulose fibres under compressive loading.” Fiber-water interactions in papermaking.” 6th Fundamental Research Symposium. Oxford, Sept. 1977, Edited by C.F. Baker, The British Paper and Board Industry Federation, London, 389-402.
Ceckler, W.H., Thompson, E.V., Ellis, E.R., Jewett, K.B., Hoering, J.F., Thorne, J.T. and Busker, L.H. (1982): The University of Maine wet pressing project and the application of the results to optimization of press performance. 1982 Tappi Engineering Conference. San Francisco, CA. Sept. 13-16. Tappi Press. Atlanta, 141-146.
Chang, N.L., Han, S.T. (1976): A study of dynamic compression. Project 3258 Progress Report Two. The Institute of Paper Chemistry. July 1st.
Chang, N.L. (1978): Dynamic compression of handsheets. Tappi Engineering Conference, San Francisco, CA, 93–106.
Chinga-Carrasco, G. (2011): Cellulose fibres, nanofibrils and microfibrils: The morphological sequence of MFC components from a plant physiology and fibre technology point of view. Nanoscale research letters 6, 417.
Chinga-Carrasco, G., Yu, Y, Diserud, O. (2011): Quantitative electron microscopy of cellulose nanofibril structures from Eucalyptus and Pinus radiata pulp fibres. Microscopy and microanalysis, 17, 563-571.
Cornell, J.A. (2002): Experiments With Mixtures: Designs, Models, and the Analysis of Mixture Data. Third Edition, John Wiley & Sons. New York.
Eriksen, Ø., Syverud, K., Gregersen, Ø. (2008): The use of microfibrillated cellulose produced from kraft pulp as strength enhancer in TMP paper. Nord Pulp Pap Res J., 23(3), 299-304.
Henriksson, M., Berglund, L.A. (2007): Structure and properties of cellulose nanocomposite films containing melamine formaldehyde. J. Appl Polym Sci., 106, 2817-2824.
Hjelt, T., Sirviö, J., Saarela, M. (2008): Effect of filler clustering on paper properties. Appita J., 61(3), 209-211.
Htun, M., Ruvo, A. (1978): The implication of the fines fraction for the properties of bleached kraft sheet. Sven Papperstidn, 81(16), 507-510.
Hubbe, M.A., Heitmann, J.A. (1997): Review of factors affecting the release of water from cellulosic fibers during paper manufacturing. Bioresources, 2(3), 500-533.
I’Anson, S. and Ashworth, T. (2000): Differential permeability surface layer (DPSL) pressing theory. Tappi J., 83(11), 70.
Iwamoto, S., Nakagaito, A.N., Yano, H., Nogi, M. (2005): Optically transparent composites reinforced with plant fiber-based nanofibers. Appl Phys A, 81, 1109-1112.
Iwamoto, S., Nakagaito, A.N., Yano, H. (2007): Nano-fibrillated of pulp fibers for the processing of transparent nanocomposites. Appl Phys A, 89, 461-466.
Liimatainen, H., Kokko, S., Rousu, P., Niinimäki, J. (2006): Effect of PCC filler on dewatering of fiber suspension. Tappi J., 5(11), 11-17.
Lin, T., Yin, X., Retulainen, E., Nazhad, M.M. (2007): Effect of chemical pulp fines on filler retention and paper properties. Appita J., 60(6), 469-473.
Luukko, K., Maloney, T.C. (1999): The swelling of mechanical pulp fines. Cellulose, 6(2), 123-135.
MacGregor, M.A. (1983): A Description of Sheet Stratification Caused by Wet Pressing, Tappi J., 66(6), 53-57.
MacGregor, M. A. (1989): Wet Pressing research in 1989 – an historical perspective, analysis and commentary. 9th Fundamental Research Symposium. Cambridge, UK, 511-586.
MacGregor, M. A. (2001): Wet pressing and paper Properties – A micromechanical view. Proceedings from the Tappi Practical Aspects of Pressing and Drying Short Course, March. [Online]. Available at: http://www.mac-paper.com/WebSiteFiles/MikesArticlesFiles/PDSCManuscript.pdf. [Accessed 3 March 2012]
Maloney, T. C., Li, T. Q., Weise. U. (1997): Intra- and inter-fibre pore closure in wet pressing. Appita J., 50(4), 301-306.
Maloney, T.C. and Paulapuro, H. (1999): The formation of pores in the cell wall. J. Pulp and Pap. Sci., 25(12). 430-436.
Meyers, R.H., Montgomery, D.C. (2002): Response Surface Methodology: Process and Product Optimization Using Designed Experiments, Second Edition, John Wiley & Sons. 472-484.
Mohlin, U-B., Ölander, K. (1986): The influence of mechanical pulp quality on the properties of filler-containing papers. Nord Pulp Pap Res J., 4(1), 44-50.
PAPER PHYSICS
Nordic Pulp and Paper Research Journal Vol 27 no.2/2012 395
Mörseburg, K., Chinga-Carrasco, G. (2009): Assessing the combined benefits of clay and nanofibrillated cellulose in layered TMP-based sheets. Cellulose, 16, 795-806.
Nanko, H., Ohsawa, J. (1989): Mechanisms of fibre bond formation. Transactions of the 9th fundamental research symposium held in Cambridge: September 1989. Vol. 2, Edited by C.F.Baker. Mechanical engineering publications limited (publisher), 783-830.
Patterson, T. F., Iwamasa, J. M. (1999): Review of web heating and wet pressing literature. Tappi Papermakers Conference Proceedings. Tappi Press, Atlanta, 1255–1278.
Paulapuro, H. (2008): Wet pressing. In: Paulapuro, H., ed. 2008. Part 1, Stock Preparation and Wet End. Totally updated. Helsinki: Paperi ja Puu Oy. Ch.8.
Pääkkö, M., Ankerfors, M., Kosonen, H., Nykänen, A., Ahola, S., Österberg, M., Ruokolainen, J., Laine, J., Larsson, P.T., Ikkala, O., Lindström, T. (2007): Enzymatic hydrolysis combined with mechnical shearing and high-pressure homogenization of nanoscale cellulose fibrils and strong gels. Biomacromolecules, 8(6),1934-1941.
Radwan, M. N., Nayar, R. (1982): Application of hot pressing on Domtar paper machines. 1982 CPPA International Water Removal Symposium Notes. CPPA. Montreal, 119–124.
Royo, M. A., Thorp, B. A. (1981): The effect of direct steam heating on water removal. PIMA, 63(9), 38–41.
Saaristo, M., Knuts, K., and Laine, J. (1984): Use of steam box in the press section of PM3 at the Rauma Paper Mill. Pulp Pap. Can., 85(1), 60–63.
Saito, T., Nishiyama, Y., Putaux, J-L., Vignon, M., Isogai, A. (2006): Homogeneous suspensions of individualized microfibrils from TEMPO-Catalyzed oxidation of native cellulose. Biomacromolecules, 7(6), 1687-1691.
Saito, T., Kimura, S., Nishiyama, Y., Isogai, A. (2007): Cellulose nanofibers prepared by TEMPO-mediated oxidation of native cellulose. Biomacromolecules, 8(8), 2485-2491.
Salmen, L., Tigerström, A., Fellers, C. (1985): Fatigue of wood – Characterization of mechanical defibration. J. Pulp Paper Sci., 11(3): J68-J72.
Sandgren, B., Wahren, D. (1960a): Studies on pulp crill. Part 2. A crill screen. Sven Papperstidn, 63(12), 854-858.
Sandgren, B., Wahren, D. (1960b): Studies of pulp crill. Part 3. Influence of crill on some properties of pulp and paper. Sven Papperstidn, 63(12), 879-883.
Saukko, T. (2006): Potential of the MTS press simulator for wet pressing research. MSc. thesis. Espoo: Helsinki University of Technology, TKK, Espoo, Finland.
Scallan, A.M., Carles, J.E. (1972): The correlation of the water retention value with the fibre saturation point. Sven Papperstidn, 75(17), 699-703.
Scallan, A.M. (1977): The accommodation of water within pulp fibres. In: Fundamental Research Committee (ed) Fibre-water interactions in paper-making, Vol. 1, Transactions of the 6th fundamental research symposium September 1977, The British Paper and Board Industry Federation, Oxford, 9-27.
Seth, R.S. (2003): The measurement and significance of fines – their addition to pulp improves sheet consolidation. Pulp and Paper Canada, 104(2), 41-44.
Springer, A.M., Kuchibhotla, S. (1992): The influence of filler components on specific filtration resistance. Tappi J., 75(4), 187-194.
Stone, J.E., Scallan, A.M., Abrahamson, B. (1968): Influence of beating on cell wall swelling and internal fibrillation. Sven Papperstidn, 71(19), 687-964.
Subramaniam, R. (2008): Engineering fine paper by utilising the structural elements of the raw materials. Doctoral dissertation. Helsinki university of Technology. TKK, Espoo, Finland.
Syverud, K., Chinga-Carrasco, G., Toledo, J. and Toledo, G.P. (2011): A comparative study of Eucalyptus and Pinus radiate pulp fibres as raw materials for production of cellulose nanofibrils. Carbohydr Polym, 84(3), 1033-1038.
Szikla, Z., Paulapuro, H. (1989): “Compression behaviour of fiber mats in wet pressing.” Fundamentals of papermaking. Transactions of the ninth fundamental research symposium at Cambridge, UK, 587-624.
Szikla, Z., Paulapuro, H. (1989b): Changes in Z-Direction density Distributions of Paper in Wet Pressing, J. Pulp Pap. Sci., 15(1), J11-J17.
Szikla, Z. (1992): On the basic mechanism of wet pressing. Doctoral thesis. PSC Communication 31, KCL Paper Science Centre. Espoo, Finland.
Taipele, T., Österberg, M., Nykänen, A., Ruokolainen, J., Laine, J. (2010): Effect of microfibrillated cellulose and fines on the drainage of kraft pulp suspension and paper strength. Cellulose, 17, 1005-1020.
Tanaka, H., Luner, P., Côté, W. (1982) How retention aids change the distribution of filler in paper. Tappi J., 65(4), 95-99.
Terzaghi, K. (1943): Theorectical soil mechanics, 3rd Printing. Chapman and Hall Ltd., John Wiley and Sons, Inc., New York, 265-296.
Turbak, A.F., Snyder, F.W., Sandberg, K.R. (1983): Microfibrillated cellulose, a new cellulose product: properties, uses, and commercial potential. J. Appl Polym Sci Appl Polym Symp, 37, 815-827.
Vomhoff, H. (1998): Dynamic compressibility of water saturated fiber networks and influence of local stress variations in wet pressing. Doctoral thesis. Stockholm: Royal Institute of Technology.
Wahlström, P.B. (1960a): A long term study of water removal and moisture distribution on a newsprint machine press section – Part 1. Pulp Paper Mag. Can., 61(8), T379–T401.
Wahlström, P.B. (1960b):A long term study of water removal and moisture distribution on a newsprint machine press section – Part II. Pulp Paper Mag. Can., 61(9), T418-T451.
Wahlström, P.B. (1969): Our present understanding of the fundamentals of pressing. Pulp Paper Mag. Can., 70(10), 76-79.
Wahlström, P.B. (1979): New developments and new insights in water removal by pressing. EUCEPA-79 XVIII International Conference Web Formation & Consolidation. London, UK May 21-24, 1979. The British Paper and Board Industry Federation. London, 91-121.
Wahlström, P.B. (1990): The effect of water in the fiber wall in wet pressing.44th Appita Annual General Conference. Rotorua, New Zealand, A21.1-A21.24.
Wågberg, L., Decher, G., Norgren, M., Lindström, T., Ankerfors, M., Axnas, K. (2008): The Build-Up of Polyelectrolyte Multilayers of Microfibrillated Cellulose and Cationic Polyelectrolytes. Langmuir, 24(3), 784-795. Wicks, L. (1982): The Influence of Pressing on Sheet Two-Sidedness, Tappi Engineering Conference, 3-8.
Zimmermann, T., Bordeanu, N., Strub, E. (2010): Properties of nanofibrillated cellulose from different raw materials and its reinforcement potential. Carbohydr Polym, 79, 1086-1093.
PAPER PHYSICS
396 Nordic Pulp and Paper Research Journal Vol 27 no.2/2012