+ All Categories
Home > Documents > The Effect of Music on Concentration, Heart Rate, Blood ...jass.neuro.wisc.edu/2013/01/601 group 14...

The Effect of Music on Concentration, Heart Rate, Blood ...jass.neuro.wisc.edu/2013/01/601 group 14...

Date post: 05-Apr-2018
Category:
Upload: lykiet
View: 215 times
Download: 2 times
Share this document with a friend
16
1 The Effect of Music on Concentration, Heart Rate, Blood Pressure and Respiratory Rate Eric Bobel, Prateek Chhetri, Amy Pedersen, Brittany Seidl, Tzu-Wei Tsao University of Wisconsin-Madison Physiology 435 Lab 601-14 Medical Sciences Center 1330 University Ave. Madison, WI 53706 Key words: Stroop test, Heart Rate, Respiratory Rate, Blood Pressure, Concentration, Music Word Count: 4,513
Transcript

1

The Effect of Music on Concentration, Heart

Rate, Blood Pressure and Respiratory Rate

Eric Bobel, Prateek Chhetri, Amy Pedersen, Brittany Seidl, Tzu-Wei Tsao

University of Wisconsin-Madison

Physiology 435 Lab 601-14

Medical Sciences Center

1330 University Ave.

Madison, WI 53706

Key words:

Stroop test, Heart Rate, Respiratory Rate, Blood Pressure, Concentration, Music

Word Count:

4,513

2

ABSTRACT

This study aims to investigate how music affects one’s concentration, heart rate, blood

pressure and respiratory rate. Twenty-four participants were randomly assigned to one of three

groups. Group one was our control group and did not listen to any music. Group two listened to

classical music and group three was given a choice between eight different lyrical songs from

four different genres. Participants took a Stroop test, a test measuring capacity to direct attention,

while listening to the selected music, or lack thereof when placed in the control group. Heart rate,

blood pressure and respiration rate were measured before and after the Stroop test. There were no

significant p-values for the change in heart rate, blood pressure, or Stroop test score. However,

the change in respiratory rate ratio (measured in breaths per second) between classical and lyrical

music groups was significantly different (p=0.007). Our hypothesis that people listening to no

music would do better on a Stoop test measuring concentration than people listening to music

was not supported. Our hypothesis that the blood pressure, heart rate, and respiratory rate would

be highest for people listening to lyrical music, lowest for people listening to classical music and

somewhere in the middle for the non-musical group was not supported based on the

physiological findings of this study.

INTRODUCTION

College students are told that they should not listen to music while studying. But when

walking around campus, one can always find one student, if not more, who is studying with their

earphones. Are these students’ grades being negatively affected by their habit of listening to

music while studying? Or are they actually able to learn more effectively with their music

playing? It has been shown in previous studies that listening to music leads to lower

performance levels of short-term memory (Anderson and Fuller, 2010). In a study by Anderson

and Fuller, junior high students were given a reading comprehension test with or without music.

About 75% of participants in the group that were listening to lyrical background music

performed poorly with a mean reading comprehension score of 26.49 than the group without the

music with a mean reading comprehension score of 30.56.

The negative effect of background music on short-term memory was shown in a memory

study relating to music’s effect on memory (Salamé and Baddeley, 1989). In the study, each test

subject was exposed to lyrical music, instrumental music and silence in three separate trials.

Participants were then asked to memorize a line of nine numbers and to replicate the line a short

time later. Participants in the silent control situation had an overall higher level of performance

than those in either of the groups with music. Another study looked at college age students who

liked to listen to rock and roll and had them take reading comprehension tests (Daoussis and

McKelvie, 1986). They found that the students performed worse on the reading comprehension

test when listening to the rock and roll music (M=8.08) than without listening to music at all

(M=8.40).

Numerous studies have been conducted that showed a decrease in heart rate while

listening to music. According to another study, slow paced music decreases your heart rate,

3

blood pressure, and respiratory rate whereas fast-paced music has the opposite effect (Hyde and

Scalapino, 1918). A fourth study looked at how blood pressure would respond after completing a

stressful task (Chafin et. al, 2004). They observed a significant effect of music condition on

recovery, showing a significant difference between the classical and control, (p<0.3), classical

returning systolic blood pressure closer to baseline (M ¼ 2:1 mmHg) than the control condition

(M ¼ 10:8 mmHg). Although these studies show a correlation between music and physiological

factors, we would like to assess the effect of music chosen by the participants on their

concentration. This is more directly applicable in analyzing common study strategies of students.

Does listening to music affect your ability to concentrate and by extension, your test

scores? Clearly more research is needed in this field. To further examine this, we chose the

Stroop test in order to measure the selective attention, cognitive flexibility, and processing speed

of the participants (Howieson et al., 2004; Spreen et al., 2006). Concentration is an important

factor in the mental processes of attention, learning, memory and problem solving. We

hypothesize that people who take a Stroop test, measuring concentration, while listening to

music would have lower test scores than those taking the test without listening to music, and

people who listen to lyrical music will have even lower scores than the group who listens to

classical music. Based on the previous research mentioned, we also hypothesize that the blood

pressure, heart rate, and respiratory rate (measured in breaths per second) will be highest for

people listening to lyrical music and lowest for people listening to classical music, and the no

music group in the middle.

MATERIAL AND METHODS

Ethical Approval

This experiment involved consenting human volunteers. Specifically, written consent was

obtained from every volunteer before proceeding with the experimental protocol. The

experiment was conformed to the guidelines set down by the Physiology 435 lab instructors and

pre-approved before any experimentation began.

General Procedure Overview

The materials used in this study include a blood pressure cuff and a stethoscope to

measure blood pressure, a pulse oximeter provided by the BIOPAC Systems, Inc. to measure

heart rate, Biopac Student Lab software and a respiratory belt to measure respiratory rate, and an

online Stroop test (http://www.onlinestrooptest.com/). A Stroop test evaluates the brain’s ability

to distinguish the interference of reaction time and correction between words and colors; it

examines the effect of interfering word stimuli upon naming its colors serially (Stroop, 1935). A

word of a color will appear in either the color of the word or a different color from the word, for

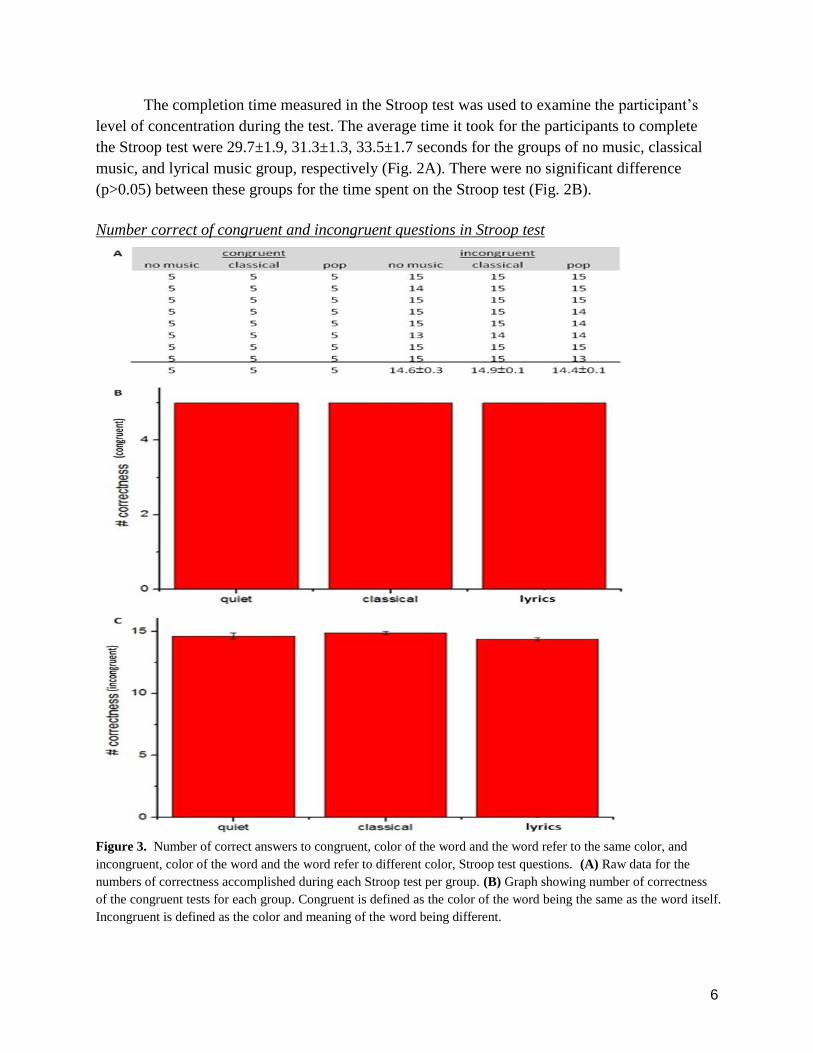
example, the word “blue” printed in green. There will be five sets of congruent tests, in which

the color of the word matches the meaning of the word, and fifteen sets of incongruent tests, the

color of word doesn’t match the meaning of the word. The two types of questions will be

randomly distributed throughout the Stroop test. The test subject will be required to choose the

4

correct answer as fast as they can at the bottom of the screen corresponding to the color of the

word (in this case “green”) rather than the color that the word says (in this case “blue”) For our

study, concentration was defined based on the speed and accuracy when taking a Stroop test. A

participant who took the test quickly and accurately was interpreted as having optimum

concentration while a participant who took longer or did not answer all the questions correctly

was understood to have compromised concentration.

In this study, twenty-four students from a Physiology 435 lab of the University of

Wisconsin - Madison volunteered to participate. The average age of the participants was twenty-

one and the study group included eleven women and thirteen men. Participants were randomly

assigned to three different groups (eight people each): no music, classical music, and lyrical

music. The test without music was our control. The classical song used was Eine Kleine

Nachtmusik by Mozart. If participants were selected for the lyrical music group, they were

allowed to choose from eight different song choices. These song choices spanned four different

genres (pop, rock, rap, and country) and included one male and female artist for each genre. The

possible song options were Thrift Shop by Macklemore, Bad Romance by Lady Gaga, Not Afraid

by Eminem, Sweet Child of Mine by Guns n’ Roses, Dirt Road Anthem by Jason Aldean, Tim

McGraw by Taylor Swift, Super Bass by Nicki Minaj, and Raise Your Glass by Pink. Allowing

participants to choose their song from a diverse list allowed control for different preferences of

music and better simulate what they might listen to while studying. The participant was able to

choose what volume to listen to the music at in order to help provide a comfortable environment.

The music in the experimental setup was played through headphones rather than a larger speaker,

therefore participants were asked to wear headphones regardless of whether or not they were

listening to music. This was to control for any effect that the headphones or their cord may have

caused. In all of the experiments Apple brand headphones were used.

The heart rate and blood pressure of each participant were measured at the beginning of

the test in order to get a baseline measurement. For control data, the participants’ heart rate and

blood pressure were taken without the influence of music. After the baseline heart rate and blood

pressure were taken, the respiratory belt was wrapped around the participant’s chest and a

calibration of their breathing was taken before actual recording began. The respiration belt was

used to track the changes in respiration before, during, and after the Stroop test, as instructed by

the Biopac Student Manual (Pfanzer, et al. 2008). After calibration of the respiration belt, data

collection began and allowed for ten seconds to pass before the start of the online Stroop test. At

the time the participant finished the Stroop test, an additional ten seconds of respiratory data was

collected. Heart rate and blood pressure were also recorded right after completing of the Stroop

test (Fig. 1). The time it took for the participant to finish the Stroop test was recorded along with

the number of correct answers. After the data was collected, it was analyzed using Microsoft

Excel, OriginPro and the Biopac Student Lab system.

5

Figure 1. Timeline of the experimental procedure. Eight participants listened to no music, eight to classical music,

and eight to lyrical music of their choice.

RESULTS

There were no significant p-values for the change in heart rate, blood pressure, or Stroop

test score. There was also no change in respiratory rate when comparing the lyrical music group

to the group with no music. There was, however, a significant p-value when comparing the

breathing rate of participants listening to classical music while taking the Stroop test to those

listening to lyrical music of their choice.

Effect of music on the time to complete the Stroop Test

Figure 2. Completion time of the Stroop test between music groups. (A) Raw data of the completion time (sec)

during the Stroop test for each participant in different groups. (B) No significance was observed among the

completion time of the three groups.

6

The completion time measured in the Stroop test was used to examine the participant’s

level of concentration during the test. The average time it took for the participants to complete

the Stroop test were 29.7±1.9, 31.3±1.3, 33.5±1.7 seconds for the groups of no music, classical

music, and lyrical music group, respectively (Fig. 2A). There were no significant difference

(p>0.05) between these groups for the time spent on the Stroop test (Fig. 2B).

Number correct of congruent and incongruent questions in Stroop test

Figure 3. Number of correct answers to congruent, color of the word and the word refer to the same color, and

incongruent, color of the word and the word refer to different color, Stroop test questions. (A) Raw data for the

numbers of correctness accomplished during each Stroop test per group. (B) Graph showing number of correctness

of the congruent tests for each group. Congruent is defined as the color of the word being the same as the word itself.

Incongruent is defined as the color and meaning of the word being different.

7

All the groups scored 5 out of 5 on the Stroop test for congruent words, while the average

incongruent score out of 15 were: 14.6±0.3 for quiet, 14.9±0.1 for the classical group, and

14.4±0.1 for the lyrical music group (Fig. 3A). The difference in the number correct for either

congruent or incongruent questions in the Stroop test showed no significant difference between

groups (Fig. 3B).

Effect of music on respiratory rate

Figure 4. The ratio of respiratory rate (RR) in breaths per second during the Stroop test to RR before the Stroop test.

(A) Raw data of the ratio of RR for each group. (B) A significant difference (**p<0.01) was found between the

classical music group and the lyrical music group.

By using the Biopac Student Lab System, it was easy to measure a participant’s

respiratory rate (RR). With the respiratory belt, the participant’s breathing pattern was easily

monitored both before and during the Stroop test. A subsequent analysis of calculating the RR in

breaths per second was used as an index to examine any change in a participant’s respiratory rate.

The ratio of RR during the Stroop test to RR before the test was 1.10±0.09, 1.24±0.15,

and 0.89±0.09 for the groups with no music, classical music, and lyrical music, respectively (Fig.

4A). The change in RR ratio between classical and lyrical music groups was significantly

different (p=0.007) while the other comparisons between either no music and classical music or

no music and lyrical music of their choice were not found to be significantly different. There was

however a trend indicating that RR was highest when listening to classical music and lowest

when listening to lyrical music of choice.

Effect of music on blood pressure and heart rate

The blood pressure and heart rate results showed no significant difference before or

immediately after the Stroop test regardless of the type of music. The change in heart rate and

blood pressure were not hypothesized to be large, so the measurement was needed to be taken

immediately after in order to detect any changes from the resting measurements taken before the

start of the Stroop test.

8

Figure 5. Ratio of blood pressure (BP) after Stroop test to BP before Stroop test for both diastolic and systolic BP.

(A) Raw data of diastolic BP for each group. (B) Raw data of systolic BP for each group. (C) Bar graphs of the BP

ratio of after-Stroop-test to before-Stroop-test. No significance were shown among the groups.

The ratio of the blood pressure after the Stroop test to blood pressure before the test tends

to be slightly higher, except the systolic blood pressure of the quiet group. The ratios for the

diastolic blood pressure after the Stroop test over before are 1.03±0.02, 1.06±0.02, and 1.00±0.04,

9

respectively for the groups of no music, classical and lyrical music of their choice (Fig. 5A), and

0.99±0.01, 1.02±0.01, 1.03±0.02 for the systolic blood pressure (Fig. 5B). None of the groups

had a significant difference between them (Fig. 5C).

Figure 6. Ratio of heart rate after Stroop test over heart rate before Stroop test for groups. HR, heart rate. (A) Raw

data of HR before and after the Stroop test and the ratios of after to before. (B) Bar graph of the ratio of HR for each

group. No significance were shown within the groups.

On average, there was no change in heart rate before and after taking the Stroop test.

Without music, variation was equally distributed between positive and negative change, a change

was hardly discovered. Overall, participants’ heart rates decreased after listening to music, either

classical or lyrical, while taking the Stroop test (Fig. 6A, 6B). In the classical music group,

participants’ heart rates decreased by 4.88±3.23 beats per minute, and with the lyrical music of

10

their choice, the observed heart rate decreased by 4.25±3.22 beats per minute (figure not shown).

Through this we can observe a downward trend in heart rate with the quiet control group having

the overall highest heart rate.

DISCUSSION

Several factors contribute to the outcome of the completion time and number of correct

responses in the Stroop test in terms of the working memory and cognitive development

(Demetriou and Efklides, 1993; Demetriou, 2002). The reaction time needed to accomplish the

Stroop test decreases as a child grows up to an adult. As a person ages, cognitive functions

develop more and people are thus able to finish a task faster. In our experiment, the participants

were chosen within a specific age range of early adulthood, between 19 through 23, in order to

reduce the variation in cognitive development due to age.

All participants performed well in the congruent cases of the Stroop test. This

exemplifies that while concentration may vary in different musical settings, all participants were

able to focus enough to read the word when it was written in the same color and choose the right

answer even while under the pressure of a testing situation. This served as an unexpected

baseline to which we can compare incongruent scores. Most participants also performed well in

the incongruent cases of the Stroop test, but not as well as the congruent cases.

The hypothesis concerning blood pressure, heart rate, and respiratory rate stated these

would be highest in lyrical music group compared to classical and control was not supported

based on the physiological findings of this study. There were no significant results showing that

heart rate, blood pressure, or RR was lower in the classical music group than in non-music and

lyrical music groups.

The only significant difference observed in the physiological values measured was in the

respiratory rate (p=0.007), and this was observed between the classical music group and the

lyrical music group. This is interesting because it was also the only consciously regulated

physiological value recorded. While the result was significant, it did not support our hypothesis.

There was no significant change in heart rate between the different groups. Heart rate

measurements yielded a similar result. The quiet control group had no overall average change in

heart rate during the experiment. Both musical groups experienced a decrease in heart rate, with

the classical group’s participants experiencing a slightly greater decrease in heart rate than the

lyrical group’s participants. One possible factor relating to this might be the effects of other

groups’ experiments. In the case of this experiment, the focus was on small changes in heart rate

that would be due to the stress of the Stroop test or the change in setting when music was playing.

The test subjects were however, also involved in other groups’ experiments relating to heart rate,

including exercise related activities including running up and down the stairs. These would have

had a larger effect on heart rate than this experiment. Some participants were undoubtedly still

recovering from an increased heart rate as a result of other experiments while participating in this

one. The result is a large range in heart rates between participants and by extension, an increased

standard deviation. On average no change in heart rate was observed in the quiet group and a

11

decrease in heart rate was observed in both groups which listened to music. This change however,

was not significant due to the large variation in heart rates among participants and a small sample

size. In the future, this experiment could be repeated in an environment which controls for

outside factors that might impact heart rate.

While few measurements resulted in significance, this could be due to a small sample

size resulting in an increased standard deviation. Because of this, trends are worth mentioning in

the analysis. Overall, completion time increased for all participants listening to classical music,

and increased more for those listening to lyrical music. While all participants identified all

congruent colors correctly, there was some variation in correctness in the event of incongruent

questions. The group listening to classical music scored slightly better overall on incongruent

Stroop test questions, followed closely by the quiet control group and then the lyrical music

group. The quiet group finished the Stroop test the fastest but had more errors in the incongruent

answers while the classical group had the less errors but took slightly longer to complete the test.

Thus, further experiments are required to control for the variables to get an accurate effect of

music on concentration and we can’t infer support of our hypothesis relating to concentration.

Another important factor contributing to the results received is the duration of the

experiment itself. This study of music affecting concentration is based on a Stroop test that is

less than a minute long. A longer time period of listening to music are suggested in future work.

The conducted experiment does not reflect the actual environment or duration of a typical

student studying. We chose to use a short time interval (6 minutes) with the Stroop test in order

to reduce habituation effects to the test, which does not reflect the actual studying time for

students. Also, a shorter experiment duration time was chosen in hopes of increasing

participation. The length of the experiment as well as the refractory period are important factors

to note in future studies. Another error in the experimental process may be found in the fact that

the test was administered in a moderately noisy room. It was impractical to move to a quiet

library for the experiment. Also, different measurement equipment was used each time to for

blood pressure and heart rate; this could contribute small errors due to variation in equipment.

The blood pressure was taken manually instead of using a machine and different people took this

measurement for different participants, so human error could be introduced. Error could also be

introduced due to a small sample size of participants. In addition to our small sample size, some

of our participants participated in other physiological tests that required raising their basal rates

through strenuous activities. Lastly, there was trouble with the pulse oximeter measuring the

heart rate, as there were instances of the equipment taking above normal times to register the

heart rate.

12

REFERENCES

Anderson, S.A., and Fuller, G.B. (2010). Effect of music on reading comprehension of junior

high school students. School Psychology Quarterly 25, 178-187.

Chafin, S., Roy, M., Gerin, W. and Christenfeld, N. (2004), Music can facilitate blood pressure

recovery from stress. British Journal of Health Psychology, 9: 393–403.

Daoussis, Leonard, and McKelvie, Stuart J. (1986) Musical Preferences And Effects of Music

on a Reading Comprehension Test for Extraverts And Introverts. Perceptual and Motor

Skills: Volume 62, Issue, pp. 283-289.

Demetriou, A., and Efklides, A. (1993). THE ARCHITECTURE AND DYNAMICS OF

DEVELOPING MIND: EXPERIENTIAL STRUCTURALISM AS A FRAME FOR

UNIFYING COGNITIVE DEVELOPMENTAL THEORIES. Monographs of the Society for

Research in Child Development 58, 1-167.

Demetriou, A.C.G.M.K.W.D.T.L.O.W.F. (2002). THE DEVELOPMENT OF MENTAL

PROCESSING: EFFICIENCY, WORKING MEMORY, INTRODUCTION: THE

INFORMATION PROCESSING, THE DIFFERENTIAL, AND THE DEVELOPMENTAL

TRADITIONS IN THE STRUCTURE AND DEVELOPMENT OF THE MIND AND

THINKING. Monographs of the Society for Research in Child Development 67, 1-38.

Howieson, Diane Black; Lezak, Muriel Deutsch; Loring, David W. (2004). Orientation and

Attention. Neuropsychological Assessment. Oxford[Oxfordshire]: Oxford University Press.

pp. 3365-3367.

Hyde, I.H., and Scalapino, W. (1918). THE INFLUENCE OF MUSIC UPON

ELECTROCARDIOGRAMS AND BLOOD PRESSURE. American Journal of Physiology -

- Legacy Content 46, 35-38.

Salamé, P., and Baddeley, A.D. (1989). Effects of background music on phonological short-

term memory. The Quarterly Journal of Experimental Psychology A: Human Experimental

Psychology 41, 107-122.

Spreen, Otfried;Strauss, Esther; Elisabeth M. S. Sherman (2006). A Compendium of

Neuropsychological Tests: Administration, Norms,and Commentary.Oxford[Oxfordshire]:

Oxford University Press. pp. 477-499.

Stroop, J.R. (1935). Studies of interference in serial verbal reactions. Journal of Experimental

Psychology 18, 643-662.

13

AUTHOR CONTRIBUTIONS

All authors were involved in the design and execution of the experimental project. Tasks

were divided as follows: Pedersen was responsible for taking the before and after blood pressure,

Chhetri was responsible for putting all of the data into a Microsoft Excel document, Tsao was

responsible for running the respiratory belt data collection on the computer and analyzing the

data, Seidl was responsible for taking the before and after heart rate as well as obtaining the

consent form, and Bobel was responsible for explaining and starting the Stroop test. All authors

participated in the data analysis and revisions of the final research paper.

ACKNOWLEDGEMENTS

The authors would like to thank Dr. Andrew Lokuta for his assistance and guidance

during this experiment, as well as for the use of the laboratory space. The authors would also

like to thank Brandon Wright and Marie Hoffman for their assistance in peer reviewing the drafts

of the research paper.

14

APPENDIX

Music Choices: # Of Times Selected:

Classical: Eine Kleine Nachtmusik by Mozart 8

Lyrical: Thrift Shop by Macklemore 3

Bad Romance by Lady Gaga 2

Not Afraid by Eminem 1

Sweet Child of Mine by Guns n’ Roses 0

Dirt Road Anthem by Jason Aldean 1

Tim McGraw by Taylor Swift 0

Super Bass by Nicki Minaj 0

Raise Your Glass by Pink. 1

15

PILOT STUDY

To further enrich our data, we conducted a pilot study by controlling for factors by

increasing the duration of music and ensuring that no participants were exposed to strenuous

physical activity prior to participating in the study. The experimental design was similar to our

initial experiment but the duration that participants were exposed to music or no music was

increased to 45 seconds instead of having the participants listening to it only while they were

taking the Stroop test.

RESULTS

Similar to our results, music, either classical or lyrical, made the participants more

relaxed by slowing down their heart rate, but only little change between the heart rate before and

after. The blood pressure and correctness of congruent and incongruent Stroop tests are also

similar.

The results of the respiratory rate is slightly different than the previous results. In both

classical and lyrical music group we observed decreased respiratory rate during the Stroop test,

especially in the lyrical group. As for the reaction time of the Stroop test, the trend is different

from the previous results. We observed classical having the longest completion time with lyrical

having the fastest, while in our initial study lyrical had the slowest completion time and no music

had the fastest (Table 1).

Quiet Classical Lyrical

HR (after/before) 1.06 0.95 1.02

Diastolic BP

(before/after)

1.02 0.98 1.00

Systolic BP

(before/after)

0.99 0.98 1.03

RR (before/after) 1.41 1.28 0.97

# correctness of

congruent

5 5 5

# correctness of

incongruent

15 12.7 15

16

Completion time of

Stroop test

27.8 30.7 24.0

Table 1. Averages of the various physiological measure taken before and after the Stroop test. The factors measured

were heart rate, systolic and diastolic pressure, respiratory rate, the correctness of congruent and incongruent Stroop

tests, and the time taken to complete the Stroop test.

DISCUSSIONS

Despite changing the experimental design to control for factors in the pilot study, we were

unable to observe any significant changes from our pilot study except the completion time of the

Stroop test. The change in the completion time we observed in comparison to our initial study

was due to an outlier in the classical group that affected our data. However, removing the outlier

still showed the same general trend. This anomaly could be a random error as our sample size

was smaller than the initial study. Due to time constrictions, we couldn’t recruit more

participants to gain a larger sample size. Although we controlled for most of the errors from our

initial study, future studies with larger sample size need to be conducted to validate the effects of

music on concentration, heart rate, blood pressure and respiratory rate.


Recommended