The Effect of Provenance on Clay Mineral Diagenesis in Gulf of Mexico Shales Matthew W. Totten, Sr. 1 , Joniell Borges 2 , and Iris M. Totten 1 1 Department of Geology, Kansas State University, Manhattan, Kansas 66506 2 Department of Geological Sciences, Northwestern University, Evanston, Illinois 60208 ABSTRACT This study examines 43 samples from drill cuttings from an offshore well in the Ship Shoal area, Gulf of Mexico. The mudrock samples were taken from a depth interval of 4800-13,600 ft (1463-4146 m), with the deepest sample penetrating the upper Miocene series. Previously reported work on the same samples (Totten et al., 2002) confirmed diagenetic growth of illite at the expense of smectite with increasing depth. The amount of K 2 O varies between 2.5 to 3.6 weight % and also increases with depth. However, only 17% of the increase is depth related (R 2 = 0.17). In contrast, none of the other major elements correlate with depth. Provenance analyses of heavy-mineral suites suggest an increase in the amount of sediment derived from a felsic source in deeper parts of the well. This is also supported by the increase of incompatible trace elements when compared to compatible elements at greater depths. Because felsic rocks contain a higher percentage of potassium-bearing minerals, the K 2 O variation may therefore be directly related to changes in provenance. The K 2 O required to drive the smectite-illite transformation reaction in these rocks could be acquired from potassium-rich minerals that were originally present in the mud- rock. INTRODUCTION The transformation from smectite to illite during burial diagenesis in mudrocks has been well established since the pioneering work of Hower et al. (1976). Several mechanisms have been proposed for the conversion of smectite to illite. Most call upon the dissolution of K-feldspar to partially provide the necessary potassium and aluminum (e.g., Boles and Franks, 1979). The problem is that illitization is not complete even after all of the K- feldspar is gone. Pollastro (1985) suggested that mixed-layer clays dissolve to provide the additional elements. In a similar fashion, Totten and Blatt (1993) proposed cannibalization of existing illites to illitize any remaining smectite layers. This idea is supported by the observed decrease in total clay percentage with depth. Berger et al. (1999) and Cuadros and Altaner (1998) have suggested the discrete formation of illite and formation of illite from kaolinite. There are many additional articles on the subject, too many to cite, most addressing the source of re- quired elements (potassium and aluminum), or speculating on the sinks for released elements, mainly silicon (e.g., Totten and Blatt, 1996). Many studies report an increase in whole-rock K 2 O with increased depth, and suggest that the increased K 2 O reflects an external source of potassium introduced to the rock after burial (Berger et al., 1999; Gier, 1998; Land et al., 1997; Awwiller, 1993). These authors conclude that mudrocks behave as open systems during burial diagenesis. The elements involved in the conversion of smectite to illite are free to come and go as required. The Totten, M. W., Sr., J. Borges, and I. M. Totten, 2007, The effect of provenance on clay mineral diagenesis in Gulf of Mex- ico shales: Gulf Coast Association of Geological Societies Transactions, v. 57, p. 699-716. 699
Transcript
The Effect of Provenance on Clay Mineral Diagenesis in Gulf of Mexico Shales
Matthew W. Totten, Sr.1, Joniell Borges2, and Iris M. Totten1
1Department of Geology, Kansas State University, Manhattan, Kansas 66506
2Department of Geological Sciences, Northwestern University, Evanston, Illinois 60208
ABSTRACT This study examines 43 samples from drill cuttings from an offshore well in the Ship
Shoal area, Gulf of Mexico. The mudrock samples were taken from a depth interval of 4800-13,600 ft (1463-4146 m), with the deepest sample penetrating the upper Miocene series. Previously reported work on the same samples (Totten et al., 2002) confirmed diagenetic growth of illite at the expense of smectite with increasing depth. The amount of K2O varies between 2.5 to 3.6 weight % and also increases with depth. However, only 17% of the increase is depth related (R2 = 0.17). In contrast, none of the other major elements correlate with depth.
Provenance analyses of heavy-mineral suites suggest an increase in the amount of sediment derived from a felsic source in deeper parts of the well. This is also supported by the increase of incompatible trace elements when compared to compatible elements at greater depths. Because felsic rocks contain a higher percentage of potassium-bearing minerals, the K2O variation may therefore be directly related to changes in provenance. The K2O required to drive the smectite-illite transformation reaction in these rocks could be acquired from potassium-rich minerals that were originally present in the mud-rock.
INTRODUCTION
The transformation from smectite to illite during burial diagenesis in mudrocks has been well established
since the pioneering work of Hower et al. (1976). Several mechanisms have been proposed for the conversion of smectite to illite. Most call upon the dissolution of K-feldspar to partially provide the necessary potassium and aluminum (e.g., Boles and Franks, 1979). The problem is that illitization is not complete even after all of the K-feldspar is gone. Pollastro (1985) suggested that mixed-layer clays dissolve to provide the additional elements. In a similar fashion, Totten and Blatt (1993) proposed cannibalization of existing illites to illitize any remaining smectite layers. This idea is supported by the observed decrease in total clay percentage with depth. Berger et al. (1999) and Cuadros and Altaner (1998) have suggested the discrete formation of illite and formation of illite from kaolinite. There are many additional articles on the subject, too many to cite, most addressing the source of re-quired elements (potassium and aluminum), or speculating on the sinks for released elements, mainly silicon (e.g., Totten and Blatt, 1996).
Many studies report an increase in whole-rock K2O with increased depth, and suggest that the increased K2O reflects an external source of potassium introduced to the rock after burial (Berger et al., 1999; Gier, 1998; Land et al., 1997; Awwiller, 1993). These authors conclude that mudrocks behave as open systems during burial diagenesis. The elements involved in the conversion of smectite to illite are free to come and go as required. The
Totten, M. W., Sr., J. Borges, and I. M. Totten, 2007, The effect of provenance on clay mineral diagenesis in Gulf of Mex-ico shales: Gulf Coast Association of Geological Societies Transactions, v. 57, p. 699-716.
699
Totten et al.
assumption is that the provenance of deeper samples has not varied greatly from the shallower samples; therefore, any chemical differences are attributed to open system behavior.
Bloch et al. (1998) has questioned this assumption with respect to Gulf of Mexico shales. They suggest that increased orogenic activity during the Laramide orogeny in the early Cenozoic provided more potassium to the basin because of the increased felsic igneous production in the source area. Lynch et al. (1999) countered this idea and reaffirmed the original consensus that little provenance variation exists during much of the Tertiary in south Texas. Additional work regarding the control of provenance versus diagenesis on the reported varaiations in Gulf of Mexico mudrocks are needed to resolve this question.
Heavy mineral investigations have been used for nearly a century to determine the provenance of sandstones. Most studies concentrate on the non-opaque mineral fraction. Other studies reveal variations in the mineralogical and chemical characteristics of opaque heavy minerals and have established their usefulness for provenance dis-crimination (Schneiderman, 1995; Grigsby, 1990; Basu and Molinaroli, 1989; Hiscott, 1984). Examination of the heavy-mineral fraction from Paleozoic shales discloses a variety of heavy minerals, comparable to the heavy frac-tion in sandstones (Hanan and Totten, 1996). A recent study used heavy minerals as provenance indicators in shales from the Ouachita Mountains (Totten et al., 2000).
The whole-rock trace element geochemistry of shales has also been used to determine provenance. Most useful are ratios of compatible to incompatible elements (Taylor and McLennan, 1985). Compatible elements (e.g., Cr, V, Ni) are concentrated in mafic igneous rocks while incompatible elements (e.g., Th, La, Zr) are con-centrated in more evolved felsic igneous rocks. Changes in these ratios reflect changes in the provenance of the sediments. The documented open system behavior of sandstones limits the utility of provenance based on trace elements (Milliken et al., 1994); however, they are widely used in shales.
OBJECTIVES
The objectives of this study are to 1) determine the variation in provenance over time within a well in the
Gulf of Mexico, 2) assess the effect of this variation on reported diagenetic trends in mudrocks, and 3) based on these results, determine whether these mudstones behave as an open or closed system.
Provenance will be determined based on the suite of heavy minerals separated from the mudrocks, and also on the distribution of whole-rock trace elements. We hope to test the assumption that provenance varies with time (depth) in the Gulf of Mexico Basin.
GEOLOGIC SETTING The well cuttings used in this study belong to a vertical well in the Ship Shoal area, protraction block num-
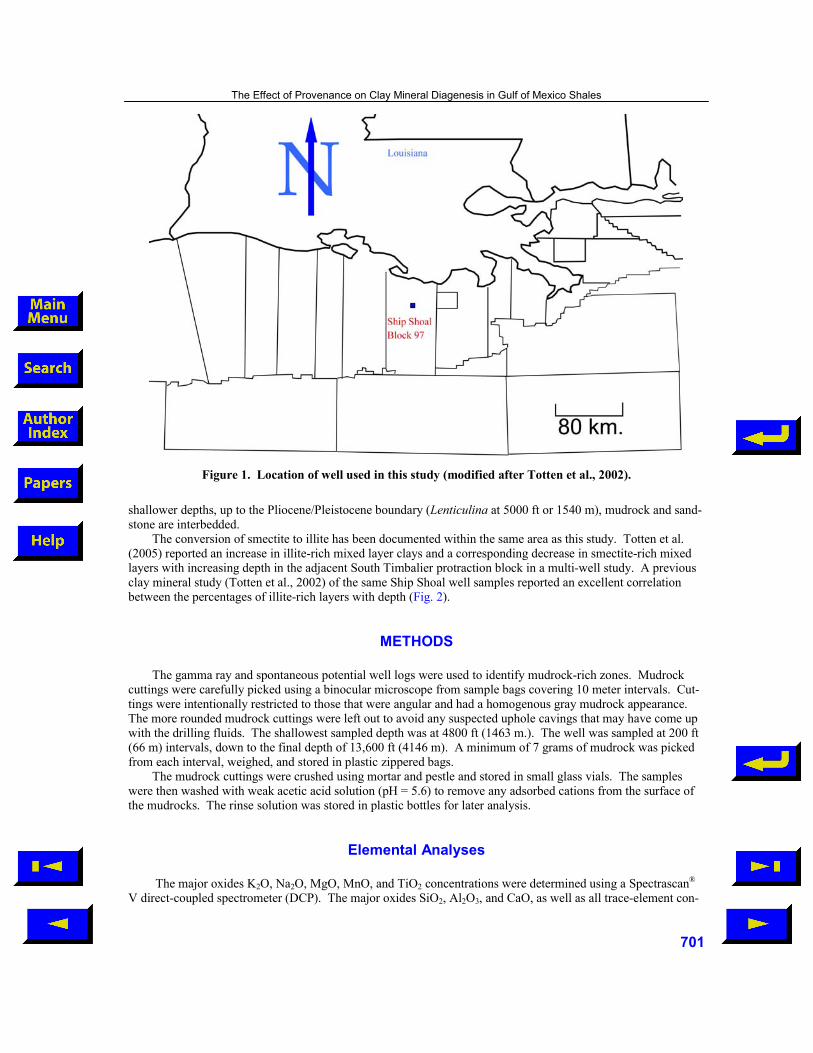
ber 97, OCS-G 12936, offshore Louisiana, Gulf of Mexico (Fig. 1). The well is located approximately 10 mi offshore in a water depth < 250 ft (80 m). The well penetrated the upper Miocene as indicated by the presence of the benthic foraminifera, Bolovina thalamannii at a depth of 13,070 ft (3983 m). The total depth of the well was 13,670 ft (4146 m).
The major rivers that currently supply sediment to this area of the Gulf are the Mississippi, Atchafalaya, Red, Sabine, and the Pearl. Over time all have switched the locations of their deltas, spreading the sediment over particular areas during distinct time periods. Each river drains a different source area, so the specific mix of sedi-ment at any geographic location in the Gulf of Mexico is a function of where the rivers were unloading their sedi-ment. Since the position of each river varies over time, it is expected that the sediment should also vary with time. Because time varies with depth in a well, the provenance of the sediment should vary with depth. The more easterly rivers would be expected to have an Appalachian dominated provenance, rich in metamorphic sedi-ments. The Colorado Plateau sources the more westerly rivers, which is mostly a felsic volcanic and plutonic igneous source.
The subsurface stratigraphy of southern Louisiana is not formally divided into formations, but is based on biostratigraphic units. The rocks penetrated by this well are alternating mudrocks and sandstones as seen from the wire-line log. The upper Miocene rocks are mainly deltaic sequences of alternating quartzose sands and clay-rich mudrocks (Anderson, 1976). In the Early Pliocene (indicated by the presence of benthic foraminifera Textu-laria X at 8700 ft or 2650 m), the mudrocks are thinner and the amount of inter-bedded sandstone increases. At
700
The Effect of Provenance on Clay Mineral Diagenesis in Gulf of Mexico Shales
Figure 1. Location of well used in this study (modified after Totten et al., 2002).
shallower depths, up to the Pliocene/Pleistocene boundary (Lenticulina at 5000 ft or 1540 m), mudrock and sand-stone are interbedded.
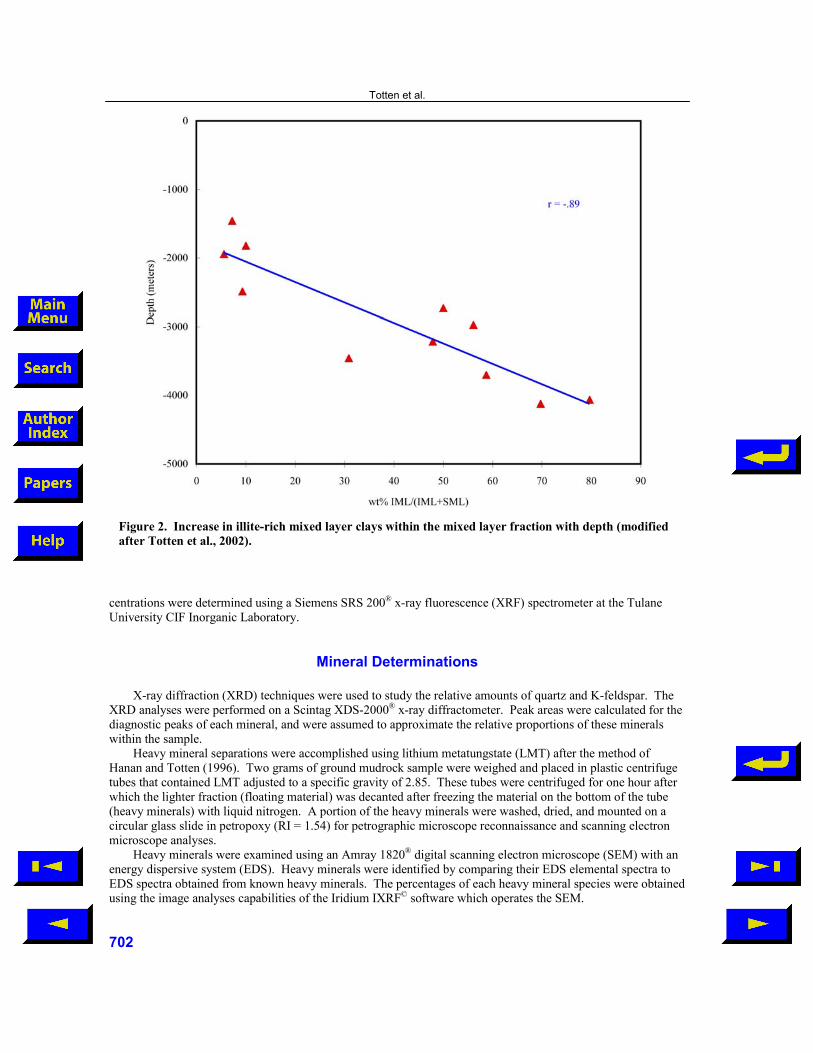
The conversion of smectite to illite has been documented within the same area as this study. Totten et al. (2005) reported an increase in illite-rich mixed layer clays and a corresponding decrease in smectite-rich mixed layers with increasing depth in the adjacent South Timbalier protraction block in a multi-well study. A previous clay mineral study (Totten et al., 2002) of the same Ship Shoal well samples reported an excellent correlation between the percentages of illite-rich layers with depth (Fig. 2).
METHODS The gamma ray and spontaneous potential well logs were used to identify mudrock-rich zones. Mudrock
cuttings were carefully picked using a binocular microscope from sample bags covering 10 meter intervals. Cut-tings were intentionally restricted to those that were angular and had a homogenous gray mudrock appearance. The more rounded mudrock cuttings were left out to avoid any suspected uphole cavings that may have come up with the drilling fluids. The shallowest sampled depth was at 4800 ft (1463 m.). The well was sampled at 200 ft (66 m) intervals, down to the final depth of 13,600 ft (4146 m). A minimum of 7 grams of mudrock was picked from each interval, weighed, and stored in plastic zippered bags.
The mudrock cuttings were crushed using mortar and pestle and stored in small glass vials. The samples were then washed with weak acetic acid solution (pH = 5.6) to remove any adsorbed cations from the surface of the mudrocks. The rinse solution was stored in plastic bottles for later analysis.
Elemental Analyses The major oxides K2O, Na2O, MgO, MnO, and TiO2 concentrations were determined using a Spectrascan®
V direct-coupled spectrometer (DCP). The major oxides SiO2, Al2O3, and CaO, as well as all trace-element con-
701
centrations were determined using a Siemens SRS 200® x-ray fluorescence (XRF) spectrometer at the Tulane University CIF Inorganic Laboratory.
Mineral Determinations X-ray diffraction (XRD) techniques were used to study the relative amounts of quartz and K-feldspar. The
XRD analyses were performed on a Scintag XDS-2000® x-ray diffractometer. Peak areas were calculated for the diagnostic peaks of each mineral, and were assumed to approximate the relative proportions of these minerals within the sample.
Heavy mineral separations were accomplished using lithium metatungstate (LMT) after the method of Hanan and Totten (1996). Two grams of ground mudrock sample were weighed and placed in plastic centrifuge tubes that contained LMT adjusted to a specific gravity of 2.85. These tubes were centrifuged for one hour after which the lighter fraction (floating material) was decanted after freezing the material on the bottom of the tube (heavy minerals) with liquid nitrogen. A portion of the heavy minerals were washed, dried, and mounted on a circular glass slide in petropoxy (RI = 1.54) for petrographic microscope reconnaissance and scanning electron microscope analyses.
Figure 2. Increase in illite-rich mixed layer clays within the mixed layer fraction with depth (modified after Totten et al., 2002).
Totten et al.
702
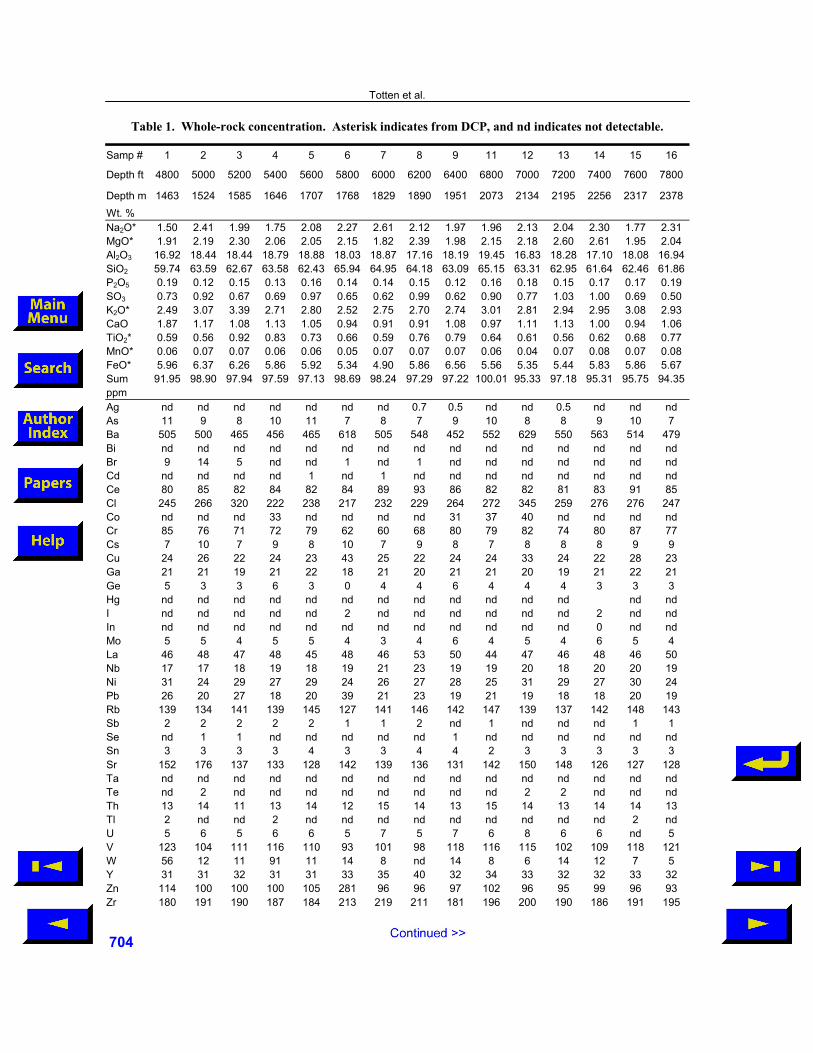
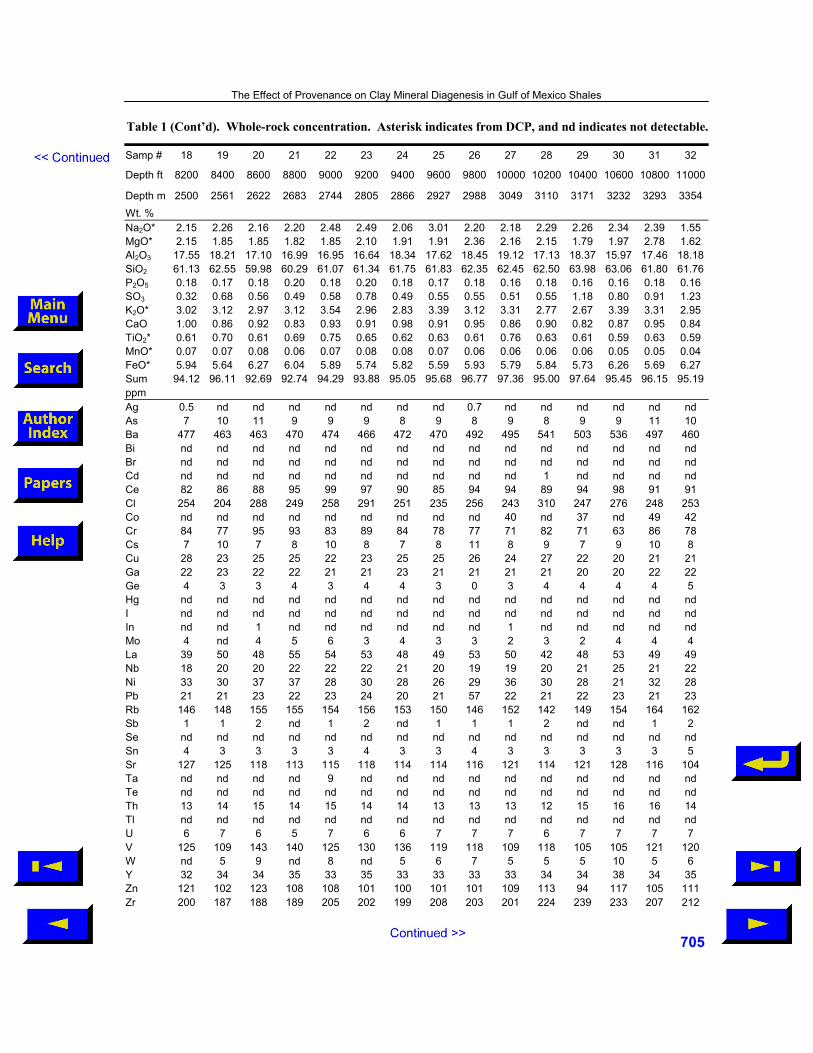
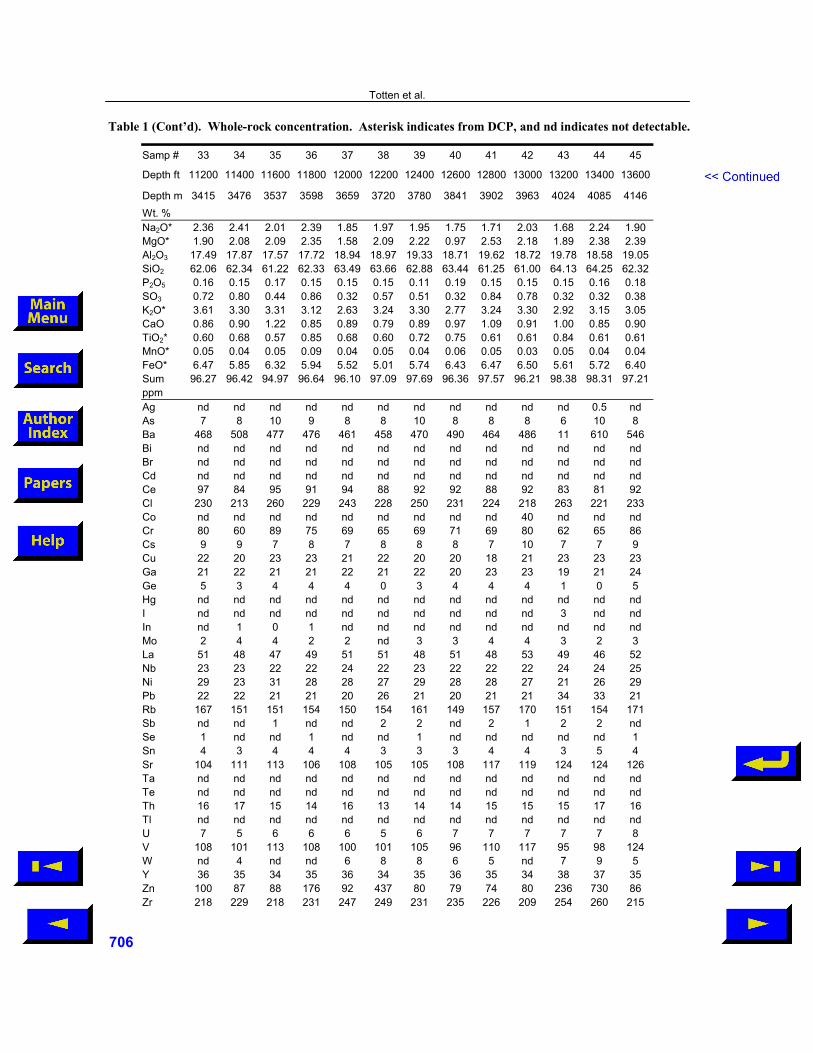
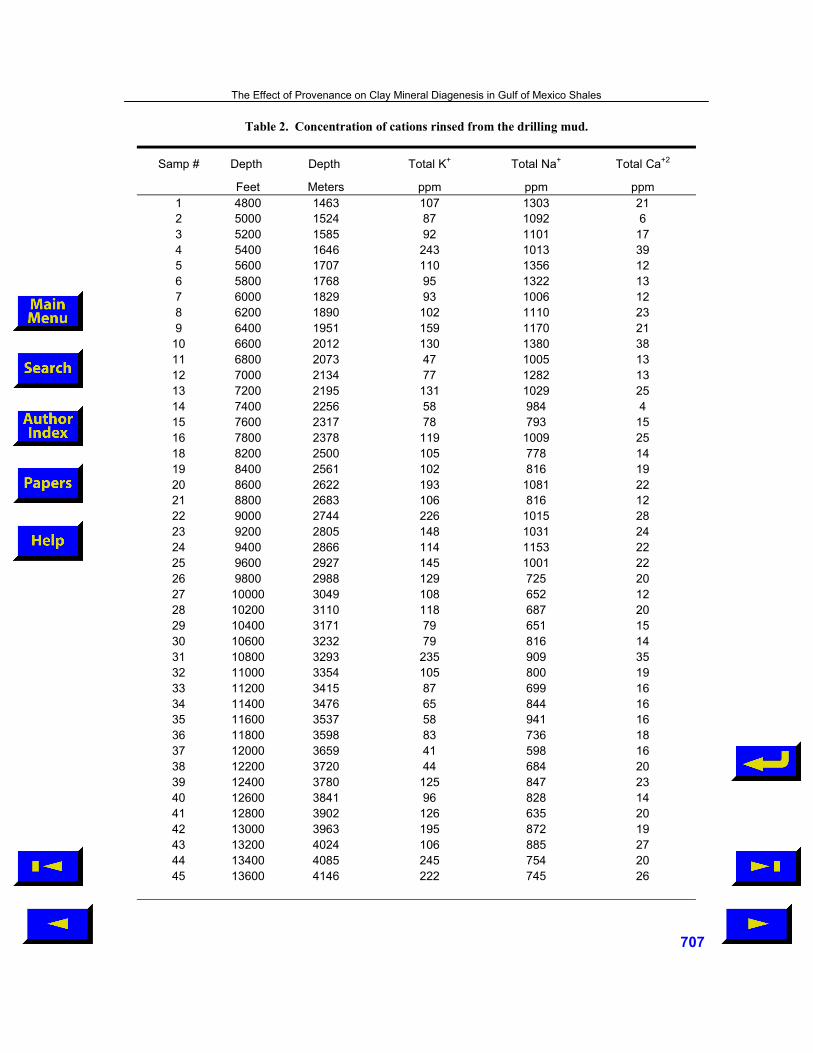
RESULTS Whole-rock chemical analyses are presented in Table 1. Major elements are reported in weight percent, and
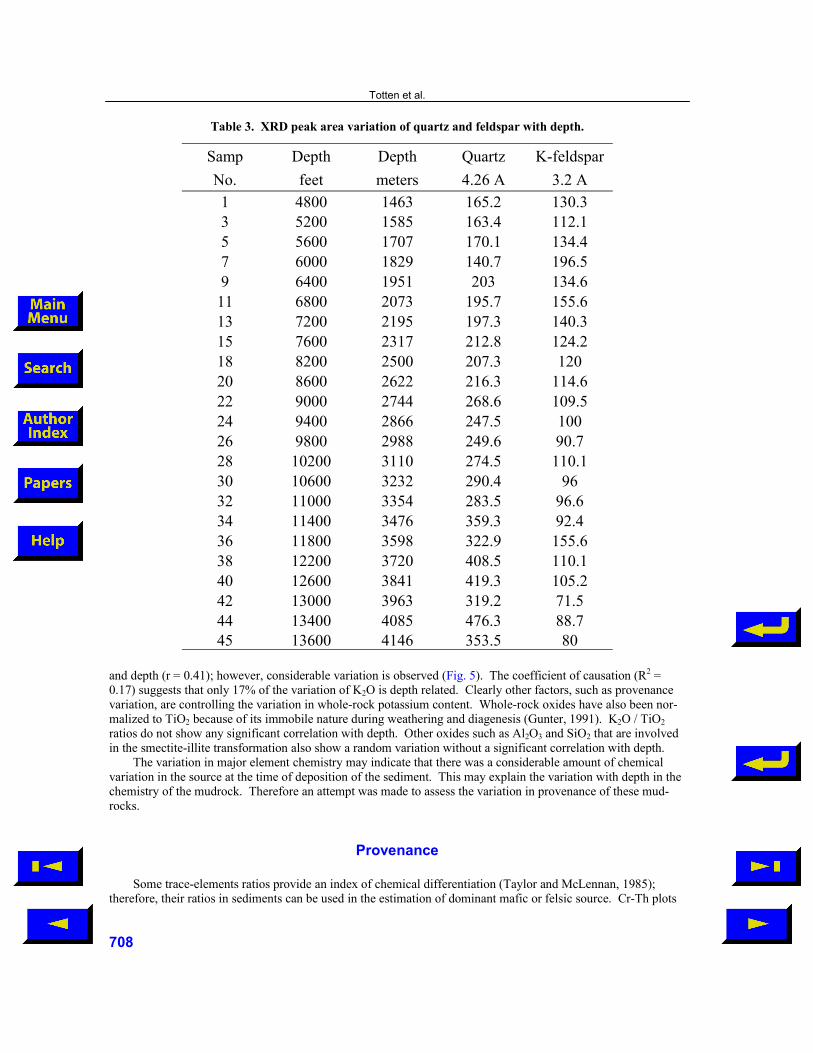
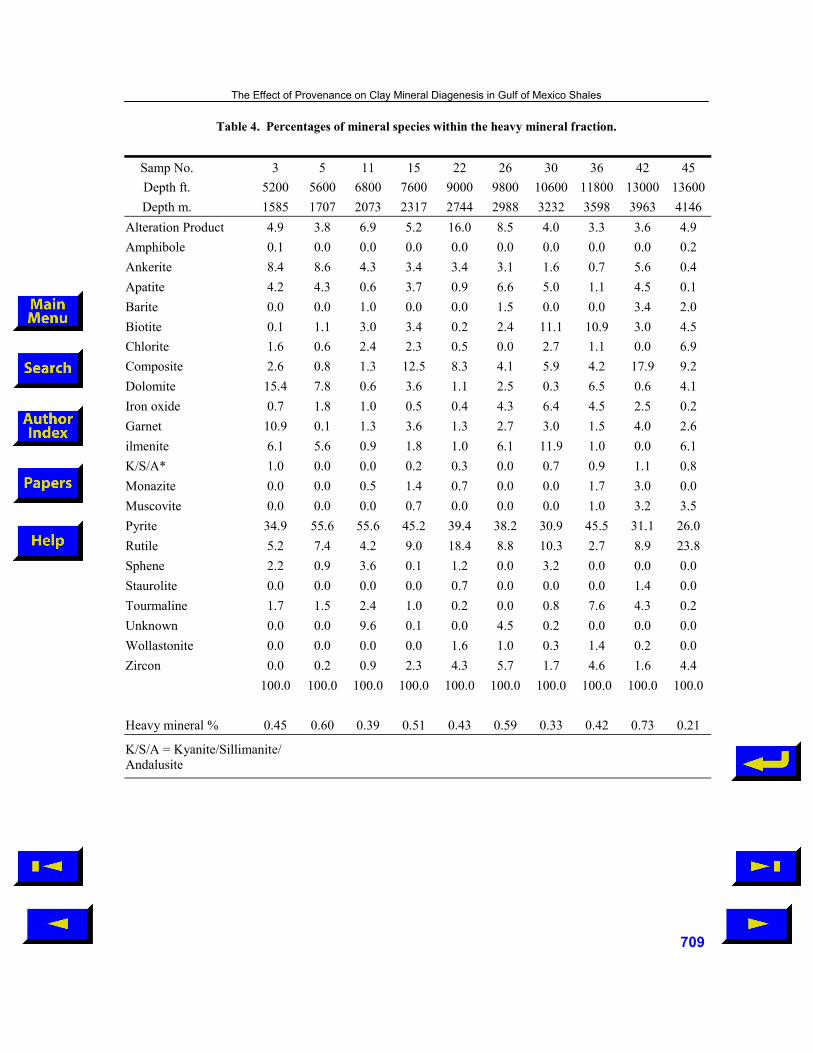
trace elements in parts per million. The major cation concentrations of the solution washed from the remnant drilling mud are given in Table 2. The area of the characteristic XRD peak for quartz and K-spar is reported in Table 3. The heavy mineral recoveries, as well as the percentage of each mineral species present, are reported in Table 4.
Pyrite was the most abundant of the heavy minerals. Most of the pyrite was authigenic as evidenced by framboids, often present in clusters and distinguishable by their spherical morphology. Ilmenite and TiO2 (reported in Table 4 as rutile) were the next most abundant. Rutile was present in larger quantities than ilmenite. Iron oxides were less common. Opaque heavy minerals were present at all depths. Minerals that were altering (primarily into the formation of iron oxides) were grouped together and called alteration products. The term ‘composites’ was given to those grains that showed the presence of more than one mineral in their EDS spectrum.
Among the micas, biotite was common and was more abundant at deeper depths, whereas muscovite was present only in deeper samples. Chlorite was present at almost all depths. The micas and chlorite had a flaky appearance and were present as relatively coarse grains. The carbonate heavy minerals were mainly ankerite and dolomite. Both ankerite and dolomite decrease in abundance with depth.
DISCUSSION
Influence of Drilling Fluids on Mudrock Fragments
To control the problems encountered while drilling through swelling clays (smectite) most drilling muds
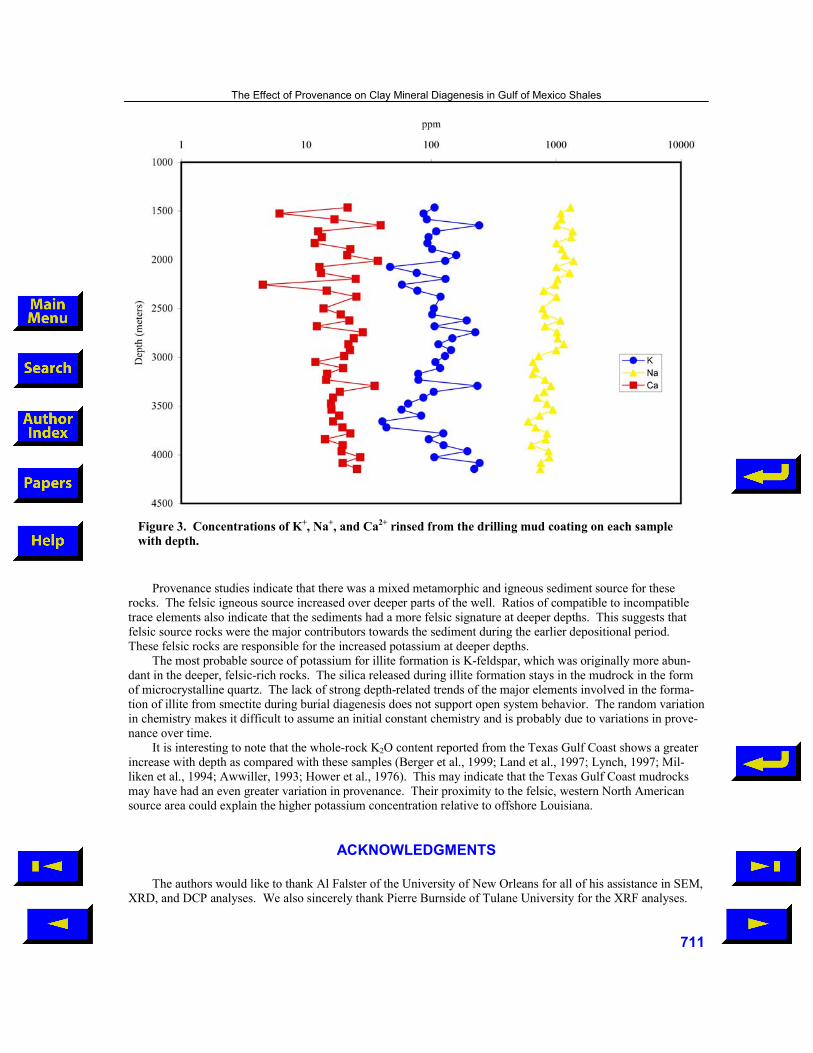
contain KCl solutions to stabilize these clays. We were interested whether these solutions influenced the chemis-try of the clays by increasing the adsorption of K+. Analyses of the rinse solutions did not reveal any significant contamination of K+ or Ca+2 from the drilling fluids (Fig. 3). The potassium concentration averages 100 ppm, not enough to affect the 1-2% increase in K2O down the well. The Na+ concentration of the rinse was present in ex-cess of 1000 ppm and shows a negative correlation with depth.
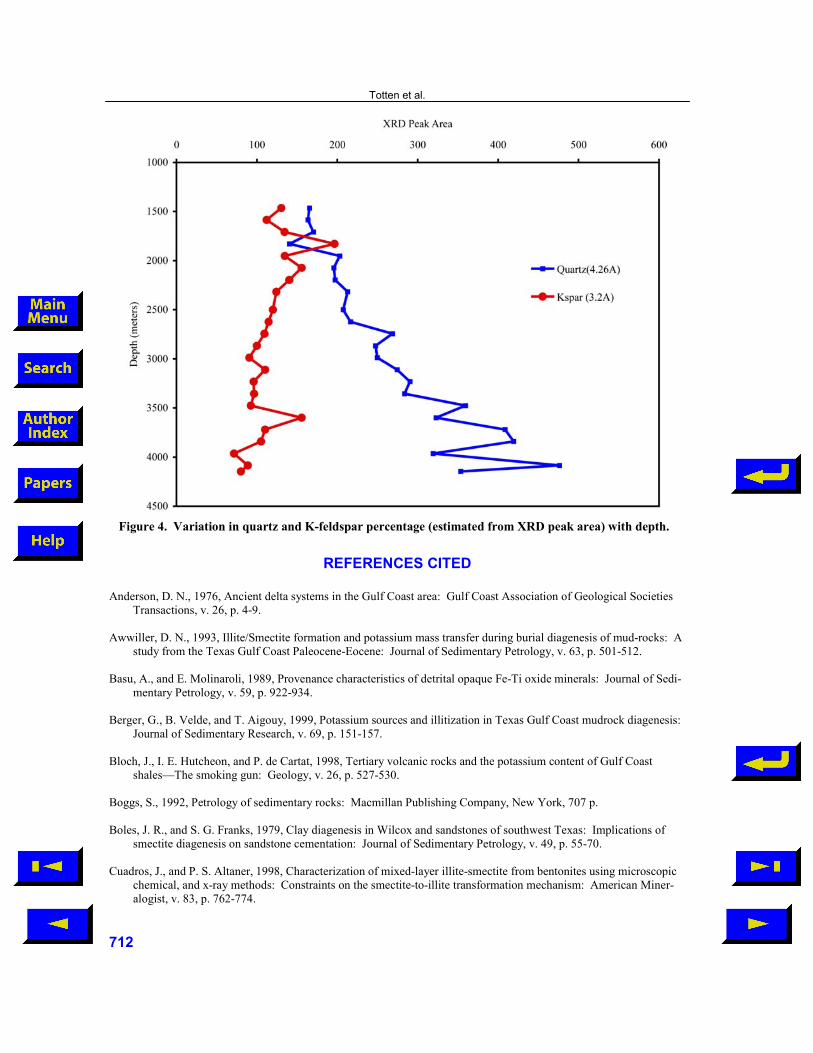
Mineral Trends with Depth Total areas of diagnostic XRD peaks of the major non-clay minerals were plotted with depth to determine
their relative change (Fig. 4). The intensity of the quartz peak (4.26 Å, angstroms) increases with depth suggest-ing that it becomes more abundant. A corresponding decrease in K-feldspar (3.2 Å) is observed. Our previous work on samples from the same well showed an increase in illite relative to smectite over the same interval (Totten et al., 2002). In addition to increasing in percentage, illite peaks also sharpened with depth, indicating increased crystallinity. We interpret the increase in quartz to be due to the release of silica during the smectite-illite transformation. In contrast, the gradual loss of K-feldspar provided the K2O and Al2O3 for the formation of illite. All of these trends are consistent with reported mineralogical trends during burial diagenesis in mudrocks from the Texas Gulf Coast.
The percentage of the total heavy-mineral fraction within the shale did not show any significant trend with depth. Variation in individual heavy-mineral species was observed, as discussed below.
Chemical Variation with Depth The formation of illite requires the addition of K+ and Al+3, and is accompanied by the release of Si+4, H2O
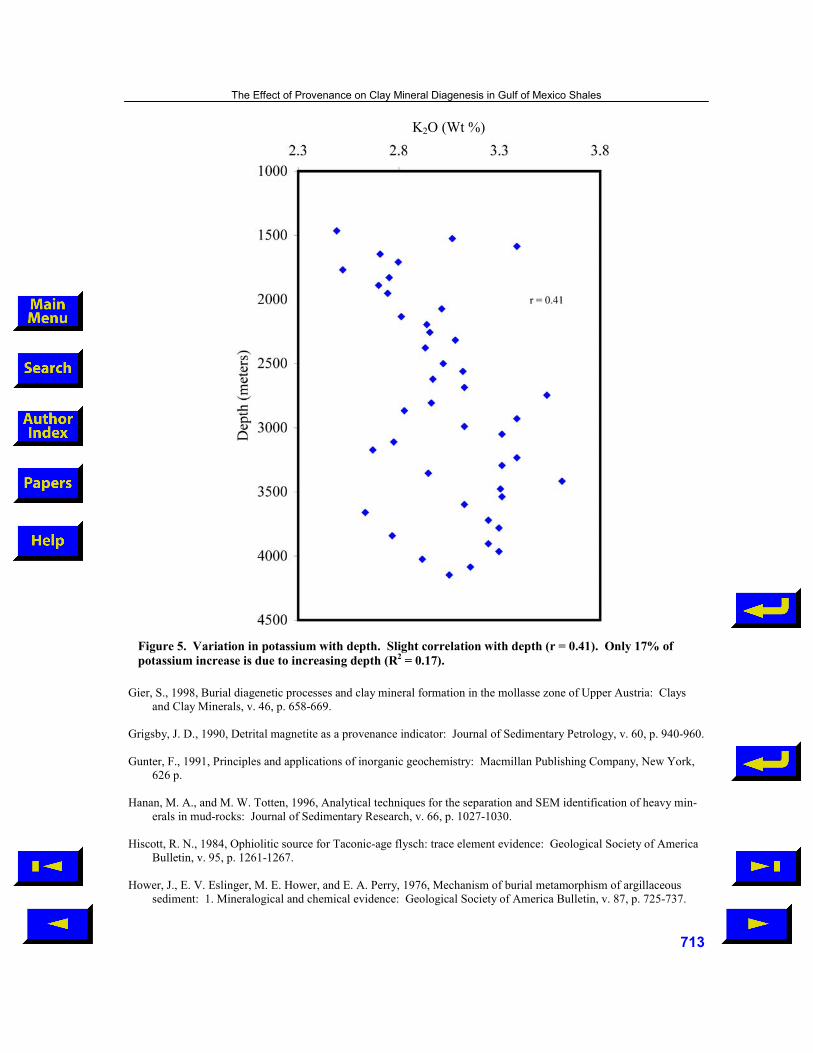
and other cations like Na+, Ca+2, Mg+2 and Fe+2. The increase in the amount of whole-rock K2O, which is some-times accompanied by the increase of Al2O3, is the most commonly reported chemical change during burial diagenesis (Lynch, 1997; Hower et al., 1976). Our mudrocks show that a weak correlation exists between K2O
The Effect of Provenance on Clay Mineral Diagenesis in Gulf of Mexico Shales
Table 3. XRD peak area variation of quartz and feldspar with depth.
and depth (r = 0.41); however, considerable variation is observed (Fig. 5). The coefficient of causation (R2 = 0.17) suggests that only 17% of the variation of K2O is depth related. Clearly other factors, such as provenance variation, are controlling the variation in whole-rock potassium content. Whole-rock oxides have also been nor-malized to TiO2 because of its immobile nature during weathering and diagenesis (Gunter, 1991). K2O / TiO2 ratios do not show any significant correlation with depth. Other oxides such as Al2O3 and SiO2 that are involved in the smectite-illite transformation also show a random variation without a significant correlation with depth.
The variation in major element chemistry may indicate that there was a considerable amount of chemical variation in the source at the time of deposition of the sediment. This may explain the variation with depth in the chemistry of the mudrock. Therefore an attempt was made to assess the variation in provenance of these mud-rocks.
Provenance Some trace-elements ratios provide an index of chemical differentiation (Taylor and McLennan, 1985);
therefore, their ratios in sediments can be used in the estimation of dominant mafic or felsic source. Cr-Th plots
Heavy mineral % 0.45 0.60 0.39 0.51 0.43 0.59 0.33 0.42 0.73 0.21
K/S/A = Kyanite/Sillimanite/Andalusite
Table 4. Percentages of mineral species within the heavy mineral fraction.
The Effect of Provenance on Clay Mineral Diagenesis in Gulf of Mexico Shales
709
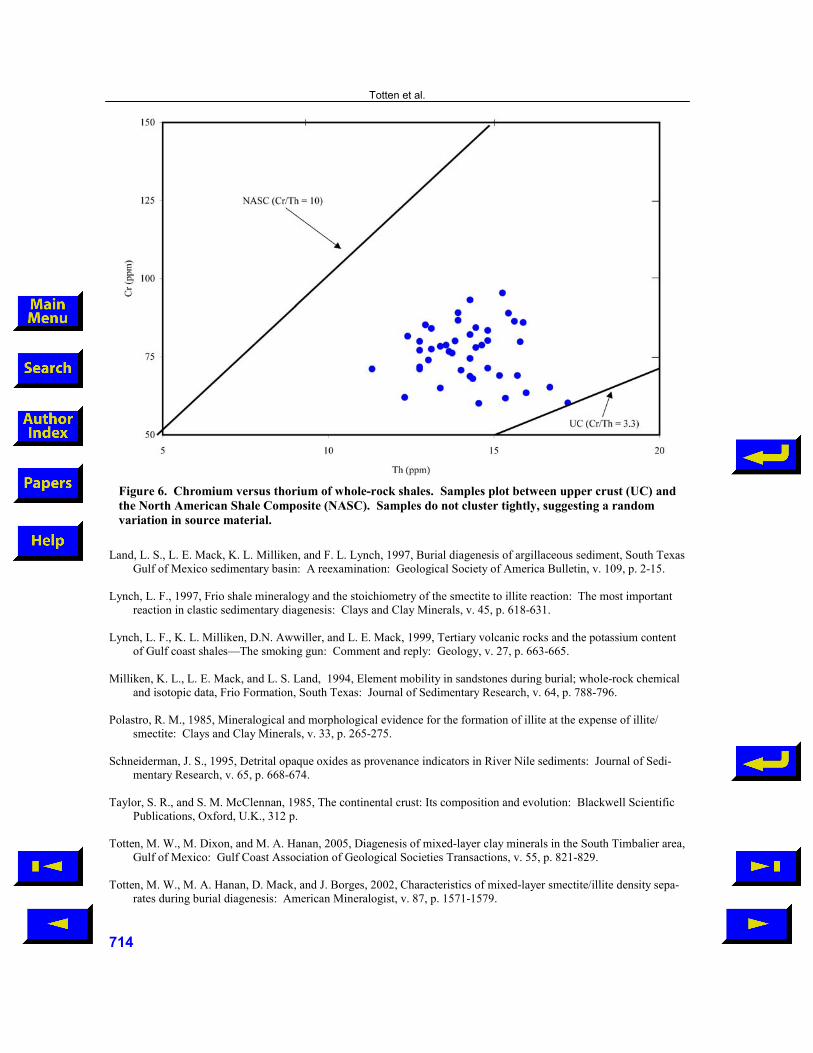
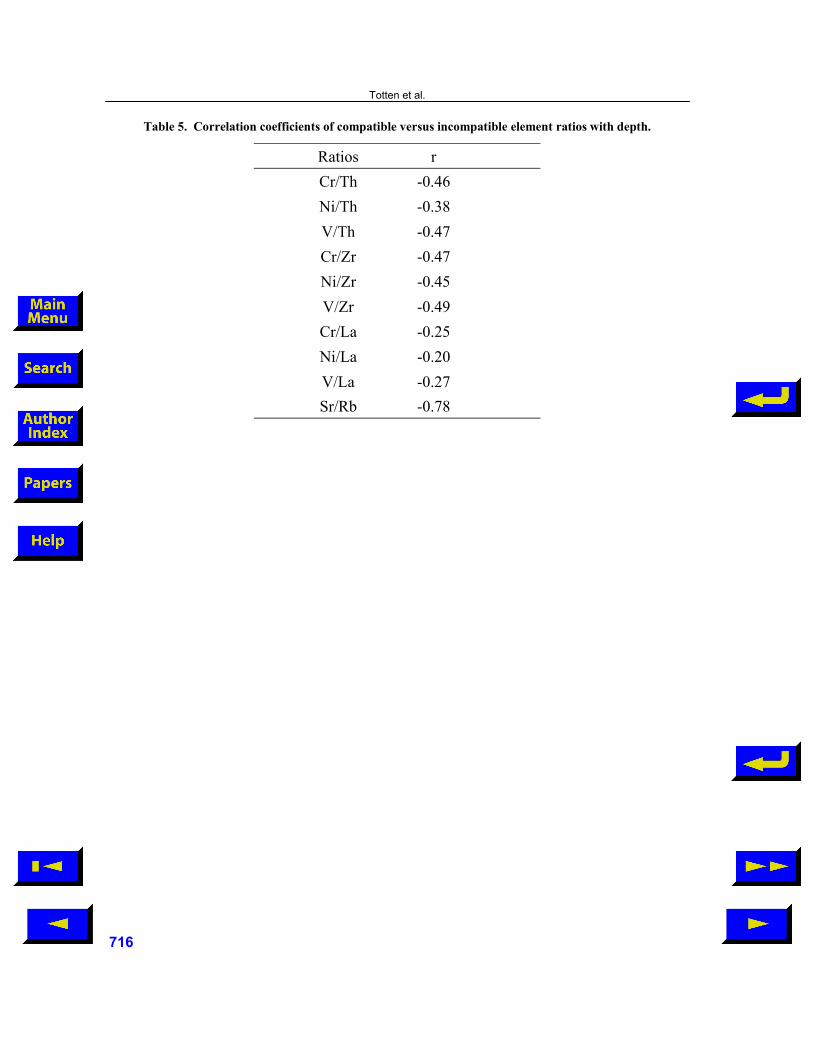
(Fig. 6) show that these sediments fall within the upper crust area and have a continental signature. The Cr/Th ratios also decrease when plotted with depth, suggesting a depletion of chromium in the sediment with respect to thorium. Similarly, ratios of other compatible (Ni, V) to incompatible (Th, Zr) elements decrease with increased depth (reflected in the negative correlations reported in Table 5). All of these elements are high-field strength elements, and are considered immobile. Their ratios should not change due to diagenesis, therefore their correla-tion with depth suggests a change in source over time. The increase in incompatibles suggests that the deeper sediments were derived from more fractionated rocks, felsic in composition.
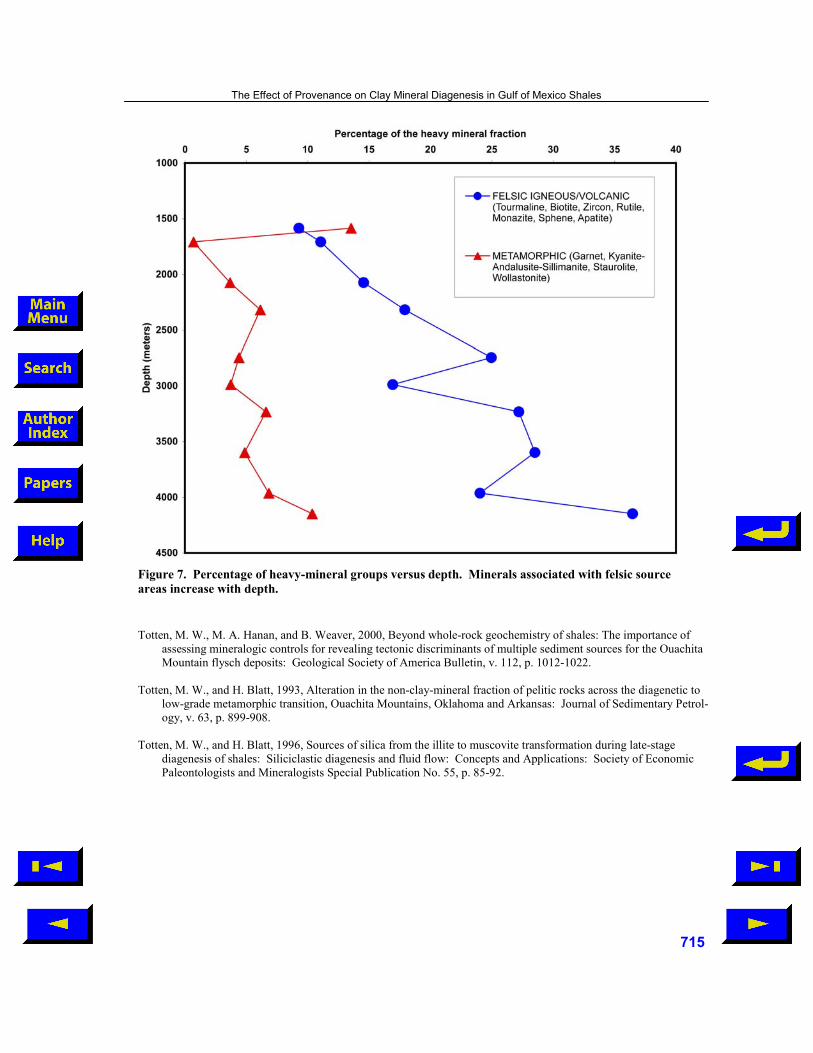
To confirm the increase in felsic source material in deeper samples suggested by the trace-element data, the heavy mineral fraction was examined in a manner often used in sandstones. Heavy mineral species were grouped into suites based upon the major rock types in which they commonly occur (Boggs, 1992). Dolomite, ankerite, and siderite were grouped together as carbonates. The metamorphic group contained kyanite-andalusite-sillimanite, staurolite, wollastonite and garnet. Felsic igneous rocks are represented by tourmaline, biotite, mus-covite, zircon, rutile, monazite, sphene and apatite.
The percentage of the metamorphic suite and the felsic igneous heavy-mineral suite versus depth is shown in Figure 7. The felsic igneous heavy minerals show a consistent increase with depth from less than 10% to near 40% of the total heavy-mineral fraction. The metamorphic minerals show a more moderate increase with depth. The increase in felsic igneous heavy minerals with depth is consistent with the increase in felsic source suggested by the trace element data.
This mixed provenance is not unlike the source areas that provide sediment to the modern Gulf of Mexico. Varying mixtures of sediment from a dominantly metamorphic Appalachian source and a felsic, western North American source are controlled by a dynamic drainage system. Changes in river and deltaic positions, variations
in climate in the source areas, and changes in tectonic activity, can exert major controls on the mixture of these two areas at specific times. In the deeper part of the studied well, the felsic igneous source appears dominant, and this source has gradually diminished over time, relative to a metamorphic source.
Felsic igneous rocks are typically enriched in potassium. The observed increase in potassium with depth could be a result of an increase in a felsic igneous provenance, as suggested by Bloch et al. (1998).
PROVENANCE OR DIAGENESIS? Our previous work (Totten et al., 2002) reported the transformation of smectite to illite with increased depth.
This study confirms the increased K2O with depth, in the Ship Shoal area of the Gulf of Mexico. This is consis-tent with trends seen in other GOM mudrocks. Where did the potassium come from? If the potassium that is required for illite formation is imported into the mudrock from an external source, there should be a gradual in-crease in the total K2O content as the reaction progresses. In this study, the coefficient of causation (R2) suggests that only 17 % of the increase is depth related. A similar increase should be observed for Al2O3 if it is supplied from an external source, which is not observed in this study. Correspondingly, any silica released during the reaction that leaves the mudrock would cause the total SiO2 to decrease. This is also not observed in these rocks. In contrast, the growth of quartz with depth suggests that the released silica remains within the mudrock.
The increase in K2O could be due to an increase in a felsic source area. The increase in this source relative to a metamorphic province would not necessarily change the SiO2 or Al2O3 concentrations over a metamorphic terrain. In this scenario, the required elements for clay mineral transformations are within the rock itself, and do not need to be imported from outside the mudrock system.
CONCLUSIONS The mudrocks in this area of offshore Louisiana showed similar mineralogical changes as seen in Texas Gulf
Coast mudrocks. The smectite to illite transformation took place over a depth interval from 4800 to 13,600 ft (1463 to 4146 m) and is accompanied by the loss of K-feldspar and an increase in the amount of quartz.
Whole-rock Al2O3 and SiO2 did not show any depth-related trends. The amount of K2O varied between 2.5 and 3.6 wt % and showed a slight increasing trend with depth. However, only 17 % of the increase is depth re-lated. When K2O is normalized to TiO2 the correlation disappears.
Totten et al.
710
Figure 3. Concentrations of K+, Na+, and Ca2+ rinsed from the drilling mud coating on each sample with depth.
Provenance studies indicate that there was a mixed metamorphic and igneous sediment source for these rocks. The felsic igneous source increased over deeper parts of the well. Ratios of compatible to incompatible trace elements also indicate that the sediments had a more felsic signature at deeper depths. This suggests that felsic source rocks were the major contributors towards the sediment during the earlier depositional period. These felsic rocks are responsible for the increased potassium at deeper depths.
The most probable source of potassium for illite formation is K-feldspar, which was originally more abun-dant in the deeper, felsic-rich rocks. The silica released during illite formation stays in the mudrock in the form of microcrystalline quartz. The lack of strong depth-related trends of the major elements involved in the forma-tion of illite from smectite during burial diagenesis does not support open system behavior. The random variation in chemistry makes it difficult to assume an initial constant chemistry and is probably due to variations in prove-nance over time.
It is interesting to note that the whole-rock K2O content reported from the Texas Gulf Coast shows a greater increase with depth as compared with these samples (Berger et al., 1999; Land et al., 1997; Lynch, 1997; Mil-liken et al., 1994; Awwiller, 1993; Hower et al., 1976). This may indicate that the Texas Gulf Coast mudrocks may have had an even greater variation in provenance. Their proximity to the felsic, western North American source area could explain the higher potassium concentration relative to offshore Louisiana.
ACKNOWLEDGMENTS The authors would like to thank Al Falster of the University of New Orleans for all of his assistance in SEM,
XRD, and DCP analyses. We also sincerely thank Pierre Burnside of Tulane University for the XRF analyses.
The Effect of Provenance on Clay Mineral Diagenesis in Gulf of Mexico Shales
711
Figure 4. Variation in quartz and K-feldspar percentage (estimated from XRD peak area) with depth.
REFERENCES CITED
Anderson, D. N., 1976, Ancient delta systems in the Gulf Coast area: Gulf Coast Association of Geological Societies Transactions, v. 26, p. 4-9.
Awwiller, D. N., 1993, Illite/Smectite formation and potassium mass transfer during burial diagenesis of mud-rocks: A
study from the Texas Gulf Coast Paleocene-Eocene: Journal of Sedimentary Petrology, v. 63, p. 501-512. Basu, A., and E. Molinaroli, 1989, Provenance characteristics of detrital opaque Fe-Ti oxide minerals: Journal of Sedi-
mentary Petrology, v. 59, p. 922-934. Berger, G., B. Velde, and T. Aigouy, 1999, Potassium sources and illitization in Texas Gulf Coast mudrock diagenesis:
Journal of Sedimentary Research, v. 69, p. 151-157. Bloch, J., I. E. Hutcheon, and P. de Cartat, 1998, Tertiary volcanic rocks and the potassium content of Gulf Coast
shales—The smoking gun: Geology, v. 26, p. 527-530. Boggs, S., 1992, Petrology of sedimentary rocks: Macmillan Publishing Company, New York, 707 p. Boles, J. R., and S. G. Franks, 1979, Clay diagenesis in Wilcox and sandstones of southwest Texas: Implications of
smectite diagenesis on sandstone cementation: Journal of Sedimentary Petrology, v. 49, p. 55-70. Cuadros, J., and P. S. Altaner, 1998, Characterization of mixed-layer illite-smectite from bentonites using microscopic
chemical, and x-ray methods: Constraints on the smectite-to-illite transformation mechanism: American Miner-alogist, v. 83, p. 762-774.
Totten et al.
712
Figure 5. Variation in potassium with depth. Slight correlation with depth (r = 0.41). Only 17% of potassium increase is due to increasing depth (R2 = 0.17).
Gier, S., 1998, Burial diagenetic processes and clay mineral formation in the mollasse zone of Upper Austria: Clays and Clay Minerals, v. 46, p. 658-669.
Grigsby, J. D., 1990, Detrital magnetite as a provenance indicator: Journal of Sedimentary Petrology, v. 60, p. 940-960. Gunter, F., 1991, Principles and applications of inorganic geochemistry: Macmillan Publishing Company, New York,
626 p. Hanan, M. A., and M. W. Totten, 1996, Analytical techniques for the separation and SEM identification of heavy min-
erals in mud-rocks: Journal of Sedimentary Research, v. 66, p. 1027-1030. Hiscott, R. N., 1984, Ophiolitic source for Taconic-age flysch: trace element evidence: Geological Society of America
Bulletin, v. 95, p. 1261-1267. Hower, J., E. V. Eslinger, M. E. Hower, and E. A. Perry, 1976, Mechanism of burial metamorphism of argillaceous
sediment: 1. Mineralogical and chemical evidence: Geological Society of America Bulletin, v. 87, p. 725-737.
The Effect of Provenance on Clay Mineral Diagenesis in Gulf of Mexico Shales
K2O (Wt %)
713
Figure 6. Chromium versus thorium of whole-rock shales. Samples plot between upper crust (UC) and the North American Shale Composite (NASC). Samples do not cluster tightly, suggesting a random variation in source material.
Land, L. S., L. E. Mack, K. L. Milliken, and F. L. Lynch, 1997, Burial diagenesis of argillaceous sediment, South Texas Gulf of Mexico sedimentary basin: A reexamination: Geological Society of America Bulletin, v. 109, p. 2-15.
Lynch, L. F., 1997, Frio shale mineralogy and the stoichiometry of the smectite to illite reaction: The most important
reaction in clastic sedimentary diagenesis: Clays and Clay Minerals, v. 45, p. 618-631. Lynch, L. F., K. L. Milliken, D.N. Awwiller, and L. E. Mack, 1999, Tertiary volcanic rocks and the potassium content
of Gulf coast shales—The smoking gun: Comment and reply: Geology, v. 27, p. 663-665. Milliken, K. L., L. E. Mack, and L. S. Land, 1994, Element mobility in sandstones during burial; whole-rock chemical
and isotopic data, Frio Formation, South Texas: Journal of Sedimentary Research, v. 64, p. 788-796. Polastro, R. M., 1985, Mineralogical and morphological evidence for the formation of illite at the expense of illite/
smectite: Clays and Clay Minerals, v. 33, p. 265-275. Schneiderman, J. S., 1995, Detrital opaque oxides as provenance indicators in River Nile sediments: Journal of Sedi-
mentary Research, v. 65, p. 668-674. Taylor, S. R., and S. M. McClennan, 1985, The continental crust: Its composition and evolution: Blackwell Scientific
Publications, Oxford, U.K., 312 p. Totten, M. W., M. Dixon, and M. A. Hanan, 2005, Diagenesis of mixed-layer clay minerals in the South Timbalier area,
Gulf of Mexico: Gulf Coast Association of Geological Societies Transactions, v. 55, p. 821-829. Totten, M. W., M. A. Hanan, D. Mack, and J. Borges, 2002, Characteristics of mixed-layer smectite/illite density sepa-
rates during burial diagenesis: American Mineralogist, v. 87, p. 1571-1579.
Totten et al.
714
Totten, M. W., M. A. Hanan, and B. Weaver, 2000, Beyond whole-rock geochemistry of shales: The importance of
assessing mineralogic controls for revealing tectonic discriminants of multiple sediment sources for the Ouachita Mountain flysch deposits: Geological Society of America Bulletin, v. 112, p. 1012-1022.
Totten, M. W., and H. Blatt, 1993, Alteration in the non-clay-mineral fraction of pelitic rocks across the diagenetic to
low-grade metamorphic transition, Ouachita Mountains, Oklahoma and Arkansas: Journal of Sedimentary Petrol-ogy, v. 63, p. 899-908.
Totten, M. W., and H. Blatt, 1996, Sources of silica from the illite to muscovite transformation during late-stage
diagenesis of shales: Siliciclastic diagenesis and fluid flow: Concepts and Applications: Society of Economic Paleontologists and Mineralogists Special Publication No. 55, p. 85-92.
Figure 7. Percentage of heavy-mineral groups versus depth. Minerals associated with felsic source areas increase with depth.
The Effect of Provenance on Clay Mineral Diagenesis in Gulf of Mexico Shales