Brigham Young University Brigham Young University BYU ScholarsArchive BYU ScholarsArchive Theses and Dissertations 2004-07-08 The Effect of Religiosity and Spirituality on Work Practices and The Effect of Religiosity and Spirituality on Work Practices and Trust Levels in Managers and their Subordinates in Food and Trust Levels in Managers and their Subordinates in Food and Nutrition Care Departments Nutrition Care Departments Jennifer S. Oler Brigham Young University - Provo Follow this and additional works at: https://scholarsarchive.byu.edu/etd Part of the Food Science Commons, and the Nutrition Commons BYU ScholarsArchive Citation BYU ScholarsArchive Citation Oler, Jennifer S., "The Effect of Religiosity and Spirituality on Work Practices and Trust Levels in Managers and their Subordinates in Food and Nutrition Care Departments" (2004). Theses and Dissertations. 556. https://scholarsarchive.byu.edu/etd/556 This Thesis is brought to you for free and open access by BYU ScholarsArchive. It has been accepted for inclusion in Theses and Dissertations by an authorized administrator of BYU ScholarsArchive. For more information, please contact [email protected], [email protected].
Transcript
Brigham Young University Brigham Young University
BYU ScholarsArchive BYU ScholarsArchive
Theses and Dissertations
2004-07-08
The Effect of Religiosity and Spirituality on Work Practices and The Effect of Religiosity and Spirituality on Work Practices and
Trust Levels in Managers and their Subordinates in Food and Trust Levels in Managers and their Subordinates in Food and
Nutrition Care Departments Nutrition Care Departments
Jennifer S. Oler Brigham Young University - Provo
Follow this and additional works at: https://scholarsarchive.byu.edu/etd
Part of the Food Science Commons, and the Nutrition Commons
BYU ScholarsArchive Citation BYU ScholarsArchive Citation Oler, Jennifer S., "The Effect of Religiosity and Spirituality on Work Practices and Trust Levels in Managers and their Subordinates in Food and Nutrition Care Departments" (2004). Theses and Dissertations. 556. https://scholarsarchive.byu.edu/etd/556
This Thesis is brought to you for free and open access by BYU ScholarsArchive. It has been accepted for inclusion in Theses and Dissertations by an authorized administrator of BYU ScholarsArchive. For more information, please contact [email protected], [email protected].
THE EFFECT OF RELIGIOSITY AND SPIRITUALITY ON WORK PRACTICES
AND TRUST LEVELS IN MANAGERS AND THEIR SUBORDINATES IN FOOD
AND NUTRITION CARE DEPARTMENTS
by
Jennifer S. Oler
A thesis submitted to the faculty of
Brigham Young University
In partial fulfillment of the requirement for the degree of
Masters of Science
Department of Nutrition, Dietetics, and Food Science
Brigham Young University
August 2004
BRIGHAM YOUNG UNIVERSITY
GRADUATE COMMITTEE APPROVAL
of a thesis submitted by
Jennifer S. Oler
This thesis has been read by each member of the following graduate committee and by majority vote has been found to be satisfactory.
___________________________ _________________________________ Date Nora K. Nyland, Chair ___________________________ _________________________________ Date Lora Beth Brown ___________________________ _________________________________ Date Lori Lee Wadsworth
BRIGHAM YOUNG UNIVERSITY
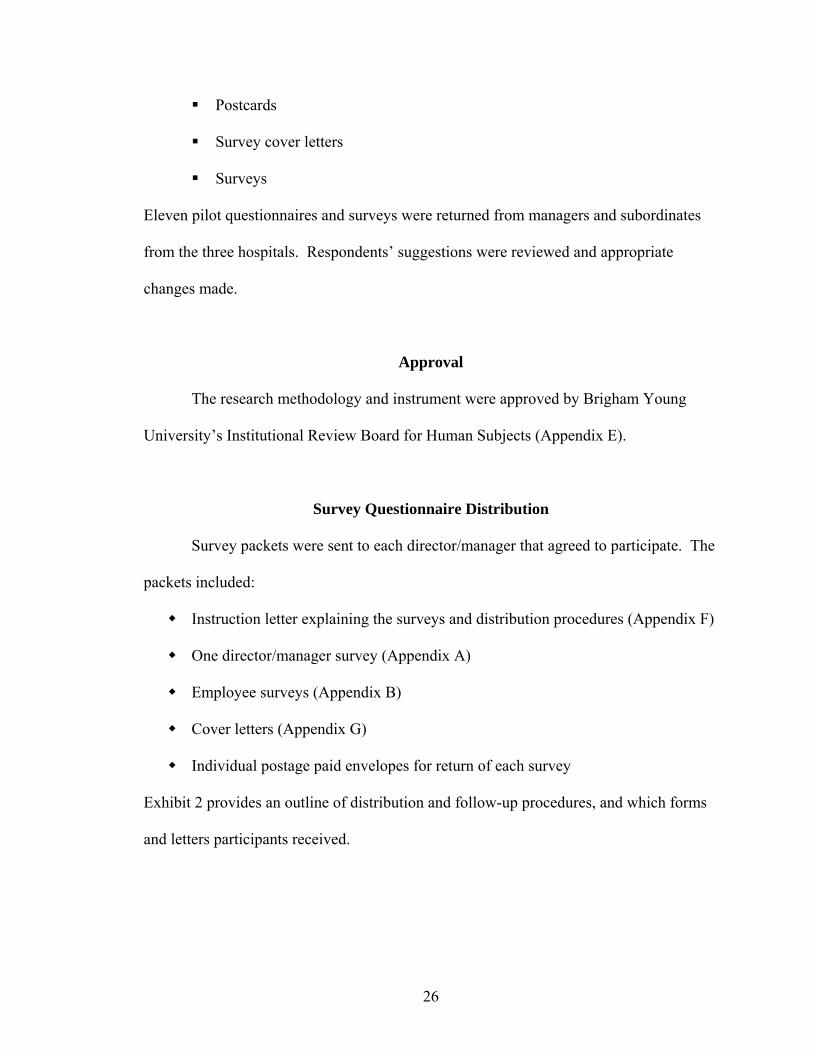
As chair of the candidate’s graduate committee, I have read the dissertation of Jennifer S. Oler in its final form and have found that (1) its format, citations, and bibliographical style are consistent and acceptable and fulfill university and department style requirements; (2) its illustrative materials including figures, tables, and charts are in place; and (3) the final manuscript is satisfactory to the graduate committee and is ready for submission to the university library.
___________________________ _________________________________ Date Nora K. Nyland Chair, Graduate Committee
Accepted for the Department
_________________________________ Merrill J. Christensen Graduate Coordinator Accepted for the College _________________________________ R. Kent Crookston Dean, College of Biology and Agriculture
ABSTRACT
THE EFFECT OF RELIGIOSITY AND SPIRITUALITY ON WORK PRACTICES
AND TRUST LEVELS IN MANAGERS AND THEIR SUBORDINATES IN FOOD
AND NUTRITION CARE DEPARTMENTS
Jennifer S. Oler
Department of Nutrition, Dietetics, and Food Science
Masters of Nutritional Science
The purpose of this study was to examine the extent to which religiosity and
spirituality affected daily work practices and leader/follower trust levels in foodservice
and nutrition directors and their subordinates. A similar 72-item survey questionnaire
was developed for both the directors and employees, which was completed by 129
directors and 530 employees. Both questionnaires contained questions on demographics,
religious influences on work practices, trust characteristics, and three validated measures
of religiosity: 1) worship service attendance (1=Religiosity Score), 2) influence of
spiritual beliefs on daily life, and 3) frequency of prayer (2 + 3=Spirituality Score).
Frequency data was gathered for all questions. Analysis of variance (ANOVA) and
Pearson’s Correlation were used to assess the relationship of directors’ and employees’
Religiosity and Spirituality Scores compared to their daily work practices and trust levels.
Two-sample t-tests evaluated differences in directors’ and employees’ perceived trust
levels toward each other.
Most directors and employees were women and Caucasian. Most of the directors
and employees had earned a Master’s degree and bachelor’s degree, respectively. The
religion most frequently reported was Protestant. Data analysis of the Religiosity and
Spirituality Scores and demographics showed some differences in ethnic group, gender,
age, and education level, although there was no consistently identified trend.
Well over one-third of directors (40.3%) and employees (36.3%) attended
worship services at least four times the previous month. The more directors and
employees attended worship services, the more likely they were to demonstrate specific
spiritual actions and attitudes at work. Generally, religiosity and spirituality did not
appear to influence perceived trustworthiness in directors and employees. However, both
directors and employees were rated as being highly trustworthy by their counterpart(s).
Directors and employees tend to over-rate their own trustworthiness when compared to
ratings by the opposite discipline. Degree of religiosity and spirituality did not
consistently affect the way directors and employees rated each others’ trustworthiness
though it was related to how they perceived their own trustworthiness. Directors
expected that their employees were more committed to their jobs than they actually were.
ACKNOWLEDGMENTS
I want to express my deep appreciation and love for all those that supported and
encouraged me in this endeavor. First, special thanks to my advisor and friend Dr. Nora
Nyland, for her patience, encouragement, enthusiasm, and belief in my ability throughout
the duration of this project. I appreciate the support and encouragement of my committee
members, Dr. Lora Beth Brown and Dr. Lori Wadsworth. Thanks also to my dear friend
and research “buddy” Anna Sarver, for making a sometimes tedious job fun and
memorable. I would not have been here without her.
Thanks to all my friends and family who made me laugh daily helping me to keep
things in perspective. I appreciate all their help and words of encouragement. I am
grateful to my parents who taught me the importance of education and helped me believe
I could accomplish anything. I appreciate their prayers, advice and motivating examples.
Most importantly, I am grateful to my Savior who never left me alone in times of need
and provided me with the strength and determination to keep going.
vi
vii
TABLE OF CONTENTS
Title Page ............................................................................................................................. i
Graduate Committee Approval........................................................................................... ii Final Reading Approval and Acceptance .......................................................................... iii Abstract.............................................................................................................................. iv Acknowledgments ............................................................................................................. vi Table of Contents.............................................................................................................. vii Introduction......................................................................................................................... 1
Further Research ............................................................................................................... 68 References......................................................................................................................... 69 Appendices
Appendix A: Director Questionnaire ............................................................................ 77
Appendix I .................................................................................................................. 106
Appendix J .................................................................................................................. 112 List of Tables
Table 1: Demographic Characteristics of Respondents ................................................ 32 Table 2: Demographics by Religiosity and Spirituality Score...................................... 38 Table 3: Religious Beliefs/Spirituality Influence on Work Practices........................... 41 Table 4: Religious/Spiritual Actions in the Workplace ................................................ 41 Table 5: Influence of Religious Beliefs/Spirituality by Religiosity Score ................... 44 Table 6: Influence of Religious Beliefs/Spirituality by Spirituality Score ................... 45 Table 7: Spiritual Actions by Religiosity Score ........................................................... 47 Table 8: Spiritual Actions by Spirituality Score ........................................................... 48
xi
Table 9: Trustworthiness of Directors .......................................................................... 50 Table 10: Director and Employee Response Differences for Trust Questions............. 50 Table 11: Trustworthy Actions of Directors................................................................. 51 Table 12: Trustworthiness of Employees ..................................................................... 51 Table 13: Directors’ Trust by Directors’ Religiosity Score.......................................... 54 Table 14: Directors’ Trust by Directors’ Spirituality Score ......................................... 55 Table 15: Employee-Rated Directors’ Trust by Employees’ Religiosity Score ........... 58 Table 16: Employee-Rated Directors’ Trust by Employees Spirituality Score............ 59 Table 17: Self-Rated Employees’ Trust by Employees’ Religiosity Score.................. 60 Table 18: Self-Rated Employees’ Trust by Employees’ Spirituality Score ................. 60 Table 19: Director-Rated Employees’ Trust by Directors’ Religiosity Score.............. 62 Table 20: Director-Rated Employees’ Trust by Directors’ Spirituality Score ............. 62
Exhibits
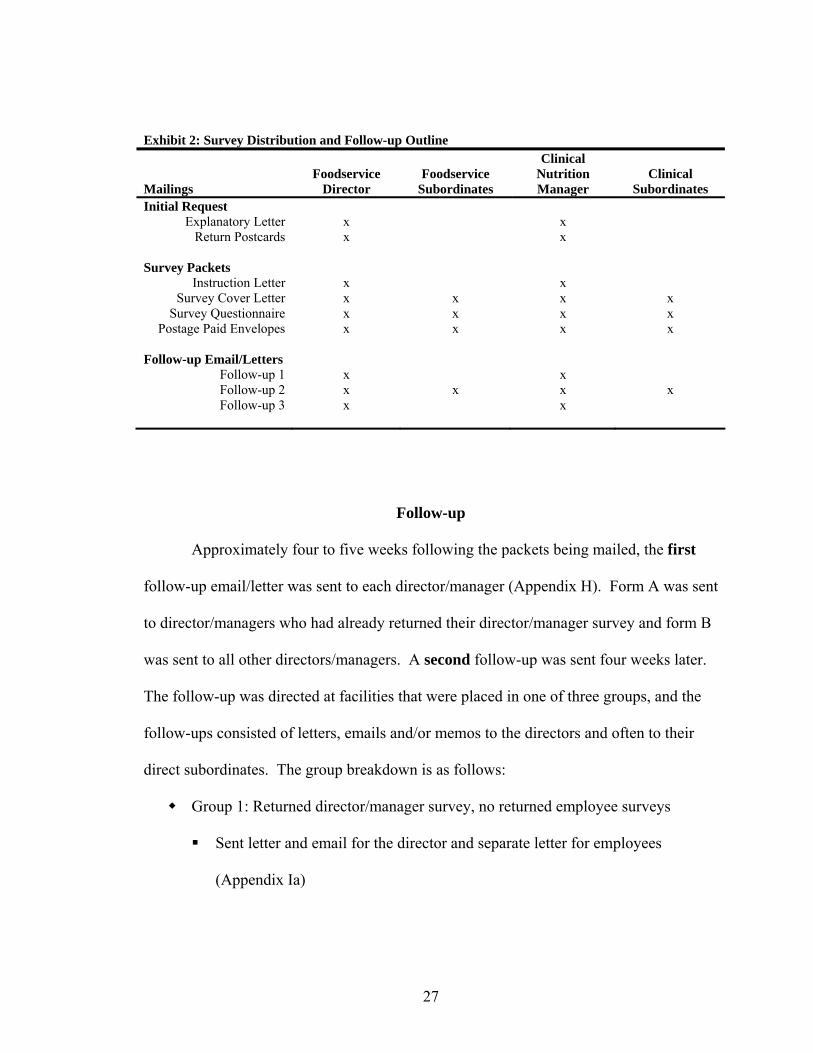
Exhibit 1: Questionnaire Structure................................................................................ 24 Exhibit 2: Survey Distribution and Follow-Up Outline................................................ 27 Exhibit 3: Section Scores .............................................................................................. 30
1
INTRODUCTION
Leadership is complex, yet fundamental to the success of organizations. To meet
the challenges of today’s rapidly changing organizations, leaders must recognize that
leadership is a relationship between those that seek to lead and those who are willing to
follow (1). As with all relationships, trust is essential in building and maintaining strong
organizational relationships. Unfortunately, trust has been inhibited in the workplace by
the perceived low ethics and moral values of management (2). This lack of, or reduction
in, trust brings about increased turnover, reduced commitment, low job satisfaction, and
overall poor performance and productivity on the job by employees (3, 4, 5). However,
when trust is present, it positively impacts communications, job satisfaction,
organizational commitment, employee performance and productivity and overall
profitability (3, 4, 6, 7).
What promotes, initiates, and maintains trust is not precisely known. Trust does
appear to be dependent on characteristics such as integrity, competence, openness,
vulnerability, reliability, and expectations (8). Researchers continue to investigate what
individual traits or actions may further enhance trust development (4, 9, 10).
Today’s changing workforce is another challenge that leaders must confront.
Generational differences have changed the way management must lead and motivate
employees (11, 12). Workers no longer just want a job. They want to be able to realize
their full potential and take their whole “soul” to work (13). Workers want more balance
between all aspects of their lives (14).
In the past, integrating an individual’s most personal life, such as their religiosity
or spirituality, with their job has typically been avoided (15). In recent years, however,
2
this paradigm is shifting as the importance of religiosity and spirituality grows in the lives
of Americans (16). More Americans are attending weekly worship services, prayer
meetings, and other spiritual retreats in their private lives, but they are also bringing it to
work, as observed by the increased prevalence of spiritual and religious symbols and
practices in the workplace (13, 15, 17, 18).
Studies investigating religiosity and spirituality in the workplace are increasing.
Skousen (19) surveyed dietitians in management positions and found that they were
highly religious and they, too, incorporated their beliefs into their daily work practices.
There are no studies that investigate religiosity and spirituality in dietitians in non-
management positions. Also, there are no studies known that examine the relationship of
religiosity/spirituality and trust in the workplace.
Objective
To investigate the impact of religiosity and spirituality on work practices and trust
levels in foodservice and nutrition directors and those whom they directly supervise.
Hypotheses
Hypothesis I: Foodservice/nutrition directors and employees that have higher Religiosity
and Spirituality Scores will have a higher level of agreement regarding
statements of the influence of spirituality on workplace practices.
Hypothesis II: Directors/managers that have higher Religiosity and Spirituality Scores
will be perceived by their subordinates as having increased characteristics
that promote trust in the workplace.
3
Hypothesis III: Foodservice and clinical nutrition employees that have higher Religiosity
and Spirituality Scores will be perceived by their directors as having
increased characteristics that promote trust and commitment in the
workplace.
Limitations
This study is based on survey responses of directors of hospital food and nutrition
care departments and their subordinates. Request for participation was extended to all
directors in the study population, however, only those directors willing to participate are
represented. Directors were relied upon to invite their employees to participate in the
study; therefore, it is difficult to estimate the actual size of the employee population.
Also, only participating employee views could be included in this study, so it may not
represent the employee population in is entirety.
Although characteristics of trust often described in the literature were used to
measure levels of trust, there is not a known validated measure of trust applicable to this
study. Therefore, trust scores may not fully measure the trustworthiness of directors and
employees.
Definitions
Religiosity – A measure of “religiousness,” determined in a variety of ways including: 1)
attendance of worship services, 2) influence of religious/spiritual beliefs on daily life, and
3) frequency of prayer or meditation (20). Webster (21) defines religiousness as relating
to or devotion to religious beliefs or observances. For the purpose of this study,
4
religiosity will be determined by one of the validated measures, frequency of worship
service attendance and will be known as the Religiosity Score. The other two validated
measures will be combined as one score and referred to as the Spirituality Score (see
definition below)
Religiosity Score – A validated measure of religiosity based on attendance of worship
services in the past month. Scores ranged from zero to four (0 = no attendance in the past
month, 1 = once, 2 = twice, 3 = three times, and 4 = four or more times).
Spirituality- More difficult to distinguish, there is not a validated way to measure
spirituality (20). For this study, spirituality and religiosity will be examined separately,
though they are not necessarily independent of each other. Spirituality will be determined
by the Spirituality Score (see definition below). Webster (21) defines spirituality as a
sensitivity or attachment to religious values, or the quality or state of being spiritual.
Webster (21) defines spiritual as that which affects the spirit and relating to sacred
matters.
Spirituality Score – This score is based on the results of two validated measures of
religiosity (survey questions 71 and 72, see appendix A and B) (20). However because
the measures are not affiliated with worship service attendance, they were used to
measure spirituality in this study. The first question investigated the influence of
religious/spiritual beliefs on daily life. Responses were assigned a number from 0 to 6 (0
= strongly disagree to 6 = strongly agree). Next, frequency of prayer or meditation was
5
measured. Responses were assigned a number from zero to five (0 = never, 1 = seldom,
2 = a few times a month, 3 = once or twice a week, 4 = most days, and 5 = daily). Scores
from both questions were summed to range from [0] lowest spirituality to [11] highest
spirituality. The score was further categorized into three levels: low spirituality (summed
scores 0-5), moderate spirituality (summed scores 6-8), and high spirituality (summed
scores 9-11).
Director(s) – The term used to denote both directors of hospital food and nutrition care
departments and hospital clinical nutrition managers.
Employee(s) – Subordinates under the direct supervision of directors of food and
nutrition services or clinical nutrition managers. Employees may include, but are not
limited to, foodservice supervisors, dietitians, diet technicians, and secretaries.
6
7
LITERATURE REVIEW
The Leadership Challenge
In a time of rapid and necessary change, society seeks leadership; however,
finding that leadership is a challenge (2). The increase in leadership complexity,
dwindling faith in leaders, and lack of commitment both by managers and employees
have facilitated the leadership crisis (2, 22). Offerman et al (23) suggest that the
unethical decisions and actions seen by political and business leaders are being
scrutinized and attacked as never before, resulting in a lack of leader credibility. This
contributes to negative leader/follower relationships, including the relationship of trust.
In the 1990’s, organizations faced drastic changes including downsizing, mergers,
restructuring, re-engineering, and global competition (8). These changes severed the ties
of loyalty that had previously allowed trusting relationships to form between employees
and their employers (8). In a large national survey in 1992, Patterson and Kim (24) found
that 68% of employees did not trust their current manager, and 38% of managers did not
trust their employees. Workers believed that managers’ decisions were made with self-
interest in mind rather than the good of the group (24). In a 2002 survey (25),
approximately 75% of participants strongly agreed or agreed that they trusted the
management at their workplaces, while 22% disagreed or strongly disagreed. However,
in a similar question 78% of participants strongly agreed or agreed that there are “few
people” they can completely trust. Sixty percent of participants stated they had to “be
careful” in trusting most people.
8
Trust
Kouzes et al (1) suggest that trust is fundamental in all human relationships and
“without trust one cannot lead.” Establishment of trust must begin on the first day of any
relationship, and if lost, it is unlikely that it will be restored to its original level (26).
Caldwell and Clapham (27) comment that the ability to trust is based on a person’s
“experiences, interactions, and perceptions of others, organizations and institutions.”
Although complex, trust is essential in establishing healthy leader/follower relationships.
Understanding what trust actually entails is difficult due to multiple, varying
definitions found in the literature. Mayer, et al (10) defined trust as the willingness to be
vulnerable to the actions of another based on expectations of that person’s performance.
Kreitner and Kinicki (28) simply stated that trust is having shared faith in others’
“intentions and behaviors.” Mishra and Morrissey (6) surveyed managers in both public
and private organizations, and found that over 90% of the managers viewed trust as a
faith in others’ integrity, character, and ability. They agreed that trust is expressed by
showing confidence and support for one another. Finally, Carnevale (29) suggests that
“trust is an expression of faith and confidence that a person or an institution will be fair,
reliable, ethical, competent, and nonthreatening.”
Trust and Management Theories
For years, management theorists have written about trust in the organization.
Ouchi (30), in describing Japan’s Theory Z of humanistic management, suggested that
trust and productivity “go hand in hand.” With trust managers avoid over-supervising,
allowing employees to satisfy their higher level needs. Likert (31) commented that the
9
success of industrial nations is dependent on leaders’ capability of developing trust.
Finally, Maslow (32) described a self-actualized individual as one who trusts others and
is trustworthy.
Hart et al (33) theorized a hierarchy of trust needs similar in pattern to Maslow’s
hierarchy of motivational needs. They defined three dimensions of organizational trust:
Openness/Congruity, Shared Values, and Autonomy/Feedback which correspond to
Maslow’s safety, social, and esteem needs, respectively. The first trust level,
Openness/Congruity, refers to the integrity, fairness, and openness of management. It is
suggested that employees can not exhibit trusting behavior until they have risen above the
safety level, feeling secure and unthreatened. Trust then can be established at the Shared
Values level of trust, corresponding to the social needs level. Shared Values refers to the
relationship between superior and subordinate, which results from mutual respect and
integrated goals. Although trust development begins at the social level, a higher level of
trust can be developed as one ascends Maslow’s hierarchy. As individuals move toward
the esteem level, there is an increased ability to trust and a greater expectation of being
trusted. To continue the ascent towards self-actualization, the organization must provide
Autonomy/Feedback, the third trust factor. Autonomy/Feedback refers to praise,
reinforcement, and independence of the employee.
Organizational Impact
In a time when trust is sorely needed for organizational transformation, it is
unfortunate that these very changes have diminished trust within the work setting (4).
Organizations with decreased trust are associated with increased absenteeism, theft,
10
conflict, low accountability, low creativity and poor performance (3, 5, 24, 34, 35). On
the other hand, studies show trust has a significant influence on organizational dynamics
such as group unity (36), effective communication (5, 7, 37), decision-making (6), job
satisfaction (4, 36, 38), organizational commitment (4, 36, 38), problem solving (39), and
overall employee performance and productivity (4, 6, 9, 10, 36, 40). Trust also has an
impact on profitability. Davis et al (3) explored trust between managers and employees
in a restaurant setting. Researchers concluded that sales and profits rose in facilities
where employees exhibited greater amounts of trust toward their employer. In fact, trust
was a significant predictor of both sales and profits while controlling for fixed variables.
In the same study, increased trust was positively related to decreased employee turnover
rates over time.
Turnover has a negative relationship with organizational commitment.
Committed employees are less likely to leave an organization than are less committed
employees (41, 42). Organizational commitment is identified in two ways. Meyer and
Allen (43) define affective commitment as a person’s emotional attachment, identification
with, and involvement in a specific organization. It is based on a person’s desire to be at
work (44). Conversely, continuance commitment reflects the individual’s perception of
the consequences associated with leaving. Employees believe benefits overshadow the
costs of leaving and stay because “they need to (43).” Meyer et al (45) studied the
correlation between commitment and job performance in first-level food service
managers. They concluded that performance ratings by the supervisor increased as
affective commitment increased in unit managers, and ratings decreased as continuance
11
commitment increased. Laschinger et al (4) indicated that trust in management is an
essential component in promoting affective commitment in the organization.
Influential Factors
Although having good trusting relationships is important, factors that facilitate
trust are not universally recognized. For instance, Mayer et al (10) suggest that
managers’ trust-worthiness is directly related to their ability, benevolence, and integrity.
First, the trustor (subordinate) must identify that the trustee (manager) has the ability to
complete the task at hand, and, as perceived ability increases, so will trust. Next, the
greater the trustor feels the trustee has his/her best interests in mind, the greater the trust.
Finally, levels of trust will rise as employees’ perception of manager integrity expands.
That is, if the employee believes the manager follows a set of principles that the
employee agrees with, the employee rewards the manager with trust. Davis et al (3)
confirmed that managers perceived to exhibit these trust-promoting characteristics were
trusted significantly more by their employees.
Rusaw (9) indicates several variables that influence the perception of trust in the
leader/follower relationship, including reliability, the degree of perceived similarity,
integrity, competence, consistency, loyalty, and self-disclosure. Self-disclosure is
revealing oneself to others through verbal and nonverbal means. Verbal disclosure refers
to revealing personal information through normal conversation. Nonverbal disclosure
includes an individual’s actions, appearance, and the things which surround them at work
(music, pictures, etc.). By self-disclosing, a person will share their strongest beliefs,
values, and desires with those with whom they associate in the workplace (46). Kouzes
12
et al (47) concluded that employees were more likely to trust self-disclosing managers.
Misha and Morrissey (6) agree that open communication and the willingness to volunteer
personal information about oneself to others will generate trust in organizations.
Being open and willing to share ideas and information about the job freely can
also influence trust (9). Laschinger et al (4) conducted a survey of randomly selected
staff nurses in Canada and concluded that nurses’ perception of access to information and
support significantly influenced their trust in management. This ultimately influenced
job satisfaction, belief and acceptance of organizational goals, and affective commitment.
Values and Beliefs
Hosmer (48) suggests that trust is based on an assumption of an unspoken moral
duty. However, the perception of management’s low ethics and moral values held by
American workers has been described as the major cause for the “problems” in the
business world (24). Often “ethics” is viewed as a way of behaving that can be enforced
by a work environment or a work code of conduct. Each individual has a basic
understanding of what is morally appropriate, but Garcia-Zamor (49) suggests it is
actually the individual’s spirituality that will determine the degree to which he or she will
interpret and follow this moral structure. Mertzman and Madsen (50) posit that in
organizations that do not foster an ethical climate, deception becomes unavoidable.
When an opportunity arises and the risk is minimal dishonesty will occur.
Of greater concern is the effect of unethical values on workplace relationships.
Jones and Kavanagh (51) indicate that unethical behavior by managers and co-workers
results in decreased ethical behavior by employees. Kantor and Weisberg (52)
13
interviewed employees about perceived ethical attitudes and behavior of themselves,
peers, and managers in a large finance department. Employees believed they had higher
ethical standards and behavior than they perceived their bosses and co-workers to have.
In an earlier study (24) nearly 37% of managers and employees agreed that employees
were more ethical than managers. Only 13% and 19% of managers and employees,
respectively, agreed that managers were more ethical.
Religiosity in the United States
In the last ten years, polls suggest that the importance of religion in the lives of
Americans is increasing, compared to the downward spiral seen in previous decades (16).
More Americans are seen participating in weekly religious services, prayer meetings,
spiritual revival retreats and so forth (13, 15, 16, 17, 18). This renewed surge of interest,
whatever the true cause, is expected to continue to increase in the coming years (16).
Gallup Polls (16) in 1999 found that about 44% of Americans attend church
weekly, 96% believe in God or a universal spirit, and 75% pray or mediate daily (all of
these figures have been stable or increasing over the past 20 years). The 2002 General
Social Survey (25) found only 30% of Americans attend church weekly and 56% pray
daily. These results are lower than those from the Gallup Polls, but also reflect an
increase from past years. There are many validated measures of religiosity including
frequency of worship service, frequency of prayer and meditation, and daily influence of
religious beliefs (20).
14
Religiosity Comparisons
Gender
Overall women engage in more religious behaviors than men. They attend
religious services, pray, and believe in God or a universal spirit more often than do men
(24, 53, 54, 55). Studies (56, 57, 58) also show that women convey a greater interest and
are more personally committed to all types of religious organizations or belief systems
than are men. Women continue to be the moral fiber of churches today (16).
Many believe that it is the increased nurturing characteristics and opportunity for
child rearing that give women the edge in things of a religious and spiritual nature.
Certain innate characteristics in women such as submissiveness, passiveness, obedience,
and nurturing have been found to be related to increased levels of religiosity (56, 59, 60).
Generation Differences
With age, religion appears to become more important to Americans. This trend
has been consistent throughout history (53, 54, 55, 61, 62, 63). When asking Americans
the degree to which their religious beliefs influence their daily life, Argue et al (61) found
an increase in religiosity with age. One study (53) found that 39% of adults over the age
of 65 attended religious services at least once a week, whereas only 26% of young adults
attended. Greeley (64) suggests that young people distance themselves from their
religious roots in their early years of family and career. As they become more settled,
they return to them. However, more recent surveys have shown that the millennial
generation (those born after 1980) appear to have a greater interest in things of a spiritual
nature at an earlier age than did past generations (16). In the late 1980’s surveys found
15
that 52% of teens and only 40% of adults reported attending church (55, 63). The latest
of the Gallup polls (1999) confirms this increase in religiosity/spirituality in teens: 95%
“say they believe in God,” 74% “pray when alone,” and 64% “have a great deal of
interest in discussing the existence of God.” In general, teens are more service oriented
than in the past, they discuss spiritual matters more frequently, and they desire
clarification on ethical rules (16).
Education Level
Much of the literature suggests that increased education has a negative influence
on religious commitment (65, 66, 67, 68). Wadsworth and Freeman (67) investigated the
change in religious belief from childhood to adulthood in an English, Welsh, and Scottish
population. They concluded that change in religious belief was strongly associated with
the population’s educational achievements. Advanced levels of education were
associated with a decrease in belief. Approximately half of those receiving university
degrees still retained their childhood belief system. Similarly, Caplovitz and Sherrow
(65) found there was an increased probability of apostasy in those that participated in
higher education. The researchers suggested that commitment to intellectual pursuits
weakened religious commitment because of the exposure to new ideas and separation
from family influence. Conversely, Greeley and Zelan (69, 70) argue that a person seeks
higher levels of education because they have already rejected their religious beliefs.
Within denominations this trend is not consistent. Merrill et al (71) studied
Mormons and indicated that education had a positive influence on religiosity in both
Mormon men and women, rather than the expected secularizing influence. Loury (72)
16
investigated church attendance among high school aged (14-17 years) American youth
(mixed denominations) and concluded that church attendance increases the likelihood
that an individual will finish high school and attend college.
Religiosity in the Workplace
As with the growth of spirituality in American’s private lives, religious/spiritual
changes have been seen in the workplace and are gaining attention in both trade
publications and research journals. Religious and spiritual symbols and practices are
growing more prevalent and acceptable in the workplace as seen by the increase in
enrichment and empowerment programs, prayer meetings, Bible study, religious/spiritual
language, and requests for time off for religious obligations or holidays (13, 15, 16, 17,
18, 49). In the 1990’s alone over 300 publications on workplace spirituality appeared in
bookstores (49). Business periodicals and journals contain a growing number of articles
about the restored religious fervor and rising spirituality in the workplace and society
(73).
Bruce (74) surveyed members of the American Society for Public Administration
(ASPA) regarding their views about spirituality in the workplace and found that 70% of
members defined themselves as spiritual. Nearly 60% of respondents felt that their career
choice, that of public service, was a spiritual calling. Fifty-six percent, though, did not
believe it was “appropriate to talk about spirituality” in the workplace. However, in the
recent Gallup Poll (16) 48% of Americans stated that in the past 24 hours they had talked
about their faith in the workplace.
17
Mitroff and Denton (13) initiated an empirical study of spirituality in the
workplace through interviews and questionnaires administered to top executives from
businesses across the country. This was one of the first studies that examined religiosity
and spirituality in the workplace to provide both quantitative and qualitative data. Nearly
all participants believed in a higher power or God, and half agreed they felt that power
while at work. On the other hand, executives rarely prayed or meditated in the
workplace.
Most interesting to note, the researchers learned that workers no longer just want
a job. Executives stated that being able to realize their full potential was most important
to them. They wanted to be able to express their “total feelings” and “complete soul” at
work as they did their “total intelligence,” however most were cautious to do so. This
separation seen between intellect and emotions in workplaces allows little opportunity for
workers to realize their full potential (13).
Work Satisfaction and Fulfillment
As employees seek for meaning at work, leaders search for new ways to
encourage and motivate workers. Businesses are realizing that employee fulfillment
helps to raise productivity and job satisfaction and thus it is important for financial
success (49). When spiritual people join a workplace that fits their needs, they are more
supportive of their colleagues and become more productive employees. Personal
fulfillment and maintaining high ethics are related to outstanding performance (49).
Management is complicated further by changing workplace demographics.
Ethnic, racial, gender, and age diversity are now commonplace (75, 76). What promotes
18
job satisfaction and fulfillment differs by demographic, especially in diverse age groups
(11, 14, 76)
Generation Gap
Today’s workforce can be divided into three diverse generational groups: 1) Baby
Boomers, born between years 1945-1964; 2) Generation X (Xers), born from 1965-1980;
and 3) Generation Y (Millennial Generation) born after 1980. Major differences are
found between employee work values, attitudes, and expectations of the Baby Boomers
and the Xers. Generation Y is just beginning to enter the workforce and differences are
just beginning to emerge (76).
Baby boomers tend to be hard working and more loyal to their employer than
Xers. They expect their managers to give direction and lead them towards organizational
goals, and they accept that direction. However, they do not typically like change. In
contrast, Xers focus more on personal satisfaction rather than just on hard work (11, 76).
Keaveney (14) comments that Xers “want balance in their lives, demanding time for
work, play, family, friends, and spirituality.” They are loyal to their profession and not
necessarily to their employer (11). They want flexibility in their lifestyles and jobs (12,
14, 77).
Generation Xers need their jobs to collectively provide self-achievement along
with lifes’ basic needs. They do not want work to negatively impact their quality of life
(76). Tulgan (12) suggests that job satisfaction is more important to Xers than promotion
because they focus on life outside of work. They might accept a less desirable position or
19
promotion if it matches their lifestyle. They are not willing to make sacrifices for their
jobs as the Baby Boomers have.
Motivational Theories
Over the years, a number of motivational models have emerged providing
suggestions for promoting motivation in the workplace (46). Similar to recent studies,
some theorists suggest that workers desire to achieve their “full potential” which then
leads to motivation and job satisfaction.
Need Hierarchy. Maslow (78) proposed a model of human motivation based on an
individual’s desire to satisfy his/her needs. Maslow described human needs in an
ascending hierarchy from lowest-level needs to highest-level needs. As each lower level
need is satisfied, the individual is motivated to work to satisfy the next level up. Human
needs are categorized as follows:
Physiological needs: survival needs, air, water, food, and shelter.
Safety needs: protection against danger, freedom from fear, security.
Social needs: love, belonging, affiliation, acceptance.
Esteem needs: achievement, recognition, and status, positive self-esteem.
Self-actualization: self-fulfillment, personal growth and development.
Self actualization is the process of growth or discovery of the true self and attaining
highest abilities possible (79). Generally, a person seeks to fulfill his basic needs. Once
these needs are satisfied the individual is “primarily motivated by his need to develop and
20
actualize his fullest potentialities and capacities” or in other words, the individual is
motivated by a desire for self-actualization (32, 79).
Herzberg’s Motivation-Hygiene Theory. Herzberg (80) also studied motivation and
suggested that there are two types of factors: those that create job satisfaction (motivation
factors) and those that promote dissatisfaction (hygiene factors). Similar to the lower
levels of Maslow’s hierarchy, the hygiene factors included salary, relationships with
coworkers, supervision, and working conditions. Motivating factors included
achievement, recognition, work itself, responsibility, and advancement. Herzberg (80)
concluded that the lack of the hygiene factors led to job dissatisfaction because of the
“need to avoid unpleasantness.” Motivating factors produced job satisfaction because of
the “need for growth or self-actualization.”
Expectancy Theories. According to Vroom (81) and Porter and Lawler (82), people are
motivated to work when they expect their efforts to result in valued rewards. An
individual expects that his/her efforts will result in improved performance and this
improved performance will lead to desirable rewards. Motivation leads to actions when a
person expects to actually receive a reward and when those rewards or outcomes are
perceived as being important to each person, individually. This motivational force is
increased when greater value is placed on the reward and when there are increased
expectations that efforts will be successful and rewarded. Key to these theories is the
need to achieve a motivational climate that considers the individual’s goals and values, or
what is most important to the individual (46).
21
Organizational Fit
The work environment includes those specific conditions and circumstances that
accompany a particular place of employment. A healthy work environment is a place
where workers can feel safe, yet challenged and motivated to be creative. There is trust
and open communication between staff members and management. A healthy work
environment allows for balance between work and personal life. Diversity is embraced
and new ideas are encouraged and supported (83).
Individuals typically select and prefer to work for organizations that they perceive
best fit their own characteristics (84). Poor person-organization fit results in greater
possibility of turnover and poor performance (85, 86, 87, 88, 89). An employee who
does not fit with his/her current organization may choose to leave (90). O’Reilly et al
(88) concluded that person-organization fit does predict turnover intentions significantly.
An organization that can decrease voluntary employee turnover can then reduce costs,
improve productivity, and, in turn, improve profitability (3, 91).
Sims and Kroeck (44) proposed that employees selected working environments
that matched their ethical preferences. This correlation was supported in their study;
results noted that as length of tenure increased there was less difference in preferred and
described work climate, suggesting employees did not stay with organizations that did
not fit their ethical preferences.
Leadership in Dietetics
The dietetic profession is not immune to the rapid changes seen in the business
world. Rising healthcare costs require hospitals and healthcare facilities to focus more on
22
financial growth and security. Healthcare advances have decreased hospital length of
stay, placing even greater pressure on financial well-being of the healthcare community.
These challenges have produced ethical dilemmas for healthcare providers and the nation
as a whole (2). As in other organizations, strong leadership will be required to maintain
the strength and integrity of the profession while decreasing disloyalty, dissatisfaction,
and poor productivity among staff. Barker et al (2) suggest that innovative leadership
and empowerment of workers will make these changes positive.
Religiosity/Spirituality in Dietetics
There is only one study known that looks at the religiosity of dietitians. Skousen
(19) surveyed dietitians in management positions and found that almost half (48%) had
attended worship services at least four times the previous month. Further results showed
that 70% of participants agreed that they prayed about work-related issues, and nearly
69% responded that they had spiritual/religious feelings at work. This study only used
frequency of church or worship service attendance to measure religiosity/spirituality. No
known studies have looked at the religiosity/spirituality of dietitians in non-management
positions. Also, there are no known studies that have investigated the perception of trust
held by directors for their employees and/or employees for their directors relative to their
individual religiosity/spirituality.
23
METHODOLOGY
Research Instrument
The research instrument consisted of two individual survey questionnaires:
Survey A for directors/managers (Appendix A) and Survey B for direct subordinates
(Appendix B). Both surveys contained 72 questions divided into six sections labeled A
through F. Section titles and corresponding question numbers are listed in Exhibit 1.
All questions in sections A through D were based on a seven-point scale from [1]
strongly disagree to [7] strongly agree. Section A addressed the influence of religiosity
and spirituality on workplace practices. Section B solicited information on religious and
spiritual actions in the work place. Section C contained questions to determine the level
of trust managers thought their employees had for them (Survey A), or the amount of
trust employees had for their manager (Survey B). Similarly, Section D asked questions
exploring managers trust for their employees, generally (Survey A), or the amount of
trust employees thought their managers had for them (Survey B). Questions on Sections
A and B and partially Section C were taken from the Skousen (19) religiosity/spirituality
survey. Additional questions in Section C were developed to explore other aspects of
trust.
Section E is the Multifactor Leadership Questionnaire Form 5X-Short (92). This
portion was included in the survey for concurrent research measuring transformational
leadership. However, only a few of these questions addressed aspects of trust and are
included in the analysis (Questions 30, 41, 42, 44, 46, 57). Questions are based on a five-
point scale from [0] not at all to [4] frequently, if not always.
24
Finally, Section F asked for demographic information. Also included in this
section were the three measures of religiosity (20) (Questions 69: worship service
attendance, 71: spiritual influence on daily life, and 72: frequency of prayer), general job
satisfaction questions (Questions 65: level of satisfaction and 68 on employee survey
only: consideration of job change), and length of tenure (Questions 66: time in current
position and 67: total time in all management positions or time with current manager).
Exhibit 1. Questionnaire Structure Section Title Questions A. Influence of Spirituality
#1-11
B. Religious/Spiritual Actions
#12-15
C. Manager’s Trustworthiness
#16-19
D. Employee’s Trustworthiness
#20-25
F. Multifactor Leadership Questionnaire Questions used in analysis:
#26-57 30, 41, 42, 44, 46
G. Demographics
#58-72
Sample Size and Selection
The study population consisted of directors/managers of hospital food and
nutrition services and their direct subordinates. An initial request for participation was
sent to all 918 hospitals acquired from the American Hospital Association database for all
hospitals in the United States having 250-499 beds. More specifically the population
included:
25
Directors of food and nutrition services and those under their direct supervision
Frequency of Prayer or Meditation Daily Most days Once or twice a week A few times a month Seldom Never
54 32 17 5 13 8
41.8 24.8 13.2 3.9 10.1 6.2
248 112 64 45 43 12
47.3 21.4 12.2 8.6 8.2 2.3
Spirituality Scorea Low (0-5) Moderate (6-8) High (8-11)
16 30 81
12.6 23.6 63.8
47 86 341
9.9 18.2 71.9
Type of Director Director of Food and Nutrition Services Clinical Nutrition Manager Type of Employee Food Service/Managers Clinical Nutrition
66 63
51.2 48.8
198 332
37.4 62.6
Hospital Size Small #350 Beds Large >350 Beds
63 61
50.8 49.2
aSpirituality score range from 0-11 and is obtained by summing the results of the influence of religious/ spiritual beliefs on daily life (0-strongly disagree to 6-strongly agree) and frequency of prayer or meditation (0-never to 5-daily).
35
The largest group directors (46.5%) had a master’s degree, while the largest group
of the employees (42%) had a bachelor’s degree. Only one (0.8%) director had a high
school diploma or GED, while 13.5% of employees had a high school diploma or GED.
Over half of all directors (64.5%) and employees (77.6%) obtained their highest degree in
Nutrition or Dietetics.
Of the 129 directors, 67 (51.9%) were the Directors of Food and Nutrition
services and 62 (48.1%) were Clinical Nutrition Managers. Most of the employees
(61.4%) were clinical dietitians, and 12.5% worked as diet technicians. Just over one
fifth (21.5%) of the employees were in lower level foodservice management positions.
Salary classifications were divided into seven groups. The majority of directors
(62.4%) earned $61,000 or more annually while 81.6% of employees earned between
$20-50,000 per year. No directors indicated an annual salary of $10-19,000. Most of the
directors (97.7%) and employees (78.9%) reported working full time.
Job Satisfaction and Job Change Consideration
When asked if they enjoyed their current position, 90.7% of directors and 78.2%
of employees agreed or strongly agreed that they did. Only 9.2% of employees strongly
agreed when asked if they were considering a job change in the near future. Many
employees (43.9%) disagreed or strongly disagreed about considering a near future job
change (Table 1).
36
Time Period in Current Position/In All Management Positions
Length of time in the respondents’ current position varied. Only 10.9% and
14.2% of directors and employees, respectively, had been in the position less than a year.
Over half (56.2%) of employees had worked with their current director for one to five
years. Approximately two-fifths (37.5%) of directors had worked in management
positions for over 20 years. When asked how the director was hired to their current
position, 51.2% reported being hired from outside of the hospital and 48.8% reported
being promoted from within the hospital (Table 1).
Religious Beliefs/Spirituality
Most of the directors were either Protestant (41.9%) or Catholic (31%). Similarly,
40.2% of employees were Protestant and 31% were Catholic. Few directors (3.9%) and
employees (4.8%) reported having no religious preference (Table 1).
Two-fifths (40%) of directors reported attending worship services at least four
times the previous month, while 29.4% reported never attending. Similarly, 36.3%
employees reported attending worship services at least four times the previous month and
31.5% reported no attendance.
When participants were asked if their religious/spiritual beliefs influenced their
daily life, 73.4% of directors agreed or strongly agreed while 72.5% of employees agreed
or strongly agreed that they did. A large number of directors (41.8%) and employees
(47.3%) reported that they prayed or meditated daily. Almost one-fourth (24.8%) of
directors/manager and 21.4% of employees reported praying or meditating most days.
37
Only 6.2% and 2.3% of directors and employees, respectively, responded that they never
prayed or meditated.
Answer codes for questions 71 (religious/spiritual influence on daily life) and 72
(frequency of prayer and mediation) were combined to identify the Spirituality Score.
Summed scores were categorized into three groups: low spirituality, moderate
spirituality, and high spirituality. The majority of directors (63.8%) and employees
(71.9%) were classified as being highly spiritual, based on their Spirituality Score.
Demographic Characteristics by Religiosity and Spirituality Scores
Ethnicity
There were few differences found in the analysis comparing Religiosity and
Spirituality Scores to ethnicity. In both the director and employee populations, the Asian
Pacific Islanders had a significantly greater worship service attendance than did the
Native Americans in both the director and employee population (Table 2).
Gender
Although, much of the literature (53, 54, 55), finds that women are significantly
more religious than men, this study found that females had greater Religiosity Scores
than men only among the employees. Consistent with Skousen’s (19) results, there was
no difference in Religiosity Score and gender in directors. There was also no significant
difference seen between men’s and women’s Spirituality Scores for either directors or
employees (Table 2).
38
Table 2. Demographics by Religiosity and Spirituality Scores Directors Employees Religiosity Scorea Spirituality Scoreb Religiosity Scorea Spirituality Scoreb nc % LS Mean± SE LS Mean± SE nc % LS Mean± SE LS Mean± SE Ethnic Groups African American Asian and Pacific Islander Caucasian Hispanic Native American Other
2 3 120 2 2 0
1.6 2.3 93.0 1.6 1.5 0.0
2.00 3.67 2.21
2.50
0.50 0.00
±1.22w,x ±0.99w ±0.16w,x ±1.22w,x ±1.22x ±0.0w,x
9.00
11.00 8.45
10.00 10.00 0.00
±1.88 ±1.54 ±0.24 ±1.89 ±1.89 ±0.0
42 29 419 18 6 4
8.0 5.6 80.9 3.5 1.2 0.8
2.40 2.64 2.05 1.61 1.17 2.00
±0.27w,x ±0.32w ±0.08w,x ±0.40x ±0.69x ±0.85w,x
10.20 9.43 8.91 9.06 8.80 8.25
±0.40w ±0.46w,x ±0.12x ±0.61w,x ±1.09w,x ±1.22w,x
Gender Female Male
107 22
83.0 17.0
2.14 2.59
±0.17 ±0.37
8.62 8.32
±0.26 ±0.57
473 50
90.4 9.6
2.18
1.27
±0.08w ±0.24x
9.10 8.41
±0.12 ±0.38
Age 21-30 31-40 41-50 51-60 More than 60
9 28 57 33 1
7.0 21.9 44.5 25.8 0.8
2.00 1.43
2.70
2.24 0.00
±0.55w,x ±0.31w ±0.22x ±0.29w,x ±1.66w,x
9.22 7.46
9.29
8.27 10.00
±0.85w,x ±0.48w ±0.34x ±0.44w,x ±2.55w,x
153 147 136 73 14
29.3 28.0 26.0 14.0 2.7
1.90 2.00 2.28 2.17 2.64
±0.14 ±0.14 ±0.14 ±0.20 ±0.46
8.62 8.82 9.48 9.51 9.50
±0.21w,x ±0.21w,y ±0.22z ±0.30y,z ±0.65w,z
Education High School Diploma Associate Degree Bachelor’s Degree Master’s Degree Some post grad, but no degree Doctoral Degree
1 5 42 60 19 2
0.8 3.9 32.6 46.5 14.7 1.5
4.00
3.60 2.40 2.05 2.11 0.00
±0.76w,x,y ±0.26w ±1.70w,x ±0.22x,y
±0.39w,x,y ±1.20y
11.00 10.60 9.02 8.11
8.32 8.50
±2.65w,x ±1.19w ±0.41w,x ±0.35x ±0.61w,x ±1.87w,x
71 51 220 102 76 4
13.5 9.7 42.0 19.5 14.5 0.8
2.10 1.67 2.19 2.19 1.85 2.75
±0.20 ±0.24 ±0.12 ±0.17 ±0.20 ±0.85
10.00 8.68 8.87 9.03 8.77
11.00
±0.35w ±0.17x ±0.30x ±0.25x ±0.29x ±1.21w,x
Hospital Size Small ≤ 350 Beds Large > 350 Beds
63 61
50.8 49.2
1.92 2.46
±0.22 ±0.22
63 61
50.8 49.2
8.47 8.62
±0.34 ±0.35
aReligiosity score was given according to attendance of worship service in the past month. Scores ranged from 0-4 (0-no attendance to 4-four or more times). bSpirituality score range from 0-11 and is obtained by summing the results of the influence of religious/spiritual beliefs on daily life (0-strongly disagree to 6-strongly agree) and frequency of prayer or meditation (0-never to 5-daily). cNumbers of subjects differ due to varying response rate. w,x,y LSMeans with different superscript for each characteristic are significantly different from each other, ANOVA P≤.05.
38
39
Age
Directors aged 41 to 50 years had a higher Religiosity and Spirituality Scores than
those directors aged 31 to 40 years. Employees between 41 and 50 years old had a
greater Spirituality Score than did employees between both 21 and 30 years and between
31 and 40 years. There was no significant difference seen in employee Religiosity Score
by age (Table 2).
Education
Directors with an associate degree did have greater Religiosity and Spirituality
Scores than those with a master’s degree. Also, directors with an associate degree or a
bachelor’s degree attended worship services more frequently than did those with doctoral
degrees though only two directors held doctoral degrees (Table 2). Education did not
appear to have any relationship to employee Religiosity Score. Employees with a high
school diploma did have a greater Spirituality Score than did those with an associate,
bachelor’s, or master’s degree (Table 2).
Hospital Size
Hospitals were distinguished as one of two sizes, large (>350 beds) and small
(≤350 beds). There was no significant difference seen between directors’ Religiosity (F=
3.03, p=0.08) or Spirituality (F= 0.10, p=0.75) Scores by hospital bed size (Table 2).
40
Workplace Religiosity/Spirituality
Influence of Religion/Spirituality
When asked to what degree religious beliefs/spirituality influenced daily work
practices, directors and employees had a high level of agreement with the majority of the
eleven questions (Table 3). However, only 30.71% of directors and 38.31% of
employees agreed that their religious beliefs/spirituality were a normal part of their
discussions with coworkers. Skousen (19) surveyed only dietitians in management
positions, and 44.7% agreed that their religious beliefs/spirituality were a normal part of
their discussions as work. Skousen’s (19) results, regarding the influence of religious
beliefs/spirituality on daily work practices, generally reflected that dietitians in
management agreed at a higher level than did directors in this study.
Work Actions
The majority of directors and employees agreed that they displayed
religious/spiritual actions in the workplace (Table 4). Directors and employees (72.66%
and 69.90%, respectively) claimed to follow God’s (a Supreme Being’s) example in their
interactions, reported having spiritual/religious feelings (directors, 60.94% and
employees, 61.83%), and relied on spiritual insight in making decisions at work
(directors, 57.03% and employees, 58.78%). When directors’ responses regarding
religious/spiritual actions in the workplace are compared to Skousen’s (19) findings,
results are generally lower. Skousen (19) reported 76.9% of managers followed God’s (a
Supreme Being’s) example in their interactions at work, while 68.9% reported having
41
Table 4. Religious/Spiritual Actions in the Workplace Director Responses Agreea Neutral Disagree n % n % n % Section B. I often… follow God’s (a Supreme Being’s) example in my interactions at work. have spiritual/religious feelings at work. rely on spiritual insight in making decisions at work. pray about work-related issues.
93 78 73 72
72.66 60.94 57.03 55.81
17 15 25 15
13.28 11.72 19.53 11.63
18 35 30 42
14.06 27.34 23.44 32.56
Employee Responses Section B. I often… follow God’s (a Supreme Being’s) example in my interactions at work. have spiritual/religious feelings at work. rely on spiritual insight in making decisions at work. pray about work-related issues.
367 324 308 319
69.90 61.83 58.78 60.70
87 89 118 66
16.58 16.99 22.52 12.57
71 111 98 140
13.52 21.18 18.70 26.67
aResponses have been collapsed into three categories: (1) Agree (‘Strongly Agree, Agree, and Somewhat Agree’), (2) Neutral (‘Neither Agree or Disagree’), and (3) Disagree (‘Somewhat Disagree, Disagree, and Strongly Disagree’).
Table 3. Religious Beliefs/Spirituality Influence on Work Practices Director Reponses Agreea Neutral Disagree n % n % n % Section A. My religious beliefs/spirituality… help me deal with stressful situations. drive my work ethic. guide my interactions with coworkers. influence my commitment to my job and to my coworkers. guide decisions I make at work. influence my individual goals as a manager. supply me with wisdom/insight in adapting to conditions in the workplace influence how I follow company policies and procedures. are critical in helping me get through each workday. are apparent to those with whom I work. are a normal part of my discussions with coworkers.
Section A. My religious beliefs/spirituality… help me deal with stressful situations. drive my work ethic. guide my interactions with coworkers. influence my commitment to my job and to my coworkers. guide decisions I make at work. influence my individual goals as an employee. supply me with wisdom/insight in adapting to conditions in the workplace influence how I follow company policies and procedures. are critical in helping me get through each workday. are apparent to those with whom I work. are a normal part of my discussions with coworkers.
aResponses have been collapsed into three categories: (1) Agree (‘Strongly Agree, Agree, and Somewhat Agree’), (2) Neutral (‘Neither Agree or Disagree’), and (3) Disagree (‘Somewhat Disagree, Disagree, and Strongly Disagree’).
42
spiritual/religious feelings at work and 72.3% relied on spiritual insight in making
decisions.
More employees (60.7%) reported praying about work-related issues than did
directors (55.81%) (Table 4). Again, directors in this study had lower agreement than
those in Skousen’s (19) study where 70.5% claimed to pray about work-related issues.
Differences seen between this study and Skousen’s (19) may be associated with the
different management population surveyed. Skousen (19) surveyed only dietitians in a
variety of management positions. This included dietitians in food and nutrition services
in the hospital setting, but it also included dietitians in community and education
management positions. The current study surveyed both dietitians and non-dietitians in
hospital food and nutrition management positions only.
Religiosity and Spirituality Scores Analysis
In the analysis, Least Squares Means (LS Means) were used to equalize the
groups because of the large number of terms in the model. LS Means accounts for the
whole model with varying sample sizes and adjusts the means correspondingly.
Following the ANOVA, significance was considered at a p-value of <0.05.
Analysis using Pearson Correlation showed a positive correlation between the
Religiosity Score and Spirituality Scores in directors (R-Sq=0.63, p<0.0001) and in
employees (R-Sq=0.51, p<0.0001).
43
Religious/Spiritual Influence and Actions
When comparing the influence of Religiosity and Spirituality Scores to work
practices (Section A) in directors and employees, analysis showed increasing mean scores
(on a scale of 1=strongly disagree to 7=strongly agree) as Religiosity and Spirituality
Scores increased (Tables 5 and 6). Those with higher Religiosity and Spirituality Scores
were more likely to agree that their religious beliefs/spirituality influences their
commitment, is apparent to those with whom they work, are a normal part of their
discussions at work, and are critical in helping them get through the day. Directors and
employees with higher Religiosity and Spirituality Scores use their religious beliefs to
guide their decisions at work, drive their work ethic, and deal with stressful situations
(Table 5 and 6).
Summed scores for the Spiritual Influence Score (SIS) increased as Religiosity
and Spirituality Scores increased in both directors and employees (Table 5 and 6).
Pearson’s Correlation showed a positive correlation between the directors’ SIS and their
Religiosity (R-Sq=0.55; p<0.0001) and Spirituality (R-Sq=0.77; p <0.0001) Scores.
Similarly, an increase in employees’ Religiosity and Spirituality Scores was correlated
(R-Sq=0.52; p<0.0001 and R-Sq=0.78; p<0.0001, respectively) with an increased SIS
score. In other words, employees’ and directors’ level of agreement regarding the
influence that their religious and spiritual beliefs have in the workplace increases as their
Religiosity and Spirituality Scores increase.
44
Table 5. Influence of Religious Beliefs/Spirituality on Work Practicesa by Religiosity Score Table 5a. Director Responses Religiosity Scoreb 0 (n=38) 1 (n=13) 2 (n=13) 3 (n=13) 4 (n=52) LS Mean± SE My religious beliefs/spirituality. . . help me deal with stressful situations. guide my interactions with coworkers. drive my work ethic. supply me with wisdom/insight. guide decisions I make at work. are critical in helping me get through each workday. influence how I establish and follow P&Ps. influence my commitment. influence my individual goals as a manager. are apparent to those with whom I work. are a normal part of my discussions with coworkers Spiritual Influence Score (SIS)c
My religious beliefs/spirituality. . . help me deal with stressful situations. guide my interactions with coworkers. drive my work ethic. supply me with wisdom/insight. guide decisions I make at work. are critical in helping me get through each workday. influence how I follow P&Ps. influence my commitment. influence my individual goals as an employee. are apparent to those with whom I work. are a normal part of my discussions with coworkers. Spiritual Influence Score (SIS)c
aResponses were based on a seven-point scale from 1-7 (1-strongly disagree to 7-strongly agree). bReligiosity Score was given according to attendance of worship service in the past month. Scores ranged from 0-4 (0-no attendance to 4-four or more times). cSIS: Represented the sum of all answer codes for the above questions from Section A answered by either directors or employees 0-4LS Means with different superscripts for each Religiosity Score are significantly different from each other. ANOVA, p-value of at least 0.05.
44
45
Table 6. Influence of Religious Beliefs/Spirituality on Work Practicesa by Spirituality Score Director Responses Spirituality Scoreb Low (n=16) Medium (n=30) High (n=81) LS Mean± SE My religious beliefs/spirituality. . . guide my interactions with coworkers. help me deal with stressful situations. drive my work ethic. supply me with wisdom/insight. guide decisions I make at work. influence my commitment. influence how I establish and follow P&Ps. influence my individual goals as a manager. are critical in helping me get through each workday. are apparent to those with whom I work. are a normal part of my discussions with coworkers. Spiritual Influence Score (SIS)c
My religious beliefs/spirituality. . . guide my interactions with coworkers. help me deal with stressful situations. drive my work ethic. supply me with wisdom/insight. guide decisions I make at work. influence my commitment. influence how I follow P&Ps. influence my individual goals as an employee. are critical in helping me get through each workday. are apparent to those with whom I work. are a normal part of my discussions with coworkers. Spiritual Influence Score (SIS)c
1,2 aResponses were based on a seven-point scale from 1-7 (1-strongly disagree to 7-strongly agree). bSpirituality Score range from 0-11 and is obtained by summing the results of the influence of religious/spiritual beliefs on daily life (0-strongly disagree to 6-strongly agree) and frequency of prayer or meditation (0-never to 5-daily). cSIS: Represented the sum of all answer codes for the above questions from Section A answered by either directors or employees. 0-4LS Means with different superscripts for each Spirituality Score are significantly different from each other. ANOVA, p-value of at least 0.05.
45
46
Religious/Spiritual Workplace Actions
Directors’ and employees’ religious/spiritual actions (Section B of questionnaire)
were more apparent in the workplace as Religiosity and Spirituality Scores increased. In
other words the mean scores (on a scale of 1=strongly disagree to 7=strongly agree)
increased as Religiosity and Spirituality Scores increased (Tables 7 and 8). Participants
with higher Religiosity and Spirituality Scores had increasing levels of agreement that
they pray about work related issues, have spiritual/religious feelings at work, and rely on
spiritual insight to make decisions at work (Tables 7 and 8).
The Spiritual Action Score (SAS), which was the summed means of questions
from section B, increased as the directors’ and employees’ Religiosity and Spirituality
Scores increased (Table 7 and 8). Directors’ Religiosity and Spirituality Scores were
both positively correlated to the directors’ SAS. The Spirituality Score (R-Sq=0.81;
p<0.0001) had a higher correlation than was seen with the Religiosity Score (R-Sq=0.57;
p<0.0001). There was also a positive correlation between the employees’ Religiosity (R-
Sq=0.48; p<0.0001) and Spirituality (R-Sq=0.75; p<0.0001) Scores and SAS.
Trustworthiness
Directors’ Trustworthiness
The majority of directors believe that their employees consider them to be fair
(98.45%), honest and trustworthy (97.67%), easily approachable (96.90%), and a person
whose actions reflect their beliefs (89.15%). Generally, their employees’ perceptions
were lower. Employees’ perceived their directors as being fair (87.64%), honest and
trustworthy (85.11%), easily approachable (87.43%), and a person whose actions reflect
47
Table 7. Spiritual Actionsa by Religiosity Score Director Responses Religiosity Scoreb 0 (n=38) 1 (n=13) 2 (n=13) 3 (n=13) 4 (n=52) LS Mean± SE I Often. . . follow God’s (a Supreme Being’s) example. have spiritual/religious feelings at work. rely on spiritual insight in making decisions. pray about work-related issues. Spiritual Action Score (SAS) c
3.8 3.2 3.4 3.0
13.5
±0.23 ±0.26 ±0.26 ±0.29 ±0.93
2,3,4
2,3,4
2,3,4
2,3,4
2,3,4
4.2 3.7 3.8 3.5
15.2
±0.39 ±0.44 ±0.44 ±0.49 ±1.57
4
4
4
4
4
4.9 4.4 4.5 4.3
18.1
±0.39 ±0.44 ±0.44 ±0.49 ±1.57
0,4
0,4
0,4 0
0.4
5.2 4.8 4.8 4.5
19.4
±0.39 ±0.44 ±0.44 ±0.49 ±1.57
0
0
0
0
0
5.9 5.7 5.5 5.3
22.5
±0.20 ±0.22 ±0.22 ±0.24 ±0.79
0,1,2
0,1,2
0,1,2 0,1
0,1,2 Employee Responses
n=162 n=55 n=61 n=50 n=187
I Often. . . follow God’s (a Supreme Being’s) example. have spiritual/religious feelings at work. rely on spiritual insight in making decisions. pray about work-related issues. Spiritual Action Score (SAS) c
4.1 3.7 3.7 3.4
15.0
±0.12 ±0.12 ±0.12 ±0.13 ±0.44
1,2,3,4
1,2,3,4
1,2,3,4
1,2,3,4
1,2,3,4
4.7 4.3 4.2 4.1
17.4
±0.20 ±0.21 ±0.21 ±0.23 ±0.76
0,4
0,3,4
0,2,3,4 0,3,4
0,2,3,4
5.2 4.8 4.9 4.7
19.6
±0.19 ±0.20 ±0.20 ±0.22 ±0.72
0,4
0,4
0,1,4 0,4
0,1,4
5.2 5.1 4.9 4.8
20.1
±0.21 ±0.22 ±0.22 ±0.24 ±0.80
0,4
0,1
0,1,4 0,1,4
0,1,4
5.8 5.5 5.4 5.5
20.1
±0.11 ±0.11 ±0.11 ±0.12 ±0.41
0,1,2,3
0,1,2
0,1,2,3 0,1,2,3
0,1,2,3 aResponses were based on a seven-point scale from 1-7 (1-strongly disagree to 7-strongly agree). bReligiosity Score was given according to attendance of worship service in the past month. Scores ranged from 0-4 (0-no attendance to 4-four or more times). cSAS: Represented the sum of all answer codes for the above questions from Section Banswered by either directors or employees. 0-4LS Means with different superscripts for each Religiosity Score are significantly different from each other. ANOVA, p-value of at least 0.05.
47
48
Table 8. Spiritual Actionsa by Spirituality Score Director Responses Spirituality Scoreb Low (n=16) Medium (n=30) High (n=81) LS Mean± SE I Often. . . follow God’s (a Supreme Being’s) example. have spiritual/religious feelings at work. rely on spiritual insight in making decisions. pray about work-related issues. Spiritual Action Score (SAS) c
2.5 1.8 2.2 1.8
8.2
±0.30 ±0.33 ±0.33 ±0.37 ±1.12
2,3
2,3
2,3
2,3
2,3
4.3 3.6 3.5 3.1
14.5
±0.22 ±0.24 ±0.24
±0.27 ±0.82
1,3
1,3
1,3
1,3
1,3
5.7 5.5 5.5 5.3
22.0
±0.14 ±0.15 ±0.15 ±0.16 ±0.50
1,2
1,2
1,2
1,2
1,2 Employee Responses
n=47 n=86 n=341
I Often. . . follow God’s (a Supreme Being’s) example. have spiritual/religious feelings at work. rely on spiritual insight in making decisions. pray about work-related issues. Spiritual Action Score (SAS) c
2.5 2.3 2.4 1.9
9.0
±0.17 ±0.19 ±0.19 ±0.21 ±0.63
2,3
2,3
2,3
2,3
2,3
4.4 3.9 3.9 3.7
15.8
±0.13 ±0.14 ±0.14 ±0.15 ±0.47
1,3
1,3
1,3
1,3
1,3
5.7 5.5 5.4 5.4
22.0
±0.06 ±0.07 ±0.07 ±0.08 ±0.24
1,2
1,2
1,2
1,2
1,2 aResponses were based on a seven-point scale from 1-7 (1-strongly disagree to 7-strongly agree) bSpirituality Score range from 0-11 and is obtained by summing the results of the influence of religious/spiritual beliefs on daily life (0-strongly disagree to 6-strongly agree) and frequency of prayer or meditation (0-never to 5-daily). cSAS: Represented the sum of all answer codes for the above questions from Section B answered by either directors or employees. 0-4LS Means with different superscripts for each Spirituality Score are significantly different from each other. ANOVA, p-value of at least 0.05.
48
49
his/her beliefs (73.14%). These differences were not significant except for the perception
of the director being honest and trustworthy (t=3.01; p=0.0003). Collective responses
and differences are found in Tables 9 and 10.
Trust was further explored through questions from Section E (Questions 30, 41,
42, 44, 46). Most directors (94.57%) claimed to frequently go beyond self-interest for the
good of the group, 93.75% thought they acted in ways that builds others’ respect for
them, and 90.55% believe they treat others as individuals (Table 11). When employees
were asked these same questions regarding their director they responded that only
69.04% of directors go beyond self-interest for the good of the group, 68.32% act in a
way that builds others’ respect for them, and 79.19% treat others as individuals (Table
11). Just under one-third of directors (32.03%) and employees (32.17%) agreed that
either they, as the directors, or their director frequently discloses their most important
values and beliefs at work (Table 11). The differences between these responses were all
significant (Table 10).
Questions from Sections C and E on the director survey and the employee survey
were summed to generate two distinct Director Trust Scores (DTS): (1) the DTS from the
director survey rated by the director himself/herself, and (2) the DTS score from the
employee survey rated by the director’s employees. Using a two-sample t-test, analysis
of the difference between the two DTS indicated that directors rated themselves as being
more trustworthy than did their employees (t= 4.33; p<0.0001) (Table 10).
50
Table 10. Director and Employee Response Differences for Trust Questions (Director - Employee Responses) na Mean±SD t-value p-value
Section C. In general, my employees view me as… (director survey) minus In general, my director/manager is… (employee survey) fair. honest and trustworthy. easily approachable. a person whose actions reflect my beliefs. Section E. I … (director survey) minus My Director … (employee survey) go beyond self-interest for the good of the group. act in ways that build others’ respect for me. treat others as individuals. consider moral and ethical consequences. talk about my most important values and beliefs. Section D. In general, my employees are… (director survey) minus In general, my director/manager views me as… (employee survey) honest and trustworthy. committed to me as their manager/supervisor. hard-working and motivated to do their best. committed to their jobs. individuals whose actions reflect their beliefs. individuals with strong moral values. DTS Difference: Director-Rated DTSb minus Employee-Rated DTS ETS Difference: Director-Rated ETSc minus Employee-Rated ETS
aNumbers of subjects differ due to varying response rate. bDTS: Represented the sum of all answer codes for the above questions from Sections C and E (questions #30, 41, 42, 44, and 46) answered by either directors or employees. cETS: Represented the sum of all answer codes for the above questions from Section D answered by either directors or employees.
Table 9. Trustworthiness of Directors Director Responses Agreea Neutral Disagree n % n % n % Section C. In general, my employees view me as… fair. honest and trustworthy. easily approachable. a person whose actions reflect my beliefs.
127 126 125 115
98.45 97.67 96.90 89.15
2 3 4 11
1.55 2.33 3.10 8.52
0 0 0 3
0.00 0.00 0.00 2.33
Employee Responses
Section C. In general, my director/manager is… fair. honest and trustworthy. easily approachable. a person whose actions reflect his/her beliefs.
461 446 459 384
87.64 85.11 87.43 73.14
26 37 16 93
4.19 7.07 3.05 17.72
43 41 50 48
8.17 7.82 9.52 9.14
aResponses have been collapsed into three categories: (1) Agree (‘Strongly Agree, Agree, and Somewhat Agree’), (2) Neutral (‘Neither Agree or Disagree’), and (3) Disagree (‘Somewhat Disagree, Disagree, and Strongly Disagree’).
51
Table 12. Trustworthiness of Employees Director Responses Agreea Neutral Disagree n % n % n % Section D. In general, my employees are… honest and trustworthy. committed to me as their manager/supervisor. hard-working and motivated to do their best. committed to their jobs. individuals whose actions reflect their beliefs. individuals with strong moral values.
122 115 114 111 104 101
94.57 89.15 88.37 86.05 80.62 78.29
5 12 10 11 4 18
3.88 9.30 7.75 8.52 13.95 13.96
2 2 5 7 7 10
1.55 1.55 3.88 5.43 5.43 7.75
Employee Responses
Section D. In general, my director/manager views me as… honest and trustworthy. committed to them as my manager/supervisor. hard-working and motivated to do my best. committed to my job. an individual whose actions reflect my beliefs. a person with strong moral values.
496 482 501 499 434 478
94.30 93.63 95.25 95.05 82.51 90.87
23 34 19 20 83 39
4.37 6.47 3.61 3.81 15.78 7.42
7 10 6 6 9 9
1.33 1.90 1.14 1.14 1.71 1.71
aResponses have been collapsed into three categories: (1) Agree (‘Strongly Agree, Agree, and Somewhat Agree’), (2) Neutral (‘Neither Agree or Disagree’), and (3) Disagree (‘Somewhat Disagree, Disagree, and Strongly Disagree’).
Table 11. Trustworthy Actions of Directors Director Responses Frequentlya Sometimes Not at all n % n % n % Section E. I … go beyond self-interest for the good of the group. act in ways that build others’ respect for me. treat others as individuals. consider moral and ethical consequences. talk about my most important values and beliefs.
122 120 115 116 41
94.57 93.75 90.55 89.92 32.03
7 8 11 13 80
5.43 6.25 8.66 10.08 62.5
0 0 1 0 7
0 0 0.79 0 5.47
Employee Responses
Section E. My Director … Goes beyond self-interest for the good of the group. Acts in ways that build my respect. Treats me as an individual. Considers moral and ethical consequences. Talks about their most important values and beliefs.
359 354 411 347 166
69.04 68.21 79.19 67.38 32.17
131 135 87 147 260
25.19 26.01 16.76 28.54 50.39
30 30 21 21 90
5.77 5.78 4.05 4.08 17.44
aResponses have been collapsed into three categories: (1) Frequently (‘Frequently, if not always and Fairly often’), (2) Sometimes (‘Sometimes’), and (3) Not at all (‘Once in a while and Not at all’).
52
Employees’ Trustworthiness
Similar to the questions asked regarding the trustworthiness of the directors,
Section D investigated the trustworthiness of participating employees. Comprehensive
responses to questions are found in Table 12. Responses by the employees themselves
and their directors were similar. For example, 94.3% of employees thought their director
perceived them as being honest and trustworthy, which the majority did (94.57%). The
majority of employees believe that their directors considered them to be hard-working
and motivated (95.25%), committed to their job (95.05%), and committed to their
supervisor (93.63%), compared to their directors’ response of 88.37%, 86.05%, and
89.15% respectively. There was even greater variation between the employees’ belief
that their directors perceived them as individuals with strong moral values (90.87%) and
the actual perception of their directors (78.29%). Director and employee responses were
significantly different for each of the individual questions, with the employees’ responses
being greater than the directors’ responses (Table 10).
Similar to the DTS, an Employee Trust Score (ETS) was generated by summing
the responses from Section D on both the director and employee surveys. As with the
directors, the two-sample t-test analysis of the ETS differences illustrated that employees
generally thought their directors would perceive their (the employees’) trustworthiness
higher than what the directors perception actually was (t= -7.22, p<0.0001) (Table 10).
These findings are dissimilar to Patterson and Kim’s (24) national survey which reported
that both management and workers rated workers as being more trustworthy than
directors.
53
Trust by Religiosity and Spirituality Scores
Analysis of variance (ANOVA) was used to assess the influence of the Religiosity
and Spirituality Scores on trust. Individual questions investigating trust were compared
to both the Religiosity and Spirituality Scores. Using ANOVA and Pearson’s
Correlation, summed trust scores (DTS and ETS) were compared to both the directors’
and employees’ Religiosity and Spirituality Scores.
Self-Rated Directors’ Trust by Directors’ Religiosity and Spirituality Scores
Directors’ responses to how they believed their employees viewed their
trustworthiness (questions from Sections C) and their trust-related actions (questions 30,
41, 42, 44, 46 from Section E) were compared to their own Religiosity and Spirituality
Scores (Table 13a and 14a). There were no consistent patterns found among the
questions. Directors who had Religiosity Scores of 0, 1, 3 and 4 rated themselves as
being perceived by their employees as being more easily approachable and acting in ways
that build others’ respect for themselves than did directors with Religiosity Scores of 2.
There were no differences seen in these three questions when compared to the Spirituality
Score. Those with the highest Religiosity Score [4] thought they were perceived as being
more honest than those with a Religiosity Score of 2. However, there was no significant
difference seen in the other Religiosity Score levels or in any of the Spirituality Score
levels. Directors who had a Religiosity Score of at least 4 marked that they consider
moral and ethical consequences significantly more than did those who had a Religiosity
Score of 0. The only significant difference seen by Spirituality Score was that directors
with the highest Spirituality Score claimed to disclose their most important values and
54
Table 13. Director’s Trustab by Director’s Religiosity Score 13a. Director Responses Religiosity Scorec 0 (n=38) 1 (n=13) 2 (n=13) 3 (n=13) 4 (n=52) LS Mean± SE In general, my employees view me as …a fair. honest and trustworthy. easily approachable a person whose actions reflects my beliefs
6.0 6.1 6.1 5.6
±0.10 ±0.11 ±0.12 ±0.17
2
2
5.9 6.2 6.1 5.3
±0.17 ±0.19 ±0.21 ±0.29
2
4
5.5 5.8 5.4 5.5
±0.17 ±0.19 ±0.21 ±0.29
0.34
4
0,1,3,4
6.0 6.2 6.1 5.8
±0.17 ±0.19 ±0.21 ±0.29
2
2
6.3 6.3 6.2 6.0
±0.08 ±0.10 ±0.10 ±0.14
2
2
2
1
I …b consider moral and ethical consequences. treat others as individuals. go beyond self-interest for the good of the group. act in ways that build others’ respect for me. talk about my most important values and beliefs. Director Trust Score (DTS) d
5.7 6.1 6.1 6.1 4.0
39.1
±0.18 ±0.18 ±0.14 ±0.15 ±0.24 ±0.64
4
2
3,4
5.8 6.1 5.8 6.0 3.6
38.5
±0.30 ±0.30 ±0.24 ±0.26 ±0.41 ±1.10
2
3,4
6.3 6.0 6.3 5.2 4.2
31.2
±0.30 ±0.30 ±0.24 ±0.26 ±0.41 ±1.10
0,1,3,4
3
3,4
6.3 6.1 6.0 6.0 5.2
40.5
±0.30 ±0.30 ±0.24 ±0.26 ±0.41 ±1.10
2
0,1,2
2
6.3 6.1 6.0 5.8 4.6
40.6
±0.15 ±0.15 ±0.12 ±0.12 ±0.20 ±056
0
2
0,1
2 13b. Employee Responses
n=162 n=55 n=61 n=50 n=187
In general, my director/manager is …a fair. honest and trustworthy. easily approachable. a person whose actions reflects my beliefs.
5.9 5.7 5.9 5.4
±0.17 ±0.20 ±0.18 ±0.20
5.9 5.8 6.1 5.2
±0.29 ±0.35 ±0.31 ±0.34
5.7 5.8 5.5 5.2
±0.29 ±0.35 ±0.31 ±0.34
5.8 5.9 5.8 5.6
±0.28 ±0.33 ±0.30 ±0.33
5.9 5.9 6.0 5.7
±0.14 ±0.17 ±0.15 ±0.17
My Director …b Considers moral and ethical consequences. Treats me as an individual. Goes beyond self-interest for the good of the group. Acts in ways that build my respect. Talks about their most important values and beliefs. Director Trust Score (DTS) d
4.9 5.5 5.5 5.2 3.7
47.9
±0.23 ±0.20 ±0.23 ±0.24 ±0.24 ±1.52
2
4.9 5.7 5.2 5.2 3.4
46.9
±0.38 ±0.33 ±0.39 ±0.41 ±0.42 ±2.60
5.1 5.7 4.6 4.6 2.8
44.5
±0.38 ±0.33 ±0.39 ±0.44 ±0.42 ±2.71
0,3,4
5.4 5.8 5.2 5.5 4.0
48.9
±0.36 ±0.32 ±0.38 ±0.39 ±0.41 ±2.50
2
5.4 5.8 5.4 5.5 4.2
49.7
±0.18 ±0.17 ±0.20 ±0.20 ±0.21 ±1.27
2
aResponses were based on a seven-point scale from 1-7 (1-strongly disagree to 7-strongly agree). bResponses were converted to a seven-point scale from 1-7 (1-Frequently, if not always to 7-not at all). cReligiosity Score was given according to attendance of worship service in the past month. Scores ranged from 0-4 (0-no attendance to 4-four or more times). dDTS: Represented the sum of all answer codes for the above questions from Section C and E (questions #30, 41, 42, 44, and 46) answered by either directors or employees. 0-4LS Means with different superscripts for each Religiosity Score are significantly different from each other. ANOVA, p-value of at least 0.05.
54
55
Table 14. Director’s Trust ab by Director’s Spirituality Score 14a. Director Responses Spirituality Scorec Low (n=16) Medium (n=30) High (n=81) LS Mean± SE In general, my employees view me as … a honest and trustworthy. fair. easily approachable. a person whose actions reflects my beliefs.
6.3 6.0 6.0 5.4
±0.18 ±0.16 ±0.20 ±0.26
6.0 5.9 6.0 5.6
±0.13 ±0.11 ±0.14 ±0.19
6.2 6.1 6.1 5.9
±0.08 ±0.07 ±0.09 ±0.11
I … b consider moral and ethical consequences. treat others as individuals. go beyond self-interest for the good of the group. act in ways that build others’ respect for me. talk about my most important values and beliefs. Director Trust Score (DTS) d
5.8 6.3 6.0 5.8 3.9
38.6
±0.29 ±0.27 ±0.21 ±0.23 ±0.38 ±1.01
3
5.8 6.0 6.1 6.0 4.0
38.6
±0.21 ±0.20 ±0.17 ±0.17 ±0.27 ±0.75
3
6.3 6.1 6.1 5.8 4.6
40.1
±0.12 ±0.12 ±0.09 ±0.11 ±0.71 ±0.45
1,2
14b. Employee Reponses
n=47 n=86 n=341
In general, my director/manager is … a honest and trustworthy. fair. easily approachable. a person whose actions reflects my beliefs.
5.5 6.0 5.6 5.2
±0.30 ±0.25 ±0.28 ±0.29
2
6.0 6.0 6.0 5.9
±0.23 ±0.19 ±0.21 ±0.22
1
5.8 5.9 5.9 5.5
±0.13 ±0.11 ±0.12 ±0.13
My Director … b considers moral and ethical consequences. treats me as an individual. goes beyond self-interest for the good of the group. acts in ways that build my respect. talks about their most important values and beliefs. Director Trust Score (DTS) d
5.2 5.7 5.4 5.2 3.9
47.2
±0.33 ±0.29 ±0.35 ±0.38 ±0.39 ±2.31
5.2 6.0 5.7 5.7 3.9
50.1
±0.26 ±0.21 ±0.26 ±0.29 ±0.29 ±1.75
5.2 5.7 5.2 5.2 3.7
48.0
±0.15 ±0.12 ±0.15 ±0.17 ±0.17 ±1.01
aResponses were based on a seven-point scale from 1-7 (1-strongly disagree to 7-strongly agree). bResponses were converted to a seven-point scale from 1-7 (1-Frequently, if not always to 7-not at all). cSpirituality Score range from 0-11 and is obtained by summing the results of the influence of religious/spiritual beliefs on daily life (0-strongly disagree to 6-strongly agree) and frequency of prayer or meditation (0-never to 5-daily). dDTS: Represented the sum of all answer codes for the above questions from Section C and E (questions #30, 41, 42, 44, and 46) answered by either directors or employees. 0-4LS Means with different superscripts for each Spirituality Score are significantly different from each other. ANOVA, p-value of at least 0.05.
55
56
beliefs more frequently than did those with lower Spirituality Scores. This trend was also
seen as the Religiosity Score increased.
Analysis of variance of the DTS and Religiosity Score found that directors who
had a Religiosity Score of 3 or 4 had a significantly higher DTS than those directors with
a Religiosity Score of 2. However, there was no difference seen in those that had a
Religiosity Score of 1 or less, and there were no differences seen based on the Spirituality
Score (Table 13a). There was a significant Pearson’s Correlation between the director-
rated DTS and their Religiosity (R-Sq=0.18, p=0.039) and Spirituality (R-Sq=0.26,
p=0.003) Scores, with high DTS seen at higher scores.
Employee-Rated Directors’ Trust by Directors’ Religiosity and Spirituality Scores
The directors’ Religiosity and Spirituality Scores do not appear to influence the
amount of trust that employees have in them (Table 13b and 14b). Few significant
differences were found in analysis of the employees’ perception of their directors’
trustworthiness by the directors’ Religiosity and Spirituality Scores. Employees
perceived that directors with a Religiosity Score of 0, 3 or 4 talked about their most
important values and beliefs more often than directors with a Religiosity Score of 2.
Directors with a moderate Spirituality Score were seen as persons whose actions reflected
their beliefs more so than those with a low Spirituality Score. No other significant
differences were seen using either the Religiosity or Spirituality Scores. Analysis of
variance and Pearson’s Correlation found that there were no significant relationships
between the employee-rated DTS and the directors’ Religiosity (R-Sq=0.10, p=0.26) and
Spirituality Scores (R-Sq=0.01, p=0.92).
57
Employee-Rated Directors’ Trust by Employees’ Religiosity and Spirituality Scores
There was little difference seen in the way employees rated their directors’
trustworthiness based on their own Religiosity and Spirituality Scores (Table 15 and 16).
Employees with a Religiosity Score of 4 stated that their directors treat them as
individuals more often than did those employees with a Religiosity Score of only 2, but
there were no differences seen in the other three (0, 1, and 3) Religiosity Score levels.
Also, there was no difference in the way employees rated their director based on their
own Spirituality Score. Analysis of variance and Pearson’s Correlation found that there
were no positive relationship between the employee-rated DTS and the employees’
Religiosity (R-Sq=0.03, p=0.57) and Spirituality Scores (R-Sq=0.01, p=0.87).
Self-Rated Employees’ Trust by Employees’ Religiosity and Spirituality Scores
Similar to the directors, employee responses regarding how they thought their
director perceived their trustworthiness (questions from Section D) were compared to
their own Religiosity and Spirituality Scores (Table 17 and 18). Again, there were no
consistent trends seen among the questions. Employees who had a Religiosity Score of 4
felt that they were individuals whose actions reflected their beliefs more than those
employees that had a Score of 0. Employees with high Spirituality Scores rated
themselves as being individuals whose actions reflected their beliefs more than those with
moderate Spirituality Scores. Those employees with Religiosity Scores of 2, reported
they were viewed by their director as being more honest and trustworthy than those with
a Religiosity Score of 0. There were a few other differences seen based on Religiosity
Score, however findings were inconsistent and scattered (Table 17).
58
Table15. Employee-Rated Director’s Trustab by Employees’ Religiosity Score Religiosity Scorec 0 (n=162) 1 (n=55) 2 (n=61) 3 (n=50) 4 (n=187) LS Mean± SE In general, my director/manager is …a fair. honest and trustworthy. easily approachable. a person whose actions reflects his/her beliefs.
5.9 5.8 5.9 5.4
±0.11 ±0.11 ±0.11 ±0.12
5.9 5.9 5.9 5.5
±0.18 ±0.19 ±0.19 ±0.20
5.7 5.8 5.6 5.4
±0.17 ±0.18 ±0.18 ±0.19
5.8 5.9 5.8 5.3
±0.19 ±0.20 ±0.20 ±0.21
5.9 5.8 5.9 5.6
±0.10 ±0.10 ±0.11 ±0.11
My Director …b considers moral and ethical consequences. treats me as an individual. goes beyond self-interest for the good of the group. acts in ways that build my respect. talks about their most important values and beliefs. Director Trust Score (DTS) d
5.1 5.7 5.2 5.2 3.4
36.3
±0.14 ±0.12 ±0.14 ±0.14 ±0.15 ±0.71
5.2 5.8 5.4 5.4 2.3
3.68
±0.23 ±0.21 ±0.24 ±0.24 ±0.26 ±1.22
5.2 5.4 5.2 5.4 3.9
35.5
±0.21 ±0.21 ±0.23 ±0.23 ±0.24 ±1.16
4
5.2 5.7 4.9 4.9 3.7
36.0
±0.24 ±0.23 ±0.26 ±0.26 ±0.27 ±1.31
5.2 5.8 5.2 5.4 3.7
37.0
±0.12 ±0.12 ±0.12 ±0.14 ±0.14 ±0.65
2
aResponses were based on a seven-point scale from 1-7 (1-strongly disagree to 7-strongly agree). bResponses were converted to a seven-point scale from 1-7 (1-Frequently, if not always to 7-not at all). cReligiosity Score was given according to attendance of worship service in the past month. Scores ranged from 0-4 (0-no attendance to 4-four or more times). dDTS: Represented the sum of all answer codes for the above questions from Section C and E (questions #30, 41, 42, 44, and 46) answered by employees. 0-4LS Means with different superscripts for each Religiosity Score are significantly different from each other. ANOVA, p-value of at least 0.05.
58
59
Table 16. Employee-Rated Director’s Trustab by Employees’ Spirituality Score Spirituality Scorec Low (n=47) Medium (n=86) High (n=341) LS Mean± SE In general, my director/manager is …a fair. honest and trustworthy. easily approachable. a person whose actions reflects my beliefs.
5.9 6.0 6.0 5.3
±0.20 ±0.21 ±0.21 ±0.22
5.9 6.0 5.9 5.6
±0.15 ±0.15 ±0.16 ±0.16
5.9 5.8 5.8 5.5
±0.07 ±0.08 ±0.08 ±0.08
My Director …b considers moral and ethical consequences. treats me as an individual. goes beyond self-interest for the good of the group. acts in ways that build my respect. talks about their most important values and beliefs. Director Trust Score (DTS)d
4.9 5.5 5.1 5.2 2.1
35.8
±0.24 ±0.23 ±0.26 ±0.26 ±0.27 ±0.69
5.2 5.8 5.4 5.5 3.4
36.8
±0.18 ±0.17 ±0.18 ±0.20 ±0.20 ±0.96
5.2 5.7 5.2 5.2 3.7
36.5
±0.09 ±0.09 ±0.09 ±0.09 ±0.11 ±0.49
aResponses were based on a seven-point scale from 1-7 (1-strongly disagree to 7-strongly agree). bResponses were converted to a seven-point scale from 1-7 (1-Frequently, if not always to 7-not at all). cSpirituality Score range from 0-11 and is obtained by summing the results of the influence of religious/spiritual beliefs on daily life (0-strongly disagree to 6-strongly agree) and frequency of prayer or meditation (0-never to 5-daily). dDTS: Represented the sum of all answer codes for the above questions from Section C and E (questions #30, 41, 42, 44, and 46) answered by employees. 0-4LS Means with different superscripts for each Spirituality Score are significantly different from each other. ANOVA, p-value of at least 0.05.
59
60
Table 17. Self-Rated Employees’ Trusta by Employees’ Religiosity Score Religiosity Scoreb 0 (n=162) 1 (n=55) 2 (n=61) 3 (n=50) 4 (n=187) LS Mean± SE In general, my director/manager views me as … hard-working and motivated to do my best. committed to my jobs. honest and trustworthy. a person with strong moral values. committed to them as my manager/supervisor. an individual whose actions reflect my beliefs. Employee Trust Score (ETS)c
6.1 6.1 6.0 5.7 5.9 5.5
35.4
±0.07 ±0.07 ±0.07 ±0.08 ±0.08 ±0.09 ±0.38
2
2,4
4
2,4
6.2 6.2 6.1 5.9 6.0 5.8
36.2
±0.12 ±0.12 ±0.12 ±0.13 ±0.13 ±0.15 ±0.66
6.3 6.3 6.3 6.2 6.1 5.8
37.0
±0.11 ±0.11 ±0.11 ±0.13 ±0.13 ±0.14 ±0.63
3
0
0,3
0
6.0 5.9 6.0 5.8 5.8 5.7
35.2
±0.13 ±0.12 ±0.13 ±0.14 ±0.14 ±0.16 ±0.69
4
2,4
2,4
4
6.3 6.2 6.2 6.1 6.1 6.0
36.9
±0.06 ±0.06 ±0.07 ±0.07 ±0.07 ±0.08 ±0.36
3
3
0,3
0
0,3
aResponses were based on a seven-point scale from 1-7 (1-strongly disagree to 7-strongly agree). bReligiosity Score was given according to attendance of worship service in the past month. Scores ranged from 0-4 (0-no attendance to 4-four or more times). cETS: Represented the sum of all answer codes for the above questions from Section D answered by employees. 0-4LS Means with different superscripts for each Religiosity Score are significantly different from each other. ANOVA, p-value of at least 0.05.
Table 18. Self-Rated Employees’ Trusta by Employees’ Spirituality Score Spirituality Scoreb Low (n=47) Medium (n=86) High (n=341) LS Mean± SE In general, my director/manager views me as … hard-working and motivated to do my best. committed to my jobs. honest and trustworthy. a person with strong moral values. committed to them as my manager/supervisor. an individual whose actions reflect my beliefs. Total Employee Trust Score (ETS)c
6.2 6.2 6.2 5.8 6.0 5.6
35.9
±0.13 ±0.13 ±0.13 ±0.14 ±0.14 ±0.16 ±0.69
6.2 6.3 6.1 5.9 6.0 5.6
36.1
±0.09 ±0.09 ±0.09 ±0.10 ±0.10 ±0.11 ±0.51
3
6.2 6.2 6.1 6.0 6.0 5.9
36.4
±0.05 ±0.05 ±0.05 ±0.05 ±0.05 ±0.06 ±0.26
2
aResponses were based on a seven-point scale from 1-7 (1-strongly disagree to 7-strongly agree). bSpirituality Score range from 0-11 and is obtained by summing the results of the influence of religious/spiritual beliefs on daily life (0-strongly disagree to 6-strongly agree) and frequency of prayer or meditation (0-never to 5-daily). dETS: Represented the sum of all answer codes for the above questions from Section D answered by employees. 0-4LS Means with different superscripts for each Spirituality Score are significantly different from each other. ANOVA, p-value of at least 0.05.
60
61
Analysis of Variance of the ETS rated by the employee and the employees’
Religiosity Score reflected an increase in ETS in those employees who had a Religiosity
Score of 4 compared to employees who had a Religiosity Score of 0 and 3. Those with a
Religiosity Score of 2 had a significantly higher ETS than did employees with a Score of
0 (Table 17). There were no differences found in ETS based on the Spirituality Score. A
positive correlation was shown between the employee-rated ETS and their Religiosity
Score (R-Sq=0.10, p<0.020), but no significant correlation was found between the
employee-rated ETS and their Spirituality Score.
Director-Rated Employees’ Trust by Directors’ Religiosity and Spirituality Scores
Generally, directors do not rate their employees’ trustworthiness differently based
on their own Religiosity and Spirituality Scores. There were a few differences as seen in
Tables 19 and 20, but no consistently identified trend. Directors with the highest [4] or
the lowest [0] Religiosity Scores perceived their employees as being more honest and
trustworthy than did the directors who had Religiosity Scores of 1 or 2. Employees were
rated as being individuals whose actions reflect their beliefs more often by those directors
with a Religiosity Score of 3 or 4 over directors who had Scores of 1 or 2. Directors with
Religiosity Scores of 0 or 3 perceived their employees as being individuals with strong
moral values more so than did directors with a Score of 1. There were no differences
found using ANOVA and Pearson’s Correlation in the director-rated ETS and the
directors’ Religiosity Score (Table 19).
Directors with the high Spirituality Scores rated their employees as being
individuals whose actions reflect their beliefs more frequently than did directors with low
62
Table 20. Director-Rated Employees’ Trusta by Directors’ Spirituality Score Spirituality Scoreb Low (n=16) Medium (n=30) High (n=81)
LS Mean± SE In general, my employeez are … honest and trustworthy. hard-working and motivated to do their best. individuals whose actions reflect their beliefs. committed to me as their manager/supervisor. committed to their jobs. individuals with strong moral values. Employee Trust Score (ETS)c
5.8 6.1 5.0 5.9 5.9 5.5
34.2
±0.20 ±0.24 ±0.28 ±0.21 ±0.25 ±0.27 ±1.14
2
3
2
2
2
5.5 5.2 5.1 5.3 5.1 5.2
31.4
±0.14 ±0.18 ±0.20 ±0.15 ±0.18 ±0.20 ±0.83
1,3
3
1
1
1,3
5.8 5.7 5.6 5.5 5.5 5.4
33.5
±0.09 ±0.11 ±0.12 ±0.09 ±0.11 ±0.12 ±0.51
2
1,2
2 aResponses were based on a seven-point scale from 1-7 (1-strongly disagree to 7-strongly agree). bReligiosity Score was given according to attendance of worship service in the past month. Scores ranged from 0-4 (0-no attendance to 4-four or more times). dETS: Represented the sum of all answer codes for the above questions from Section D answered by directors. 0-4LS Means with different superscripts for each Spirituality Score are significantly different from each other. ANOVA, p-value of at least 0.05.
Table 19. Director-Rated Employees’ Trusta by Directors’ Religiosity Score Religiosity Scoreb 0 (n=38) 1 (n=13) 2 (n=13) 3 (n=13) 4 (n=52) LS Mean± SE In general, my employeez are … honest and trustworthy. hard-working and motivated to do their best. individuals whose actions reflect their beliefs. committed to me as their manager/supervisor. committed to their jobs. individuals with strong moral values. Employee Trust Score (ETS)c
5.9 5.8 5.4 5.6 5.4 5.5
33.6
±0.12 ±0.16 ±0.18 ±0.14 ±0.17 ±0.17 ±0.75
1,2
1
5.3 5.5 4.8 5.3 5.4 4.8
31.1
±0.21 ±0.27 ±0.30 ±0.24 ±0.30 ±0.30 ±1.28
0,4
3,4
0,3
5.4 5.4 4.8 5.3 5.2 5.1
31.2
±0.21 ±0.27 ±0.30 ±0.24 ±0.30 ±0.30 ±1.28
0,4
3,4
5.8 5.5 5.8 5.5 5.3 5.6
33.6
±0.21 ±0.27 ±0.30 ±0.24 ±0.30 ±0.30 ±1.28
1,2
1
5.8 5.6 5.6 5.6 5.5 5.3
33.5
±0.11 ±0.14 ±0.15 ±0.12 ±0.15 ±0.15 ±0.64
1,2
1,2
aResponses were based on a seven-point scale from 1-7 (1-strongly disagree to 7-strongly agree). bReligiosity Score was given according to attendance of worship service in the past month. Scores ranged from 0-4 (0-no attendance to 4-four or more times). dETS: Represented the sum of all answer codes for the above questions from Section D answered by directors. 0-4LS Means with different superscripts for each Religiosity Score are significantly different from each other. ANOVA, p-value of at least 0.05.
62
63
or moderate Spirituality Scores. Directors with the lowest Spirituality Score thought that
their employees were more committed to their jobs and to them as their supervisor than
those directors at the moderate Spirituality Score level. Directors with moderate
Spirituality Score were significantly less likely to perceive their employees as hard-
working and motivated than those directors with low or high Spirituality Scores. Finally,
there were significant differences between director-rated total ETS and Spirituality Score
levels of the directors (Table 20). Directors with moderate spirituality rated total ETS
less than those directors with a low or high spirituality.
Employee Commitment
When directors were asked about their employees’ commitment to their jobs,
86.05% of directors had a high level of agreement that their employees were committed.
Employees, however, thought their directors perceived them as being even more
committed to their jobs (95.05%). When employees were asked if they were considering
a job change in the near future 16.2% agreed or strongly agreed. Based on employees’
consideration for job change (question 68), it appears that directors perceived their
employees as being more committed than they actually are (t=11.62, p<0.0001). Also,
employees think their directors perceive them as being more committed than they
actually are (t=27.29, p<0.0001).
Employees’ commitment to their jobs was further explored comparing the
employees’ consideration of a job change in the near future (Question 68) to the
employees’ perception of their directors’ trust level (employee-rated DTS). Using
Pearson’s Correlation, there was a negative correlation found between the employees’
64
commitment and their trust for their director (R-Sq=-0.36, p<0.0001). Employees with
the lowest commitment levels had the lowest levels of trust for their directors.
65
DISCUSSION/CONCLUSIONS
Food service and nutrition directors and their employees are religious/spiritual
people, generally. A larger majority of directors surveyed reported attending worship
services at least four times the previous month than did their employees. However, a
greater percentage of employees than directors were rated highly spiritual due to their
increased frequency of prayer and daily influence of their religious and spiritual beliefs.
Large percentages of both directors and employees were influenced at work by their
religious and spiritual beliefs, and exhibited religious behavior in the workplace. Even
though directors and employees appeared to be fairy religious/spiritual, and even brought
those spiritual influences into their jobs, talking about their beliefs in the workplace was
still rare. Based on these results, the first hypothesis is accepted which suggested that
directors and employees that had higher Religiosity and Spirituality Scores would have a
higher level of agreement regarding statements of the influence of spirituality on their
workplace practices.
Hypothesis II expected directors that had higher Religiosity and Spirituality
Scores to be perceived by their subordinates as having increased characteristics that
promoted trust in the workplace. Contrary to what was hypothesized, there does not
appear to be any correlation between the directors’ religiosity and spirituality and their
employee-rated trustworthiness. Therefore, the second hypothesis must be rejected.
Hypothesis III anticipated that employees that had higher Religiosity and Spirituality
Scores would be perceived by their directors as having increased characteristics that
promote trust and commitment in the workplace. Reliable ANOVA and Pearson’s
Correlations for the director-rated trustworthiness and commitment of employees by the
66
employees’ Religiosity and Spirituality Scores could not be performed because each
director rated multiple employees. Therefore, the third hypothesis can neither be
accepted nor rejected. It is expected that the employees would mimic the directors and
most likely would not have had a correlation between their religious/spiritual beliefs and
their director-rated trustworthiness, but this could not be determined. As mentioned,
there was not a validated measure of trust available to use in this study to measure the
trustworthiness of directors and employees. Although this study measured trust using
verified aspects and characteristics of trust, it is difficult to know if results are an actual
reflection of trust.
Another aspect to consider is that because participants were, in general, highly
religious and spiritual, the influence of their beliefs on trust may not have been
differentiated. Though there was no significant correlation between trust and
religiosity/spirituality, directors and employees did, generally, exhibit high levels of trust-
promoting characteristics in the workplace. Again, it is questioned if the high degree of
trust in this population may have hidden specific relationships between trust and
religiosity/spirituality.
The majority of directors and employees believe others perceive them as being
trustworthy or having trust-promoting characteristics. Directors and employees tend to
over-rate their own trustworthiness when compared to ratings by their counterpart(s).
Both trustworthy characteristics and actions were explored in the directors. Results
illustrated that the employees’ perceptions were lower (usually 10 percent), but most
were not significantly lower regarding the directors’ trustworthy characteristics than
what the director thought the employees would perceive. Employee-ratings on the
67
directors’ trustworthy actions seen in the workplace were all significantly lower (20-
25%) than directors anticipated the employees would perceive. Even though employees
rated their directors’ trustworthiness significantly lower than directors thought they
would, the majority of directors were still perceived as being highly trustworthy by their
employees. Director and employee responses were in agreement on the fact that few
directors disclose their most important values and beliefs while at work which is known
to be a highly trust-promoting action (6, 9, 47).
Over four-fifths of directors agreed that their employees are honest and
trustworthy, hard-working and motivated to do their best, and committed to their jobs and
to them as their director. As with the directors, there was a significant difference in how
the employees expected their directors to perceive their trustworthiness and how the
directors actually perceived them. Yet, differences in the individual employees’ trust
questions were less (less than 10%) than those seen with directors’ trust questions.
However, there was a greater difference (greater than 10%) found in directors’ perception
that their employees were people with strong moral values and what employees
anticipated would be perceived by their directors. Also, directors expected their
employees to be more committed to their jobs than they actually were. Interestingly, the
employees even thought that their director would perceive them as being more committed
than they really were. Those less committed employees (as measured by strongly
considering a job change in the near future) trusted their directors less than did the more
committed employees, as was expected based on the literature (4, 36, 38).
Degree of religiosity and spirituality did not consistently affect the way directors
and employees rated each others’ trustworthiness, though it was related to how they
68
perceived their own trustworthiness. Generally, as the directors’ and employees’
religiosity and spirituality increased, self-perceived trustworthiness also increased.
For the most part, those directors and employees who attended worship services
more often were more likely to demonstrate specific spiritual actions and attitudes at
work. Likewise, those directors and employees that frequently prayed and felt their
religious beliefs/spirituality influenced their daily life were more likely to exhibit
spiritual behaviors in the workplace. Even those directors and employees that attended
worship services and prayed less often agreed that their religious/spiritual beliefs
influenced their attitudes and actions in the workplace. Though there has been an
unspoken rule that religion and spirituality remain compartmentalized from the
workplace, these results suggest that directors and employees in hospital food and
nutrition services do integrate their religious and spiritual beliefs in their daily work
practices, so expecting separation would be futile. Spiritual influence on management
and their subordinates in the workplace warrants further research.
FURTHER RESEARCH
In this study, commitment of employees was only based on their consideration of
changing jobs in the near future job, and the influence of employees’ religiosity and
spirituality on commitment was not investigated. A study of employees’ commitment
level, using a more complete, validated measure of commitment, would shed light on the
effects of religious and spiritual beliefs on commitment in the workplace. Further
investigation of trust compared to management and leadership styles would be another
opportunity for research.
69
REFERENCES
1. Kouzes JM, Posner BZ. The Jossey-Bass Academic Administrator’s Guide to Exemplary Leadership. San Francisco, CA: Jossey-Bass Publishers; 2003.
2. Barker AM, Arensberg MBF, Schiller MR. Leadership in Dietetics: Achieving a
Vision for the Future. Chicago, IL: The American Dietetic Association; 1994. 3. Davis JH, Schoorman FD, Mayer RC, Tan HH. The trusted general manager and
business unit performance: empirical evidence of a competitive advantage. Strategic Manag J. 2000;21:563-576.
4. Laschinger HKS, Finegan J, Shamian J. The impact of workplace empowerment,
organizational trust on staff nurses’ work satisfaction and organizational commitment. Health Care Manag Rev. 2001;26(3):7-23.
5. Mishra AK, Spreitzer GM. Explaining how survivors respond to downsizing: the
roles of trust, empowerment, justice, and work redesign. Acad Manag Rev. 1998;23:567-588.
6. Mishra J, Morrisey MA. Trust in employee/employer relationships: a survey of
West Michigan managers. Public Personnel Manag. 1990;19:443-61. 7. Giffords ED, Dina RP. Changing organizational cultures: the challenge in forging
successful mergers. Admin Soc Work. 2003;27:69-81. 8. Martins, N. A model for managing trust. Int J Manpower. 2002;23:754-769. 9. Rusaw AC. The ethics of leadership trust. Int J Organ Theory Behav.
2000;3:547-547. 10. Mayer RC, Davis JH, Schoorman FD. An integrative model of organizational
trust. Acad Manag Rev. 1995;20:709-734. 11. Raths D. Bridging the generation gap. InfoWorld. 1999;21(45):84. 12. Tulgan B. Managing Generation X: How to Bring out the Best in Young Talent.
Oxford: Capstone Publishing Limited; 1996. 13. Mitroff II, Denton EA. A Spiritual Audit of Corporate America: a Hard Look at
Spirituality, Religion, and Values in the Workplace. San Francisco, CA: Jossey-Bass Inc.; 1999.
14. Keaveney SM. When MTV goes CEO: what happens when the unmanageable become managers? Marketing Manag. 1997;6(3):21-24.
70
15. Laabs JJ. Balancing spirituality and work. Personnel J. 1995;74(9):60-69. 16. Gallup, Jr. G, Jones T. The Next American Spirituality: Finding God in the
Twenty-First Century. Colorado Springs, CO: Cook Communications; 2000. 17. Digh P. Religion in the workplace: make a good-faith effort to accommodate. HR
Magazine. 1998;43(13):84-91. 18. Conlin M. Religion in the workplace: the growing presence of spirituality in
corporate America. Bus Week. 1999; Nov 1:150-158. 19. Skousen KM. The Effect of Religiosity and Spirituality on Work Practices of
Dietitians in Management Roles. Provo, UT: Brigham Young University; 2001. Unpublished thesis.
20. Hill PC, Hood RW. Measures of Religiosity. Birmingham, AL: Religious
Education Press; 1999. 21. Merriam-Webster Online Dictionary. <http://www.m-w.com/dictionary.htm> 22. Nanus B. Visionary Leadership: Creating a Compelling Sense of Direction for
Your Organization. San Francisco, CA: Jossey-Bass Inc; 1992. 23. Offermann LR, Hanges PJ, Day DV. Leaders, followers, and values: progress
and prospects for theory and research. Leadership Q. 2001;12:129-131. 24. Patterson J, Kim P. The Day America Told the Truth. New York, NY: Penguin
Books USA Inc.; 1992. 25. General Social Survey 2002 at <http://www.thearda.com> April 2004. 26. Lombardi DN. Handbook for the New Health Care Manager. 2nd ed. San
Francisco, CA: Jossey-Bass Inc; 2001. 27. Caldwell C, Clapham SE. Organizational trustworthiness: an international
perspective. J Bus Ethics. 2003;47:349-354. 28. Kreitner R, Kinicki A. Organizational Behavior. 2nd ed. Homewood, IL: Irwin,
Inc.; 1992. 29. Carnevale DG. Trustworthy Government: Leadership and Management
Strategies for Building Trust and High Performance. San Francisco, CA: Jossey-Bass Publishers; 1995.
30. Ouchi WG. Theory Z: How American Business can meet the Japanese Challenge.
Boston, MA: Addison & Wesley; 1981.
71
31. Likert R, Likert JG. New Ways of Managing Conflict. New York: McGraw Hill;
1976. 32. Maslow A. Motivation and Personality. 2nd ed. New York: Harper & Row; 1970. 33. Hart KM, Capps HR, Cangemi JP, Cillouet LM. Exploring organizational trust
and its multiple dimension: a case study of General Motors. Organ Dev J. 1986;4(2):31-39.
34. Cangemi JP, Rice J, Kowalski CJ. The development, decline and renewal of trust
in an organization: some observations. Organ Dev J. 1998;7(4):2-9. 35. Hunter J. Good ethics means good business. Can Bus Rev. 1996;23(1):14-17. 36. Podsakoff PM, MacKenzie SB, Bommer WH. Transformational leadership
behaviors and substitutes for leadership as determinants of employee satisfaction, commitment, trust, and organizational citizenship behaviors. J Manag. 1996;22:259-98.
37. Mellinger GD. Interpersonal trust as a factor in communication. J Abnormal
Social Psychol. 1956;52:302-309. 38. Kanter RM. Men and Women of the Corporation. 2nd ed. New York: Basic
Books, 1993. 39. Zand DE. Trust and managerial problem solving. Admin Sci Q. 1972;17:229-
239. 40. Argyris C. Integrating the Individual and the Organization. New York, NY: John
job satisfaction, and turnover among psychiatric technicians. J Appl Psychol. 1974;59:603-609.
42. Angle H and Perry J. An empirical assessment of organizational commitment and
organizational effectiveness. Admin Sci Q. 1981;26:1-14. 43. Meyer JP, Allen NJ. A three-component conceptualization of organizational
commitment. Hum Resource Manag Rev. 1991;1:61-89. 44. Sims RL, Kroeck KG. The influence of ethical fit on employee satisfaction,
commitment, and turnover. J Bus Ethics. 1994;13:939-947.
72
45. Meyer JP, Paunonen SV, Gellatly IR, Goffin RD, Jackson DN. Organizational commitment and job performance: it’s the nature of commitment that counts. J Appl Psychol. 1989;74:152-156.
46. Denhardt RB, Denhardt JV, Aristigueta MP. Managing Human Behavior in
Public and Nonprofit Organizations. Thousand Oaks, CA: Sage Publications; 2002.
47. Kouzes JM, Posner BZ. The Leadership Challenge: How to Get Extraordinary
Things Done in Organizations. San Francisco, CA: Jossey-Bass Publishers; 1995. 48. Hosmer LT. Trust: the connecting link between organizational theory and
philosophical ethics. Acad Manag Rev. 1995;20:379-403. 49. Garcia-Zamor JC. Workplace spirituality and organizational performance. Public
Admin Rev. 2003;63(3):355-363.
50. Mertzman R, Madsen P. Ethical Issues in Professional Life: A Multimedia Course. Lincoln, NE: University of Nebraska-Lincoln; 1992.
51. Littman M, ed. A Statistical Portrait of the US: Social Conditions and Trends. Lanham, MD: Bernan Press; 1998.
52. Kantor J, Weisber J. Ethical attitudes and ethical behavior: are managers role
models? Int J Manpower. 2002;23:687-703. 53. Jones GE, Kavanagh MJ. An experimental examination of the effects of
individual and situational factors on unethical behavioral intentions in the workplace. J Bus Ethics. 1996;15:511-523.
54. Carroll JW, Johnson DW, Marty ME. Religion in America: 1950 to the Present.
San Francisco, CA: Harper & Row, publishers; 1979. 55. Gallup, Jr. G, Jones S. 100 Questions and Answers: Religion in America.
Princeton, NJ: The Princeton Religion Research Center; 1989. 56. Suziedelis A and Potvin RH. Sex differences in factors affecting religiousness
among Catholic adolescents. J Scientific Study Religion. 1981;20:38-50. 57. Luckmann T. The Invisible Religion. New York, NY:Macmillan; 1967. 58. Martin D. A Sociology of English Religion. London: SCM Press; 1967. 59. de Vaus DA and McAllister I. Gender differences in religion: A test of the
structural location theory. American Sociological Rev. 1987;52:472-281.
73
60. de Vaus, DA. Workforce participation and sex differences in church attendance. Rev Religious Research. 1984;25:247-258.
61. Argue A, Johnson DR, White LK. Age and religiosity: evidence from a three-
wave panel analysis. J Scientific Study Religion. 1999;38:423-435. 62. Gallup, Jr. G, Poling D. The Search for America’s Faith. Nashville, TE:
Parthenon Press; 1980.
63. Gallup, Jr. GH, Bezilla R. The Religious Life of Young Americans. Princeton, NJ: The George H. Gallup International Institute; 1992.
64. Greeley AM. The Young Catholic Family: Religious Images and Marital
Fulfillment. Chicago, IL: Thomas More Press; 1980. 65. Caplovitz D, Sherrow F. The Religious Drop-Outs: Apostasy among College
Graduates. Beverly Hills, CA: Sage Publications; 1977. 66. Stark R. On the incompatibility of religion and science: a survey of American
graduate students. J Scientific Study Religion. 1963;3:3-20. 67. Wadsworth MEJ, Freeman SR. Generation differences in beliefs: a cohort study
of stability and change in religious beliefs. Br J Sociology. 1983;34:416-437. 68. Roor WC, Hadaway CK. Denominational switching in the seventies: going
beyond Stark and Glock. J Scientific Study Religion. 1979;18:363-379. 69. Greeley A. Comment on Strark’s “on the incompatibility of religion and science.”
J Scientific Study Religion. 1964;3:239-240. 70. Zelan, J. Religious apostasy, higher education, and occupational choices.
Sociology Educ. 1968;41:370-379. 71. Merrill RM, Lyon JL, Jensen WJ. Lack of a secularizing influence of education
on religious activity and parity among Mormons. J Scientific Study Religion. 2003;42:113-124.
72. Loury LD. Does church attendance really increase schooling? J Scientific Study
Religion. 2004;43:119-127. 73. Cash KC, Gray GR. A framework for accommodating religion and spirituality in
the workplace. Acad Manag Executive. 2000;14(3):124-134. 74. Bruce WM. Public administrator attitudes about spirituality: an exploratory
study. Am Rev Public Admin. 2000;30:460-472.
74
75. Niemiec S. Finding common ground for all ages. Security Distributing and Marketing. 2000;30(3):81-84.
76. Hui-Chun Y, Miller P. Then generation gap and cultural influence- a Taiwan
empirical investigation. Cross Cultural Manag. 2003;10(3):23-41. 77. Leung J, Mertens B, Jordan T, Nakada G, Irwin J. Brave new material world?
Asian Bus. 2000;36(1):16-17. 78. Maslow A. A theory of human motivation. Psychol Rev. 1943;50:370-396. 79. Goble FG. The Third Force: The Psychology of Abraham Maslow. New York,
NY: Pocket Book; 1971. 80. Herzberg F. Work and the Nature of Man. New York: World Publishing Co.;
1966. 81. Vroom V. Work and Motivation. New York: John Wiley; 1964. 82. Porter L, Lawler E. Managerial Attitudes and Performance. Homewood, IL: