Page 1
ORIGINAL ARTICLE
The effect of self- even- and variable-pacing strategieson the physiological and perceptual response to cycling
Kevin Thomas • Mark R. Stone • Kevin G. Thompson •
Alan St. Clair Gibson • Les Ansley
Received: 23 September 2011 / Accepted: 6 December 2011 / Published online: 23 December 2011
� Springer-Verlag 2011
Abstract It has been proposed that an even-pacing strat-
egy is optimal for events lasting\120 s, but this assertion is
not well-established. This study tested the hypothesis that
even-paced cycling is less challenging than self- or variable-
paced cycling. Ten well-trained male cyclists ( _VO2max,
4.89 ± 0.32 L min-1) completed a self-paced (SP) 20-km
time trial followed by time- and work-matched even-paced
(EP 100% SP mean power) and variable-paced (VP 142 and
72% SP mean power, 1:1.5 high:low power ratio) trials in a
random, counterbalanced order. During all trials expired air
and heart rate were analysed throughout, blood lactate was
sampled every 4 km, and perceptual responses (rating of
perceived exertion (RPE) and affect) were assessed every
2 km and post-trial. There were no whole trial statistically
significant differences between trials for any of the respira-
tory variables measured, although there was a trend for
higher RER’s in VP compared to EP (P = 0.053). Blood
lactate was lower in EP compared to VP (P = 0.001) and SP
(P = 0.001), and higher in SP compared to VP (P = 0.008).
RPE was lower, and affect more positive, in EP compared to
both SP and VP (P [ 0.05). The results of this study show
that, for a time- and work-matched 20-km time trial, an even-
paced strategy results in attenuated perturbations in the
physiological response and lower perception of effort in
comparison to self- and variable-paced strategies.
Keywords Cycling � Pacing � Time trial � Intermittent �Constant � RPE
Introduction
The pacing strategy adopted by an athlete during a race
will influence the relative contribution and temporal dis-
tribution of energy derived from oxidative and non-oxi-
dative pathways (Jones et al. 2008), the perception of
exertion (St Clair Gibson et al. 2006) and ultimately the
race performance (Atkinson et al. 2007c). Perception of
effort has been described as the conscious awareness of
changes in subconscious homeostatic control systems (St
Clair Gibson et al. 2003) and has been identified as a
potential mediator of voluntary exercise output (Tucker
2009). The ideal pacing strategy would maximise perfor-
mance for the same rating of perceived exertion. Numerous
researchers have suggested that, for events lasting longer
than 2 min, an even distribution of work is optimal
(Atkinson et al. 2007c; Gordon 2005; Thompson et al.
2003; Foster et al. 1993). Despite this recommendation,
self-paced exercise is rarely sustained at a constant inten-
sity (Tucker et al. 2006; Ansley et al. 2004), and in events
where athletes compete directly against each other, racing
is characterised by variable, stochastic changes in pace
(Palmer et al. 1994).
The physiological responses to time- and work-matched
even-paced (EP) and variable-paced (VP) exercise bouts
have been previously examined using a range of exercise
protocols. When the variation in power output is small
(\ ±10%), the physiological responses to VP exercise
Communicated by David C. Poole.
K. Thomas (&) � K. G. Thompson � A. St. C. Gibson �L. Ansley
Department of Sport and Exercise Sciences,
Northumbria University, Northumberland Building,
Northumberland Road, Newcastle-upon-Tyne NE1 8ST, UK
e-mail: [email protected]
M. R. Stone
Department of Sport Science and Coaching,
Buckinghamshire New University, High Wycombe, UK
123
Eur J Appl Physiol (2012) 112:3069–3078
DOI 10.1007/s00421-011-2281-9
Page 2
(respiratory exchange, muscle metabolism, blood metabo-
lites and neuromuscular fatigue) are similar to that
observed during EP exercise (Liedl et al. 1999; Atkinson
et al. 2007b; Lepers et al. 2008). When the variation in
power output incorporates high-intensity periods in the
extreme exercise domain, where the physiological response
is non-linear, neuromuscular fatigue is greater in VP
compared to EP (Theurel and Lepers 2008); although when
the recovery period between high-intensity efforts is long
(2 min) there is no additional physiological stress (Brickley
et al. 2007). Whilst the physiological responses to matched
EP and VP bouts are well-described, most studies have
imposed relative intensities based on measured physio-
logical thresholds such as critical power, or maximal aer-
obic power, and have seldom been compared with those
characterised by self-paced exercise (SP) (Lander et al.
2009; Billat et al. 2006) even though it has been demon-
strated that athletes can achieve mean intensities in excess
of such thresholds during SP exercise (Kenefick et al.
2002).
Limited data is available comparing EP and VP strate-
gies to time- and work-matched SP bouts (Lander et al.
2009; Billat et al. 2006; Ham and Knez 2009; Atkinson
et al. 2007a). It has been hypothesised that an even dis-
tribution of work might be physiologically optimal (Foster
et al. 1993); however, when EP exercise bouts based on a
previous SP performance have been examined, studies
have reported EP exercise to be more challenging, with
evidence of augmented physiological responses and an
inability to complete the required work in EP compared to
SP (Lander et al. 2009; Billat et al. 2006; Atkinson et al.
2007a). When comparing time- and work-matched SP and
VP bouts, the same exercise intolerance has been reported
in some participants during VP bouts with small variations
(±5%) in power output (Atkinson et al. 2007a), but no
studies exist that assess the impact of larger variations
incorporating exercise intensities in the extreme exercise
domain. Lander et al. (2009) proposed SP exercise is less
challenging since the intensity can be regulated and
adapted to minimise physiological strain and perception of
effort as part of a complex, central regulatory process. The
perception of effort is proposed to be the conscious
awareness of subconscious homeostatic control processes,
and alterations in pacing strategy are a behavioural
response to these sensations to prevent unreasonably large
disturbances to homeostasis during the exercise bout (St
Clair Gibson et al. 2003; de Koning et al. 2011). It is
somewhat surprising therefore that no studies have exam-
ined how adoption of these different types of pacing
strategy affects the perceived effort of completing a task.
The aim of the present study was to assess the effect of
time- and work-matched self-, even- and variable-pacing
strategies on physiological and perceptual responses to a
bout of cycling exercise. We hypothesised that an even-
paced strategy would result in the lowest perturbation to
the physiological systems and therefore be associated with
the lowest perception of effort. We also hypothesised that
variable-paced cycling which incorporates large variations
in exercise intensity would result in the greatest perturba-
tions and highest perception of effort.
Methods
Participants
Ten well-trained male cyclists who regularly perform
cycling training and time trial competitions volunteered to
participate in the study. Participant characteristics are
presented in Table 1. Using typical error scores derived
from a previous reproducibility study from our laboratory
(Thomas et al. 2011), and methods described by Hopkins
(2000), an estimated sample size of 9 was required to
detect 80% power in a crossover design. Written informed
consent was obtained from all the participants prior to the
start of the study, which was approved by the local research
ethics committee. The study was performed in accordance
with national and international guidelines (Hull et al. 2008;
WMA 2008)
Procedures
Each participant completed an incremental cycling test,
one practice 20-km time trial (TT) and three experimental
20-km TTs. The design of the study was crossover with the
order of the experimental TTs partially randomised. Prior
to each visit participants were asked to refrain from
strenuous exercise (for at least 24 h) and caffeine (for at
least 12 h) and to arrive in a fully rested, hydrated state.
Before the practice TT, participants completed a 24-h food
diary and were instructed to replicate their intake as closely
as possible before each subsequent trial. Trials were con-
ducted at the same time of day (±1 h) to minimise diurnal
variation. Each visit was separated by at least 3 and no
more than 7 days.
All cycling trials were completed on an electromagnet-
ically braked cycle ergometer (Velotron Pro, RacerMate
Table 1 Participant characteristics (N = 10), values are mean ± SD
Age (years) 32.8 ± 7.3
Stature (cm) 177 ± 6
Mass (kg) 76.7 ± 7.2
Maximal oxygen uptake ( _VO2max) (L min-1) 4.89 ± 0.32
Maximal power output (Pmax) (W) 353 ± 30
3070 Eur J Appl Physiol (2012) 112:3069–3078
123
Page 3
Inc., USA), that recorded both power output and cadence at
a frequency of 20 Hz. Participants adjusted the ergometer
to their racing position (replicated for each trial) and wore
their own cycling shoes and cleats. Expired air was ana-
lysed continuously by an automated metabolic cart (Cortex
Metalyser 3b, Biophysik, Germany), calibrated prior to
each use according to the manufacturer’s instructions.
Heart rate was recorded telemetrically (Polar Electro Oy,
Kempele, Finland). Blood lactate concentration was
determined from 25 ll samples of fingertip capillary blood
collected in heparinised-capillary tubes. The blood samples
were immediately analysed for lactate concentration using
an Analox P-GM7 Micro-stat (Analox instruments Ltd.
London, UK) automated analyser, which was calibrated
prior to use with an 8 mmol L-1 standard. An electrical fan
was positioned in front of the ergometer at a distance of 0.5
m for cooling during each trial.
Incremental exercise test
After a self-determined warm up, participants completed an
incremental test to volitional exhaustion to determine _VO2
max, starting at 110 W with 30-W increments every 150 s.
Maximum oxygen uptake was calculated as the highest
30 s mean value. Power at maximum oxygen uptake (Pmax)
was calculated from:
Pmax ¼Pfinal�1
150� 150� tfinal
� �þ Pfinal
150� tfinal
� �ð½1�Þ
where Pfinal is final power output, Pfinal�1 is penultimate
stage power, tfinal is time completed at final stage power
output.
20-km time trials
A standardised 10-minute warm up was employed before
each trial that consisted of 5 min at 150 W and 5 min at
70% Pmax. Following a practice self-paced 20-km TT,
participants completed three experimental 20-km TT’s: a
self-paced trial (SP), an even-paced trial (EP) and a vari-
able-paced trial (VP). The SP trial was always performed
first and participants were instructed to ‘complete the dis-
tance as fast as possible’. The order of the subsequent EP
and VP trials was randomised and evenly counterbalanced.
The constant workload during EP was fixed at the mean
power maintained during SP. The workload during VP
varied between 72 and 142% of the mean power main-
tained during SP in a 1:1.5 ratio (approximately 40:60 s
depending on SP performance). The VP protocol was
purposefully designed to examine the effect of variable
pacing when the imposed variations in intensity incorpo-
rated frequent, sustained periods of exercise in the extreme
exercise domain, where the physiological response is non-
linear (Jones and Doust 2001), whilst maintaining an
exercise intensity in the moderate domain during the low-
power segments that could still be representative of race
performance (Palmer et al. 1994). All three trials were
equal in terms of total work done (kJ) and time (s), but the
distribution of work varied.
During SP, participants were informed of distance at
2-km intervals, and 500-m intervals in the final 1 km.
During EP and VP, participants were informed of progress
at intervals equating to 10% of total work done. At the start
of each interval, participants rated their perceived exertion
(RPE) on a Borg 20 point scale (Borg 1982) and their
affective perceptions of the exercise intensity using an 11
point bipolar scale (?5 [very good] to -5 [very bad]) with
verbal anchors at two point intervals (Rejeski 1985). Blood
lactate was sampled every second interval; in the VP trial
this occurred halfway into a low-intensity period of exer-
cise. On completion of each time trial and after a stand-
ardised 5-min cool down, participants were asked for a
‘gestalt’ RPE that best represented the effort over the entire
session.
Data analysis
Descriptive statistics are presented as mean (±SD). Data
from the cycle ergometer and metabolic cart were con-
verted to percentages of work done (kJ) for each trial to
display the pattern of responses, and further delimited into
10% ‘bins’ for subsequent analysis. Normality was asses-
sed via visual inspection of normal probability plots and
Shapiro–Wilks hypothesis tests (Newell et al. 2010).
Assuming a normal distribution, the effect of pacing
strategy on cadence (rpm), oxygen uptake ( _VCO2,
L min-1) carbon dioxide production ( _VCO2, L min-1),
respiratory exchange ratio (RER), heart rate (HR, bpm) and
blood lactate (mmol L-1) was assessed for statistical sig-
nificance using factorial (trial 9 distance) repeated mea-
sures ANOVA. Where a significant main effect between
trials was indicated, Tukey’s least significant difference
was used for pairwise comparisons. Differences between
trials for RPE and affect were assessed using Friedman’s
ANOVA, with post hoc Wilcoxon signed-rank tests
employed where a significant main effect was indicated.
Differences between trials for each parametric outcome
measure were further analysed with a published spread-
sheet (Hopkins 2003) that derived 90% confidence limits
[90% CI’s] for the precision of the estimate of true popu-
lation mean difference, and the likelihood that the true
effect was real or not, based on an a priori defined smallest
important change. The values for smallest worthwhile
change were defined conservatively as the expected noise
Eur J Appl Physiol (2012) 112:3069–3078 3071
123
Page 4
(typical error) in each outcome measure across repeat 20-
km time trials, derived from a previous reproducibility
study (Thomas et al. 2011); accordingly, these were 2.7,
3.7, 2.0, 1.2 and 17.7% for _VO2, _VCO2, RER, HR and
blood lactate, respectively. Qualitative inferences regard-
ing a real change were drawn using the following criteria:
\1% almost certainly not, 1–5% very unlikely, 5–25%
unlikely, 25–75% possible, 75–95% likely, 95–99% very
likely, [99% almost certainly. If the chances of the
observed change being real and not real were both[5% the
effect was deemed unclear. Effect sizes were calculated
using Cohen’s D. Statistical significance was assumed at
P values \0.05. Statistical analysis was performed using
PASW 17.0 and Microsoft Excel 2007.
Results
Performance variables
During SP participants adopted a fast start strategy with the
first 6 km of the trial completed 4–10% above the mean
power, the next 12 km 1–7% below the mean power and an
end spurt 6% above the mean power in the final 2 km
(Fig. 1). Performance in SP was not different to the prac-
tice trial (mean difference [90% CI’s] = 1.9% [-0.7 to
4.5%], P = 0.22) and within the expected typical error of
measurement for 20 km time trials in this population
(Thomas et al. 2011) (Fig. 1). Time taken to complete the
SP trial was 32.53 ± 1.54 min and the mean power output
was 265 ± 29 W (75 ± 6% of calculated Pmax). Based on
performance in SP, EP was set at 265 ± 29 W and the VP
trial alternated between 374 ± 44 W and 189 ± 23 W in a
1:1.5 high:low power ratio (37–43 s of high intensity and
56–64 s of low intensity). Figure 2 depicts an example of
the power profiles for a representative participant. All
participants successfully completed all trials. There were
differences between trials for cadence (P = 0.02). Partic-
ipants adopted a higher cadence during SP (98 ± 8 rpm)
compared to VP (90 ± 11 rpm, mean difference [90%
CI’s] = -9 [-14 to -3] rpm, P = 0.02, D = 1.05) and
EP (93 ± 8, mean difference [90% CI’s] = -6 [-11 to
-1] rpm, D = 0.70) although the latter did not quite reach
statistical significance (P = 0.07).
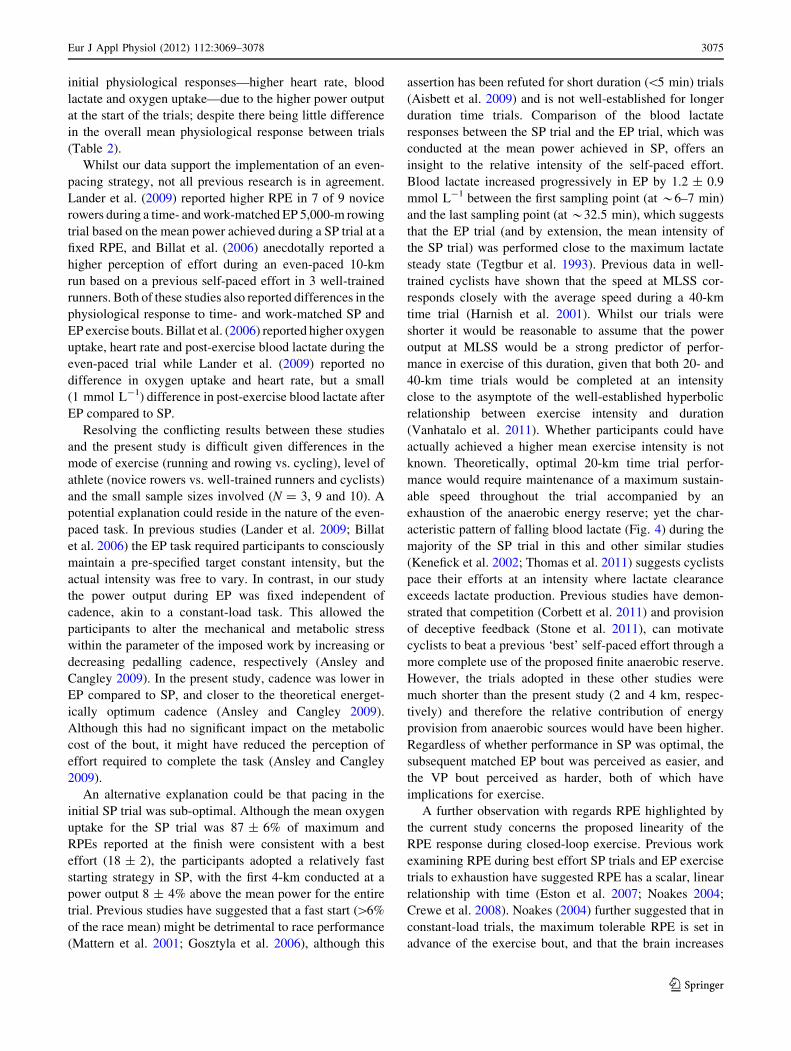
Physiological variables
Oxygen consumption was 87 ± 4, 86 ± 5 and 85 ± 5%_VO2max for SP, EP and VP, respectively. The pattern of
response in all of the measured physiological variables was
different (Fig. 3), indicated by significant interaction effects
(P \ 0.05), but there were no whole trial differences for _VO2
(P = 0.44), _VCO2 (P = 0.29) or RER (P = 0.09), although
the slightly elevated RER in VP compared to EP represented a
moderate effect (mean difference [90% CI’s] = 0.02
[0.00–0.03], D = 0.44). Compared to SP, heart rate was lower
in EP (mean difference [90% CI’s] = -5 [-7 to -3] bpm,
P = 0.001) and VP (mean difference [90% CI’s] = -6 [-8
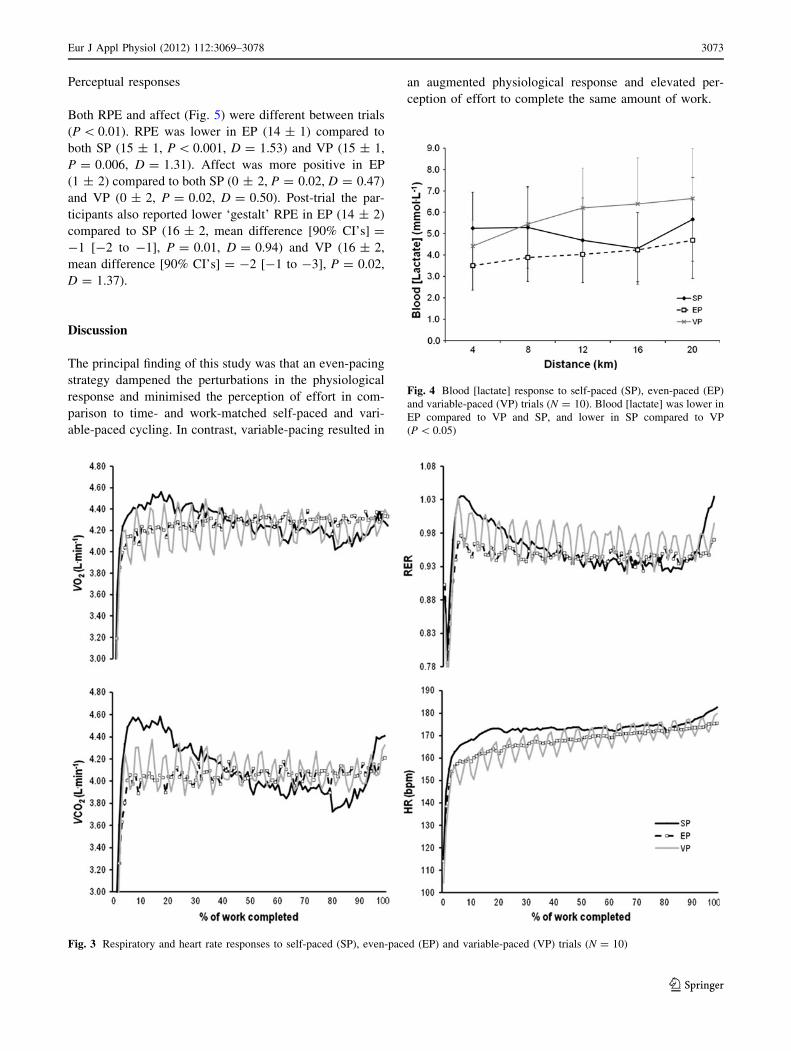
to -3] bpm, P = 0.002). Blood lactate concentrations
(Fig. 4) were different between trials (P \ 0.05). Blood lac-
tate in VP was higher than in EP (mean difference [90%
CI’s] = 1.8 [1.1–2.4] mmol L-1, P = 0.001, D = 1.02) and
SP (mean difference [90% CI’s] = 0.8 [0.4–1.2] mmol L-1,
P = 0.008, D = 0.45) and lower in EP compared to SP (mean
difference [90% CI’s] = -1.0 [-1.3 to -0.6] mmol L-1,
P = 0.001, D = 0.56). Although the differences in blood
lactate concentration were statistically significant, the likeli-
hood of exceeding the true effect was only very likely when
comparing EP to VP (Table 2).
Fig. 1 Power output profiles for self-paced (SP) and practice 20-km
time trials (N = 10). Performance was not different between trials
(P = 0.22)
Fig. 2 Example power output profiles for self-paced (SP), even-
paced (EP) and variable-paced (VP) trials from a representative
participant
3072 Eur J Appl Physiol (2012) 112:3069–3078
123
Page 5
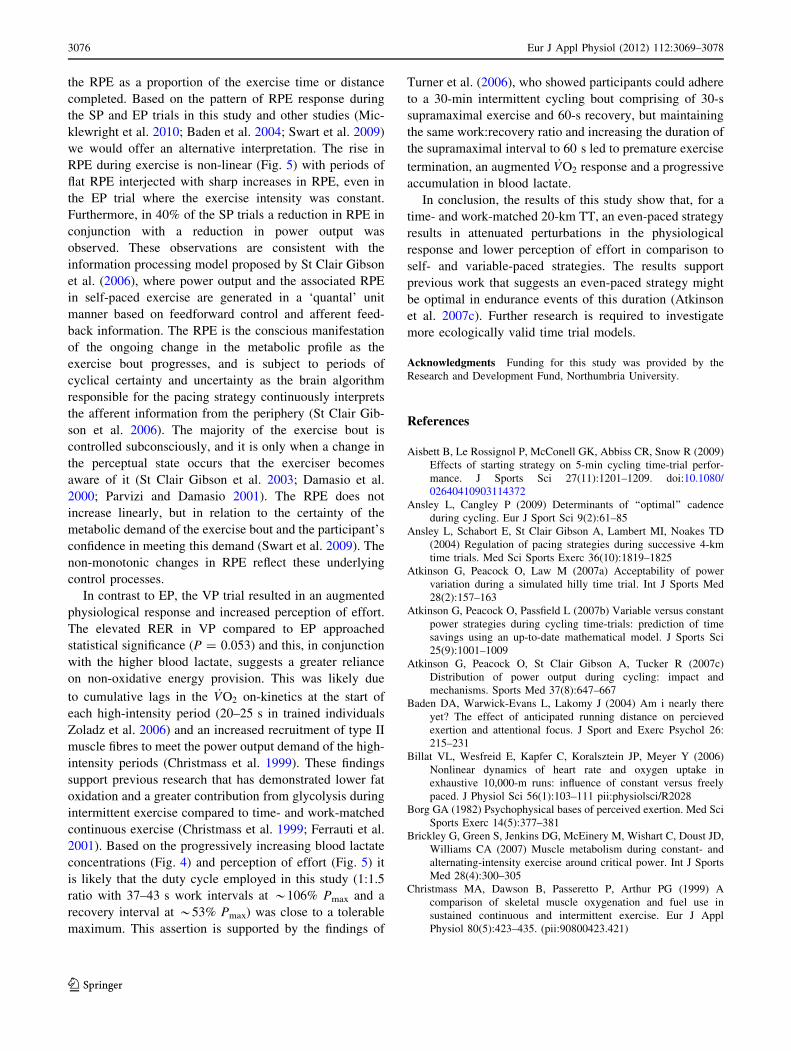
Perceptual responses
Both RPE and affect (Fig. 5) were different between trials
(P \ 0.01). RPE was lower in EP (14 ± 1) compared to
both SP (15 ± 1, P \ 0.001, D = 1.53) and VP (15 ± 1,
P = 0.006, D = 1.31). Affect was more positive in EP
(1 ± 2) compared to both SP (0 ± 2, P = 0.02, D = 0.47)
and VP (0 ± 2, P = 0.02, D = 0.50). Post-trial the par-
ticipants also reported lower ‘gestalt’ RPE in EP (14 ± 2)
compared to SP (16 ± 2, mean difference [90% CI’s] =
-1 [-2 to -1], P = 0.01, D = 0.94) and VP (16 ± 2,
mean difference [90% CI’s] = -2 [-1 to -3], P = 0.02,
D = 1.37).
Discussion
The principal finding of this study was that an even-pacing
strategy dampened the perturbations in the physiological
response and minimised the perception of effort in com-
parison to time- and work-matched self-paced and vari-
able-paced cycling. In contrast, variable-pacing resulted in
an augmented physiological response and elevated per-
ception of effort to complete the same amount of work.
Fig. 3 Respiratory and heart rate responses to self-paced (SP), even-paced (EP) and variable-paced (VP) trials (N = 10)
Fig. 4 Blood [lactate] response to self-paced (SP), even-paced (EP)
and variable-paced (VP) trials (N = 10). Blood [lactate] was lower in
EP compared to VP and SP, and lower in SP compared to VP
(P \ 0.05)
Eur J Appl Physiol (2012) 112:3069–3078 3073
123
Page 6
The finding that an EP strategy resulted in lower per-
ception of effort, more positive affect rating and a damp-
ened physiological response supports previous research
that has suggested an even-pacing strategy is optimal for
endurance events lasting [2 min (Atkinson et al. 2007b;
Gordon 2005; Foster et al. 1993). A more even distribution
of the proposed finite anaerobic capacity allows the athlete
to maintain an anaerobic reserve for a greater proportion of
the trial (Jones et al. 2008) which directly impacts on the
perception of effort (de Koning et al. 2011). de Koning
et al. (2011) theorised that the RPE at any given time point
in a closed-loop trial is dependent on the magnitude and
rate of homeostatic disturbance, and the fraction of the
duration or distance remaining. Accordingly, a faster start
would result in higher reported RPE values for the entire
race as a result of an increased ‘hazard of catastrophic
collapse’ (de Koning et al. 2011). Our data support this
conceptualisation, since the perception of effort (Fig. 5)
remained elevated for the entire trial during the SP and VP
conditions as a result of the augmented perturbations in theTa
ble
2P
reci
sio
no
fes
tim
ate
bet
wee
ntr
ials
,th
eas
soci
ated
Pv
alu
ean
dth
ep
erce
nta
ge
lik
elih
oo
dth
atth
eo
bse
rved
dif
fere
nce
exce
eds
the
smal
lest
imp
ort
ant
chan
ge
EP
–S
PV
P–
SP
VP
–E
P
Mea
nd
iffe
ren
ce
[90
%C
I’s]
PL
ikel
iho
od
of
exce
edin
g
tru
eef
fect
(%)
Mea
nd
iffe
ren
ce
[90
%C
I’s]
PL
ikel
iho
od
of
exce
edin
g
tru
eef
fect
(%)
Mea
nd
iffe
ren
ce
[90
%C
I’s]
PL
ikel
iho
od
of
exce
edin
g
tru
eef
fect
(%)
Cad
ence
[rp
m]
-6
[-1
0to
-1
]0
.07
89
-9
[-1
4to
-3
]0
.02
97
-3
[-7
to1
]0
.20
70
_ VC
O2
[Lm
in-
1]
-0
.02
[-0
.14
to0
.09
]0
.66
10
-0
.07
[-0
.19
to0
.04
]0
.24
26
-0
.05
[-0
.12
to0
.03
]0
.29
6
_ VC
O2
[Lm
in-
1]
-0
.08
[-0
.17
to-
0.0
1]
0.1
71
2-
0.0
5[-
0.1
5to
0.0
6]
0.4
76
0.0
3[-
0.0
4to
0.1
0]
0.4
20
RE
R-
0.0
1[-
0.0
3to
0.0
0]
0.1
21
70
.01
[-0
.01
to0
.02
]0
.47
80
.02
[0.0
0to
0.0
3]
0.0
54
5
HR
[bp
m]
-5
[-7
to-
3]
\0
.01
99
-6
[-8
to-
3]
\0
.01
99
-1
[-3
to-
1]
0.5
01
3
[Blo
od
]la
ctat
e[m
mo
lL
-1]
-1
.0[-
1.3
to-
0.6
]\
0.0
16
50
.8[0
.4to
1.2
]\
0.0
13
21
.8[1
.1to
2.4
]\
0.0
19
8
Fig. 5 Affective response (top panel) and rating of perceived
exertion (bottom panel) during self-paced (SP), even-paced (EP)
and variable-paced (VP) trials (N = 10). Affect was more positive,
and RPE lower in EP compared to both SP and VP (P\ 0.05)
3074 Eur J Appl Physiol (2012) 112:3069–3078
123
Page 7
initial physiological responses—higher heart rate, blood
lactate and oxygen uptake—due to the higher power output
at the start of the trials; despite there being little difference
in the overall mean physiological response between trials
(Table 2).
Whilst our data support the implementation of an even-
pacing strategy, not all previous research is in agreement.
Lander et al. (2009) reported higher RPE in 7 of 9 novice
rowers during a time- and work-matched EP 5,000-m rowing
trial based on the mean power achieved during a SP trial at a
fixed RPE, and Billat et al. (2006) anecdotally reported a
higher perception of effort during an even-paced 10-km
run based on a previous self-paced effort in 3 well-trained
runners. Both of these studies also reported differences in the
physiological response to time- and work-matched SP and
EP exercise bouts. Billat et al. (2006) reported higher oxygen
uptake, heart rate and post-exercise blood lactate during the
even-paced trial while Lander et al. (2009) reported no
difference in oxygen uptake and heart rate, but a small
(1 mmol L-1) difference in post-exercise blood lactate after
EP compared to SP.
Resolving the conflicting results between these studies
and the present study is difficult given differences in the
mode of exercise (running and rowing vs. cycling), level of
athlete (novice rowers vs. well-trained runners and cyclists)
and the small sample sizes involved (N = 3, 9 and 10). A
potential explanation could reside in the nature of the even-
paced task. In previous studies (Lander et al. 2009; Billat
et al. 2006) the EP task required participants to consciously
maintain a pre-specified target constant intensity, but the
actual intensity was free to vary. In contrast, in our study
the power output during EP was fixed independent of
cadence, akin to a constant-load task. This allowed the
participants to alter the mechanical and metabolic stress
within the parameter of the imposed work by increasing or
decreasing pedalling cadence, respectively (Ansley and
Cangley 2009). In the present study, cadence was lower in
EP compared to SP, and closer to the theoretical energet-
ically optimum cadence (Ansley and Cangley 2009).
Although this had no significant impact on the metabolic
cost of the bout, it might have reduced the perception of
effort required to complete the task (Ansley and Cangley
2009).
An alternative explanation could be that pacing in the
initial SP trial was sub-optimal. Although the mean oxygen
uptake for the SP trial was 87 ± 6% of maximum and
RPEs reported at the finish were consistent with a best
effort (18 ± 2), the participants adopted a relatively fast
starting strategy in SP, with the first 4-km conducted at a
power output 8 ± 4% above the mean power for the entire
trial. Previous studies have suggested that a fast start ([6%
of the race mean) might be detrimental to race performance
(Mattern et al. 2001; Gosztyla et al. 2006), although this
assertion has been refuted for short duration (\5 min) trials
(Aisbett et al. 2009) and is not well-established for longer
duration time trials. Comparison of the blood lactate
responses between the SP trial and the EP trial, which was
conducted at the mean power achieved in SP, offers an
insight to the relative intensity of the self-paced effort.
Blood lactate increased progressively in EP by 1.2 ± 0.9
mmol L-1 between the first sampling point (at *6–7 min)
and the last sampling point (at *32.5 min), which suggests
that the EP trial (and by extension, the mean intensity of
the SP trial) was performed close to the maximum lactate
steady state (Tegtbur et al. 1993). Previous data in well-
trained cyclists have shown that the speed at MLSS cor-
responds closely with the average speed during a 40-km
time trial (Harnish et al. 2001). Whilst our trials were
shorter it would be reasonable to assume that the power
output at MLSS would be a strong predictor of perfor-
mance in exercise of this duration, given that both 20- and
40-km time trials would be completed at an intensity
close to the asymptote of the well-established hyperbolic
relationship between exercise intensity and duration
(Vanhatalo et al. 2011). Whether participants could have
actually achieved a higher mean exercise intensity is not
known. Theoretically, optimal 20-km time trial perfor-
mance would require maintenance of a maximum sustain-
able speed throughout the trial accompanied by an
exhaustion of the anaerobic energy reserve; yet the char-
acteristic pattern of falling blood lactate (Fig. 4) during the
majority of the SP trial in this and other similar studies
(Kenefick et al. 2002; Thomas et al. 2011) suggests cyclists
pace their efforts at an intensity where lactate clearance
exceeds lactate production. Previous studies have demon-
strated that competition (Corbett et al. 2011) and provision
of deceptive feedback (Stone et al. 2011), can motivate
cyclists to beat a previous ‘best’ self-paced effort through a
more complete use of the proposed finite anaerobic reserve.
However, the trials adopted in these other studies were
much shorter than the present study (2 and 4 km, respec-
tively) and therefore the relative contribution of energy
provision from anaerobic sources would have been higher.
Regardless of whether performance in SP was optimal, the
subsequent matched EP bout was perceived as easier, and
the VP bout perceived as harder, both of which have
implications for exercise.
A further observation with regards RPE highlighted by
the current study concerns the proposed linearity of the
RPE response during closed-loop exercise. Previous work
examining RPE during best effort SP trials and EP exercise
trials to exhaustion have suggested RPE has a scalar, linear
relationship with time (Eston et al. 2007; Noakes 2004;
Crewe et al. 2008). Noakes (2004) further suggested that in
constant-load trials, the maximum tolerable RPE is set in
advance of the exercise bout, and that the brain increases
Eur J Appl Physiol (2012) 112:3069–3078 3075
123
Page 8
the RPE as a proportion of the exercise time or distance
completed. Based on the pattern of RPE response during
the SP and EP trials in this study and other studies (Mic-
klewright et al. 2010; Baden et al. 2004; Swart et al. 2009)
we would offer an alternative interpretation. The rise in
RPE during exercise is non-linear (Fig. 5) with periods of
flat RPE interjected with sharp increases in RPE, even in
the EP trial where the exercise intensity was constant.
Furthermore, in 40% of the SP trials a reduction in RPE in
conjunction with a reduction in power output was
observed. These observations are consistent with the
information processing model proposed by St Clair Gibson
et al. (2006), where power output and the associated RPE
in self-paced exercise are generated in a ‘quantal’ unit
manner based on feedforward control and afferent feed-
back information. The RPE is the conscious manifestation
of the ongoing change in the metabolic profile as the
exercise bout progresses, and is subject to periods of
cyclical certainty and uncertainty as the brain algorithm
responsible for the pacing strategy continuously interprets
the afferent information from the periphery (St Clair Gib-
son et al. 2006). The majority of the exercise bout is
controlled subconsciously, and it is only when a change in
the perceptual state occurs that the exerciser becomes
aware of it (St Clair Gibson et al. 2003; Damasio et al.
2000; Parvizi and Damasio 2001). The RPE does not
increase linearly, but in relation to the certainty of the
metabolic demand of the exercise bout and the participant’s
confidence in meeting this demand (Swart et al. 2009). The
non-monotonic changes in RPE reflect these underlying
control processes.
In contrast to EP, the VP trial resulted in an augmented
physiological response and increased perception of effort.
The elevated RER in VP compared to EP approached
statistical significance (P = 0.053) and this, in conjunction
with the higher blood lactate, suggests a greater reliance
on non-oxidative energy provision. This was likely due
to cumulative lags in the _VO2 on-kinetics at the start of
each high-intensity period (20–25 s in trained individuals
Zoladz et al. 2006) and an increased recruitment of type II
muscle fibres to meet the power output demand of the high-
intensity periods (Christmass et al. 1999). These findings
support previous research that has demonstrated lower fat
oxidation and a greater contribution from glycolysis during
intermittent exercise compared to time- and work-matched
continuous exercise (Christmass et al. 1999; Ferrauti et al.
2001). Based on the progressively increasing blood lactate
concentrations (Fig. 4) and perception of effort (Fig. 5) it
is likely that the duty cycle employed in this study (1:1.5
ratio with 37–43 s work intervals at *106% Pmax and a
recovery interval at *53% Pmax) was close to a tolerable
maximum. This assertion is supported by the findings of
Turner et al. (2006), who showed participants could adhere
to a 30-min intermittent cycling bout comprising of 30-s
supramaximal exercise and 60-s recovery, but maintaining
the same work:recovery ratio and increasing the duration of
the supramaximal interval to 60 s led to premature exercise
termination, an augmented _VO2 response and a progressive
accumulation in blood lactate.
In conclusion, the results of this study show that, for a
time- and work-matched 20-km TT, an even-paced strategy
results in attenuated perturbations in the physiological
response and lower perception of effort in comparison to
self- and variable-paced strategies. The results support
previous work that suggests an even-paced strategy might
be optimal in endurance events of this duration (Atkinson
et al. 2007c). Further research is required to investigate
more ecologically valid time trial models.
Acknowledgments Funding for this study was provided by the
Research and Development Fund, Northumbria University.
References
Aisbett B, Le Rossignol P, McConell GK, Abbiss CR, Snow R (2009)
Effects of starting strategy on 5-min cycling time-trial perfor-
mance. J Sports Sci 27(11):1201–1209. doi:10.1080/
02640410903114372
Ansley L, Cangley P (2009) Determinants of ‘‘optimal’’ cadence
during cycling. Eur J Sport Sci 9(2):61–85
Ansley L, Schabort E, St Clair Gibson A, Lambert MI, Noakes TD
(2004) Regulation of pacing strategies during successive 4-km
time trials. Med Sci Sports Exerc 36(10):1819–1825
Atkinson G, Peacock O, Law M (2007a) Acceptability of power
variation during a simulated hilly time trial. Int J Sports Med
28(2):157–163
Atkinson G, Peacock O, Passfield L (2007b) Variable versus constant
power strategies during cycling time-trials: prediction of time
savings using an up-to-date mathematical model. J Sports Sci
25(9):1001–1009
Atkinson G, Peacock O, St Clair Gibson A, Tucker R (2007c)
Distribution of power output during cycling: impact and
mechanisms. Sports Med 37(8):647–667
Baden DA, Warwick-Evans L, Lakomy J (2004) Am i nearly there
yet? The effect of anticipated running distance on percieved
exertion and attentional focus. J Sport and Exerc Psychol 26:
215–231
Billat VL, Wesfreid E, Kapfer C, Koralsztein JP, Meyer Y (2006)
Nonlinear dynamics of heart rate and oxygen uptake in
exhaustive 10,000-m runs: influence of constant versus freely
paced. J Physiol Sci 56(1):103–111 pii:physiolsci/R2028
Borg GA (1982) Psychophysical bases of perceived exertion. Med Sci
Sports Exerc 14(5):377–381
Brickley G, Green S, Jenkins DG, McEinery M, Wishart C, Doust JD,
Williams CA (2007) Muscle metabolism during constant- and
alternating-intensity exercise around critical power. Int J Sports
Med 28(4):300–305
Christmass MA, Dawson B, Passeretto P, Arthur PG (1999) A
comparison of skeletal muscle oxygenation and fuel use in
sustained continuous and intermittent exercise. Eur J Appl
Physiol 80(5):423–435. (pii:90800423.421)
3076 Eur J Appl Physiol (2012) 112:3069–3078
123
Page 9
Corbett J, Barwood MJ, Ouzounoglou A, Thelwell R, Dicks M (2011)
Influence of competition on performance and pacing during
cycling exercise. Med Sci Sports and Exerc doi:10.1249/
MSS.0b013e31823378b1
Crewe H, Tucker R, Noakes TD (2008) The rate of increase in rating of
perceived exertion predicts the duration of exercise to fatigue at a
fixed power output in different environmental conditions. Eur J
Appl Physiol 103(5):569–577. doi:10.1007/s00421-008-0741-7
Damasio AR, Grabowski TJ, Bechara A, Damasio H, Ponto LL,
Parvizi J, Hichwa RD (2000) Subcortical and cortical brain
activity during the feeling of self-generated emotions. Nat
Neurosci 3(10):1049–1056. doi:10.1038/79871
de Koning JJ, Foster C, Bakkum A, Kloppenburg S, Thiel C, Joseph
T, Cohen J, Porcari JP (2011) Regulation of pacing strategy
during athletic competition. PLoS One 6(1):e15863. doi:
10.1371/journal.pone.0015863uxu
Eston R, Faulkner J, St Clair Gibson A, Noakes T, Parfitt G (2007)
The effect of antecedent fatiguing activity on the relationship
between perceived exertion and physiological activity during a
constant load exercise task. Psychophysiology 44(5):779–786.
doi:10.1111/j.1469-8986.2007.00558.x
Ferrauti A, Bergeron MF, Pluim BM, Weber K (2001) Physiological
responses in tennis and running with similar oxygen uptake. Eur
J Appl Physiol 85(1–2):27–33
Foster C, Snyder AC, Thompson NN, Green MA, Foley M, Schrager
M (1993) Effect of pacing strategy on cycle time trial
performance. Med Sci Sports Exerc 25(3):383–388
Gordon S (2005) Optimising distribution of power during a cycling
time trial. Sports Eng 8(2):81–90
Gosztyla AE, Edwards DG, Quinn TJ, Kenefick RW (2006) The
impact of different pacing strategies on five-kilometer running
time trial performance. J Strength and Cond Res 20(4):882–886.
doi:10.1519/R-19275.1
Ham DJ, Knez WL (2009) An evaluation of 30-km cycling time trial
(tt30) pacing strategy through time-to-exhaustion at average tt30
pace. J Strength Cond Res 23(3):1016–1021. doi:10.1519/
JSC.0b013e3181a30f8f
Harnish CR, Swensen TC, Pate RR (2001) Methods for estimating the
maximal lactate steady state in trained cyclists. Med Sci Sports
Exerc 33(6):1052–1055
Hopkins WG (2000) Measures of reliability in sports medicine and
science. Sports Med 30(1):1–15
Hopkins WG (2003) A spreadsheet for analysis of straightforward
controlled trials. Sportscience 7. http://www.sportsci.org/jour/
wghtrials.htm
Hull JH, Ansley P, Ansley L (2008) Human tissue act: implications
for sports science. Br J Sports Med 42(4):236–237. doi:10.1136/
bjsm.2007.043307
Jones AM, Doust JH (2001) Limitations to sub-maximal exercise
performance. In: Eston RG, Reilly T (eds) Kinanthropometry
and exercise physiology laboratory manual: Tests, procedures
and data., Exercise physiology. vol 2, 2nd edn. Routledge,
London, pp 235–258
Jones AM, Wilkerson DP, Vanhatalo A, Burnley M (2008) Influence
of pacing strategy on o2 uptake and exercise tolerance. Scand J
Med Sci Sports 18(5):615–626. doi:10.1111/j.1600-0838.2007.
00725.x
Kenefick RW, Mattern CO, Mahood NV, Quinn TJ (2002) Physio-
logical variables at lactate threshold under-represent cycling
time-trial intensity. J Sports Med Phys Fitness 42(4):396–402
Lander PJ, Butterly RJ, Edwards AM (2009) Self-paced exercise is
less physically challenging than enforced constant pace exercise
of the same intensity: Influence of complex central metabolic
control. Br J Sports Med 43(10):789–795. doi:10.1136/bjsm.
2008.056085
Lepers R, Theurel J, Hausswirth C, Bernard T (2008) Neuromuscular
fatigue following constant versus variable-intensity endurance
cycling in triathletes. J Sci Med Sport 11(4):381–389. doi:
10.1016/j.jsams.2007.03.001
Liedl MA, Swain DP, Branch JD (1999) Physiological effects of
constant versus variable power during endurance cycling. Med
Sci Sports Exerc 31(10):1472–1477
Mattern CO, Kenefick RW, Kertzer R, Quinn TJ (2001) Impact of
starting strategy on cycling performance. Int J Sports Med
22(5):350–355. doi:10.1055/s-2001-15644
Micklewright D, Papadopoulou E, Swart J, Noakes T (2010) Previous
experience influences pacing during 20 km time trial cycling. Br
J Sports Med 44(13):952–960. doi:10.1136/bjsm.2009.057315
Newell J, Aitchison T, Grant S (2010) Statistics for sports and
exercise science: A practical approach. Pearson Education,
Harlow
Noakes TD (2004) Linear relationship between the perception of
effort and the duration of constant load exercise that remains.
J Appl Physiol 96(4):1571–1572. doi:10.1152/japplphysiol.
01124.2003
Palmer GS, Hawley JA, Dennis SC, Noakes TD (1994) Heart rate
responses during a 4-d cycle stage race. Med Sci Sports Exerc
26(10):1278–1283
Parvizi J, Damasio A (2001) Consciousness and the brainstem. Cognition
79(1–2):135–160 doi:10.1016/S0010-0277(00)00127-X
Rejeski WJ (1985) Perceived exertion: an active or passive process?
J Sport Psychol 7(4):371–378
St Clair Gibson A, Baden DA, Lambert MI, Lambert EV, Harley YX,
Hampson D, Russell VA, Noakes TD (2003) The conscious
perception of the sensation of fatigue. Sports Med 33(3):
167–176
St Clair Gibson A, Lambert EV, Rauch LH, Tucker R, Baden DA,
Foster C, Noakes TD (2006) The role of information processing
between the brain and peripheral physiological systems in pacing
and perception of effort. Sports Med 36(8):705–722
Stone MR, Thomas K, Wilkinson M, Jones AM, Gibson AS,
Thompson KG (2011) Effects of deception on exercise perfor-
mance: Implications for determinants of fatigue in humans.
Medicine and Science in Sports and Exercise. doi:10.1249/
MSS.0b013e318232cf77
Swart J, Lamberts RP, Lambert MI, Lambert EV, Woolrich RW,
Johnston S, Noakes TD (2009) Exercising with reserve: Exercise
regulation by perceived exertion in relation to duration of
exercise and knowledge of endpoint. Br J Sports Med 43(10):
775–781. doi:10.1136/bjsm.2008.056036
Tegtbur U, Busse MW, Braumann KM (1993) Estimation of an
individual equilibrium between lactate production and catabo-
lism during exercise. Med Sci Sports Exerc 25(5):620–627
Theurel J, Lepers R (2008) Neuromuscular fatigue is greater
following highly variable versus constant intensity endurance
cycling. Eur J Appl Physiol 103(4):461–468. doi:10.1007/
s00421-008-0738-2
Thomas K, Stone MR, Thompson KG, St Clair Gibson A, Ansley L
(2011) Reproducibility of pacing strategy during simulated
20-km cycling time trials in well-trained cyclists. European
Journal of Applied Physiology:Published Online first, May 2011,
doi:10.1007/s00421-011-1974-4
Thompson KG, MacLaren DP, Lees A, Atkinson G (2003) The effect
of even, positive and negative pacing on metabolic, kinematic
and temporal variables during breaststroke swimming. Eur J
Appl Physiol 88(4–5):438–443. doi:10.1007/s00421-002-0715-0
Tucker R (2009) The anticipatory regulation of performance: The
physiological basis for pacing strategies and the development of
a perception-based model for exercise performance. Br J Sports
Med 43(6):392–400. doi:10.1136/bjsm.2008.050799
Eur J Appl Physiol (2012) 112:3069–3078 3077
123
Page 10
Tucker R, Bester A, Lambert EV, Noakes TD, Vaughan CL, St Clair
Gibson A (2006) Non-random fluctuations in power output
during self-paced exercise. Br J Sports Med 40(11):912–917
Turner AP, Cathcart AJ, Parker ME, Butterworth C, Wilson J, Ward
SA (2006) Oxygen uptake and muscle desaturation kinetics
during intermittent cycling. Med Sci Sports Exerc 38(3):
492–503
Vanhatalo A, Jones AM, Burnley M (2011) Application of critical
power in sport. Int J Sports Physiol Perform 6(1):128–136
WMA (2008) World medical association declaration of helsinki.
Ethical principles for medical research involving human sub-
jects. http://www.wma.net/en/30publications/10policies/b3/17c.
pdf
Zoladz JA, Korzeniewski B, Grassi B (2006) Training-induced
acceleration of oxygen uptake kinetics in skeletal muscle: the
underlying mechanisms. J Physiol Pharmacol 57(Suppl 10):
67–84
3078 Eur J Appl Physiol (2012) 112:3069–3078
123