The Effect of Succession Taxes on Family Firm Investment: Evidence from a Natural Experiment Margarita Tsoutsoura * University of Chicago Booth School of Business This paper provides causal evidence on the impact of succession taxes on firm investment decisions and transfer of control. I exploit a 2002 policy change in Greece that substantially reduced the tax on intra-family transfers of businesses and show that succession taxes lead to more than a 40% decline in investment around family successions, slow sales growth, and depletion of cash reserves. Furthermore, succession taxes strongly affect the decision to sell or retain the firm within the family. I conclude by discussing implications of my findings for firms in the United States and Europe. * Chicago Booth, 5807 South Woodlawn Ave., Chicago, IL 60637; Email: [email protected]. I am thankful to the members of my committee Patrick Bolton, Charles Calomiris, Daniel Paravisini and Daniel Wolfenzon and to Francisco Pérez-González for their encouragement and support. I especially thank Amit Seru for his valuable comments. This work also benefited greatly from the thoughts of Adair Morse, Vikrant Vig and all the participants of the finance seminars at Boston College, Columbia University, Cornell University, Duke, Harvard Business School, INSEAD, MIT, Northwestern University, NYU, Rice University, SSE, the University of Florida, the University of North Carolina, the University of Pennsylvania, the University of Virginia, Washington University in St. Louis; Yale University and participants at the WFA 2010, London Business School Transatlantic Conference and Thammasat International Conference. I acknowledge financial support by CIBER and the Kauffman Foundation. All errors are my own.
Transcript
The Effect of Succession Taxes on Family Firm
Investment: Evidence from a Natural Experiment
Margarita Tsoutsoura*
University of Chicago Booth School of Business
This paper provides causal evidence on the impact of succession taxes on firm
investment decisions and transfer of control. I exploit a 2002 policy change in Greece that substantially reduced the tax on intra-family transfers of businesses and show that succession taxes lead to more than a 40% decline in investment around family successions, slow sales growth, and depletion of cash reserves. Furthermore, succession taxes strongly affect the decision to sell or retain the firm within the family. I conclude by discussing implications of my findings for firms in the United States and Europe.
* Chicago Booth, 5807 South Woodlawn Ave., Chicago, IL 60637; Email: [email protected]. I am thankful to the members of my committee Patrick Bolton, Charles Calomiris, Daniel Paravisini and Daniel Wolfenzon and to Francisco Pérez-González for their encouragement and support. I especially thank Amit Seru for his valuable comments. This work also benefited greatly from the thoughts of Adair Morse, Vikrant Vig and all the participants of the finance seminars at Boston College, Columbia University, Cornell University, Duke, Harvard Business School, INSEAD, MIT, Northwestern University, NYU, Rice University, SSE, the University of Florida, the University of North Carolina, the University of Pennsylvania, the University of Virginia, Washington University in St. Louis; Yale University and participants at the WFA 2010, London Business School Transatlantic Conference and Thammasat International Conference. I acknowledge financial support by CIBER and the Kauffman Foundation. All errors are my own.
1
The demographic trends in both the United States and Europe make firm succession
planning increasingly important for privately held family businesses. An estimated 690,000 firms
providing 2.8 million jobs change hands every year in the EU (European Commission (2006)).
Succession taxes, which are taxes incurred during such transfers and sometimes are referred
to as transfer taxes, have been at the epicenter of a contentious debate. On one hand, the most
common arguments against succession taxes focus on the potential effect on family businesses.1
Taxing successions might discourage firm investment and growth; they might even force
entrepreneurs to sell their firms in order to fulfill their tax liability. On the other hand, rich
empirical evidence suggests inherited firms underperform (Villalonga and Amit (2006), Perez-
Gonzalez (2006), Bennedsen, Nielsen, Perez-Gonzalez, and Wolfenzon (2007)). This evidence
has led to arguments that succession taxes might be too lenient and provide incentives to keep
poorly managed firms within the family (Bloom (2006)). Underlying both these arguments is a
belief that succession taxes may affect firm boundaries and investment. However, systematic
empirical evidence that establishes this link is missing. This paper aims to fill this gap by
establishing and quantifying the effect of succession taxes on entrepreneurs’ succession
decisions, investment decisions, and financial policies.
The challenge in empirically identifying the causal effect of succession taxes on firm
policies is threefold. First, one needs to isolate the effect of succession taxes from other possible
factors that might affect firm policies around successions (e.g., the ability of the new owner or
aggregate trends). Second, one must address the endogeneity of the decision to transfer the
company to family members. Finally, one also needs an exogenous variation in the tax
environment.
To overcome these challenges and accomplish my goal, I exploit a 2002 tax reform in
Greece that reduced succession tax rates for transfers of limited liability companies to family
1 Prior research has shown that founders or their families control the majority of firms around the world (Faccio
and Lang (2002)). Even among public firms, families control 45% of the listed international firms (La Porta, Lopez-de-Silanes, and Shleifer (1999)) and at least one third of large US public firms (Anderson and Reeb (2003)).
2
members from 20% to less than 2.4%.2 I construct a unique database that contains information
on all transfers of limited liability firms in Greece for the years 1999 to 2005. Although limited
liability firms are private, they are required to publish their ownership changes as well as their
financial statements. I supplement these data by matching them with hand-collected data on the
gender of each entrepreneur’s firstborn child and data on each entrepreneur’s personal income
from other sources.
In the quasi-experimental setting made possible by the tax policy change, I employ two
different methodologies to measure the effect of this policy change on investment. First I apply
difference-in-difference-in-differences (DDD) methodology to analyze the change in investment
around successions in response to the tax policy change. I compare firms that undergo family
succession (the treated group) with firms that are transferred to unrelated entrepreneurs (the
control group) both before and after the policy change. This method controls for aggregate trends
and other succession-induced changes in investment. Furthermore, by comparing the two groups
before and after the tax reform, the analysis disentangles the effect of the identity of the new
owner (family or unrelated) from the effect of the succession tax.
A major concern with the DDD methodology is that the decision to have a family
succession or an unrelated succession is unlikely to be independent of firm characteristics that
are related to investment opportunities. To address this concern, I use the gender of the
departing entrepreneur’s firstborn as an instrument for family succession, as in Bennedsen,
Nielsen, Perez-Gonzalez, and Wolfenzon (2007)) The gender of the departing entrepreneur’s
firstborn is a plausible instrument for family successions because it affects the probability of
having a family succession and is unlikely to be correlated with a firm’s investment
opportunities. As before, I compare firms that undergo a family succession with firms that are
transferred to unrelated entrepreneurs both before and after the policy change, but I use the
instrument to randomly assign the firms into the two groups. Thus the identification exploits two
sources of variation. The tax reform provides a time-series variation of the transfer tax, whereas
2 The tax rate remained unchanged at 20% for unrelated transfers.
3
the instrument provides an exogenous cross-sectional variation for the succession decision. Thus
this method allows for a causal inference because it, as before, disentangles the effect of the new
owner’s identity from the effect of the succession tax, while also addressing any concern
regarding the endogeneity of the succession decision.
Both the DDD and the instrumental variable (IV) estimates reveal a negative effect of
transfer taxes on post-succession investment for firms that are transferred within the family. In
the presence of higher succession taxes, investment drops from 17.6% of property, plant, and
equipment (PPE) the three years before succession to 9.7% of PPE the two years after. This
impact of succession taxes on investment is economically large: the implied fall in the
investment ratio (0.079) is approximately 40% of the pre-transition level of investment. For
those firms, successions are also associated with a depletion of cash reserves, a decline in
profitability, and slow sales growth. Note that to the extent that entrepreneurs can plan ahead for
the succession and the related tax liability, the estimates I report in the paper provide an
underestimate of the true effect of succession taxes. Nevertheless, I corroborate my findings by
showing that I obtain similar results when I only use death-related successions, instances when
planning is less likely.
I also find a strong relation between succession taxes and the decision to sell or retain
the firm within the family. After the reduction of the inheritance taxes, family successions
increase from 45.2% of all transfers before the reform to 73.9%, more than a 63% increase. This
evidence shows succession taxes significantly influence the allocation of firm ownership and
thus firm boundaries. This finding has potentially important implications, given the existing
evidence in the literature that shows that inherited family firms underperform. In particular, to
the extent that lower-level succession taxes provide incentives to allocate assets to the low-
ability heirs, tax policy that changes such taxes could impact aggregate productivity and
economic growth (Morck, Stangeland, and Yeung (2000), Bloom (2006), Bloom and Van
Reenen (2007), Bennedsen, Nielsen, Perez-Gonzalez, and Wolfenzon (2007)).
The final part of the analysis investigates whether the effect of succession taxes on
investment varies with observed firm characteristics. I find the results exist for both large and
4
small firms in my sample. However, when I stratify my sample based on tangibility of assets, I
find the effects are stronger for family firms with assets that have low tangibility. The effects are
also stronger for firms owned by entrepreneurs with relatively low income from other sources,
who, as a result, may have no alternative sources of financing but costly external finance. I
discuss that this evidence is consistent with financial constraints being a factor that exacerbates
the effects of succession taxes on firm investment. However, I note this evidence is not
conclusive and these patterns may also be consistent with other plausible channels.
This paper connects to several strands of the literature. First, it contributes to the family firm
literature. Understanding what factors affect firm policies around successions is fundamental,
because the way in which control of the firm is passed from one generation to the next can
critically affect the development and growth of the firm. The literature has so far highlighted
three main problems in the intergenerational transfer of family firms: nepotism (Burkart,
Panunzi, and Shleifer (2003), Caselli and Gennaioli (2005), Perez-Gonzalez (2006), Bennedsen,
Nielsen, Perez-Gonzalez, and Wolfenzon (2007)), infighting among family members (Muller and
Warneryd (2001), Bertrand, Johnson, Samphantharak, and Schoar (2008)), and legal constraints
to bequeathing minimal stakes to non-controlling heirs (Ellul, Pagano, and Panunzi (2010)). I
show succession taxes are another important influence on the succession decisions of family
firms, and are a factor that can slow growth and investment around transitions. To the best of my
knowledge, this paper is the first empirical study that establishes a causal relationship between
succession taxes and family firm investment.
Furthermore, the paper shows succession taxes have an effect on firms’ transfer of
control. In doing so, the paper connects to the work on firm boundaries that investigates how
changing insider incentives affects ownership as well as investment decisions (Coase (1937),
Jensen and Meckling (1976), Holmstrom and Roberts (1998), Seru (2012)). The results on
ownership changes have implications not only on firm growth but also on the equilibrium
distribution of privately owned firms in the economy, especially where family firms dominate.
Although popular arguments suggest one of the undesirable effects of estate taxes is that they
may force entrepreneurs to sell the business, so far the evidence has been scant and mainly
5
suggestive (Brunnetti (2006)). This paper uses a causal experiment design to provide robust
evidence that estate taxes affect firm boundaries by impacting the entrepreneur’s decision to sell
or keep the firm within the family.
The paper also adds to the literature on entrepreneurs’ responses to estate taxation. The
effects of estate taxes on entrepreneurial firms have been largely understudied, and the scarce
evidence is largely based on limited surveys.3 This paper offers the first causal empirical
evidence linking succession taxes and firm investment policies. Finally, this study also relates to
the literature that analyzes the investment behavior of private firms (Campello, Graham, and
Harvey (2010), Campello, Giambona, Graham, and Harvey (2011)). The study of private firms is
interesting especially from the perspective of the literature on how high external-finance costs
affect investment, especially because, relative to public firms, private firms’ costs of external
finance are likely to be high (Campello, Giambona, Graham, and Harvey (2011)).4
The rest of the paper is organized as follows: Section I discusses the tax reform. Section
II describes the data sources. Section III analyzes the succession decision and provides summary
statistics. Section IV develops the empirical methodology, and section V presents the results.
Section VI concludes.
I. Event: Legal Reform
Taxation reform for business transfers is an issue under continuing debate both in the United
States and Europe. In many countries, tax law treats within-family transferred firms
preferentially. In 1994, the European Commission issued a recommendation to its country
3 Holtz-Eakin (1999) uses a survey of 444 small business owners from upstate New York to study how estate
taxes affect employment growth. Gale and Slemrod (2001) and Kopczuk (2012) offer an overview of the literature and discuss the need for systematic empirical evidence on the effect of estate taxes on entrepreneurial firms.
4 A large literature links external finance costs to under-investment, and shows how the accumulation of liquidity can mitigate these costs (Fazzari, Hubbard, and Petersen (1988), Calomiris, Himmelberg, and Wachtel (1995), Gilchrist and Himmelberg (1995)). More recent studies have used external shocks to firms’ internal cash to address the endogeneity of cash flows and investment to firms’ investment opportunities (Rauh (2006), Blanchard, Lopez-de-Silanes, and Shleifer (2004)).
6
members to support the transfer of small and medium-sized companies from one generation to
the next (Grossmann and Strulik (2010)).5
In 2002, policy makers in Greece enacted Law Ν.3091 to facilitate the inter-generational
transfer of family firms. The reform substantially decreased all types of succession taxes for
transfers of limited liability firms within the family, whether those transfers were inter vivos
business transfers, gifts, or inheritances after death. In detail, according to Law N.3091, after
January 1, 2003, the tax rate dropped to a flat rate of 1.2% for transfers of limited liability
companies to first-degree relatives (sibling, spouse, parent, or offspring) and 2.4% for transfers
to second-degree relatives (grandchild, nephew, or niece). Nevertheless, the tax rate for business
transfers to unrelated third parties did not change and remained at 20% (Figure 1).
Before Law Ν.3091 took effect, tax rates were substantially higher. The tax rate for inter
vivos business transfers of limited liability companies was a flat rate of 20%, regardless of
whether the firm was transferred to family members (sibling, spouse, parent, offspring,
grandchild, nephews) or third parties. In case the transfer of the limited liability firm was a gift
or inheritance, for first-degree family members, the tax was 15% for amounts between 28.000
and 131.000 Euros and 25% above that. For second-degree family members, the rates were 20%
and 35%, respectively.6
A few details on the features of the succession-tax regulations help explain what the
bearing on the results might be. All limited liability companies are subject to these taxes with no
exception. For inter vivos transfers, the departed entrepreneur pays the succession tax upon
transferring the company.7 The fact that the transfer tax has to be paid upon the transfer allows
5 According to EU recommendations (European-Commission, (1994)), “The Commission requests the Member States to ensure that family law, inheritance law . . . cannot jeopardize the survival of business and to reduce taxation on assets in the event of transfer by succession or by gift,” and “inheritance taxes extract liquidity and assets from businesses.” 6 Thus the tax code gives a clear advantage to transfer the company as an inter vivos business transfer and pay the flat 20% tax. This is even more evident if one takes into account the fact that the tax code has low exemption amounts. The lifetime exception amounts for gifts and inheritances are low at 15.000 Euros. Furthermore, every gift during the lifetime is accumulated, so the taxpayer can approach the maximum rate fast. The results are robust to controlling for transfer type. Furthermore, Table X shows the results are robust in the sample for transfers upon death of the entrepreneur.
7 For transfers upon death (Table X), the tax can be paid in 12 bi-monthly installments.
7
for clear identification of the effect of the tax by looking at the years around the transfer events.8
Furthermore, the tax is levied on the fair market value of the enterprise or the part transferred.
The valuation principle issued by the tax authorities is common both for family and non-family
transfers, and it takes into account the firm’s financial statements of the last five years, as well as
any appreciation in the market value of assets (including buildings, land, etc.).9
The draft of the law was introduced in the Greek parliament on November 4, 2002, and
was approved on December 16, 2002. The effective date of the law was January 1, 2003. Based
on my discussions with tax officials, parliament passed the law suddenly, and companies did not
anticipate it. Moreover, the first mention in the financial newspapers of a potential transfer tax
reform was in early summer of 2002, when the ministry formed a committee to examine this
issue.
The law was not part of an EU reform. Although in 1994 the European Commission
issued recommendations to its country members to support the intergenerational transfers of
small and medium-sized companies, these recommendations are not binding.10 Furthermore, a
general movement of other EU countries toward introducing new tax measures in 2002 did not
occur.
The lack of anticipation is also corroborated by the data in Table II regarding family
transfers. If companies had anticipated the tax, within-family transfers presumably would have
been delayed to take advantage of the lower tax rate. But the percentage of family transfers in
2001 is similar to those of other years before 2002. As an additional check, I examined the
monthly distribution of transfers. Only in the last three months (October, November and
8 In some countries (including the United States), transfer taxes can in some cases be paid in installments that
can span even 10 years. In these cases, the effect of the tax would be spread out and would need to be calculated across all these years.
9 The main inputs in the valuation principle are operating results, the number of years the firm operates, the firm’s equity, and net assets, as well as any appreciation of the market value of the assets. I do not observe the appreciation of the firm’s assets, which requires detailed information of the size and location of any land or buildings, which is needed to calculate the exact tax liability.
10 Country members commonly do not introduce any reforms until the recommendations become binding in the form of regulations or directives. Furthermore, the EU recommendations regarding the intergenerational transfers of family businesses were suggesting both legal and tax measures, but most countries opted for legal measures (European Commission, (2003)).
8
December) of 2002 did a slight decline of family transfers occur relative to unrelated ones. To
address potential biases related to 2002, the year of the law change, I exclude the transfers that
occurred in 2002 from all the analyses reported below. Furthermore, in some robustness checks,
I also excluded the transfers that occurred in 2003.
II. Data Sources
A. Data Sources
For the empirical analysis, I construct a unique data set of all transfers of limited liability
companies in Greece from 1999 to 2005. Our sample includes information on the transfer
transaction and financial information on the firms, as well as information on the departed
entrepreneur, his family, and the incoming entrepreneur. I obtain the information from various
sources, as explained below.
1. In the first phase of the data-construction process, I hand collect the succession data
from the limited liability company announcements in the Government Gazette for the years 1999
to 2005. The law requires all limited liability companies to report their transfers in the
Government Gazette. A transfer is a change of ownership of the firm. For privately held firms,
ownership and control are usually not separated, and therefore not only the ownership but also
the management is transferred from one generation to the next. Overall, I observe 694 inter vivos
successions in the years 1999 to 2005.11 The official announcements contain the departing
entrepreneur’s name, date of birth, address, and identification number, as well as the name and
address of the successor and the family relationship, if any. Thus from the announcements I can
identify whether the departing entrepreneur is related by blood or marriage to his successor.
Successions are classified into two categories: family, when the transfer of the company is to
11 I include all limited liability firms except from utilities and financial firms. In a few cases, the transfer
event in a company was recorded in two different announcements. This event was classified as one event because it has similar implications for tax purposes. The results are robust to the exclusion of these cases.
9
relatives of either the first (sibling, spouse, parent, or offspring) or second degree (grandchild,
nephew, or niece), or unrelated. To identify the gender of the firstborn, I cross-referenced various
sources. The first source is the disclosure statements of the companies in the Government
Gazette, which contains information on family relationships of departed entrepreneurs and
successors, including date of birth. Because the Government Gazette might not include details on
every child, I complemented this source with information from the company websites, and I also
contacted the companies directly to verify the information. The Greek language uses different
endings for female and male names, so the gender can be accurately determined by the name.
2. As a next step, I match the transfer data with the firm financial data. Although limited
liability companies in Greece are privately held, they are required to publish their financial
statements both in the official Government Gazette and in a financial newspaper. The source for
financial information is the Government Gazette and ICAP, the leading company for business
information in Greece. ICAP assembles the database based on the financial reports that limited
liability companies are required to file at the official Government Gazette. Furthermore, ICAP
verifies the data by directly contacting the companies and acquiring additional information on
their quarterly reports and cash flows. ICAP has the most extensive database on both public and
private companies in Greece and is the local provider of the Amadeus database for Greek
company data. I obtain information for the period 1995 to 2007.
3. The Ministry of Economy and Finance provide data on the departing entrepreneur’s
other sources of income.
B. Industry Distribution of Successions
Table I presents the industry distribution of firms that have a succession event using the
NACE1.1 primary industry classification. As a comparison, in column (I), I report the industry
distribution of all the limited liability companies in the database. The industry distribution of the
firms that undergo succession (column II) is similar to the industry distribution of the sample of
all limited liability firms (column I). Furthermore, family transfers are distributed evenly across
industries. An exception is Hotels and Restaurants, which appears to have a much higher than
10
average percentage of family successions. Overall, family transfers represent 57.9% of all
transfers.
III. Succession Decision
A. Reform and Effect on Succession Decisions
The reduction of succession taxes for family transitions had a large effect on the
entrepreneurs’ decision to sell or retain the firm within the family. Table II illustrates the
distribution of firm transfers during the sample period. I report the distribution of the total
number of transfers (column I) as well as their classification into family (columns IV and V) and
unrelated (columns II and III) successions. Columns VI and VII further analyze transfers to the
children of the entrepreneur.
The total number of business transfers (including transfers to family members and
unrelated parties) is similar before and after the law change. In the three years before 2002
(1999-2001), 305 transfers occurred, and in the three years after 2002 (2003-5), 307 transfers
occurred. Nevertheless, Table II indicates a strong “substitution effect” between family transfers
and sell-outs. In the years 1999-2001, 45.2% of the transfers were to family members. This
fraction jumps to 73.9% for the years 2003-5 (also shown in Figure 2). This jump represents a
63.4% increase in the fraction of family transfers and is statistically significant at the 1% level.
Furthermore, the effect persists throughout the post-reform period.
Table II also shows that most of the family transfers involve the children of the
entrepreneur. Column VII indicates that between 1999 and 2001, 67.4% of the family transfers
are to the children of the entrepreneur. The fraction rises to 78.9% the years following the law
change. The associated 17% increase is statistically significant at the 1% level.
Overall, the results of Table II show the reduction of succession taxes had an effect on
the firm transfer of control and led to a large increase in the fraction of firms that are transferred
within the family.
11
B. The Gender of the Firstborn Child and Succession Decisions
In Table III, I examine the succession decisions according to the gender of the departing
entrepreneur’s firstborn child. The goal of this table is to show that the gender of the firstborn,
which is arguably exogenous, affects the decision to have a family transition. Indeed, in the pre-
reform period, departing entrepreneurs with a male firstborn have a 17.7 percentage points
(significant at the 1% level) higher probability of transferring their company to family members
compared to entrepreneurs with a female firstborn. In the post-reform period, the difference is
15.2 percentage points and is also significant at the 1% level. Table III shows that the gender of
the firstborn affects the decision to transfer ownership and control to a family member. Table III
is consistent with anecdotal evidence that even developed countries follow primogeniture
inheritance rules.
The relation between family succession and the gender of the firstborn is stronger than in
Bennedsen et al. (2007), which uses Danish data. The higher reported differences in Greece are
consistent with the findings of the 2007 World Economic Forum survey on gender equality,
which ranked Greece 72nd among 128 countries surveyed, far behind other European countries
(with the exception of Cyprus, Italy, and Malta).12 On the other hand, that same survey ranked
Denmark eighth. Furthermore, in 2004, Greek women held only 15% of parliament seats, while
Danish women held more than 37% of parliament seats.
C. Firm Characteristics
Table IV.A provides descriptive statistics on firm characteristics for the three years prior
to succession. On average, firms that experience family succession are smaller when measured
by book value of assets. In the pre-reform period, firms with family successions had an average
of 1.38 million Euros in assets the three years prior to transition. The average book asset value
for the firms that were transferred outside the family was 1.86 million Euros.13 The same pattern
12 http://www.weforum.org/pdf/gendergap/report2007.pdf. 13 Firms of this size comprise the backbone of the economy not only for Greece but for Europe in general (see
Appendix). According to estimates from Ayyagari, Beck, and Dermirguc-Kunt (2007) small and medium-size companies in Greece contribute at least 25% of GDP.
12
holds in the post-reform period. The difference in firm size between the two groups is significant
at the 5% level in the pre-reform period and at the 10% level in the post-reform period. Firms
that experience family successions are also older than firms that are transferred to unrelated
parties. In the period prior to the reform, companies that have family successions are on average
three years older at the time of transition than firms with unrelated successions. The difference is
significant at the 1% level. The difference drops to 1.1 years for the firms that were transferred
after the reform, and is no longer statistically significant.
Investment is measured as the ratio of capital expenditure (CAPEX) in year t to start-of-
year net property, plant, and equipment (PPE). In the pre-reform period, firms with family
successions have lower investment levels prior to succession than firms with unrelated
successions, and the difference is statistically significant at the 10% level. In the post-reform
period, no statistically significant difference in investment is observed. In the pre-reform period,
firms that undergo family successions hold 24.3% more cash in the years prior to transition than
firms that are transferred outside the family. Furthermore, firms with family successions have
lower sales growth in the pre-succession years than firms with unrelated successions. In the post-
reform period, the differences in cash holdings and sales growth between the two groups are
smaller and no longer statistically significant.
Overall, Table IV.A shows that family successions are likely to occur in relatively
smaller and older firms. The marked differences between firms that experience a family or
unrelated succession indicate the succession decision might not be random.
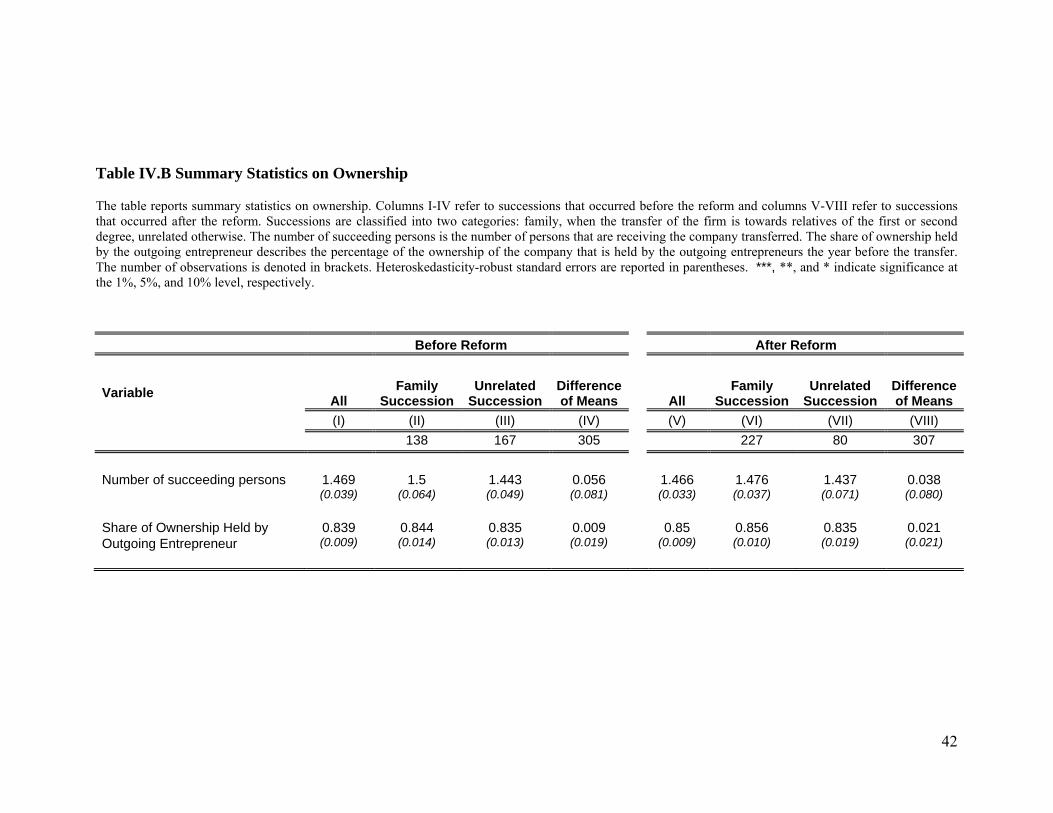
As far as ownership is concerned, the average firm has 2.3 owners. In most cases the
owners are members of the same household or related. Table IV.B presents summary statistics on
the ownership characteristics of the firms. In the pre-reform period, the outgoing entrepreneur of
firms that undergo a family transfer owns on average 84.4% of the firms at the time of transition,
whereas the entrepreneur owns 83.5% of the firms that have an unrelated succession. The means
are similar in the years after the reform. The number of succeeding persons is around 1.5, and I
find no significant difference in the number of succeeding persons between family and unrelated
successions both before and after the reform.
13
IV. Methodology
The 2002 tax reform in Greece offers a quasi-experimental setting, so I can use the variation of
taxes within a country for my analysis.14 The tax reform affected the tax rate only for limited
liability firms that undergo family successions, whereas the tax rate for limited liability firms
undergoing unrelated successions remained unaffected. An advantage of analyzing tax changes
within a country is that such analysis avoids the pitfalls of comparing effective tax incidence
across countries, which is complicated by differences in enforcement, exemptions, company
valuation techniques, rate structures, and other factors (Gale and Slemrod (2001)). Furthermore,
more unobserved differences among various countries might be present, for which many cross-
country studies fail to adequately control (Rodrik (2005)). To measure the effect of the policy
change on investment, I employ two different methodologies: (1) a difference-in-difference-in-
differences (DDD) methodology and (2) an instrumental variables (IV) approach, which
combines the exogenous cross-sectional variation for the succession decision provided by the
instrument with the time-series variation of the transfer tax resulting from the tax reform.
A simple way to evaluate the impact of the tax on the investment of firms undergoing
succession is to estimate the change (difference) in firm investment around succession in the pre-
reform period and examine how the investment changes around succession under the high
transfer tax. This difference estimates the change in investment around succession, while
controlling for firms’ time-invariant characteristics. However, this approach fails to control for
aggregate changes in investment resulting from macroeconomic trends or succession-specific
shocks. A common solution to this problem is to use a control group; one can compare the
changes in investment of firms that undergo family succession to firms that undergo unrelated
succession. This difference-in-differences approach controls for economic trends and succession-
specific patterns that might affect both groups. However, the difference-in-differences estimate
in the pre-reform period does not disentangle whether the change in investment is due to the
14 Greece is similar to the other European countries in family ownership of firms
where yi is the difference in investment around succession, defined as the average investment
post succession minus the average investment prior to succession.15 Post_Law is an indicator
variable equal to 1 if the succession occurs after the reform and 0 if it occurs before. Family is an
indicator variable equal to 1 for family successions and 0 for unrelated successions.
The coefficient of interest, δ1, measures how the investment gap between family and
unrelated successions changes after the tax reform. Under the null that the tax reform does not
affect investments around successions, δ1=0. I exclude from the analysis successions that
occurred in 2002, because the law was first discussed and voted on that year. The expected signs
of the key coefficients are c1<0 and δ1>0. The coefficient c1 estimates the difference in
investment change around succession for family and unrelated successions under the high
succession tax and is expected to be negative due to the impact of the high tax on internal
financial resources of firms that experience a family succession. The coefficient δ1 is expected to
be positive because the tax reduction for family successions should have a positive effect on their
investment.
15 Using the average investment in the years before succession and the average investment in the years after
succession is robust to the Bertrand, Duflo, and Mullainathan (2004) critique for auto-correlation in standard errors.
15
The DDD method is appropriate only if the treatment is random, meaning it is not a
function of observable or unobservable characteristics that also affect the outcome of interest
(investment). In our case, the required assumption is that factors that affect the decision to have a
family or an unrelated succession should not also affect investment. This assumption is strong
because omitted variables might exist that affect both investment and the decision to have a
family transfer. Furthermore, the observed change in the relative frequencies of family
successions and unrelated successions after the tax reform provides evidence that the succession
decision is an endogenous variable.
I employ instrumental variables (IV) to address this potential problem of a possible
omitted variable. Following Bennedsen et al. (2007), I instrument family succession by the
gender of the departing entrepreneur’s firstborn child. A valid instrument in the current context
should satisfy two criteria. First, it should have a clear effect on the decision to choose a family
succession. As Table III shows, that criterion is clearly met; when the departing entrepreneur’s
firstborn is male, family succession is more likely. Furthermore, the gender of the departing
entrepreneur’s firstborn should be associated with investment only because it affects the decision
to choose a family succession (exclusion restriction).16 The gender of the entrepreneur’s firstborn
is random and is unlikely to be related to the firm’s investment opportunities. This is also
supported by Table V, which describes the relationship between firm characteristics prior to
succession and the gender of the entrepreneur’s firstborn. In contrast to Table IV.A, Table V
shows that both before and after the reform, no difference in size, age, and investments is present
between the firms with male or female firstborns of the entrepreneur.
The IV estimator is implemented using the two-stage least squares (2SLS). In the
specification of interest (1), the endogenous family succession variable appears alone and also in
an interaction term. Given that two endogenous variables exist, I instrument the endogenous
dummy variable Family using the dummy variable Male Firstborn and the interaction term
16 In the case of heterogeneous treatment effects, monotonicity is also required.
16
(Family·Post_Law) using the interaction term (Male Firstborn·Post_Law). The corresponding
first-stage equations are
2 2 2 2 2i i i i i iFamily a c Male Firstborn (Male Firstborn Post_Law ) X' ζ ε (2)
3 3 3 3 3i i i i i i iFamily Post_Law a c Male Firstborn (Male Firstborn Post_Law ) X' ζ ε ,
(3)
where Family is an indicator variable equal to 1 for family successions and 0 for unrelated
successions, Male Firstborn is an indicator variable equal to 1 if the firstborn is male and 0 if
female, Male Firstborn·Post_Law is the interaction between the Post_Law variable and the
Male Firstborn variable. According to Angrist and Krueger (2001), linear 2SLS estimates like
those employed here have a robust causal interpretation that is not affected by the potential
nonlinearity induced by dichotomous variables. By contrast, using probit or logit to generate
first–stage predicted values with a dummy endogenous regressor could introduce inconsistency.
To estimate the effect of the tax reduction on changes in investment around successions, I
estimate the specification of interest (1) using IV (2SLS).
The identification exploits two sources of variation. The tax reform provides time-series
variation of the transfer tax, whereas the instrument provides exogenous cross-sectional variation
for the succession decision. The combination of the two sources of variation allows me to
disentangle the effect of the tax from a host of alternatives (e.g., the ability of the new owner),
and at the same time address any concern regarding the endogeneity of the succession decision
and influences from aggregate trends. Thus I can establish the causal effect of succession taxes
on firm investment. If one of the two variations were missing the identification would fail. If
there was no variation in the succession tax, whether the drop in investment was due to the tax or
to the different abilities or objectives of the new owner would be unclear. On the other hand, the
exogenous cross-sectional variation for the succession decision addresses any concerns that
factors that affect the succession decision might also affect the variable of interest (investment).
17
V. Main Results
A. Unconditional Evidence
Figure 3 shows the time-series evolution of average investment around transitions for
family successions and unrelated successions. Panel A refers to successions that took place
before the reform. Time is measured in years relative to the year of transition. Figure 3 shows
that when they face high succession taxes, firms that are transferred within the family experience
a sharp decline in investment in the year of succession, relative to firms that were transferred
outside the family. The decline in investment for firms with family successions is more than 40%
of the pre-transition level and persists for at least the two years after succession with only a slight
recovery.17 Panel B plots the average investment around succession for family successions and
unrelated successions that occur after the reform. In contrast to Panel A, Panel B shows that
when succession taxes for within-family transfers were greatly reduced, the average investment
of both family and unrelated succession firms follows similar patterns.
Figure 4 plots the time-series evolution of cash holdings for the two groups of firms.
Cash holdings are defined as the ratio of cash plus cash equivalents relative to total assets. Panel
A suggests that under the high succession tax, the tax liability drains the cash reserves of firms
that undergo family successions. A sharp decline in cash holdings occurs for family successions
in the year of the transition. Firms slowly replenish their cash reserves in the years following
transition. For unrelated successions, the cash holdings move smoothly around succession. In the
post-reform period (Panel B), the cash reserves of both groups of firms move similarly over time.
This preliminary evidence indicates that in the presence of high taxes (pre-reform
period), firms that undergo family succession experience a large drop in their post-succession
investment and cash holdings. The next section’s DDD and IV estimates confirm these results.
17 In Appendix, Figure AI shows the investment distortion persists even 4 years after transition.
18
B. Difference-in-Difference-in-Differences Results
To analyze the impact of succession taxes on firm investment around successions, I first
examine the change in investment around succession for family and unrelated transitions, both in
the pre-reform and post-reform periods. The first row in Table VI presents the difference in the
two-year average investment after succession minus the three-year average before succession.
Investment is defined as the ratio of capital expenditures in year t to start-of-year net property,
plant, and equipment (PPE). Columns I to V refer to the transfers that occurred before the tax
reform. Column II shows that under the high tax, investment declines sharply around succession
for firms that remain in the family. Investment drops from 17.6% of PPE the three years before
succession to 9.7% of PPE the two years after (7.9 percentage points drop). The impact is
economically significant: the implied fall in the investment ratio (0.079) is approximately 40% of
the pre-transition level of investment. Furthermore, it is statistically significant at the 1% level.
The effects are visible for at least four years after transition (see in Appendix) and suggest
succession taxes can have a large impact on investment around family transitions. For unrelated
successions, column III indicates a slight increase in investments after succession. As a result,
the average difference-in-differences suggest that in the pre-reform period, family successions
are associated with a 9.2 percentage points lower investment relative to unrelated successions. In
the post-reform period, the change in investment for unrelated successions is marginally higher
than for family transitions (column IX), but the difference is not statistically different from zero
at conventional levels. In column XI, the DDD estimate measures the effect of the tax reduction
on the investment levels of the two groups. The tax reduction resulted in an increase in
investment in firms with family successions that is 8.4 percentage points higher than the increase
in the investment in firms with unrelated successions. This result indicates the distortion in
investment is removed when the succession tax on family successions is eliminated. The results
are similar in Table VI Panel B when I use alternative time windows for the calculation of
investment. Furthermore, the median differences in columns V, X, and XII show outliers are
unlikely to drive the results.
19
In Table VI Panels C-D, I examine the effects of the reform on asset growth and cash
holdings. Panel C shows that under high succession taxes, firms undergoing family successions
grow less compared to firms with unrelated successions. After the succession tax for within-
family transitions is removed, the asset growth of the two groups is similar.
Table VI Panel D assesses the effect of the tax on firms’ cash holdings. Column II shows
the drain in cash resources for firms transferred within the family under high succession taxes.
The cash ratio drops from 18.4% of assets the three years before succession to 12.2% of assets
the two years after. This drop of 6.2 percentage points indicates liquidity-constrained
entrepreneurs use liquid assets of the company to pay the tax. Departing entrepreneurs that sell
off their businesses do not face the same constraint, because they can use part of the sale
proceeds to pay the tax. The elimination of the tax for family successions removes this distortion
in the post-reform period.
Although the preceding DDD analysis indicates the succession tax has a direct impact on
firms’ internal financial resources and investment, selection bias might contaminate the result as
discussed above. As noted before, firm characteristics related to investment opportunities are
likely to affect the decision to transfer the company to a descendant. To address this potential
problem, in the next section, I use instrumental variables to analyze the effect of succession taxes
on investment.
C. Instrumental Variables Main Results
First stage
Table VII Panel A presents the first-stage results for the relationship between the gender
of the entrepreneur’s firstborn and the type of succession. The results are consistent with Table
III. Both in the pre-reform and the post-reform periods, entrepreneurs with a male firstborn are
more likely to appoint a family successor relative to entrepreneurs with a female firstborn. The
high F statistic suggests the instrument is not weak. In unreported tests, I also check for a
20
potential weak instrument problem using the Stock and Yogo (2005) test, which did not indicate
weakness of the instrument.
Reduced form
In Table VII Panel B, I explore the reduced-form correlation of the instrument with the
changes in investment. The estimated coefficients of the variable Male Firstborn show that under
the high succession tax, firms in which the departing entrepreneur’s firstborn is male experience
an average decline in investment around succession that is 3.27 percentage points higher relative
to firms in which the entrepreneur’s firstborn is female. The coefficient of the interaction of the
Male Firstborn dummy with the Post_Law dummy indicates that after the tax is reduced for
family successions, the investment of firms whose entrepreneurs have a male firstborn increases
by 4.4 percentage points around succession relative to the investment of firms in which the
departing entrepreneur’s firstborn is female.
IV
Table VIII examines the effect of succession taxes on investment around transition.
Columns I, II, and III provide the OLS estimates to allow a direct comparison with columns IV,
V, and VI, which provide the estimated coefficients using instrumental variables. In all
specifications, the dependent variable is the change in investment around succession, defined as
the average investment post succession minus the average investment prior to succession. In
specifications I, II, IV, and V, I control for the pre-transition investment level. Furthermore, in
columns II, III, V, and VI, I control for age and size using the natural logarithm of lagged
assets.18 Consistent with the previous observations, in the presence of high succession taxes, all
the specifications show a sharp drop in investment by firms undergoing family successions
relative to those undergoing unrelated successions, and the difference is statistically significant.
Furthermore, all specifications show the tax-induced reduction in investment for family
successions is removed after the tax is reduced; the average post-succession investment of firms
undergoing family succession greatly increases relative to unrelated successions after the tax
18 I use assets as a common control for firm size. Assets are likely to be correlated with changes in investments.
21
reform. The sum of the two coefficients (Family and Post_Law·Family) is not statistically
different from zero, which further indicates the reform removed the distortion in investment in
family successions.19
The estimated coefficients of the IV are larger than those of the OLS, indicating a
reduction in investment of more than 18 percentage points. The gap between IV and OLS
estimates suggests that in the high-tax period, entrepreneurs that faced severe financial
constraints were more likely to choose unrelated successions. As a result, OLS underestimates
the true effect of the succession tax on firm investment.
D. Timing
One potential concern is whether some firms, after the introduction of the law, may have
delayed their transfer and waited until 2003 to take advantage of the lenient succession tax. To
address this concern, I repeat the analysis, excluding from the sample all the transitions that
occurred in 2003 (as well as excluding 2002 transitions, as in the results already reported). Table
IX shows the estimated coefficients for OLS and IV if the transitions that occurred in 2003 are
excluded from the sample. The results are similar to those in Table VIII and remain statistically
significant.
A second potential issue related to the timing of succession is whether firms perceived
the tax reform as a permanent or temporary change. If firms perceived the law as a potentially
temporary measure, the reform might provide incentives for firms to expedite their transfer
decisions. In that case, we would observe that after the reform, much younger firms transferred
to a family member. Three facts mitigate that concern. First, Table II shows that the numbers of
successions in the years before and after the reform are similar, 305 and 307, respectively.
Second, the sharp increase in the percentage of family transfers remains stable throughout the
years after the reform, which suggests that firms perceived the law change not as a temporary
measure but as a long-term change in the law. Third, Table IV.A shows that the age of the firms 19 I note here that the results presented in the paper are qualitatively similar if I use estimation strategy using
industry-year fixed effects. Appendix Table AIII presents the results from this estimation.
22
in the year of the succession are similar in the pre-reform and post-reform periods, which also
suggests entrepreneurs did not expedite their successions as a result of the reform.
An additional concern is that although the gender of the firstborn child is likely to
provide exogenous variation in terms of the identity of the new owner, the timing of succession
is unlikely to be random. To address potential concerns related to the timing of transitions, I
gather information on all transfers that occurred upon the death of the entrepreneur,20 and I
observe 153 successions upon such an event. In Table X, I examine the robustness of the
findings on the sample in which succession and the departing entrepreneur’s death occur in the
same year. In this sample, the endogeneity of the timing of the transition is less of a concern. The
size of the sample is smaller compared to the sample with inter vivos transfers, and using the IV
in this sample is a hard test. The results are similar to previous specifications and show the tax
reduction resulted in an increase in post-succession investment for family transitions.
E. Tax Evasion
One important point to consider is how potential tax evasion might affect the results. I first
investigate whether succession taxes were paid and whether the reform led to a reduction in the
effective tax rate. Because information on taxes paid at the firm level is not available, I collected
information on the specific succession tax revenues from 10 tax offices in Greece. These offices
represent approximately 5% of the total tax offices in Greece (more than 9% by revenues).
Figure 5 presents the average succession tax revenue per filing normalized by the 1999 average
succession tax revenue level. The dotted vertical line at 2002 represents the year of the reform.
Figure 5 shows a substantial decrease in the average succession tax revenues per filing after the
reform. Figure 5 provides suggestive evidence that the reform indeed led to a large decrease in
the effective tax rate that corporations undergoing successions faced. Notably, an increase in the
20 Upon the death of the entrepreneur, the firm is transferred to his family. If the family members keep the firm
within the family, the transfer is classified as a family transfer. If the family members transfer the company to an unrelated party, the year of the entrepreneur’s death, this transfer is classified as unrelated. In a few cases, the family members transferred the company to an outsider one or two years after the death of the entrepreneur. I omit these cases from the analysis. The results are robust to the inclusion of these cases.
23
number of filings does not drive this result, because the number of transfers is stable around the
reform, as Table 2 shows. An obvious caveat concerning this evidence is that the data represent
only 5% of the tax offices in Greece. Nevertheless, the sharp timing of the effects around the
reform in Figure 5 augments the results shown in the previous sections (which also occur sharply
around the reform).
Furthermore, although papers on tax evasion (Feld and Schneider (2010), Artavanis, Morse,
and Tsoutsoura (2012)) show that a large fraction of income taxes is evaded in Greece, the taxes
paid are not zero. In addition, prior literature has shown that collecting inheritance taxes is
relatively more efficient than collecting income taxes (Kopczuk (2012)). Thus, to the extent that
succession taxes are paid and are not zero, one would expect the proposed mechanism to bind in
the real data. Second, my empirical strategy also alleviates the concern that tax evasion might to
a degree be driving some of my findings. In particular, suppose firms evade taxes to some extent
and this variable is unobserved. To explain the results, such an omitted variable has to
differentially affect investment of firms that undergo succession and have an entrepreneur whose
firstborn child is male, compared to investment of firms that undergo succession and have an
entrepreneur whose firstborn is female—with the difference occurring sharply around the year of
the reform. I note that although tax evasion may occur, to the extent that taxes are not zero—
which the new figure and prior literature notes—it is unlikely to affect my results significantly.
Finally, the results in Table X for transfers that occurred upon the death of the entrepreneur
mitigate our concerns for planning in order to avoid the tax.
F. Interaction with Firm Characteristics
The previous analysis shows that transfer taxes have a large impact on firms’ internal
financial resources and their investment decisions. This section further proceeds to investigate
whether the effect of succession taxes on investment varies with observed firm characteristics.
Of course, a caveat in the analysis based on observable characteristics is that it is based on the
assumption that these observables are not endogenous to the firm’s investment opportunities.
24
Nevertheless, this investigation adds to the understanding of which firms are more affected by
succession taxes, which is important for considering the welfare implications of succession taxes.
A natural place to start this analysis is by exploring whether the decline in investment in
the presence of succession taxes is greater for firms that have low debt capacity. If external
financing is costly, firms with low debt capacity should experience a larger drop in investment.
In Table XI columns III and IV, I test whether the decline in investment for family successions is
greater for firms with assets that have low tangibility. Following Baker and Wurgler (2006), I
measure asset tangibility by property, plant, and equipment over assets, PPE/A, the year before
succession. For the subsample of companies with low tangibility, I observe that the economic
magnitude of the estimated coefficients is larger than what I found for the full sample (reported
for reference in columns I and II).
Furthermore, in columns V and VI, I explore whether the investment distortions are
stronger for family firms owned by entrepreneurs with relatively low income from other sources.
I use data on the entrepreneur’s personal income from sources other than the company to classify
firms according to their access to low-cost financial sources outside the firm. Although most
small and medium-sized firms face financing constraints (Fazzari et al. (1988)), the effect of the
tax on investment should be mitigated for firms whose entrepreneurs can use sources other than
external finance to pay their tax liabilities. The income from other sources (“Other income”
henceforth) is defined as the total income of the departing entrepreneur the year prior to
succession minus his income from the company. Both the OLS and IV analysis show the
investment decline is larger in firms with entrepreneurs with low income from other sources.
The analysis in columns I to VI that shows the investment decline is larger for firms with
assets that have low tangibility and firms with entrepreneurs with low income from other sources
provides some evidence consistent with financial constraints being a factor that exacerbates the
investment distortions of succession taxes. However, I note this evidence is not conclusive and
these patterns may also be consistent with other plausible channels, such as differential foresight
or long-term planning of the departed entrepreneur.
25
One important point about the main results is whether they are relevant only for smaller
firms that might face more severe frictions than larger corporations. I find, however, that this
case does not hold empirically. In columns VII and VIII, I repeat my analysis for firm with assets
above 5 million dollars. Column VII shows the OLS results for firms with assets above 5 million
dollars are similar to the results in the main specification. Thus succession taxes affect
investment both in small and intermediate companies. In the IV specification, however, the
statistical significance of these results is weak, because I do not have enough power in the
sample to identify the coefficients precisely. To the extent that the direction of the estimates is
informative, I conclude that succession taxes affect firm investment across the distribution of
firm size.21 Finally, I test whether the decline in investment is larger when the departed
entrepreneur owns the vast majority of the firm (columns IX and X). For the subsample of
transfers of more than 90% of the firm ownership, indeed the estimated coefficients both of the
OLS and IV regressions are larger than those in the full sample.
G. Alternative Outcome Variables - Performance
Table XII investigates the effect of succession taxes on sales growth and firm performance.
The dependent variable is the change in sales growth around succession (colums I and II) and
changes in scaled operating income (columns III and IV). The first two columns show that in the
pre-reform period, firms that undergo family successions have a 4.1 percentage points decline in
sales growth relative to firms undergoing unrelated successions, and the difference is statistically
significant. Furthermore, this tax-induced reduction in sales growth is removed after the reform.
In columns III and IV, I use as an alternative performance variable the firm operating income
divided by the assets level three years prior to succession. I scale operating income by pre-
succession asset values to isolate the effect on operating income from changes in asset value.22
Both the OLS and IV specification show firms experience declines in profitability around family
21 In the Appendix, I also report results for the various size quintiles and show the results hold across size
quintiles. 22 As Table VI Panel C shows, succession taxes lead to slow asset growth for family transitions.
26
successions when taxes are high. In sum, the results of Table XI demonstrate that succession
taxes affect firm profitability and sales expansion.
H.“Arbitraging” the Tax Liability
One potential issue to consider is whether the large increase in family successions in the
post-reform period could be attributed to entrepreneurs’ tax dodging: instead of directly
transferring the firm to unrelated parties and paying a 20% tax, entrepreneurs might have
preferred to transfer it first to family members and pay only a 1.2% or 2.4% tax, and then have it
transferred to unrelated parties within a short period of time. This practice, however, could be
considered a fraudulent transfer and bears severe penalties for the members involved.
Nevertheless, to address this potential issue, I track the filings in the Government Gazette
of all firms in my sample that were transferred to family in the post-reform period for the first
three years after their transfer. Of the 227 firms that were transferred to family members in the
post-reform period, none changed hands in the first two years after the family transfer and only
one changed hands in the third year. The evidence above eases any concerns about “arbitraging”
the succession tax in the post-reform period and is consistent with the penalties that any
“arbitraging” behavior bears.23 This observation further suggests the jump in family transfers is a
result of the willingness of the entrepreneurs to pass their company to their descendants and that
the succession tax in the pre-reform period constrained this choice.
VI. Conclusion
Inheritance taxes are at the center of a heated debate in the United States and Europe as
baby boomers enter retirement. One point that has received significant attention in the so-called
“death tax” debate is the impact of such taxes on private firms. The importance attributed to the
23 In addition to the hefty penalties, entrepreneurs would avoid “arbitraging” the tax for several reasons. The
entrepreneur may not trust family members to execute a sale to outsiders once they have control of the firm. Furthermore, infighting among family members might jeopardize such a transaction.
27
inheritance taxes on private and family firms in particular stems from the fact that these firms
comprise a large part of the economy in the United States and Europe, and are important
determinants of employment. Despite the arguments that succession taxes might depress
investment around succession and even force the entrepreneurs to sell out their firms, the
empirical evidence showing such a connection and quantifying the magnitudes has been
surprisingly scarce.
This paper fills this gap and uses a natural experiment to establish the causal effect of
succession taxes on investment decisions and firm transfer of control. The experiment is made
possible by the Greek government’s decision to greatly reduce succession taxes for intra-family
transfers of businesses in 2002. The paper uses unique microdata that combine firm-level
ownership and financial data of privately held firms in Greece with entrepreneurs’ family
characteristics and personal income. To measure the effect of succession taxes on investment, the
paper employs two different methodologies: (1) a difference-in-difference-in-differences (DDD)
methodology, and (2) an instrumental variables (IV) approach that exploits the gender of the
departing entrepreneur’s firstborn child as an instrument for family successions. The empirical
methodology allows me to isolate the effect of succession taxes from other possible factors that
might affect firm policies around successions (e.g., the ability of the new owner or aggregate
trends).
Both the DDD and the IV estimates show a strong negative effect of succession taxes on firm
investment around transitions. I found significant effects across the size distribution of firms.
Furthermore, successions taxes are also associated with the depletion of cash reserves, a decline
in profitability, and slow sales growth. Moreover, the results show that succession taxes affect
firm boundaries by impacting the decision to sell or retain the firm within the family. The
reduction of succession taxes leads to more than a 60% increase in family transitions.
The results of the paper provide direct and new evidence that succession taxes can
decisions. Moreover, succession taxes can affect the allocation of firms into the hands of heirs or
outsiders, which can have implications for aggregate productivity and economic growth. These
28
findings, by establishing and quantifying the relation between succession taxes and firm
investment and ownership decisions, are potentially relevant for policymakers as they are
redesigning the “optimal” succession tax policy.
29
RERENCES Anderson, R. C., and D. M. Reeb, 2003, Founding-family ownership and firm performance: Evidence from the S&P 500, The Journal of Finance 58, 1301-1328.
Angrist, J. D., and A. B. Krueger, 2001, Instrumental variables and the search for identification: From supply and demand to natural experiments, The Journal of Economic Perspectives 15, 69-85.
Angrist, J. D., and A. B. Krueger, 1999, Empirical strategies in labor economics, Handbook of Labor Economics, (A. Orley, and C. David. Amsterdam, North-Holland. IIIA: 1277-1366).
Angrist, J., and J. Pischke, 2008, Mostly harmless econometrics: An empiricist’s companion, (Princeton University Press). Artavanis, N., Morse, A., Tsoutsoura, M., 2012. Tax evasion across industries: soft credit evidence from Greece. University of Chicago, Chicago Booth Paper 12–25. Astrachan, J.H., and M.C. Shanker, 2003, Family businesses’ contribution to the U.S. economy: A closer look, Family Business Review, September. Auerbach, A., 2005, Taxation and capital spending, Working Paper, University of California, Berkeley. Ayyagari, M, Beck, T. , Demirgüç-Kunt, A., 2007, Small and Medium Enterprises across the Globe, Small Business Economics , Vol. 29, No. 4, pp. 415-434 Baker, M., and J. Wurgler, 2006, Investor Sentiment and the Cross-Section of Stock Returns, The Journal of Finance, Vol. LXI, No.4 Bennedsen, M., K. Nielsen, F. Perez-Gonzalez, and D. Wolfenzon, 2007, Inside the family firm: the role of families in succession decisions and performance, The Quarterly Journal of Economics 122, 647-691. Bertrand, M., S. Johnson, K. Samphantharak, and A. Schoar, 2008, Mixing family with business: A study of Thai business groups and the families behind them, The Journal of Financial Economics 88, 466-498. Bertrand, M., E. Duflo, and S. Mullainathan, 2004, How much should we trust differences- in- differences estimates?, The Quarterly Journal of Economics 119, 249-275. Blanchard, O., F. Lopez-de-Silanes and, A. Shleifer, 1994, What do firms do with cash windfalls?, The Journal of Financial Economics 36, 337-360. Bloom, N. , 2006, Inherited Family Firms and Management Practices: the case for modernising the UK's inheritance tax, Policy Analysis, Centre for Economic Performance, mimeo. Bloom, N. and, J. Van Reenen, 2007, Measuring and explaining management practices across firms and countries, The Quarterly Journal of Economics 122, 1351-1408.
30
Bolton, P., H. Chen and, N. Wang, 2009, A unified theory of Tobin's q, corporate investment, financing, and risk management, Columbia University Working Paper. Brunetti, M. J., 2006, The estate tax and the demise of the family business, The Journal of Public Economics 90, 1975-1993. Burkart, M., F. Panunzi, and, A. Shleifer, 2003, Family firms, The Journal of Finance 58, 2167-2202. Cagetti, M., and, M. De Nardi, 2009, Estate taxation, entrepreneurship, and wealth, The American Economic Review 99, 85-111. Calomiris, C. W., C. P. Himmelberg, and, P. Wachtel, 1994, Commercial paper, corporate finance, and the business cycle: A microeconomic perspective, Carnegie-Rochester Series on Public Policy 42, 203-250. Campello, M., E. Giambona, J. R. Graham, and C. R. Harvey, 2011, Liquidity management and corporate investment during a financial crisis, Review of Financial Studies 24, 1944-1979. Campello, M., J. R. Graham, and C. R. Harvey, 2010, The real effects of financial constraints: Evidence from a financial crisis, Journal of Financial Economics 97, 470-487.
Caroll, R., D. Holtz-Eakin, M. Rider, and, H. Rosen, 2000, Entrepreneurs, income taxes, and investment, in Joel Slemrod, ed., Does atlas shrug? The economic consequences of taxing the rich, (Harvard University Press). Caselli, F., and, N. Gennaioli, 2005, Dynastic management, The Journal of the European Economic Association 3, 679-689. Coase, R., 1937, The Nature of the Firm, Economica, 4, 386405 Davidson, M., and, R. Burke, 2004, Women in management worldwide: facts, figures and analysis, (Ashgate Publishing Limited) Ellul, A., M. Pagano, and, F. Panunzi, 2010, Inheritance law and investment in family firms, The American Economic Review 100, 2414-2450. European Commission, 1994, Communication of the commission on the transfer of small and medium sized enterprises, Luxembourg, Office for Official Publications of the European Communities, Reference IP/94/1161. European-Commission, 2003, Transfer of businesses – continuity through a new beginning. European-Commission, 2006, Market for business transfers.
31
European-Commission, 2008, Overview of family business relevant issues. Faccio, M., and, L. Lang, 2002, The ultimate ownership of western European corporations,” The Journal of Financial Economics 65, 365-395. Fazzari, S. M., G. R. Hubbard, and, B. C. Petersen, 1988, Financing constraints and corporate investment, Brookings Papers on Economic Activity 1, 141-195. Feld, L. P. and F. Schneider, 2010. "Survey on the Shadow Economy and Undeclared Earnings in OECD Countries." German Economic Review, Vol. 11 (2), pp. 109-149. Gale, W. and, J. Slemrod, 2001, Rethinking the estate and gift tax: Overview, Working Paper, University of Michigan Business School. Gilchrist, S., and, C. Himmelberg, 1995, Evidence on the role of cash flow for investment, Journal of Monetary Economics 36, 541-72. Gormley, Todd, and David Matsa, 2012, Common errors: How to (and not to) control for unobserved heterogeneity, mimeo. Gross, D. B., 1995, The investment and financing decisions of liquidity constrained firms, Ph.D. dissertation, Massachusetts Institute of Technology. Grossmann, V. and Strulik, H., 2010 Should Continued Family Firms Face Lower Taxes Than Other Estates?, Journal of Public Economics, Vol. 94, 81-101 Himmelberg, C. P., 1990, Essays on the relationship between investment and internal finance, unpublished Ph.D. Dissertation Holmstrom, B., and J. Roberts, 1998, The boundaries of the firm revisited, Journal of Economic Perspectives, Volume 12, 73-94 Holtz-Eakin, D., 1999, The death tax: investments, employment, and entrepreneurs, Tax Notes 84, 782-92. Hurst, E. and, A. Lusardi, 2004, Liquidity constraints, household wealth and entrepreneurship, The Journal of Political Economy 112, 319-47. Jensen, M. and, W.H. Meckling, 1976, Theory of the firn: Managerial behavior, agency costs and ownership structure, Journal of Financial Economics 3, 305-360. Joulfaian, D., 2009, The estate tax and the demise of the family business: a comment, US Department of Treasury, mimeo.
32
Kopczuk, W., 2012, Taxation of Intergenerational Transfers and Wealth, Handbook of Public Economics, Volume 5 Kopczuk, W., and, J. Slemrod, 2003, Tax consequences on wealth accumulation and transfers of the rich. Death and dollars: the role of gifts and bequests in America, A. H. Munnell and A. E. Sunden, Brookings Institution Press: 213-249. Kopczuk, W., and, J. Slemrod, 2005, Denial of death and economic behavior, Advances in Theoretical Economics: Vol. 5 : Iss. 1, Article 5. Kopczuk, W., 2007, Bequest and tax planning: Evidence from estate tax returns, The Quarterly Journal of Economics 122, 1801-1854. La Porta, R.,Lopez-de-Silanes, F. and, A. Shleifer, 1999, Corporate ownership around the world, The Journal of Finance 54, 471-517. MassMutual, 2003, American family business survey. Morck, R., D. Stangeland and, B. Yeung. 2000. Inherited Wealth, Corporate Control & Economic Growth: The Canadian Disease? In Randall Morck, ed. Concentrated Corporate Ownership. National Bureau of Economic Research and University of Chicago Press, 319-69. Muller, H. and, Warneryd, K., 2001, Inside vs. outside ownership: A political theory of the firm, RAND Journal of Economics 32, 527-541. Opler, T., L. Pinkowitz, et al., 1999, The determinants and implications of corporate cash holdings,The Journal of Financial Economics 52, 3-46. Perez-Gonzalez, F., 2006, Inherited control and firm performance, The American Economic Review 96, 1559-1588. Poterba, J. M., 2001, Estate and gift taxes and incentives for inter vivos giving in the US, The Journal of Public Economics 79, 237-264. Rauh, J. D., 2006, Investment and financing constraints: Evidence from the funding of corporate pension plans, The Journal of Finance 61, 33-71. Rodrik, D., 2005, Why we learn nothing from regressing economic growth on policies, Working paper, Harvard University. Seru, A., 2012, Firm Boundaries Matter: Evidence from Conglomerates and R&D Activity, The Journal of Financial Economics, forthcoming.
33
Stock, J., and, Y. Motohiro, 2005, Testing for weak instruments in linear IV regression, in Donald W. K. Andrews and James H. Stock, eds., Identification and Inference for Econometric Models: Essays in Honor of Thomas Rothenberg, Cambridge: Cambridge University Press, 2005, 80–108. Wooldridge, J., 2002, Econometric analysis of cross section and panel data, MIT Press. Villalonga, B., and, R. Amit, 2006, How do family ownership, control and management affect firm value?, The Journal of Financial Economics 80, 385-417.
34
Figure 1. Tax reform – Tax Rate by Succession Type
Successions are classified into two categories: family, when the transfer of the firm is towards relatives of the first or second degree, unrelated otherwise.
Figure 2. Distribution of Successions by Family Ties
Successions are classified into two categories: family, when the transfer of the firm is towards relatives of the first or second degree, unrelated otherwise.
35
Figure 3. Investment (CAPEX/PPEt-1) for Alternate Succession Decisions
Successions are classified into two categories: family, when the transfer of the firm is towards relatives of the first or second degree, unrelated otherwise. Time is measured in years relative to the year of transition.
PANEL A: Before the Tax Reform (High Tax for Both Family and Unrelated Successions)
Pre 2002
0.05
0.1
0.15
0.2
0.25
‐4 ‐3 ‐2 ‐1 0 1 2
CAPEX/PPE t
‐1
Year Relative to Succession
Family
Unrelated
PANEL B: After the Tax Reform (Low Tax for Family Successions)
Post 2002
0.05
0.1
0.15
0.2
0.25
‐4 ‐3 ‐2 ‐1 0 1 2
CAPEX/PPE t
‐1
Year Relative to Succession
Family
Unrelated
36
Figure 4. Cash Holdings (Cash/Assets) for Alternate Succession Decisions
Successions are classified into two categories: family, when the transfer of the firm is towards relatives of the first or second degree, unrelated otherwise. Time is measured in years relative to the year of transition.
PANEL A: Before the Tax Reform (High Tax for Both Family and Unrelated Successions)
Pre 2002
0.05
0.1
0.15
0.2
‐4 ‐3 ‐2 ‐1 0 1 2
Cash/Assets
Year Relative to Succession
Family
Unrelated
PANEL B: After the Tax Reform (Low Tax for Family Successions)
Post 2002
0.05
0.1
0.15
0.2
‐4 ‐3 ‐2 ‐1 0 1 2
Cash/Assets
Year Relative to Succession
Family
Unrelated
37
Figure 5. Average succession tax revenue per filling relative to 1999 average succession tax revenue level
The vertical axis presents the average revenue per filling normalized by the1999 average revenue level. The horizontal axis shows calendar years. The dotted vertical line at 2002 represents the year of the reform.
0
20
40
60
80
100
120
140
160
1999 2000 2001 2002 2003 2004 2005
38
Table I. Industry Distribution of Successions
This table presents the industry distribution of successions by family ties. Successions are classified into two categories: family, when the transfer of the firm is towards relatives of the first or second degree (column III), unrelated otherwise (column IV). Firms are sorted by industry using the NACE 1.1 primary classification (European industry classification system). Firms in utilities and finance industries are excluded. Column I reports the number of limited liability firms (E.P.E) in each industry in the database for the years 1999-2005. Column I reports in parentheses the share of firms in the industry as a percentage of all firms in the database. Column II reports the number of firms in each industry that undergo succession.Column II reports in parentheses the share of successions as a percentage of the total number of successions in the sample. Columns III and IV report in square bracket the share of successions as a percentage of the total number of successions per industry.
Industry All All Family Unrelated Companies Successions Successions Successions
(I) (II) (III) (IV) 1 Agriculture 95 5 3 2
(0.8) (0.7) [60.0] [40.0]
2 Construction 374 20 10 10 (3.2) (2.8) [50.0] [50.0]
3 Education 120 8 4 4 (1.0) (1.1) [50.0] [50.0]
4 Health and social work 240 13 5 8 (2.1) (1.9) [38.5] [61.5]
13 Other 1,372 95 56 39 (11.8) (13.7) [59.0] [41.0]
Total 11,556 694 402 292 (100.0) [57.9] [42.1]
39
Table II. Distribution of Successions by Family Ties
The table illustrates the distribution of successions during the sample period. Successions are classified into two categories: family, when the transfer of the firm is towards relatives of the first or second degree (child, husband, sibling, grandchild, nephew or niece), unrelated otherwise. Family successions to children are further categorized as family-children, when the firm is transferred to the child of the departing entrepreneur. *** indicates significance at the 1% level.
Before Reform Change (1999-2001): 305 167 0.548 138 0.452 93 0.674 After Reform Change (2003-2005): 307 80 0.261 227 0.739 179 0.789 Difference: -0.287 *** 0.287 *** 0.115 ***(After Law Change) minus (Before Law Change) (0.015) (0.015) (0.033)
40
Table III. Successions by Gender of Firstborn Child
The table presents the share of family and unrelated successions by the gender of the firstborn of the departing entrepreneur. Successions are classified into two categories: family, when the transfer of the firm is towards relatives of the first or second degree (child, husband, sibling, grandchild, nephew or niece), unrelated otherwise. *** indicates significance at the 1% level.
Number of Successions
Family Unrelated Time Period Successions Successions
After Reform Male Firstborn 136 109 0.801 27 0.199 Female Firstborn 134 87 0.649 47 0.351
Difference male minus female: 0.152 ***
(0.054)
41
Table IV.A Summary Statistics for the Years Prior to Succession
The table reports summary statistics for the three years prior to succession. Columns I-IV refer to successions that occurred before the reform and columns V-VIII refer to successions that occurred after the reform. Successions are classified into two categories: family, when the transfer of the firm is towards relatives of the first or second degree, unrelated otherwise. Ln assets is the natural logarithm of the book value of assets (in Euros). Firm age is the difference between the succession year and the year of establishment. Investment is the ratio of capital expenditures in year t to start-of-year net property, plant and equipment. Cash ratio is the ratio of cash and cash equivalent to total assets. Sales growth is defined as the annual percentage increase in sales. The number of observations is denoted in brackets. Heteroskedasticity-robust standard errors are reported in parentheses. ***, **, and * indicate significance at the 1%, 5%, and 10% level, respectively.
Before Reform After Reform
Variable
All Family Unrelated Difference All Family Unrelated Difference
Succession Succession of Means Succession Succession of Means (I) (II) (III) (IV) (V) (VI) (VII) (VIII) No of Firms 305 138 167 307 227 80 Ln Assets 13.841 13.756 13.912 -0.156 ** 13.911 13.873 14.020 -0.147 *
The table reports summary statistics on ownership. Columns I-IV refer to successions that occurred before the reform and columns V-VIII refer to successions that occurred after the reform. Successions are classified into two categories: family, when the transfer of the firm is towards relatives of the first or second degree, unrelated otherwise. The number of succeeding persons is the number of persons that are receiving the company transferred. The share of ownership held by the outgoing entrepreneur describes the percentage of the ownership of the company that is held by the outgoing entrepreneurs the year before the transfer. The number of observations is denoted in brackets. Heteroskedasticity-robust standard errors are reported in parentheses. ***, **, and * indicate significance at the 1%, 5%, and 10% level, respectively.
Before Reform After Reform
All Family
SuccessionUnrelated
SuccessionDifference of Means All
Family Succession
Unrelated Succession
Difference of Means
Variable
(I) (II) (III) (IV) (V) (VI) (VII) (VIII)
138 167 305 227 80 307
Number of succeeding persons 1.469 1.5 1.443 0.056 1.466 1.476 1.437 0.038 (0.039) (0.064) (0.049) (0.081) (0.033) (0.037) (0.071) (0.080)
Share of Ownership Held by 0.839 0.844 0.835 0.009 0.85 0.856 0.835 0.021 Outgoing Entrepreneur (0.009) (0.014) (0.013) (0.019) (0.009) (0.010) (0.019) (0.021)
43
Table V. Summary Statistics Prior to Succession by the Gender of the Firstborn Child
The table reports summary statistics for variables used in the analysis for the three years prior to succession. Columns I-IV refer to successions that occurred before the reform and columns V-VIII refer to successions that occurred after the reform. Successions are classified into two categories: male, when the firstborn of the departing entrepreneur is male and female when the firstborn is female. Firms where the departing entrepreneur has no children are omitted. The variables are defined in Table IV.A. The number of observations is denoted in brackets. Heteroskedasticity-robust standard errors are reported in parentheses.
Before Reform After Reform
Variable
All
Male Female Difference
All
Male Female Difference
Firstborn Firstborn of Means Firstborn Firstborn of Means
Table VI. Changes around Successions: Difference-in-Difference-in-Differences (DDD)
The table presents the results of the difference-in-difference-in-differences analysis. Successions are classified into two categories: family, when the transfer of the firm is towards relatives of the first or second degree (child, husband, sibling, grandchild, nephew or niece), unrelated otherwise. Columns I-V refer to successions that occurred before the reform and columns VI-X refer to successions that occurred after the reform. Columns I-III and VI-VIII show the changes around succession by type of succession for the following variables: investment, ln assets and cash ratio. Changes around succession are computed as the difference between the two-year average post-succession minus the three-year average before succession. The year of succession is omitted. Column IV is the difference between column II and column III and column IX is the difference between column VII and column VIII (difference-in-differences). Column XI is the difference between column IV and column IX (difference-in-difference-in-differences). Columns V, X and XII present median differences. Investment, Ln assets and cash ratio are defined in Table IV.A. Time is measured in years relative to the year of transition. The year of transition is omitted. Successions that occurred the year of the reform are omitted. Heteroskedasticity-robust standard errors are reported in parentheses. ***, **, and * indicate significance at the 1%, 5%, and 10% level, respectively.
Before Reform After Reform Differences
Type of Succession
Type of Succession
Variable All Family Unrelated Mean Median All Family Unrelated Mean MedianMean Median
D. Cash Ratio -0.0264 -0.0623 0.0033 -0.0656 *** -0.0314 *** 0.0040 0.0017 0.0111 -0.0094 -0.0036 0.0562 ** 0.0278 ** (2-year average after) - (0.007) (0.011) (0.008) (0.013) (0.010) (0.008) (0.009) (0.015) (0.018) (0.009) (0.023) (0.014) (3-year average before)
45
Table VII. Effect of Reform on Investment around Successions: First Stage and Reduced Form
Panel A reports estimates of the first-stage. Male Fistborn is a dummy variable equal to 1 if the firstborn child of the departing entrepreneur is male and 0 if it is female. Post_Law is an indicator variable equal to 1 if the succession occurs after the reform and 0 if it occurs before. Definitions of Lnassets and Firm Age are given in Table III. Panel B report the estimates of the reduced form equation. The dependent variable is the difference in investment around succession estimated using the 3-year average before and 2-year average after firm transition. Successions that occurred the year of the reform are omitted.
Heteroskedasticity-robust standard errors are reported in parentheses. *** and ** indicate significance at the 1% and 5% level, respectively.
Panel A. First Stage Two Endogenous Variables: Family, Post_Law·Family
Family Post_Law·
Family Family Post_Law· Family
(I) (II) (III) (IV)
Post_Law · Male Firstborn -0.0243 0.1523 *** -0.0187 0.1540 ***
(0.080) (0.0537) (0.079) (0.054)
Male Firstborn 0.1773 *** 0. 0001 0.1764 *** -0.0002
Dependent Variable: Differences in Investment (CAPEX/ Assetst-1) around Successions
(I) (II)
Post_Law · Male Firstborn 0.0343 ** 0.0347 **
(0.014) (0.014)
Male Firstborn -0.0314 *** -0.0314 ***
(0.010) (0.010)
Post_Law 0.0341 *** 0.0336 ***
(0.009) (0.010)
Ln Assetst-3 -0.0029
(0.004)
Age 0.0005
(0.001)
Pre-Transition Investment YES YES
Number of Observations 542 542
46
Table VIII. Effect of Tax on Investment around Successions: OLS and Instrumental Variables-2SLS
Estimated coefficients in columns I, II and III are from least squares regressions (equation 1). Estimated coefficients in columns IV, V and VI are from IV-2SLS regressions. The dependent variable is the change in investment around successions. Changes in investment are computed as the difference between the average two-year post-succession investment minus the three-year average before succession. The year of succession is omitted. Post_Law is an indicator variable equal to 1 if the succession occurs after the reform and 0 if it occurs before. Family is an indicator variable equal to 1 for family successions and 0 for unrelated successions. Investment, age and Ln assets are defined in Table III. Successions that occurred the year of the reform are omitted. Heteroskedasticity-robust standard errors are reported in parentheses. ***, ** and * denote significance at the 1, 5 and 10 percent level respectively.
Dependent Variable: Differences in Investment Around Successions (two-year average post-succession) - (three-year average pre-succession)
Table IX. Timing - Exclude Transfers that Occurred in 2003
Estimated coefficients in column I are from least squares regression. Estimated coefficients in column II are from IV-2SLS regression. All the transfers that occurred in 2003 are excluded from the estimation. The dependent variable is the change in investment around successions as defined in Table VII. Post_Law is an indicator variable equal to 1 if the succession occurs after the reform and 0 if it occurs before. Family is an indicator variable equal to 1 for family successions and 0 for unrelated successions. Successions that occurred the year of the reform are omitted. Heteroskedasticity-robust standard errors are reported in parentheses. ***, ** and * denote significance at the 1, 5 and 10 percent level respectively.
Dependent Variable: Differences in
Investment Around Succession
OLS IV-2SLS
(I) (II)
Family -0.0736 *** -0.1785 *** (0.010) (0.066)
Post_Law · Family 0.0756 *** 0.3162 ** (0.017) (0.160)
Number of Observations 499 449
48
Table X. Timing – Transfers Upon the Death of the Entrepreneur
Estimated coefficients in column I are from least squares regression. Estimated coefficients in column II are from IV-2SLS regression. The sample consists of transfers in which succession and the departing entrepreneur’s death occur in the same year. The dependent variable is the change in investment around successions as defined in Table VII. Post_Law is an indicator variable equal to 1 if the succession occurs after the reform and 0 if it occurs before. Family is an indicator variable equal to 1 for family successions and 0 for unrelated successions. Successions that occurred the year of the reform are omitted. Heteroskedasticity-robust standard errors are reported in parentheses. ***, ** and * denote significance at the 1, 5 and 10 percent level respectively.
Dependent Variable: Differences in Investment Around Succession
Succession and the Departing Entrepreneur’s Death Occur in the Same Year
OLS IV-2SLS
(I) (II)
Family -0.1114 *** -0.2428 * (0.023) (0.140)
Post_Law · Family 0.0814 *** 0.2308 (0.027) (0.160)
Number of Observations 153 144
49
Table XI. Interaction with firm characteristics
Estimated coefficients in columns I, III, V and VII are from least squares regressions (equation 1). Estimated coefficients in columns II, IV, VI and VIII are from IV-2SLS regressions. The dependent variable is the change in investment around successions. Changes in investment are computed as the difference between the average two-year post-succession investment minus the three-year average before succession. The year of succession is omitted. Post_Law is an indicator variable equal to 1 if the succession occurs after the reform and 0 if it occurs before. Family is an indicator variable equal to 1 for family successions and 0 for unrelated successions. Successions that occurred the year of the reform are omitted. Columns I-II present results for the full sample. Columns III-IV present results for the subsample of firms with below median asset tangibility. Tangibility is defined as property, plant and equipment over assets, the year before succession. Columns V-VI present results for the subsample of firms with entrepreneurs below median income from other sources other than the firm. Columns VII-VIII show results for the subsample of firms with more than 5 million dollars in assets. Columns IX-X present results for the subsample of firms that the departed entrepreneur owned more than 90% the year before succession. Firm controls include age and lnassetst-3.Heteroskedasticity-robust standard errors are reported in parentheses. ***, ** and * denote significance at the 1, 5 and 10 percent level respectively.
Full Sample Low Asset
Tangibility Firms Low Other Income
of Entrepreneur
High Onwership of Departed
Entrepeneur Firms with assets> 5
million
OLS IV-
2SLS OLS IV-
2SLS OLS IV-
2SLS OLS IV-2SLS OLS IV-
2SLS
(I) (II) (III) (IV) (V) (VI) (VII) (VIII) (IX) (X)
Number of Observations 542 542 263 263 268 268 83 83 261 261
50
Table XII. Alternative Dependent Variables-Performance
Estimated coefficients in columns I and III are from least squares regressions. Estimated coefficients in columns II and IV are from IV-2SLS regressions. The dependent variables in columns I- IV are the difference between the average two-year post-succession performance measure minus the three-year average before succession. The year of succession is omitted. Sales growth is defined as the annual percentage increase in sales. Operating Income/Assetst-3 is the operating income divided by the assets level three years prior to succession. Post_Law is an indicator variable equal to 1 if the succession occurs after the reform and 0 if it occurs before. Family is an indicator variable equal to 1 for family successions and 0 for unrelated successions. Successions that occurred the year of the reform are omitted. Firm controls include age and lnassetst-3.Heteroskedasticity-robust standard errors are reported in parentheses. ***, ** and * denote significance at the 1, 5 and 10 percent level respectively.
APPENDIX Figure AI. Investment (CAPEX/PPEt-1) for Alternate Succession Decisions before the Reform
Successions are classified into two categories: family, when the transfer of the firm is towards relatives of the first or second degree, unrelated otherwise. Time is measured in years relative to the year of transition. The figure plots investment for family and unrelated successions four years before and four years after the transition.
Pre 2002
52
Table AI. U.S. Estate Tax Exemption and Maximum Tax Rate, 1988-2011
Calendar Year Exemption Maximum Tax Rate for Taxable Estate Values Over
(in $ millions)
1988‐1997 $600,000 55% over $3.0 plus 5% surtax from over $10.0 to $21.040
1998 $625,000 55% over $3.0 plus 5% surtax from over $10.0 to $17.184
1999 $650,000 "
2000 $675,000 "
2001 $675,000 "
2002 $1,000,000 50% over $2.5
2003 $1,000,000 49% over $2.0
2004 $1,500,000 48% over $2.0
2005 $1,500,000 47% over $2.0
2006 $2,000,000 46% over $2.0
2007‐2008 $2,000,000 45% over $1.5
2009 $3,500,000 45% over $1.5
2010 Estate tax repealed for 2010 only
2011 $5,000,000 35%
2012 $5,120,000 35%
2013* $1,000,000 55%
*Under current law
Source:Estate and Gift Tax Revenues: Past and Projected, CSR Report for Congress & H.R. 4853, the Tax Relief, Unemployment Insurance Reauthorization and Job Creation Act of 2010
53
Table AII. Asset Quartiles of Private Firms in the Eurozone The table presents the size quartiles of private firms in the Eurozone as well as in Germany and France as well as the total number of firms covered. The source of the data is Amadeus database for 2005.The sample includes all private firms excluding financial and insurance companies and utilities.
Table AIII. Effect of Tax on Investment around Successions: OLS and Instrumental Variables-2SLS/Industry-Year FE
Estimated coefficients in column I are from least squares regression. The estimating equation is:
1 1 1 1 1
1 it
_ ( )
( _ * _ ) ( _ * )
( * _ * _ ) εts
it i i i i
i i
i i
investm ent a β Post_Law c Fam ily d Post Succession Post_Law Fam ily
Post Law Post Succession Post Succession Fam ily
Fam ily Post Law Post Succession X ' ζ
Estimated coefficients in column II are from IV-2SLS regressions. The dependent variable is investment. Post_Law is an indicator variable equal to 1 if the succession occurs after the reform and 0 if it occurs before. Family is an indicator variable equal to 1 for family successions and 0 for unrelated successions. Post_Succession is an indicator variable equal to 1 for the years after succession and 0 for the years before. Investment, age and Ln assets are defined in Table III. Successions that occurred the year of the reform are omitted. All specifications include industry-year fixed effects. Heteroskedasticity-robust standard errors are reported in parentheses. Standard errors are clustered at the firm level. ***, ** and * denote significance at the 1, 5 and 10 percent level respectively.
(0.017) (0.041) Age 0.0010 0.0003 (0.001) (0.001) -0.0027 -0.0001 Ln Assetst-3 (0.004) (0.003) Industry- Year Fixed Effects YES YES
Number of Observations 2710 2710
55
Table AIV. Pre-Reform Decline in Investment by Firm Size: OLS and Instrumental Variables-2SLS
Estimated coefficients in Column I are from least squares regression in the pre-reform period. Estimated coefficients in Column II are from IV-2SLS regression in the pre-reform period. The dependent variable is the change in investment around successions. Changes in investment are computed as the difference between the average two-year post-succession investment minus the three-year average before succession. The year of succession is omitted. Family is an indicator variable equal to 1 for family successions and 0 for unrelated successions. Size quartiles are based on firm assets. Heteroskedasticity-robust standard errors are reported in parentheses. ***, ** and * denote significance at the 1, 5 and 10 percent level respectively.
Dependent Variable: Differences in Investment Around
Succession (two-year average post succession) - (three-year average pre succession)
OLS IV-2SLS (I) (II)
Family -0.0969 *** -0.1519 ** (0.028) (0.054)
Family * Size Quartile2 -0.0013 -0.0682 (0.033) (0.167)
Family * Size Qurntile3 -0.0085 -0.0868 (0.029) (0.257)
Family * Size Quartile4 -0.0541 * -0.2281 (0.032) (0.831)