The Effect of the Amorphous and Crystalline States on Preferential Corrosion of Hf from a Cu 75 Hf 20 Dy 05 Alloy D.J. HORTON and J.R. SCULLY Amorphous solid-solution Cu 75 Hf 20 Dy 05 , which undergoes devitrification without changing composition either locally or globally, was used to examine the effects of structural ordering on corrosion properties in the absence of any accompanying chemical partitioning. Melt spun amorphous Cu 75 Hf 20 Dy 05 undergoes single-phase devitrification to a Cu 51 Hf 14 phase. The difference in corrosion behavior between these two structures was explored in hydrofluoric acid solutions where preferential dissolution of hafnium occurred. Preferential Hf dissolution occurred more readily in the amorphous alloy compared with its crystalline counterpart. Remaining copper reorganized to form a face-centered cubic (fcc) nanostructure in both con- ditions, but this process occurred quickly in the amorphous state and more slowly in the crystalline variant. A uniform, nanoporous Cu sponge structure, with a pore diameter of approximately 10 nm, formed after dissolution in the amorphous state. A less uniform, nano- porous structure developed more slowly when occurring from the crystalline state. These dif- ferences were traced to the effects of ordering on both dissolution and surface diffusion. DOI: 10.1007/s11661-011-1065-5 Ó The Minerals, Metals & Materials Society and ASM International 2012 I. INTRODUCTION THE role of atomic scale structure (nanostructure) on the corrosion properties of metals remains unclear. This is in large part a result of the presence and nature of structural and chemical defects, which result typically in regions of structural and chemical inhomogeneity. These sites often dominate corrosion behavior. [1–3] The lack of long-range order, grain boundaries, and defects in amorphous alloy systems is thought to be a key beneficial characteristic leading to the concept that amorphous alloys possess superior corrosion resistance compared with their crystalline counterparts. [4] How- ever, it is becoming increasingly clear that corrosion resistance of amorphous alloys benefits from (1) accom- modating a large concentration of passivating or disso- lution-inhibiting elements in solid solution, [5] (2) a lack of defects causing chemical or structural nonuniformi- ties, [6] and (3) complex roles of minor alloying elements often added for other reasons. [7] In contrast, the role of nanostructured atomic arrangements on the corrosion behavior of amorphous and crystalline alloys has been elusive and is not well understood. [8–14] The transformation of disordered amorphous alloys to ordered single-phase crystalline alloys provides an ideal forum to study the role of structural ordering on the corrosion behavior without the accompanying com- plication of long-range chemical partitioning. However, previous studies led to inconsistent and sometimes contradictory conclusions regarding the effects of order- ing without compositional change on the corrosion behavior of amorphous alloys. An increase, [8,9,11] decrease, [10,14] and minimal effect [12,13] from ordering have all been reported. This study focuses on corrosion of an amorphous solid- solution alloy compared with a stoichiometrically equiv- alent crystalline structure lacking other micrometer-scale defects. The preferential dissolution of one element from the matrix provides an ideal opportunity to use electro- chemical techniques to explore the effect of ordering on this process. The role of ordering on preferential dissolution has been studied in the Cu 3 Au system, which undergoes a transformation from a disordered crystalline solid solution (face-centered cubic [fcc]) to an ordered crystalline state (L1 2 ). The ordered, single-phase exhibits passivity at higher potentials and has a higher critical dealloying potential than disordered crystalline Cu 3 Au. [15] The crystallographic orientation of the initial dealloying of (111) Cu 3 Au in sulfuric acid solution was studied carefully and low overpotential dealloying led to the formation of strained Au regions, while higher overpotential dealloying caused the formation of relaxed Au islands reorganized into an fcc structure. [16] How structure affects the behavior of passive mate- rials and how it affects dissolution in the active state are important corrosion issues. Dealloying, or preferential dissolution of a less noble element, often occurs during active dissolution. Dealloying to form nanoporosity has been studied for catalyst production and other applica- tions. [17,18] In particular, significant research has been performed with the goal of producing nanoporous Cu using both crystalline and amorphous precursor alloys in a variety of solution environments. Nanoporous Cu was formed by dealloying from a single-phase Mn-Cu D.J. HORTON, Graduate Research Assistant, and J.R. SCULLY, Charles Henderson Chaired Professor of Materials Science and Engineering Co-director, are with the Center for Electrochemical Science and Engineering, Department of Materials Science and Engineering, University of Virginia, Charlottesville, VA 22904. Contact e-mail: [email protected]Manuscript submitted March 29, 2011. Article published online February 7, 2012 2706—VOLUME 43A, AUGUST 2012 METALLURGICAL AND MATERIALS TRANSACTIONS A
Transcript
The Effect of the Amorphous and Crystalline States onPreferential Corrosion of Hf from a Cu75Hf20Dy05 Alloy
D.J. HORTON and J.R. SCULLY
Amorphous solid-solution Cu75Hf20Dy05, which undergoes devitrification without changingcomposition either locally or globally, was used to examine the effects of structural ordering oncorrosion properties in the absence of any accompanying chemical partitioning. Melt spunamorphous Cu75Hf20Dy05 undergoes single-phase devitrification to a Cu51Hf14 phase. Thedifference in corrosion behavior between these two structures was explored in hydrofluoric acidsolutions where preferential dissolution of hafnium occurred. Preferential Hf dissolutionoccurred more readily in the amorphous alloy compared with its crystalline counterpart.Remaining copper reorganized to form a face-centered cubic (fcc) nanostructure in both con-ditions, but this process occurred quickly in the amorphous state and more slowly in thecrystalline variant. A uniform, nanoporous Cu sponge structure, with a pore diameter ofapproximately 10 nm, formed after dissolution in the amorphous state. A less uniform, nano-porous structure developed more slowly when occurring from the crystalline state. These dif-ferences were traced to the effects of ordering on both dissolution and surface diffusion.
DOI: 10.1007/s11661-011-1065-5� The Minerals, Metals & Materials Society and ASM International 2012
I. INTRODUCTION
THE role of atomic scale structure (nanostructure)on the corrosion properties of metals remains unclear.This is in large part a result of the presence and natureof structural and chemical defects, which result typicallyin regions of structural and chemical inhomogeneity.These sites often dominate corrosion behavior.[1–3] Thelack of long-range order, grain boundaries, and defectsin amorphous alloy systems is thought to be a keybeneficial characteristic leading to the concept thatamorphous alloys possess superior corrosion resistancecompared with their crystalline counterparts.[4] How-ever, it is becoming increasingly clear that corrosionresistance of amorphous alloys benefits from (1) accom-modating a large concentration of passivating or disso-lution-inhibiting elements in solid solution,[5] (2) a lackof defects causing chemical or structural nonuniformi-ties,[6] and (3) complex roles of minor alloying elementsoften added for other reasons.[7] In contrast, the role ofnanostructured atomic arrangements on the corrosionbehavior of amorphous and crystalline alloys has beenelusive and is not well understood.[8–14]
The transformation of disordered amorphous alloysto ordered single-phase crystalline alloys provides anideal forum to study the role of structural ordering onthe corrosion behavior without the accompanying com-plication of long-range chemical partitioning. However,
previous studies led to inconsistent and sometimescontradictory conclusions regarding the effects of order-ing without compositional change on the corrosionbehavior of amorphous alloys. An increase,[8,9,11]
decrease,[10,14] and minimal effect[12,13] from orderinghave all been reported.This study focuses on corrosion of an amorphous solid-
solution alloy compared with a stoichiometrically equiv-alent crystalline structure lacking other micrometer-scaledefects. The preferential dissolution of one element fromthe matrix provides an ideal opportunity to use electro-chemical techniques to explore the effect of ordering on thisprocess. The role of ordering on preferential dissolutionhas been studied in the Cu3Au system, which undergoes atransformation froma disordered crystalline solid solution(face-centered cubic [fcc]) to an ordered crystalline state(L12).Theordered, single-phase exhibitspassivityathigherpotentials and has a higher critical dealloying potentialthandisordered crystallineCu3Au.[15] The crystallographicorientation of the initial dealloying of (111) Cu3Au insulfuric acid solution was studied carefully and lowoverpotential dealloying led to the formation of strainedAu regions, while higher overpotential dealloying causedthe formation of relaxedAu islands reorganized into an fccstructure.[16]
How structure affects the behavior of passive mate-rials and how it affects dissolution in the active state areimportant corrosion issues. Dealloying, or preferentialdissolution of a less noble element, often occurs duringactive dissolution. Dealloying to form nanoporosity hasbeen studied for catalyst production and other applica-tions.[17,18] In particular, significant research has beenperformed with the goal of producing nanoporous Cuusing both crystalline and amorphous precursor alloysin a variety of solution environments. Nanoporous Cuwas formed by dealloying from a single-phase Mn-Cu
D.J. HORTON, Graduate Research Assistant, and J.R. SCULLY,Charles Henderson Chaired Professor of Materials Science andEngineering Co-director, are with the Center for ElectrochemicalScience and Engineering, Department of Materials Science andEngineering, University of Virginia, Charlottesville, VA 22904.Contact e-mail: [email protected]
Manuscript submitted March 29, 2011.Article published online February 7, 2012
2706—VOLUME 43A, AUGUST 2012 METALLURGICAL AND MATERIALS TRANSACTIONS A
alloy in hydrochloric and sulfuric acid solutions.[19,20]
The dissolution of Cu-based amorphous materials hasalso been studied. The dissolution of Al and Mg from anAl-Cu-Mg precursor alloy produced nanoporous Cu.[21]
Amorphous Cu60Zr30Ti10 ribbons were dealloyed by fullimmersion in varying concentrations of hydrofluoricacid solution (0.05 M to 1.0 M) under free corrosionconditions, where Zr and Ti were found to dissolveforming nanoporous Cu selectively.[22] Similar to Zr, it isexpected that Hf would undergo preferential dissolutionin hydrofluoric acid solution.[23] In contrast, in alloysystems such as Cu60Zr30Ti10 and Cu75Hf20Dy05, whereCu is alloyed with primarily refractory elements, deal-loying in mineral acids favors Cu dissolution.
Hydrofluoric (HF) acid is often used in electrochemistrybecauseof its ability topreferentiallydissolve elements (Nb,Zr, Ta,[24] and Hf[23]) that normally are not susceptible todissolution in strong mineral acids, e.g., hydrochloric andsulfuric acid. Conversely, elements that typically dissolve instrongacids are resistant to corrosion inHFacid solution (aprime example is Mg, which forms a fluoride-basedprotective film[24]). The difference in nobility betweenalloying elements creates situations ideal for studying theeffect of structural ordering on dealloying. The preferentialdissolution of less noble elements in HF acid solutionoccurs by selective dissolution of Hf without Cu oxidation.The comparative behavior of the disordered amorphousand crystalline Cu75Hf20Dy05 is explored in hydrofluoricacid solution during Hf dissolution and Cu reorganizationin this article. A separate article (forthcoming) comparesthe behavior of disordered amorphous and crystallinestates on passivity and local corrosion in sulfate solutions.
In this work, amorphous and crystalline structures, withno change in composition, were studied using HF acidsolution at concentrations of 0.1 M and 1 M usingpotentiodynamic polarization, potentiostatic polarizationmethods, and subsequent surface analysis. The controlledselective dissolution of Hf from the matrix was observed.After exposure to the solution environment, the structurewas characterized using X-ray diffraction (XRD), thesurface morphology using scanning electron microscopy(SEM), and surface composition using energy dispersivespectroscopy attached to the SEM (SEM-EDS).We foundthat crystalline Cu75Hf20Dy05 exhibits increased resistanceto dissolution in HF solution compared to the amorphousCu75Hf20Dy05 of the same composition. The effects ofordering on dissolution of Hf and surface diffusion of Cuare discussed.
II. EXPERIMENTAL
A. Metallurgical Characterization
Amorphous Cu75Hf20Dy05 was produced by the meltspinning technique. Pure elements (Cu 99.999 pct, Hf99.9 pct excluding Zr, and Dy 99.9 pct) were made intoan ingot by arc melting under an argon atmosphere. Theingot was then melted inductively under argon andcooled rapidly on a Cu wheel of radius 10 mm with arotation speed of 40 m/s. Prior to heat treatments, thesamples were first encapsulated in quartz tubes under
argon. To crystallize fully the amorphous ribbon, theencapsulated samples were annealed at 873 K (600 �C)for 30 minutes and then water quenched. The as-spunand annealed samples were characterized by XRD andtransmission electron microscopy (TEM). XRD wasperformed using a Scintag XDS-2000 diffractometerwith a Cu-Ka source (k = 1.541 A). The XRD spectrameasurements were conducted in the h/2h configuration.TEM analysis was performed using a finite-elementinterface Titan 80-300 STEM operated at 300 kV. TheTEM specimens were prepared by cryogenic ion millingat 5 kV for 40 minutes.Pure-element samples, used in comparative electro-
chemistry experiments, were polycrystalline Hf wire(99.7 pct Zr nominal 3 pct) and high-purity polycrys-talline Cu wire (> 99.99 pct) with surface areas roughlyequivalent to the Cu75Hf20Dy05 ribbons.
B. Corrosion Measurements
The corrosion measurements were conducted using twodifferent working electrode-specimen mounting proce-dures with different exposed areas. The first involvedribbon samples that were mounted perpendicular to theirlong axis in epoxy with an exposed area of roughly80 lm 9 300 lm and an approximate surface area of10�4 cm2. The epoxy-mounted samples were ground usingsuccessively finer grits, 400-600-800-1200, of SiC paper.The epoxy and the associated small exposed area limit
the postexposure characterization techniques includingXRD, SEM, and EDS. To alleviate these issues, analternative specimen-mounting procedure was used toexpose a much larger surface area, approximately0.1 cm2, without using epoxy. In this setup, an unpolishedribbon was connected electrically to an Al-mounting poleusing adhesive Cu tape. The area beneath the exposedribbon had been previously electrically isolated from thesolution by painting with a lacquer. The Al–Cu tapespecimen electrical connection was then lacquered toisolate it electrically from the solution.After exposure, thelacquer was removed easily and the Cu tape connectionwas severed to remove the specimen for XRD and SEManalysis. Ribbon cross sections were created by attachingthe exposed ribbon to carbon tape and then slicing themwith a razor blade. The surface morphological analysis,dealloyed layer thickness, and semiquantitative compo-sitional analysis were performed using a field-emissiongun JEOL 6700F SEM (JEOL Ltd, Tokyo, Japan) withan attached EDS detector.A traditional, three-electrode setup with a working
electrode, reference electrode, and platinum mesh count-erelectrode were used. An all-polytetrafluoroethyleneelectrochemical cell was used because of the ability ofthe HF solution to dissolve borosilicate-type glass. Thereference electrode used was a saturated calomel elec-trode (SCE), with a plastic body and a ceramic ionpermeable junction. Chemical solutions were producedusing reagent-grade chemicals and pure water (resistivity18.2 M X/cm) produced by an Academic MilliQ filtra-tion system (MilliPore, Billerica, MA). The solution wasleft aerated and experiments were conducted at roomtemperature (298 K [25 �C]).
METALLURGICAL AND MATERIALS TRANSACTIONS A VOLUME 43A, AUGUST 2012—2707
The amorphous and annealed crystalline specimenswere characterized by XRD and TEM prior to expo-sure. These specimens were mounted subsequently forelectrochemical experiments using the two differentmounting methods. Experimental measurements con-ducted include cyclic polarization, potentiostatic polar-ization, and cyclic voltammetry (CV) below the Cuopen-circuit potential (OCP) and through the Cu OCPto anodic potentials. Cyclic polarization behavior wasmeasured at a scan rate of 1 mV/s with scans startingand ending at a potential 200 mV below the OCP withan apex potential of 1000 mVSCE. Cyclic CV experi-ments had a scan rate of 20 mV/s.
Several assumptions and approximations were used tocalculate the depth of penetration of preferentiallydissolving Hf. The conversion from charge density tothe quantity of monolayers removed was estimatedusing Faraday’s law. The total number of atoms in agiven monolayer was assumed to be approximately1015 atoms/cm2. For the Cu75Hf20Dy05 alloy, Hf atomscomprise 20 at. pct. Thus, the total number of Hf atomsis 0.2 9 1015 atoms/cm2. Assuming that Hf oxidizes tothe + 4 valence state, the total number of monolayersthrough which preferential Hf dissolution has occurredassuming uniform dealloying can be estimated. Addi-tionally, an approximate depth of preferential dissolu-tion penetration into the Cu75Hf20Dy05 alloy wascalculated from Faraday’s law using the density of Hf.The uniform depth was converted to a dealloying depthby a factor of 5 to account for the fact that only20 at. pct Hf was dissolving.
III. RESULTS
A. Thermodynamics of F--Hf/Cu-H2O Systems
HF is a weak acid with a dissociation constant, pKa,of 3.20.[25] The pH of the HF solution concentrationsused in this study was calculated based on the weak acidapproximation. For a 0.1 M HF solution, the speciationdiagram (Figure 1) was calculated.[26] For HF solutionconcentrations of 0.01, 0.1, and 1 M, the pH and the
anion concentrations determined by the speciationdiagram are tabulated in Table I.According to the speciation diagram, 0.01 M is
approximately the concentration of F� and HF2� anions
in 0.1 M HF solution at a pH of 2.12 with the remainderpresent as either HF or the H2F2.E-pH diagrams, not shown, were calculated for a series
of F� concentrations for each constituent element.[26] TheE-pH diagrams show that for low F� concentrations, noCu complexation is expected. However, at higher F�
concentrations (1 M F�), a stable CuF+ complex formsabove pH 2.5. The horizontal Cu oxidation line at0.18 VSHE (–0.06 VSCE) is unchanged from the watersystemexcept at higher concentrations ofF� and even thenonly at less acidic pH (above 4.5). For Hf, the E-pHdiagram remains unchanged even at high F� concentra-tions, indicating that F� has no effect on the thermody-namic stability of Hf. At 10 mM F� concentration, Dyforms two complexes, DyF2� and DyF2
1�, and a stableDyF3 at a pH above a pH of approximately 2.8. At higherF� concentrations, the region where DyF3 is the stablespecies enlarges to include lower pH ranges. In 1 M F�
solution, DyF3 is stable to nearly a pH of 1.Ithasbeenobserved thathafnium indeed corrodes inHF
solution, and the likely electrochemical reaction (Eq. [1]) isan oxidation of Hf to HfF4 by molecular HF (alsoproducing H2).
[23] Similar behavior was observed for Zr,which oxidizes to ZrF4 in HF solution.[27] It is likely thatHfF4 is a thermodynamically unstable precipitate possiblyforming a hydrate[28] or some other reaction with water,and thus it does not appear on the E-pH diagram. Thesolubility of ZrF4 has been determined and has thesolubility of 1.5 g/100 mL in water.[25]
Hfþ 4HF! HfF4 þ 2H2 ½1�
B. Structural Characterization of the Amorphousand Crystalline States
The XRD spectra of the amorphous and crystallineribbon specimens are shown in Figure 2. The XRDspectrum for the annealed specimen indicate single-phase crystallization to a Cu51Hf14 phase,[29] with a0.6 deg phase shift likely from Dy in solid solution.According to the phase diagram, Cu51Hf14 is a linecompound.[30] Amorphous Cu75Hf20Dy05 devitrifies to asingle phase, Cu51Hf14, while maintaining a Cu to Hfratio of approximately 4:1. High-resolution TEM imag-ing (Figure 3) was used to confirm the amorphousstructure. The fast Fourier transform of the micrograph,inlaid, confirms the amorphous structure.
Table I. Calculated Values for the pH, [F2], [HF2
2],
and [HF] of the 0.01, 0.1, and 1 M HF Solution;
the Balance is H2F2
[HF] pH [F�] [HF2�] [HF]
1 M 1.61 8 mM 17 mM 350 mM0.1 M 2.12 6 mM 2 mM 68 mM0.01 M 2.65 2 mM — 8 mMFig. 1—Calculated speciation diagram for the F�-H20 system con-
taining 0.1 M F� ions in solution at 298 K (25 �C).
2708—VOLUME 43A, AUGUST 2012 METALLURGICAL AND MATERIALS TRANSACTIONS A
C. Anodic Electrochemical Dissolution Behavior
The anodic polarization behavior of the amorphousand crystalline Cu75Hf20Dy05 is compared with theirprimary alloying elements in 1 M (Figure 4) and 0.1 M(Figure 5) aerated HF solution. The polarization waspreceded by a 600-second, open-circuit hold. Someimportant conclusions can be drawn from the OCPbehavior. At both HF solution concentrations, Hf andDy have a much lower OCP than Cu indicating coupledanodic and cathodic reactions at potentials where Cu isimmune. Moreover, the OCPs of both the amorphousand crystalline Cu75Hf20Dy05 alloy are intermediate,
between the potentials of high-purity Cu and Hf/Dy.The OCP increase with time suggests Hf dissolutionfrom the surface layers, giving rise to a more Cu-richsurface and associated nobility. At the higher (1 M HF)solution concentration, both the amorphous and crys-talline alloys undergo abrupt, temporary decreases inpotential. Likely, these potential decreases are the resultof newly exposed regions rich in Hf leading to atemporary increase in the rate of Hf dissolution andan associated decrease in the OCP. In the lowerconcentration 0.1 M HF solution, the OCP of thecrystalline Cu75Hf20Dy05 remains stable over time whilethe amorphous state shows the sharp potential dropsobserved in the higher HF concentration solution.The polarization behavior in both solutions shows no
passivity for either Cu or Hf, but it shows distinctlydifferent behavior. In 1 M HF solution, hafnium cor-rodes above its OCP, –1000 mVSCE at 10 mA/cm2,which is likely the anodic mass transport limited current
Fig. 2—XRD spectra of Cu75Hf20Dy05 melt-spun ribbon as received(amorphous) and after annealing at 873 K (600 �C) for 30 min. Thecrystalline phase is identified as Cu51Hf14 with a 0.6 deg phase shift.The small peak at 30.5 deg is likely caused by surface layer HfO2
formation.
Fig. 3—High-resolution TEM bright-field micrograph amorphousCu75Hf20Dy05 showing a fully amorphous structure.
Fig. 4—Open-circuit behavior (top) and the anodic polarization(bottom) behavior of amorphous and crystalline Cu75Hf20Dy05 alloyscompared with the pure polycrystalline alloying elements at 1 mV/sin aerated 1 M HF solution. (Color figure online).
METALLURGICAL AND MATERIALS TRANSACTIONS A VOLUME 43A, AUGUST 2012—2709
density for Hf because the current density is independentof potential. Cu dissolution occurs above its open circuitat –100 mVSCE, but a form of weak salt-film-basedpassivation occurs, which is also observed for theCu75Hf20Dy05 alloys in both states. After the open-circuit delay, the amorphous and crystalline Cu75Hf20-Dy05 both exhibit similar E-logi behavior (Figure 4) topure Cu including breakdown events at potentials above200 mVSCE. Similar behavior is observed in lowerconcentration 0.1 M HF solution shown in Figure 5,but the apparent limiting current density for Hf disso-lution is 1 mA/cm2. In 0.1 M HF solution, the crystal-line state has a lower OCP than the amorphous state butsimilar behavior at anodic overpotentials. In bothsolution concentrations, the amorphous and crystallinealloys have lower OCPs than pure Cu and dissolve atslightly lower potentials. The key result of these exper-iments is that Hf dissolves at significantly lower poten-tials than Cu. Testing within this region, where
high-purity Cu is immune, will dissolve Hf preferentiallyand enable the residual uncorroded Cu to reorganize.Optical micrographs after the polarization experiment
showed that the surface of both amorphous andcrystalline Cu75Hf20Dy05 had changed from an initialsilver metallic color to a reddish orange color, indicatingthat the surface layer had likely become Cu rich. Thisfinding will be explored in more detail using the largerexposure area mounted ribbon specimens and is dis-cussed in the subsequent sections.
D. Effect of Structure on Increase in Hydrogen Evolutionwith Concurrent Hafnium Dissolution
Rapid CV experiments were performed on the amor-phous and crystalline Cu75Hf20Dy05 samples to exploredifferences in Hf dissolution behavior in aerated 0.1 MHF solution without mass transport effects. The exper-iments were cycled (–1 to –0.1 VSCE) over the potentialrange where Hf dissolution is expected while Cu remainsstable. The cyclic voltammogram ranged from near theHf OCP at –1 VSCE to just below the Cu OCP at–0.1 VSCE. The cyclic voltammograms (Figure 6) of theamorphous and crystalline Cu75Hf20Dy05 show anincrease in cathodic currents as the cycle numberincreases. This increasing cathodic half-cell reaction islikely the hydrogen evolution reaction, which has aNernst potential of –0.341 VSCE in a 0.1 M HF solution.The cathodic current densities are greater for the
amorphous case than for the crystalline case. Thisbehavior is readily apparent in Figure 6, which showsthe current density at a potential of –0.9 VSCE duringthe upward scan of each cycle. This plot also shows anincrease in magnitude of the cathodic current density forboth the amorphous and crystalline samples. Theincrease in cathodic current density is attributed toenhanced hydrogen evolution on Cu, which is known tocatalyze this reaction.[31] By cycle 20, the amorphoussample stabilizes at higher cathodic current densities,
Fig. 5—Open-circuit behavior (top) and the anodic polarization(bottom) behavior of amorphous and crystalline Cu75Hf20Dy05 alloyscompared with the pure polycrystalline alloying elements at 1mV/sbehavior in aerated 0.1 M HF solution. (Color figure online).
Fig. 6—Hydrogen evolution current density at –0.9 VSCE during theupward scan of each cycle. The total potential range per cycle was–1 VSCE to –0.1 VSCE at a scan rate of 20 mV/s in aerated 0.1 M HFsolution. (Color figure online).
2710—VOLUME 43A, AUGUST 2012 METALLURGICAL AND MATERIALS TRANSACTIONS A
such as –0.22 A/cm2, than the crystalline sample at–0.16 A/cm2. The interpretation of these data is that Cuenrichment and associated Hf dissolution occurs morereadily in the case of the amorphous alloy.
E. Effect of Structure on Cu Dissolution
Rapid CV experiments were performed also to high-light the Cu dissolution behavior as a function ofstructure. This was performed in aerated 0.1 M HFsolution in a potential regime where Cu dissolution isfaster than Hf dissolution (Figure 5). The initialpotential was –0.250 VSCE and the apex potential was0.5 VSCE. A total of 40 consecutive cycles were run at20 mV/s in aerated 0.1 M HF. Over this entire potentialrange, Hf dissolution and Dy oxidation are expected.Above 100 mVSCE, Cu is expected to dissolve as well.
Figure 7 shows the CV behavior of the primaryconstituent elements, which are Cu and Hf. For all 40cycles, Cu is active above 0.1 VSCE and decreases inpeak anodic current slightly as the cycle numberincreases. Hf also undergoes dissolution at its mass-transport-limiting current density over the entire poten-tial range. Only a single representative Hf CV is shown.The measured current density correlates with the limit-ing current density measured by cyclic polarization. Dy,which is not shown in the figure, has a constant initialcurrent density during the first cycle of 90 lA/cm2. Forthe subsequent cycles, the Dy specimen had a constantcathodic current density of approximately –200 lA/cm2.
The first four cycles of the CV experiments are shownin Figure 8 comparing both amorphous and crystallineCu75Hf20Dy05 states. During each cycle, the anodiccurrent density for the amorphous state is much higherthan the crystalline state. Additionally, at potentialshigher than the active nose (Figure 8), the currentdensity for both cases decreases. Furthermore, for theamorphous case, numerous large anodic transient events
occur at increased potentials. The charge during thelarge current transients during the first few cycles of theamorphous alloy is approximately 1 to 2 mC/cm2, whichis roughly equal to 6 to 12 monolayers of uniformdissolution if the entire surface were to dissolve (likelynot the case). In contrast, the transient events are farfewer in number and significantly smaller in magnitude(0.5 mC/cm2 and ~ 3 monolayers assuming uniformdissolution) in the case of the crystalline state.The total charge density was calculated for each cycle
for the constituent elements except Dy, which has anegligible charge, and the amorphous and crystallineCu75Hf20Dy05. The charge vs cycle is plotted in Figure 9.
Fig. 7—Cyclic voltammograms of Cu and Hf from –0.25 VSCE to0.5 VSCE, scan rate 20 mV/s, in aerated 0.1 M HF solution. For Cu,every five cycles is plotted. The direction of solid arrow indicatesincreasing cycle number. For Hf, a single representative cycle isshown. (Color figure online).
Fig. 8—Cyclic voltammograms of amorphous and crystalline Cu75Hf20-Dy05 from –0.25 VSCE to 0.5 VSCE at a scan rate of 20 mV/s in aerated0.1 M HF solution. Cycles 1 through 4 are shown. The numbers indi-cate cycle number for amorphous Cu75Hf20Dy05. The arrow indicatesincreasing cycle number for crystalline Cu75Hf20Dy05. (Color figureonline).
Fig. 9—Calculated charge density per cycle of amorphous and crys-talline Cu75Hf20Dy05 alloys during cyclic voltammetry from –0.25 to0.5 VSCE at 20 mV/s. Pure polycrystalline Cu and Hf are alsoshown. Dy is not shown because the charge density is less than0.0001 C/cm2. (Color figure online).
METALLURGICAL AND MATERIALS TRANSACTIONS A VOLUME 43A, AUGUST 2012—2711
Cu has a comparatively high charge density per cycle,whereas Hf is constant at a much lower value corre-sponding to its limiting current density. The crystallineCu75Hf20Dy05 decreases quickly to low current densitiescrossing below 0.6 C/cm2 by cycle 12; for amorphousCu75Hf20Dy05, the decrease in charge is much slower,matching the Cu dissolution rate for several cycles, andit does not cross below 0.6 C/cm2 until cycle 23. Thefinal charge density for both the crystalline and amor-phous state is somewhat similar in magnitude, withthe crystalline state slightly lower, and it is lower thanthe current density for the Hf dissolution reaction. Thelower charge density arises possibly because of thebeneficial role of passivation brought on by Dy formingDyF3 or possibly some other form of dissolutioninhibition. In summary, the findings of these experi-ments indicate that in a regime where Cu dissolves fasterthan Hf, more Cu dissolves from the amorphous alloythan the crystalline alloy.
F. Preferential Hf Dissolution in a Potential RegimeDominated by Hf Dissolution
Potentiostatic polarization was performed also(Figure 10) at a potential below the Cu OCP wherepreferential Hf dissolution is expected. As expected, theelectrochemical current on high-purity Cu remainscathodic, whereas Hf has a high anodic current density,approximately 0.01 A/cm2, which indicates Hf dissolu-tion. The amorphous Cu75Hf20Dy05 remains cathodicfor the initial 1800 seconds before sharp peaks of anodiccurrent persist until the end of the experiment at5400 seconds. In contrast, the crystalline Cu75Hf20Dy05has a brief period of initial anodic current and thenremains cathodic. The net anodic charge density sus-tained during the brief anodic current in the crystallinestate is 3.3 mC/cm2, whereas the net anodic chargedensity in the amorphous state is 2.15 C/cm2. Theseresults indicate that the crystalline structure is lesssusceptible to Hf dissolution than the amorphousstructure. The contrast between the amorphous and
crystalline structures was explored by XRD and SEMcharacterization as a function of exposure time.For both amorphous and crystalline Cu75Hf20Dy05, a
series of potentiostatic polarization experiments wasperformed with durations ranging from 3600 seconds to20 ks to achieve statistically significant observationsregarding the i vs time behavior and to perform ex situpostcorrosion characterization. Representative i vs timebehavior for the amorphous and crystalline replicates isshown in Figure 11. During the first 7200 seconds ofexposure, the crystalline condition typically has a highinitial current density that decays rapidly over the first100 seconds and becomes cathodic. The net currentdensity increases over time, first becoming less cathodicand then slightly anodic. This increase in current densityis caused by increasing Hf dissolution. Additionally,characteristic events occur where the current densityrapidly decreases from or toward cathodic currents andstabilizes.For the amorphous state, the initial current spike
decays similarly to the crystalline condition, althoughfewer replicates experience net cathodic currents. Afterthe initial potential drop, the current density risesquickly to high anodic current densities, with an averageof 1 mA/cm2 at 3600 seconds and 2 mA/cm2 at7200 seconds. These values are significantly higher thanthose observed in the crystalline state, which have anaverage current density of less than 0.5 mA/cm2 and lessthan 1 mA/cm2 at 3600 seconds and 7200 seconds,respectively. The amorphous state does not show thereductions in current density observed in the crystallinestate. Instead, the amorphous condition follows ageneral trend to higher currents over time. The averagecharge density is shown in Figure 12. At 3600 seconds,the total accumulated charge density in the crystallinecondition is 0.07 C/cm2, which is lower than that for theamorphous condition, which is 0.357 C/cm2. The chargedensity corresponds to an average of approximately 500monolayers of preferential Hf dissolution for the
Fig. 10—Potentiostatic polarization current vs time curves of amor-phous and crystalline Cu75Hf20Dy05 alloys and the pure polycrystal-line alloying elements at –150 mVSCE in aerated 0.1 M HF solution.(Color figure online).
Fig. 11—Representative potentiostatic polarization measurements ofanalogous large ribbon samples and large ribbon (surface areaapproximately 0.1 to 0.25 cm2) specimens at –150 mVSCE in aerated0.1 M HF solution for amorphous and crystalline Cu75Hf20Dy05.(Color figure online).
2712—VOLUME 43A, AUGUST 2012 METALLURGICAL AND MATERIALS TRANSACTIONS A
crystalline case. In contrast, 3000 monolayers dissolvedfor the amorphous case. At 7200 seconds, the totalcharge density difference between the amorphous andcrystalline states increased to 0.7 C/cm2.
XRD spectra are shown as a function of increasingcharge, with the HF solution exposure times listed, forthe amorphous and crystalline specimens (Figures 13and 14). Both alloys undergo surface layer recrystalli-zation to fcc Cu as the surface layer Hf dealloys. Theamorphous alloy, with its overall significantly higher i vstime behavior, undergoes surface reorganization to fccCu at 7.6 ks of polarization and 1.15 C/cm2 of accu-mulated charge. After this exposure, both the broadamorphous peak and the fcc Cu peaks are detected. At
higher accumulated charge, the Cu peaks become betterdefined. For the crystalline case, surface reorganizationis not indicated by the XRD spectra at polarizationtimes less than the 20 ks, during which 3.05 C/cm2
(calculated approximations: 24 k monolayers, 7 lm) ofcharge accumulated. Both the characteristic Cu51Hf14and the fcc Cu patterns are detected. At an intermediatecharge accumulation of 0.461 C/cm2 (4 k monolayers,1.2 lm), the Cu fcc peaks are not yet apparent.SEM microscopy was used to determine the surface
morphology of the dealloyed layer after exposure.Figure 15 shows the surface morphology of the amor-phous specimen after the 20 ks potentiostatic polariza-tion with 6.5 C/cm2 of total anodic charge density. The
Fig. 12—The total accumulated anodic charge density of amorphousand crystalline Cu75Hf20Dy05 during potentiostatic polarization at–150 mVSCE in 0.1 M HF solution. The error bars represent 1 stan-dard deviation.
Fig. 13—The XRD spectra of the amorphous Cu75Hf20Dy05 afterpotentiostatic polarization at –150 mVSCE in 0.1 M HF solution.The spectra are shown with increasing total anodic charge. Thepeaks for polycrystalline Cu are shifted+0.2 deg are labeled.
Fig. 14—XRD spectra of the crystalline Cu75Hf20Dy05 after poten-tiostatic polarization at –150 mVSCE in 0.1 M HF solution. Thespectra organized by the total anodic charge and time of exposure.The peaks for polycrystalline Cu (no shift) are also labeled.
Fig. 15—SEM micrograph of the postexposure surface of the amor-phous Cu75Hf20Dy05 specimen with 6.47 C/cm2 of total accumulatedcharge during potentiostatic polarization at –150 mVSCE in 0.1 MHF solution for 20 ks.
METALLURGICAL AND MATERIALS TRANSACTIONS A VOLUME 43A, AUGUST 2012—2713
surface morphology indicates a uniform distribution ofpores with an approximate 10-nm diameter as well asnodules. In contrast, the surface morphology of the
crystalline state (Figure 16) does not show the sameuniform porous structure viewed in the amorphouscondition. The pores are smaller than those observed inthe amorphous condition.The through-thickness morphology (Figures 17 and
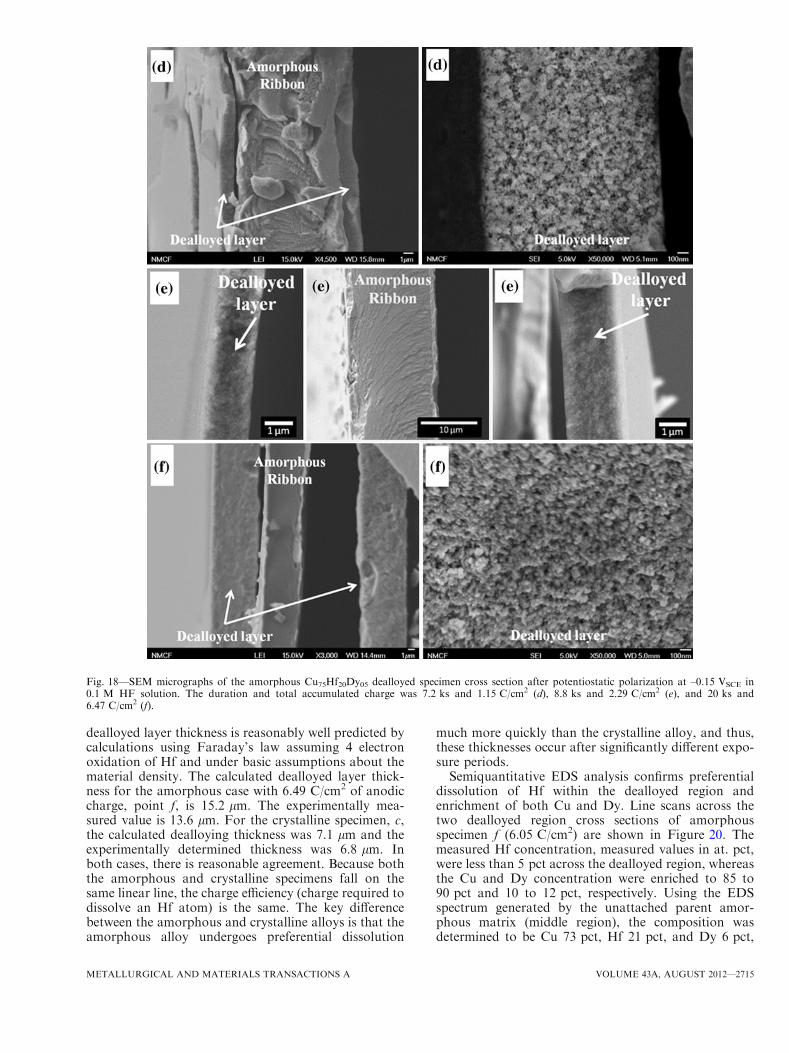
18) was analyzed using ribbon cross sections. Thegrowth of the dealloyed region is shown as a functionof increasing charge at the exposure duration and chargeaccumulation of the XRD spectra (a,b, and c forcrystalline Cu75Hf20Dy05 and d,e, and f for amorphousCu75Hf20Dy05). The higher resolution cross-sectionmorphology of crystalline specimen c (Figure 17) andamorphous specimen f (Figure 18) show increasedsurface roughness in the dealloyed layer of the crystal-line state.The dealloyed layer thickness, which is measured by
these SEM micrographs, is plotted as a function ofcharge in Figure 19. The plot shows the averagedealloyed layer thickness as the sum of the dealloyedthickness for both sides of exposure. At shorter expo-sure times, the amorphous alloy has a significantlylarger dealloyed layer. The dealloyed layer thickness as afunction of charge density is fit by the same linear linewith a slope of 2.04 lm/(C/cm2) for both the crystallineand amorphous states. From Faraday’s law, the chargeis linearly proportional to the dealloying thickness. The
Fig. 16—SEM micrograph of the postexposure surface of the crys-talline Cu75Hf20Dy05 specimen with 3.05 C/cm2 of total accumulatedcharge during potentiostatic polarization at –150 mVSCE in 0.1 MHF solution for 20 ks.
Fig. 17—SEM micrographs of the crystalline Cu75Hf20Dy05 dealloyed specimen cross section after potentiostatic polarization at –0.15 VSCE in0.1 M HF solution. Duration and total accumulated charge was 4.2 ks and 0.007 C/cm2 (a), 7.2 ks and 0.461 C/cm2 (b), and 20 ks and3.05 C/cm2 (c).
2714—VOLUME 43A, AUGUST 2012 METALLURGICAL AND MATERIALS TRANSACTIONS A
dealloyed layer thickness is reasonably well predicted bycalculations using Faraday’s law assuming 4 electronoxidation of Hf and under basic assumptions about thematerial density. The calculated dealloyed layer thick-ness for the amorphous case with 6.49 C/cm2 of anodiccharge, point f, is 15.2 lm. The experimentally mea-sured value is 13.6 lm. For the crystalline specimen, c,the calculated dealloying thickness was 7.1 lm and theexperimentally determined thickness was 6.8 lm. Inboth cases, there is reasonable agreement. Because boththe amorphous and crystalline specimens fall on thesame linear line, the charge efficiency (charge required todissolve an Hf atom) is the same. The key differencebetween the amorphous and crystalline alloys is that theamorphous alloy undergoes preferential dissolution
much more quickly than the crystalline alloy, and thus,these thicknesses occur after significantly different expo-sure periods.Semiquantitative EDS analysis confirms preferential
dissolution of Hf within the dealloyed region andenrichment of both Cu and Dy. Line scans across thetwo dealloyed region cross sections of amorphousspecimen f (6.05 C/cm2) are shown in Figure 20. Themeasured Hf concentration, measured values in at. pct,were less than 5 pct across the dealloyed region, whereasthe Cu and Dy concentration were enriched to 85 to90 pct and 10 to 12 pct, respectively. Using the EDSspectrum generated by the unattached parent amor-phous matrix (middle region), the composition wasdetermined to be Cu 73 pct, Hf 21 pct, and Dy 6 pct,
Fig. 18—SEM micrographs of the amorphous Cu75Hf20Dy05 dealloyed specimen cross section after potentiostatic polarization at –0.15 VSCE in0.1 M HF solution. The duration and total accumulated charge was 7.2 ks and 1.15 C/cm2 (d), 8.8 ks and 2.29 C/cm2 (e), and 20 ks and6.47 C/cm2 (f).
METALLURGICAL AND MATERIALS TRANSACTIONS A VOLUME 43A, AUGUST 2012—2715
which is close to the nominal composition of Cu75Hf20-Dy05. The residual 5 pct Hf indicates that a finiteamount of Hf is trapped or buried in the Cu-richnodules. The measured concentrations across the deal-loyed region were fairly uniform, and there were nosubstantial through-thickness concentration gradients.Similar behavior was observed in the crystalline speci-mens. The EDS results show that the preferentialdissolution of hafnium occurred during the potentio-static exposure in HF solution within the dealloyedregion, whereas the parent matrix retained the nominalalloy concentration for both the amorphous and crys-talline conditions. However, a statistically significantdifference was not found between the measured compo-sitions in the fully dealloyed regions of the amorphousand crystalline states.
IV. DISCUSSION
Amorphous Cu75Hf20Dy05 was produced by meltspinning as verified by both XRD and TEM diffraction.The amorphous melt-spun ribbon was shown to devit-rify to a single-crystalline phase of structure typeCu51Hf14. The two Cu75Hf20Dy05 alloy conditions,amorphous and crystalline, were then compared usinga variety of electrochemical techniques to explore theeffect of the structure change, from disordered amor-phous to ordered crystalline, on the corrosion propertiesin HF solution in a situation where neither material waspassive.
The cyclic polarization behavior indicates, and thepotentiostatic polarization results substantiate, that Hfundergoes preferential dissolution from the Cu75Hf20-Dy05 matrix at potentials below the Cu OCP. Dy is fullypassive over the measured potentials (Figure 5) and isthermodynamically likely to form a DyF3 species at aslightly less acidic pH than in the bulk 0.1 M HFsolution. A postcorrosion SEM analysis by EDS found
surface particles consisting of Dy and F. The cyclicpolarization of Cu in 1 M HF solution (Figure 4) showslimited Cu passivation brought about by a salt film atanodic potentials. Similar behavior is observed inamorphous and crystalline Cu75Hf20Dy05, although ata suppressed potential.The limiting current density of Hf dissolution deter-
mined by the polarization scans is much lower than itstheoretical ideal mass transport limited current density.In 0.1 M HF solution, the limited current density is0.01 A/cm2, whereas in 1 M HF solution it is higher at0.1 A/cm2 and is considerably less stable undergoingcurrent transients. The current instability gives evidencefor a current that is limited by a dissolving film, likelyHfF4, instead of more typical mass transport limitingcurrent density. In the 1 M HF solution, the concen-tration of HF species in solution is a factor of five timeshigher than in 0.1 M HF solution. According to the Hfoxidation reaction shown in Eq. [1], an increase in HFconcentration would increase the rate of the reaction.One plausible corrosion mechanism limiting the Hfdissolution rate would be Hf oxidization to the HfF4
phase, which likely has only limited solubility. Thedissolution of this film is then the rate-limiting mecha-nism. The optical micrographs after the cyclic polariza-tion measurements of the pure polycrystalline Hfspecimen, not shown in this manuscript, support thisview and show evidence of a pitting-like corrosionmechanism. It is unclear what the effect of structurewould be on this process.
A. The Effect of the Amorphous Structure on Dissolution
The dissolution of an atom from a surface involvesthe cleaving of bonds, and in this case, the removal ofthe Hf atoms from its neighboring atoms. In anamorphous structure, there exists a distribution ofnearest-neighbor atoms and likely a correspondingdistribution of binding energies of Hf atoms. In con-trast, a periodic arrangement of atoms leads to discretebinding energies of Hf atoms in a crystalline structure.The schematic in Figure 21 shows the frequency ofHf-Hf first-nearest-neighbor interatomic distances in thecrystalline alloy. The bond distance in the amorphouscases is represented by a distribution of nearest-neighborinteratomic distances. Regions comparatively rich in Hf(i.e., where the Hf-Hf distance is shorter than expectedin the crystalline case) are more prone to dissolutionbecause of the prevalence of Hf atoms. These regionswould include a higher density of weaker bonds andwould be more likely to dissolve. A decreased density ofstronger bonds such as atoms surrounded mostly by Cuand Dy would be less likely to dissolve under theseelectrochemical conditions. In an amorphous disorderedsolid solution, the bond types and the associatedenergies for each Hf atom will be less uniform than ina crystalline alloy with the same composition. Therefore,local regions should exist where dissolution of Hf shouldbe increased in the amorphous alloy compared with thecrystalline structure.This behavior is observed during the dissolution of
both Cu and Hf during polarization at potentials above
Fig. 19—Dealloyed layer thickness as a function of the total anodiccharge accumulated during potentiostatic polarization at –0.15 VSCE
in 0.1 M HF solution for amorphous (Fig. 13) and crystalline(Fig. 14) Cu75Hf20Dy05. The dealloyed layer thickness is measuredby ex situ cross-section SEM images of the dealloyed layer. Theaverage dealloyed layer thickness is marked, whereas the error barsindicate the minimum and maximum measured values. The linear fitof the data has a slope of 2.04 lm/(C/cm2) and a correlation coeffi-cient of 0.9946.
2716—VOLUME 43A, AUGUST 2012 METALLURGICAL AND MATERIALS TRANSACTIONS A
the Cu OCP. In this potential range, both Cu and Hfdissolution is observed, but the Cu dissolution rate issubstantially higher than Hf dissolution. Dy over thispotential range is a beneficial passivating alloyingaddition. Both the amorphous and crystalline specimensin the cyclic polarization measurements show an activenose followed by film formation and transient events athigher potentials.
During the early cycles of the CV experiment atpotentials of approximately 200 mVSCE (Figure 8), theamorphous and crystalline specimens both show anactive current nose before the current decreases to lowerbut still active currents. The amorphous specimen has
more numerous and larger, in terms of charge density,transient current spikes after the current nose than thecrystalline alloy. The current transients in the amor-phous alloy corresponded to surface dissolution ofapproximately 6 to 12 monolayers assuming the disso-lution occurred over the entire surface. It is more likelythat smaller regions experience a spike in dissolutioncurrent resulting in dissolution locally in excess of the 12monolayers.The dissolution of Cu-rich regions, which are lean in
passivating Dy atoms and dissolution rate moderatingHf atoms (because of their slower dissolution rate),would result in spikes of current as these regions are
Fig. 20—EDS line profiles through the two dealloyed regions of the amorphous Cu75Hf20Dy05 ribbon potentiostatically polarized at –0.15 VSCE
in 0.1 M HF solution (point f – 6.05 C/cm2 and 20 ks). The indicated direction, left to right, on the SEM micrographs is followed in the EDScomposition plots. Dashed lines indicate the composition of the parent ribbon established by area scans on the cross section of the middle re-gion: Cu 73.4 at. pct, Hf 20.7 at. pct, and Dy 6.0 at. pct. The EDS spectra of dealloyed regions of crystalline specimen c, not shown here, indi-cate enriched concentrations of Cu and Dy at 81.1 and 7.6 at. pct respectively, whereas the Hf concentration is 0.7 at. pct. (Color figure online).
METALLURGICAL AND MATERIALS TRANSACTIONS A VOLUME 43A, AUGUST 2012—2717
revealed during dissolution. In the crystalline alloy, thebeneficial elements are periodically and regularly dis-tributed, and the solute lean regions do not exist. Thefact that the overall current was lower for the crystallinestructure compared with the amorphous solid solutionalloy can be explained by similar arguments.
B. Dealloying Mechanism: The Role of Surface Diffusion
Dealloying to form nanoporous structures is typicallycontrolled by diffusion processes.[32] In a binary solutionof more noble, MN, and less noble, LN, atoms, as thesurface LN atoms dissolve the surface reorganizes viasurface diffusion to islands of the equilibrium MNstructure. Meanwhile, bulk diffusion of LN atoms fromthe matrix to the dealloyed layer interface also occurs.Typically, under standard temperature and pressureconditions, dealloying is controlled by the rate of surfacediffusion of the MN atoms during island formation asbulk diffusion is typically much too slow to be adominant factor.[33] Furthermore, it is unlikely that theHf bulk diffusion rates would be increased in theamorphous structure. The influence of minor alloyingelements on the surface diffusion has been shown tohave a measurable effect on porosity formation duringdealloying.[21]
In the Cu75Hf20Dy05-HF solution system, Hf isdissolved preferentially. As dissolution of the LN Hfatoms occurs, the MN Cu atoms reorganize to theequilibrium fcc structure (Figures 13 and 14). It is likelyunder these conditions that bulk diffusion is not asignificant factor. Indeed, EDS spectra of the dealloyedlayer cross sections did not indicate a gradient in Hfconcentration (Figure 20). As the surface reorganizes tofcc Cu, porosity develops in the dealloyed layer enablingsolution penetration through the dealloyed layer thick-ness to the dealloyed layer–matrix interface. It is likely
that this process is controlled by the surface diffusion ofthe Cu atoms and the mechanistic reasoning underlyingthe difference in behavior of the crystalline structurecompared with the amorphous solid-solution structurelies in the difference between the surface diffusion ratesof the two alloys. The resulting morphology indicatesthat the pore size is larger and distributed moreuniformly in the case of the amorphous solid-solutioninitial structure and that the dealloying process occursmore quickly.The preferential dissolution can be divided into three
stages: initial dealloying, surface reorganization of theMN atoms to form fcc Cu, and propagation of thedealloying front through the thickness of the parentribbon. In each stage, the effect of the structuraldifference between the amorphous solid-solution alloyand the crystalline alloy will be discussed.As the Hf atoms dissolve from the matrix, Cu and Dy
are enriched, the Cu atoms reorganize into fcc Cu, andthe volume reduction leads to porosity. The formation ofthe MN Cu equilibrium structure requires surfacediffusion of the Cu atoms. It is reasonable to concludethat surface diffusion is faster on the amorphous com-pared to the crystalline matrix. Several experimentalobservations substantiate this claim. The regular spacingof larger pores developed in the amorphous solid-solution alloy during dealloying (Figure 15) indicatesthat an equilibrium distribution is achieved more easilyin the amorphous structure than in the crystallinestructure. The larger pore size enhances solution pene-tration through the porosity, which increases the disso-lution rate of Hf from the matrix. However, there is noevidence of the pore size increasing during the exposuretime in the crystalline alloy, which should happen if auniform distribution of larger pores provides a lowenergy state. Thus, some feature of the crystallinestructure is impeding the surface diffusion of Cu atoms.Likely the effect of the more regular spacing of the Dyatoms in the crystalline structure (substituted on Hflattice sites in the Cu51Hf14 structure) leads to impedi-ments to surface diffusion of Cu. There is nil Dysolubility in Cu.[33] However, there is no indication ofsecondary phases in the XRD, although that is notunexpected because of the large X-ray interactionvolume.The surface diffusion of adatoms on amorphous
alloys has been studied on amorphous silicon becauseof its use in microelectronic and catalytic functions.[34,35]
The surface defects on crystalline surfaces have charac-teristic and distinct activation energy for surface diffu-sion because steps, kinks, or islands require differentactivation energies.[36] The surface diffusion of amor-phous Si was analyzed theoretically by assuming abroad range of effective activation. This resulted inresulting in increased short-range surface diffusion in theamorphous state.[37] A continuum activation energymodel was also used to describe the formation of mobileSi species[35] (see schematic illustration in Figure 22).Simulations of the diffusion mechanism in amorphous Sishow many atoms diffusing a comparatively shortdistance, 2 to 3 pm, at shorter time scales comparedwith crystalline diffusion.[38] The amorphous Si results,
0.00 0.25 0.50 0.75 1.000.0
0.2
0.4
0.6
0.8
1.0 Crystalline Normal Distribution
Nor
mal
ized
Fre
quen
cy o
f N
eare
st N
eigh
bor
Hf
Ato
m D
ista
nces
Distance (nm)
Fig. 21—Schematic illustration of the discrete Hf-Hf nearest-neigh-bor distance in the crystalline state compared with a normal distri-bution used to represent the continuum of nearest-neighbor distancesin the amorphous state. In the crystalline case, the distances are nor-malized according to frequency that they occur within the crystallinestructure. The mean of the normal distribution is the weighted aver-age of the crystalline case and the standard deviation was assumedto be 0.125 nm.
2718—VOLUME 43A, AUGUST 2012 METALLURGICAL AND MATERIALS TRANSACTIONS A
despite being covalently bonded, provide a compellingargument that amorphous surface diffusion is funda-mentally different than on crystalline surfaces. In thepresent context, surface diffusion consisting of largenumbers of MN atoms moving short distances couldexpedite the dissolution of the LN Hf atoms by exposingHf atoms leading to their dissolution in the case of theamorphous solid-solution structure.
An alternative interpretation is that the periodicatomic structure in crystalline alloys is inherently lesssusceptible to Hf dissolution compared to the amor-phous alloy because of its periodic arrangement of MNatoms that inhibit dissolution at key periodic sites. Ifthat were true, then the EDS analysis of the dealloyedcrystalline alloy would indicate increased Hf concentra-tions in the crystalline dealloyed region (relative to theamorphous dealloyed region). It is more likely that thiseffect plays a role in the initial dissolution of the alloy,but surface diffusion of the Cu atoms is the dominanteffect at longer times.
V. CONCLUSIONS
Preferential Hf dissolution, HER, and concurrent Cuand Hf dissolution in the active state have been com-pared and contrasted in the amorphous and crystallinestates. For both amorphous and crystalline Cu75Hf20-Dy05 corroded in HF solution, hafnium dissolves pref-erentially under polarization conditions below the Cuoxidation potential, and the dealloyed region reorganizesto form fcc Cu. This process occurs much more slowlyand the pores are less uniform with a smaller diameter inthe case of the crystalline structure. The increase in thedealloying rate in the amorphous state suggests thatdissolution of Hf occurs more easily from the amorphoussolid-solution alloy of the same composition. Anincrease in the surface diffusion rate of Cu on theamorphous solid-solution alloy is likely a key aspect that
enables Hf dissolution and Cu reorganization. Theresulting increased solution penetration via channelsand weakening of the atomic bonding of the Hf atoms atthe dissolution front are also speculated to play a role.At higher potentials, Cu also dissolves from the
matrix. In this case, the amorphous alloy sustainedhigher current and an increase in current transients.These results indicate that the crystalline structure slowsthe dissolution rate of Cu from the matrix. The possiblemechanistic causes of this behavior include regularspacing of beneficial solute elements that moderatedissolution (Hf) or are passivating (Dy).
ACKNOWLEDGMENTS
This work was supported by grants DMR-0504983and DMR-0906663 from the National Science Foun-dation (Dr. Alan J. Ardell, contract monitor). Profs.John H. Perepezko, Gary J. Shiflet, and S. JosephPoon are thanked for help with materials fabricationand helpful discussions.
REFERENCES1. P. Campestrini, E.P.M. van Westing, H.W. van Rooijen, and
J.H.W. de Wit: Corrosion Sci., 2000, vol. 42, pp. 1853–61.2. G.O. Ilevbare, O. Schneider, R.G. Kelly, and J.R. Scully: J.
Electrochem. Soc., 2004, vol. 151, pp. B453–64.3. D.E. Williams, T.F. Mohiuddin, and Y.Y. Zhu: J. Electrochem.
Soc., 1998, vol. 145, pp. 2664–72.4. J.R. Scully and A.M. Lucente: ASM Handbook, vol. 13B, ASM
International, Materials Park, OH, 2005.5. R. Huang, D.J. Horton, F. Bocher, and J.R. Scully: Corrosion,
2010, vol. 66, pp. 642–49.6. J.R. Scully, A. Gebert, and J.H. Payer: J. Mater. Res., 2007,
vol. 22, pp. 302–13.7. T. Aburada, N. Unlu, J.M. Fitz-Gerald, G.J. Shiflet, and J.R.
Scully: Scripta Mater., 2008, vol. 58, pp. 623–26.8. K. Hashimoto, K. Osada, T. Masumoto, and S. Shimodaira:
Corrosion Sci., 1976, vol. 16, pp. 71–76.9. D. Huerta and K.E. Heusler: J. Non-Cryst. Solids, 1983, vol. 56,
pp. 261–66.10. M. Naka, K. Hashimoto, and T. Masumoto: J. Non-Cryst. Solids,
1978, vol. 30, pp. 29–36.11. M. Naka, K. Hashimoto, and T. Masumoto: Corrosion, 1980,
vol. 36, pp. 679–86.12. H.S. Tong: Corrosion, 1985, vol. 41, pp. 10–12.13. J.C. Turn andR.M.Latanision:Corrosion, 1983, vol. 39, pp. 271–79.14. Z.M. Wang, J. Zhang, X.C. Chang, W.L. Hou, and J.Q. Wang:
Corrosion Sci., 2010, vol. 52, pp. 1342–50.15. B.W. Parks, J.D. Fritz, and H.W. Pickering: Scripta Metall., 1989,
vol. 23, pp. 951–56.16. F.U. Renner, A. Stierle, H. Dosch, D.M. Kolb, T.L. Lee, and J.
Zegenhagen: Phys. Rev. B, 2008, vol. 77, p. 5433.17. Y. Ding, M.W. Chen, and J. Erlebacher: J. Am. Chem. Soc., 2004,
vol. 126, pp. 6876–77.18. S. Koh and P. Strasser: J. Am. Chem. Soc., 2007, vol. 129,
p. 12624.19. M. Hakamada and M. Mabuchi: J. Alloys Compd., 2009, vol. 485,
pp. 583–87.20. J.R. Hayes, A.M. Hodge, J. Biener, A.V. Hamza, and K.
Sieradzki: J. Mater. Res., 2006, vol. 21, pp. 2611–16.21. T. Aburada, J.M. Fitz-Gerald, and J.R. Scully: Corrosion Sci.,
2011, vol. 53, pp. 1627–32.22. H. Abe, K. Sato, H. Nishikawa, T. Takemoto, M. Fukuhara, and
A. Inoue: Metall. Trans., 2009, vol. 50, pp. 1255–58.
Terrace
Amorphous
Crystalline Amorphous
Num
ber
of A
vaila
ble
Site
s
Activation Energy per Atom
Kink
Ledge
Fig. 22—Schematic illustration of the differences in the distribu-tion of the activation energy for surface diffusion in the crystallineand amorphous states. Schematic constructed following Llera-Hurlburt.[35]
METALLURGICAL AND MATERIALS TRANSACTIONS A VOLUME 43A, AUGUST 2012—2719
23. W.J. James, J.W. Johnson, and M.E. Straumanis: Corrosion Sci.,1963, vol. 3, pp. 273–79.
24. B.D. Craig: Handbook of Corrosion Data, 2nd ed., Materials DataSeries. ASM International, 1995, Materials Park, OH, p. 998.
25. CRC Handbook of Chemistry and Physics, CRC Press, BocaRaton, FL, 1999.
26. I. Puigdomenech: MEDUSA: Make Equilibrium Diagrams UsingSophisticated Algorithms, Royal Institute of Technology; Stock-holm, Sweden, 2009. http://www.kemi.kth.se/medusa/.
27. W.J. James, W.G. Custead, and M.E. Straumanis: Corrosion Sci.,1962, vol. 2, pp. 237–54.
28. C.E.F. Rickard and T.N. Waters: J. Inorg. Nucl. Chem., 1964,vol. 26, pp. 925–30.
29. J.P. Gabathuler, P. White, and E. Parthe: Acta Cryst. SectionB-Struct. Sci., 1975, vol. 31B, pp. 608–10.
30. H. Okamoto: J. Phase Equilib. Diffus., 2007, vol. 28, pp. 583–84.31. M. Pourbaix: Atlas of Electrochemical Equilibria in Aqueous
Solutions, National Association of Corrosion Engineers, Houston,TX, 1974.
32. J. Erlebacher: J. Electrochem. Soc., 2004, vol. 151, pp. C614–26.33. P.R. Subramanian and D.E. Laughlin: Bull. Alloy Phase Dia-
grams, 1988, vol. 9, pp. 331–408.34. A.S. Dalton, D. Llera-Hurlburt, and E.G. Seebauer: Surf. Sci.,
2001, vol. 494, pp. L761–66.35. D. Llera-Hurlburt, A.S. Dalton, and E.G. Seebauer: Surf. Sci.,
2002, vol. 504, pp. 244–52.36. P. Stoltze: J. Phys.-Condens. Mat., 1994, vol. 6, pp. 9495–517.37. I. Avramov: J. Phys.-Condens. Mat., 1999, vol. 11, pp. L267–72.38. A.S. Dalton, Y.V. Kondratenko, and E.G. Seebauer: Chem. Eng.
Sci., 2010, vol. 65, pp. 2172–76.
2720—VOLUME 43A, AUGUST 2012 METALLURGICAL AND MATERIALS TRANSACTIONS A


![Contents agents, like inorganic anions (fluoride and phosphates) or ... and solubility product of amorphous and crystalline aluminium hydroxide [Ohman 1988].](https://static.documents.pub/doc/80x56/5a9995067f8b9a30358d9c00/contents-agents-like-inorganic-anions-fluoride-and-phosphates-or-and-solubility.jpg)


