NUTRITION RESEARCH, Vol. 12, pp. 583-593, 1992 0271-5317/92 $5.00 + .00 Printed in the USA. Copyright (c) 1992 Pergamon Press Ltd. All rights reserved. THE EFFECT OF VARYING DIETARY ENERGY INTAKE ON THE NITROGEN BALANCE OF YOUNG WOMEN Gloria N. Egun 1, Ph.D. and Tola Atinmo Ph.D. Department of Human Nutrition, College of Medicine, University of Ibadan, Ibadan Nigeria. ABSTRACT The effect of varying energy intakes on nitrogen balance was investigated in thirteen young women aged between 21 and 32 years. The subjects were fed a previously determined minimum requirement of protein (0.47 g/kg) at two levels of dietary energy, high energy intake at 48.4+3.70 kcal/kg bodyweight and low energy intake of 33.8+2.86 kcal/kg bodyweight (about 20% above and below the estimated energy requirement based on their energy expenditure); Nitrogen balance was determined from the nitrogen in food, urine, feces and sweat. Nitrogen balance was -8.6:1:5.44 mgN/kg with the low energy intake and increased to +10.82+6.35 mgN/kg with the high energy intake. Regression analysis, showed that all subjects maintained zero nitrogen balance with an average energy intake of 40+0.94 kcal/kg/day. Variation in energy intake also altered the net protein utilization of the habitual diet in all subjects by 1.0 to 3.5 units/kcal per kg body weight. Energy requirement was estimated on the basis of constant body weight and the nitrogen balance. Body weight was maintained constant at an energy intake of 40.8+4.21 kcal/kg body weight. Key Words: Energy Intake, Nitrogen Balance, Young Women. INTRODUCTION Protein requirement is conventionally defined as the amount of protein needed when the requirements for energy and other nutrients are fully met. Hence, most investigation have provided liberal energy intakes that usually maintained or increased the body weights of individuals in negative nitrogen balance (1-2). The sensitivity of body nitrogen metabolism to the level of adequacy of energy intake, as well as the difficulties created by this response for an'lying at reliable estimates of dietary protein requirements were demonstrated by numerous studies (3-6). They found that the dietary protein quality and N-metabolism are significantly altered by changes in energy intake in the range above as well as below estimated maintenance needs for egg protein. Nitrogen retention increased when intakes were above the requirement level. (7). The implication is that protein requirements for maintenance may be underestimated, unless there is a compensatory adjustment of protein-energy relationship. IAddress correspondence to:Department of Food Science and Technology, University of Reading, Whiteknights, Reading RG6 2AP. 583
Transcript
NUTRITION RESEARCH, Vol. 12, pp. 583-593, 1992 0271-5317/92 $5.00 + .00 Printed in the USA. Copyright (c) 1992 Pergamon Press Ltd. All rights reserved.
THE EFFECT OF VARYING DIETARY ENERGY INTAKE ON THE NITROGEN BALANCE OF YOUNG WOMEN
Gloria N. Egun 1, Ph.D. and Tola Atinmo Ph.D. Department of Human Nutrition, College of Medicine, University of Ibadan, Ibadan Nigeria.
ABSTRACT
The effect of varying energy intakes on nitrogen balance was investigated in thirteen young women aged between 21 and 32 years. The subjects were fed a previously determined minimum requirement of protein (0.47 g/kg) at two levels of dietary energy, high energy intake at 48.4+3.70 kcal/kg bodyweight and low energy intake of 33.8+2.86 kcal/kg bodyweight (about 20% above and below the estimated energy requirement based on their energy expenditure); Nitrogen balance was determined from the nitrogen in food, urine, feces and sweat. Nitrogen balance was -8.6:1:5.44 mgN/kg with the low energy intake and increased to +10.82+6.35 mgN/kg with the high energy intake. Regression analysis, showed that all subjects maintained zero nitrogen balance with an average energy intake of 40+0.94 kcal/kg/day.
Variation in energy intake also altered the net protein utilization of the habitual diet in all subjects by 1.0 to 3.5 units/kcal per kg body weight. Energy requirement was estimated on the basis of constant body weight and the nitrogen balance. Body weight was maintained constant at an energy intake of 40.8+4.21 kcal/kg body weight.
Key Words: Energy Intake, Nitrogen Balance, Young Women.
INTRODUCTION
Protein requirement is conventionally defined as the amount of protein needed when the requirements for energy and other nutrients are fully met. Hence, most investigation have provided liberal energy intakes that usually maintained or increased the body weights of individuals in negative nitrogen balance (1-2).
The sensitivity of body nitrogen metabolism to the level of adequacy of energy intake, as well as the difficulties created by this response for an'lying at reliable estimates of dietary protein requirements were demonstrated by numerous studies (3-6). They found that the dietary protein quality and N-metabolism are significantly altered by changes in energy intake in the range above as well as below estimated maintenance needs for egg protein. Nitrogen retention increased when intakes were above the requirement level. (7).
The implication is that protein requirements for maintenance may be underestimated, unless there is a compensatory adjustment of protein-energy relationship.
IAddress correspondence to:Department of Food Science and Technology, University of Reading, Whiteknights, Reading RG6 2AP.
583
584 G. EGUN and T. ATINMO
The estimation of individual energy requirements is a very complex problem (8-9). Difficulties arise in attempting to measure small changes in body composition and individuals may alter their physical activities in response to alterations in energy intake. Therefore weight changes with energy intake alone is not sensitive enough to determine energy requirement. However, some workers consider that nitrogen balance is probably the most sensitive index of whether or not energy requirement is met. The main aim of our investigation is to a) determine the effect of varying energy intake on N-balance and b) estimate the energy requirement from the N-balance data of young Nigerian women, thus providing a data base for energy requirement of young women in Nigeria and Africa as a whole. Information is limited on protein and energy requirements for Africa and women in particular in the FAO/WHO/UNU technical report (10).
METHODS
Subjects Thirteen female students of the University of Ibadan who were free of any
abnormality detectable by careful medical history, physical examination, blood analysis and urine analysis participated in the nitrogen balance study. The ages of the subjects ranged between 21 and 32 years. Their characteristics are shown in Table 1. All subjects continued with their normal daily routines, which included their full academic schedule, but refrained from any unusual physical activity. To minimize potential sources of error, subjects were interviewed dally concerning their physical activities and they maintained a diary-record of all their activities. All subjects were studied closely and lived in the female halls of residence. They were made to understand that strict adherence to experimental diets was very important.
Dietary protocol The nitrogen balance study was made up of two dietary periods of ten days during
which two levels of energy intakes were provided. Protein intake was maintained throughout the study at a level of 0.47g protein/kg body weight which was the level predetermined as the minimum protein requirement from the previous phase of the study. The levels of energy fed were 33.8+2.86 kcal/kg and 48.4_+3.70 kcal/kg body weight providing approximately 20% below and above the amount judged to be sufficient to meet the subjects requirements respectively. This was estimated from a carefully monitored daily activity pattern diary of the subjects before commencement of the study. The average estimated energy requirement was 40.2 kcal/kg. The composition of the diet which was standardized based on local foods habitually consumed is shown in Table 2.
All subjects were tested on the low energy intake followed by the high energy intake. An essentially protein free diet (11) was given on the first day of each experimental dietary level, so as to promote rapid adaptation to the diet. A three-day break period with free-choice diet separated the two experimental periods. The metabolic collection period was scheduled from the 6th to the 10th day of each experimental period. Meals were served in a pattern the subjects were accustomed to, between 8-10 am for breakfast, 1-2 pm for lunch and 6-8 pm for dinner and eaten under supervision.
ENERGY INTAKE AND N-BALANCE
Table 1
Subject Characteristics
585
Subject Age (yrs) BMI (kg/m 2) Body surface* BMR (kcal/kg) t area (m 2)
E l 24 16.7 1.35 27.1
E 2 28 20.5 1.43 25.0
E 3 24 18.9 1.57 24.3
E 4 25 21.0 1.48 24.4
E s 26 19.3 1.48 25.0
E~ 28 21.8 1.42 28.8
E 7 26 22.6 1.50 24.0
Es 21 20.6 1.52 24.2
E 9 30 18.8 1.57 24.2
Elo 25 23.1 1.53 23.6
Ell 32 21.0 1.62 23.4
El2 25 24.4 1.65 22.6
E13 27 22.4 1.74 22.5
MEAN 26.2 20.9 1,53 24.5
SD 2.7 2.08 0.10 1.73
* Estimated from body monogram (Weir JB de V, 1949. J Physio 109, 1). J BMR (Basal metabolic rate) Calculated from equation: BMR = 14.7W + 4.96 kcal/day where
W = body weight in kg.
Samples and Measurements: Anthropometric measurements of weight, skinfold thickness of biceps, triceps,
subscapular and suprailiac regions were taken at the start and end of each dietary period. Complete 24 hour urine collections were made daily throughout the study with 1NHC1
as preservative. Fecal samples were pooled on a five-day basis with the aid of carmine as indicator. Samples of food were collected daily in plastic bags. Total nitrogen in urine, feces and food samples were analyzed by the micro kjedahl method of Munro and Fleck (12). Urinary creatinine was determined by the modification of Jaffe reaction (13) while urinary urea nitrogen was estimated by the modification of Wybenga et al (14). Completeness of the urine collection was judged by the creatinine estimation.
Venous blood samples were drawn before breakfast from the antecubital loss at the start and end of each dietary level for various haematological and biochemical analyses.
Nitrogen balance was calculated from the intake, fecal and urine nitrogen values, and
586 G. EGUN and T. ATINMO
an additional 8.15 mgN/kg/day was allowed for integumental and miscellaneous losses. These losses have been pre-determined in em'lier studies (15).
Statistical Analysis The paired t-test was used to compare values between the high and low energy
intakes. A 5% confidence level was chosen as significant. Regression equations were used to test associations between energy intake and nitrogen balance.
Table 2
Ingredients and Nutrients of a Habitual Nigerian Diet
Ingredients Amount (g)
Bread 90
Refined Cane Sugar 15
Margarine
Pepper (dried) 4
Tomatoes (fresh) 80
Onion (fresh) 40
Pahnoil 53
Cassava (grated) 100
Beef 40
Vegetables 10
Rice (cooked) 300
*Orange flavoured drinks (bottles) (1)
Nutrients: protein (g) 24.93 calories (kcal) 1706.71
Adjustment in calorie for the high energy diet was with 30g margarine, 15g additional sugar, 1 pack of Caloreen (400 kcal) and one additional orange flavoured drink to give a total of 2505.71 kcal. * provides 120 kcal/bottle
RESULTS
Body Weight and Anthropometric Chan~es Weight changes for each diet period are summarized in Table 3. A mean fall of
2.6+1.37% in body weight was observed with the low energy period. The fall in body weight was significant (P<0.05). All subjects except one (E4) lost weight with the low energy intake ranging from 0.5-3.0 kg with a mean value of 1.38_+0.82 kg (138 kg/day).
ENERGY INTAKE AND N-BALANCE 587
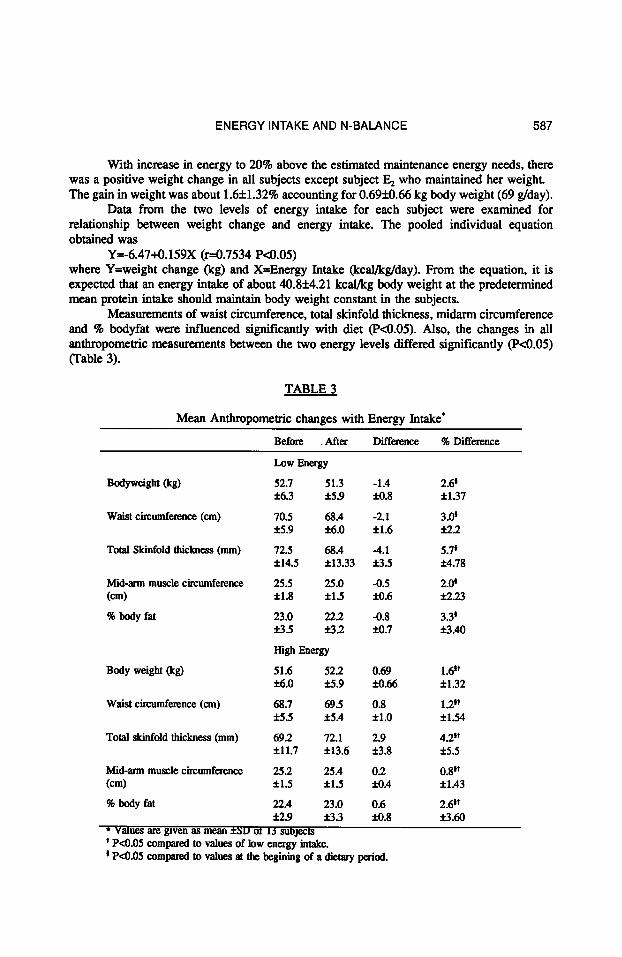
With increase in energy to 20% above the estimated maintenance energy needs, there was a positive weight change in all subjects except subjeet E2 who maintained her weight. The gain in weight was about 1.64-1.32% accounting for 0.694.0.66 kg body weight (69 g/day).
Data from the two levels of energy intake for each subject were examined for relationship between weight change and energy intake. The pooled individual equation obtained was
Y=-6.47+0.159X (r--0.7534 P<0.05) where Yffiweight change (kg) and X=Energy Intake (kcal/kg/day). From the equation, it is expected that an energy intake of about 40.84-4.21 kcal/kg body weight at the predetermined mean protein intake should maintain body weight constant in the subjects.
Measurements of waist circumference, total skinfold thickness, midarm circumference and % bodyfat were inf luenced significantly with diet (P<0.05). Also, the changes in all anthropometric measurements between the two energy levels differed significantly (P<0.05) (Table 3).
T A B L E 3
Mean Anthropometric changes with Energy Intake*
Before ~ After Difference % Difference
Bodyweight (kg)
Waist circumference (cm)
Total Skinfold lhickness (ram)
Mid-a~n muscle circumference (cm)
% body fat
Body weight (kg)
Waist circumference (cm)
Total skinfold thickness (mm)
Mid-m-m muscle circumference 25.2 (cm) •
% body fat 22.4 J:2.9
* Values are given as mean • o t l ~ suoJects
Low Energy
52.7 51.3 -1.4 2.0 +6.3 +5.9 i-0.8 +1.37
70.5 68.4 -2.1 3.0 ! +5.9 i'6.0 +1.6 +2.2
72.5 68.4 -4.1 5.7 i +14.5 +13.33 +3.5 +4.78
25.5 25.0 -0.5 2.0 ~ +1.8 +1.5 i-0.6 +2.23
23.0 22.2 -0.8 3.3 ! +3.5 +3.2 :~0.7 +3.40
High Energy
51.6 52.2 0.69 1.6 v i'6.0 :1:5.9 ~0.66 +1.32
68.7 69.5 0.8 1.2 t* +5.5 +5.4 +1.0 +1.54
69.2 72.1 2.9 4.2 v +11.7 +13.6 +3.8 +5.5
25.4 0.2 0.8 j* +1.5 • +1.43
23.0 0.6 2.6 l* +3.3 ~-0.8 +3.6O
t P<0.05 compared to values of low energy intake. * P<0.05 compared to values at the begining of a dietary period.
5 8 8 G. EGUN and T. ATINMO
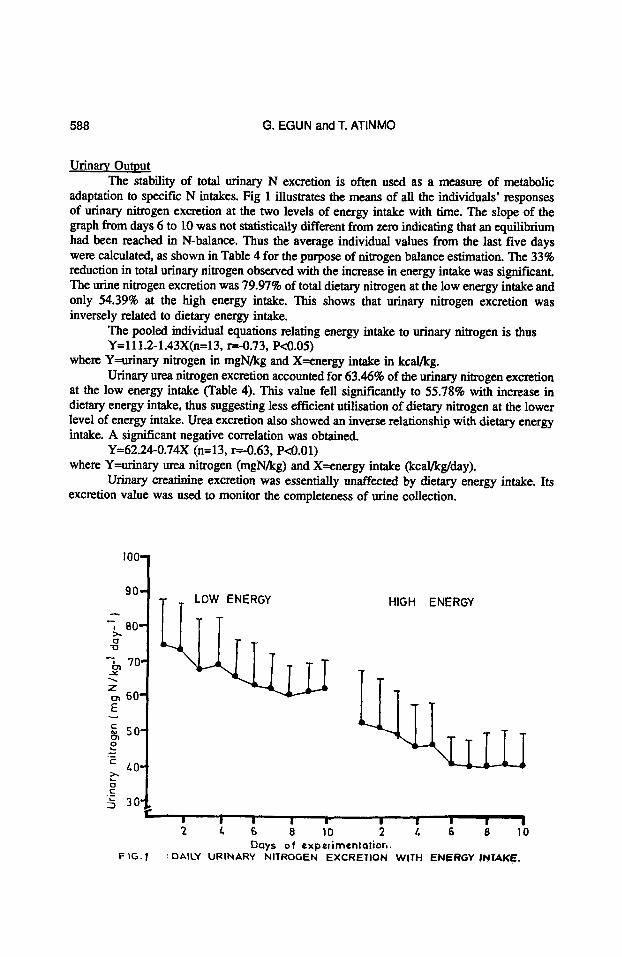
Urinary Output The stability of total urinary N excretion is often used as a measure of metabolic
adaptation to specific N intakes. Fig 1 illustrates the means of all the individuals' responses of urinary nitrogen excretion at the two levels of energy intake with time. The slope of the graph from days 6 to 10 was not statistically different from zero indicating that an equilibrium had been reached in N-balance. Thus the average individual values from the last five days were calculated, as shown in Table 4 for the purpose of nitrogen balance estimation. The 33% reduction in total urinary nitrogen observed with the increase in energy intake was significant. The urine nitrogen excretion was 79.97% of total dietary nitrogen at the low energy intake and only 54.39% at the high energy intake. This shows that urinary nitrogen excretion was inversely related to dietary energy intake.
The pooled individual equations relating energy intake to urinary nitrogen is thus Y=I 11.2-1.43X(n=13, r-~0.73, P<0.05)
where Y--urinary nitrogen in mgN/kg and X-=energy intake in kcal/kg. Urinary urea nitrogen excretion accounted for 63.46% of the urinary nitrogen excretion
at the low energy intake (Table 4). This value fell significantly to 55.78% with increase in dietary energy intake, thus suggesting less efficient utilisation of dietary nitrogen at the lower level of energy intake. Urea excretion also showed an inverse relationship with dietary energy intake. A significant negative correlation was obtained.
Y=62.24-0.74X (n=13, r=-0.63, P<0.01) where Y=urinary urea nitrogen (mgN/kg) and X=energy intake (keal/kg/day).
Urinary ereatinine excretion was essentially unaffected by dietary energy intake. Its excretion value was used to monitor the completeness of urine collection.
IO0-
90-
, 80-- >,,
" i 70" CTI
z 60-
E
50- o i
.~_
c 40-
c
30"
F~G.I
HIGH ENERGY
r " ' i ' ' k ' i ' ' i 7. /~ & 8 10 2 /. 6 8 10
Days of experJmenlo l ion. :DALLY URINARY NITROGEN EXCRETION WITH ENERGY iNTAKE.
ENERGY INTAKE AND N-BALANCE 589
Fecal Nitrogen Output There was no significant effect of dietary energy on fecal nitrogen excretion. The
overall mean values of 16.2+3.06 and 16.4+3.11 mgN/kg observed for the low and high energy intakes respectively were not different (P>0.05). Thus indicating that equal amount of nitrogen was absorbed at both levels of energy intake, since dietary protein (nitrogen) was kept constant (Table 4). The estimated apparent digestibility did not show any significant difference with energy intake.
Table 4
Mean Data on Energy and Nitrogen Intake, Urinary and Fecal Nitrogen, Urea Nitrogen Excretion and Apparent Nitrogen Digestibility.
Energy N intake Total Urinary % Urea Fecal N Apparent intake mgN/kg/d urinary N urea N N in total mgN/kg/d digestibility
Figures in parenthesis are + standard deviation of 13 subjects. * Comparison with paired t-test between levels of intake is significant at P<0.05 * Comparison with paired t-test between levels of intake is not significant at P>0.05
Nitrogen Balance and Energy Intake Table 5 shows the individual daily nitrogen balance data with the low and high energy
intake. Nitrogen balance was -8.63+5.44 mgN/kg/day with the low energy intake. When energy intake was increased to 48.4 kcal/kg/day which was about 43% increase, nitrogen balance was positive in all the subjects and the group mean was +10.82+6.35. The difference in nitrogen balance with increase in energy intake was significant (P<0.05).
Individual equations relating energy intake to nitrogen balance was given as Y=-53.8+l.34X (r=0.953, P,0.0I)
where Y=nitrogen balance (mgN/kg/day) and X=energy intake (kcal/kg/day). The subjects studied required 39 to 42 kcal/kg body weight of energy intake to achieve
N-balance at the level of N intake investigated. The average energy requirement was estimated at 40.3+1.41 kcal/kg/day. Balance was observed to improve by 134+34.8 mgN/100kcal of energy intake.
Nitrogen Utilization and Energy Intake. The net protein utilization (NPU) and biological value (BV) were significantly affected
by the change in energy intake. The NPU and BV were calculated by the conventional method using total obligatory nitrogen losses as 40.0 mgN/kg/day which was estimated earlier (16).
BV of the diet at the low energy intake was 37.6 and this improved significantly to 64.7 with increase in energy intake. This indicated that increase in energy intake improved the nitrogen retention. The increase is about 71.5% (Table 6).
590 G. EGUN and 1". ATINMO
Table 5
Individual Daily Nitrogen Data with Energy Intake of Young Nigerian Women.
Subject Energy intake N imake Urinary N Fecal N Total N loss" N balance
kcal/kg]d mgN/kg]d
LOW ENERGY
E l 40.5 102.3 73.4 17.6 99.2 +3.10
E z 36.3 81.9 69.8 11.7 89.7 -7.80
E 3 34.1 79.8 56.9 21.2 86.3 -6.5
E 4 33.8 79.0 61.0 17.3 86.5 -7.5
E s 36.3 84.8 69.4 13.8 91.4 -6.6
F~ 34.8 81.4 68.2 13.8 90.2 -8.8
F_, 7 32,8 76.7 58.5 17.5 84.2 -7.5
Ea 34,1 79,8 59.8 19.1 87.2 -7.3
F~ 32.5 76.0 64.3 12.8 85.3 -9.3
E~o 32.8 76.7 63.6 12.2 83.9 -7.2
E n 31.3 73.2 57.8 17.4 83.4 -10.2
E~2 30.0 65.4 55.4 17.6 81.2 -15.8
E~3 29.2 63.8 56.8 19.6 84.6 -20.8
MEAN 33.8 78.8 62.7 16.3 87.2 -8.63
SD 2.86 0.14 5.9 3.06 4.65 5.44
HIGH ENERGY
E l 55.3 97.3 45.3 16.1 69.6 27.2
F a 53.3 84.9 52.7 13.0 73.9 11.0
F~ 49.1 78.2 36.2 23.7 68.12 10.2
E 4 49.8 79.3 43.7 15.8 67.7 11.7
E~ 51.1 81.4 46.3 13A 67.9 13.6
E~ 50.1 79.8 36.4 17.4 62.0 17.8
E 7 47.7 76.0 40.3 17.1 66.1 9.9
F~ 48.7 77.5 40.0 18.7 66.9 10.6
F_ 9 47.1 76.0 45.6 15.5 69.3 6.7
Eio 46.7 74.3 45.5 13.4 67.1 7.2
E , 45.6 72.5 40.5 20.5 69.2 3.3
Ej~ 42,4 64.3 36.2 14.7 59.1 5.2
E~3 41.7 63.3 35.3 14.1 57.6 5.7
M E A N 48.4 77.3 41.9 t 16.46 66.5 t 10.82 t
SD 3.70 8.58 5.17 3.11 5.05 6.35
" Total nitrogen loss includes miscellaneous nitrogen loss taken as 8.15mgN/kg/day t Significant difference from low energy intake (P<0.05) i No significant difference between levels of energy intake (P>0.05)
ENERGY INTAKE AND N-BALANCE 591
Table 6
Calculated Biological Value (BV), Net Protein Utilization (NPU) and True and Apparent Digestibility of the Diet at Two Levels of Energy Intake.
Values are mean +SD (n=13) ~ Significantly different from the low energy intake (P<0.01) t No significant difference between levels of intake (P>0.05)
However, both apparent and true digestibilities of the diet were not affected by the energy levels.
Individual equations (pooled) relating average net protein utilization (NPU) values to calorie intake is thus:
Y=-24.09+18.05X (r=0.79, P<0.01) where Y=NPU and X is energy intake (kcal/kg/day).
The NPU of the diet improved by 1.8 for every one kcal/kg change in energy intake.
DISCUSSION
In our study we observed a considerable influence of energy intake on body weight. There was a total change of about 69g per day in body weight throughout the course of the experiment from the low energy intake to the high energy intake. The energy intake required to maintain body weight with 0.47g protein/kg body weight of the habitual diet was determined at 40.8 kcal/kg/day, a figure that is slightly higher than the recommendation of the FAO/WHO (16) and latest FAO/WHO/UNU (10) for young women which is about 38 kcal/kg/day.
The fail observed in urinary nitrogen excretion with increase in energy intake in our study was accounted for as a reduction in urea nitrogen excretion. Urea nitrogen accounted for 56% of total urinary nitrogen when the diet contained 3.9% protein energy which was at the high energy level. This value increased to 63.5% when dietary protein was providing 5.85% of the total energy thus suggesting less efficient utilization of dietary nitrogen at the lower level of energy intake. Also Inoue et al (4) have shown that the administration of a low protein diet with a maintenance level or an excess of energy, resulted in a rapid decrease in the rate of excretion of urinary nitrogen to a low and relatively steady state. They found the loss of nitrogen in their group on excess energy to be less.
Dietary energy intake did not have any effect on fecal nitrogen excretion, suggesting that variations between samples for a given subject simply reflect fecal overflow. Many studies have also found that fecal nitrogen output usually is unaffected by dietary nitrogen or energy (4-6). Thus differences in N-balance can be ascribed solely to differences in N- utilization in urinary N-excretion.
592 G. EGUN and T. ATINMO
From the studies of Calloway (5) and Gaxza et al (6), they found that energy intake had a more profound effect on N-balance than did protein intake. Balance was altered by as much as a 15% change in energy intake as by increasing dietary protein 40%. In our study, we observed also that energy intake had a considerable effect on N-balance. The balance was improved by 1.3 mgN/kcal between the low and high energy intake. Scrimshaw et al (18) also observed an improvement of balance of 0.94 mgN/kcal/kg and 0.84 mgN/kcal/kg with gluten and lysine respectively when energy intake changed from 42 to 53 kcal/kg.
An energy intake of 40.8 kcal/kg/day was found to maintain zero nitrogen balance on the estimated protein intake (0.47g protein/kg/day) in our study.
With regards to the availability and biological value of proteins in the habitual diet consumed, our study showed that the availability of absorbed nitrogen improved as well as with excess energy intake. The increase observed in NPU and BV with increase in energy intake indicated that the absorbed nitrogen was better utilized when eaten together with excess energy.
Our data also provided an opportunity to assess the effects of calorie intake on the efficiency of protein utilization. The slope describing the relationship between NPU and energy intake (kcal/kg) was 1.8 units indicating that for the level of N-intake studied, a change of 1 kcal/kg altered values by an average of 1.8+0.62 (1.0-3.5) units. This result is comparable to the study of Garza et al (6) who observed a change of 2-4 units in NPU for egg protein with changes in 1 kcal/kg of energy intake.
This value is quite close to our value for the habitual diet, thus suggesting an almost equal effective usage of dietary nitrogen with changes in energy intake. Thus our estimated protein intake of 0.47 g/kg/day, on an average energy intake of about 40 kcal/kg/day should be adequate, for the purpose of estimating requirements.
ACKNOWLEDGEMENT
This research was made possible through the financial assistance of the United Nations University programme and University of Ibadan. The authors are grateful to the advice of Prof. D.H. Calloway and the support of the subjects.
,
2.
.
.
REFERENCES
Rose WC. Amino acid requirements of Man. Fed Proc 1949; 8: 546.
Rose WC, Wixon RL. The amino acid requirement of man XVI. The role of the nitrogen intake. J Biol Chem 1955; 217: 997-1008.
Calloway DH, Spector H. Nitrogen balance as related to caloric and protein intake in active young men. Am J Clin Nutr 1954; 2: 405-411.
Inoue C, Fujita J, Niiyama Y. Studies on protein requirements of young men fed egg protein and rice protein excess and maintenance energy intakes. J Nutr 1973; 103: 1673-1687.
ENERGY INTAKE AND N-BALANCE 593
.
.
.
.
9.
Calloway DH. Nitrogen balance of men with marginal intakes of protein and energy. J Nutr 1975; 105: 914-923.
Garza C, Scrimshaw NS, Young VR. Human protein requirement: the effects of variations in energy intake within the maintenance range. Am J Clin Nutr 1976; 29: 280-287.
Munro HN. General aspects of the regulations of protein metabolism by diet and by hormones. In Mammalian protein metabolism (eds. HN Munro and JB Allison), Academic Press, New York. 1964.
Hegsted DM. Energy needs and energy utilization. Nutr Rev 1974; 32:33-41.
Durnin JVGA, Edhol OG, Miller DS, Waterlow JC. How much food does man require? Nature 1973; 242: 418-423.
10. Energy and protein requirenaents: Report of Joint FAO/WHO/UNU Expert Consultation. WHO Tech Report Ser 1985; No 724.
12. Munro HN, Fleck A. Analysis of urine and body fluids for nitrogenous constituents. In Munro HN (ed): Mammalian protein metabolism 19:vol 3. pp 423-525.
13. Bensues RW, Tavissky HH. On the calorimetric determination of creatinine by the Jaffe reaction. J Biol Chem 1945; 158: 581-591.
14. Wybenga DR, Giorgio JD, Pileggi VJ. Manual and automated methods for urea nitrogen measurements in whole serum. Clin Chem 1971; 17: 891-895.
15. Egun GN. Protein requirement of adult Nigerian females on habitual Nigerian diet. PhD Thesis 1984. University of Ibadan, Nigeria.
16. Energy and Protein requirements: Report of a Joint FAO/WHO ad hoc Expert Committee. WHO Tech Report Ser 1973 No 522.
17. Scrimshaw NS, Taylor Y, Young VR. Lysine supplementation of wheat gluten at adequate and restricted energy intakes in young men. Am J Clin Nutr 1973; 26: 965- 972.


![Intake-Form.docxآ Web viewPROJECT INTAKE FORM [PIF] Email the completed Project Intake Form to intake@vinecrestinvestments.com.](https://static.documents.pub/doc/80x56/5e08269ea6d01c1aa7038e88/intake-formdocx-web-viewproject-intake-form-pif-email-the-completed-project.jpg)


