Page 1
THE EFFECT OF VOLUNTARY DISCLOSURE ON STOCK
MARKET RETURNS OF COMPANIES LISTED AT THE
NAIROBI SECURITIES EXCHANGE
MWITI JACQUELINE KENDI
A RESEARCH PROJECT SUBMITTED IN PARTIAL
FULFILLMENT OF THE REQUIREMENTS FOR THE AWARD
OF THE DEGREE OF MASTER OF SCIENCE IN FINANCE,
SCHOOL OF BUSINESS UNIVERSITY OF NAIROBI
NOVEMBER, 2014
Page 2
ii
DECLARATION
I, the undersigned, declare that this is my original work and has not been submitted to
any other college, institution or university other than the University of Nairobi for
academic credit.
Signed: __________________________ Date: ___________________
Jacqueline Kendi Mwiti (Reg. No. D63/68672/2013)
This research project has been submitted for examination with my approval as the
University Supervisor:-
Signed: ………………………………… Date: ……………………………
Mirie Mwangi
Lecturer, Department of Finance and Accounting.
Page 3
iii
ACKNOWLEDGEMENTS
First, I sincerely thank my parents, family, and friends, who provided the advice and
financial support. The product of this research paper would not be possible without all
of them. I also acknowledge my fellow students and lecturers at the University of
Nairobi whose wells of knowledge I drew from through the academic period, and have
made me a better professional.
I would like to express my profound gratitude and deep regard to my supervisor, Mr.
Mirie Mwangi for his exemplary guidance, valuable feedback and constant
encouragement throughout the duration of the project. His valuable suggestions were
of immense help throughout my project. His perceptive criticism kept me working to
make this project in a much better way. Working under him was an extremely
knowledgeable experience for me. I would also like to specially thank my colleagues
for their support in this project.
Page 4
iv
DEDICATION
I dedicate this work to the Almighty God and to my family; my dearest mum
Catherine Mwiti and dad Simon Mwiti as well as my siblings, for their
encouragement and support throughout my studies. A special mention to my good
friends whose input is invaluable.
Page 5
v
TABLE OF CONTENT
DECLARATION ......................................................................................... ii
ACKNOWLEDGEMENTS ....................................................................... iii
DEDICATION ............................................................................................ iv
TABLE OF CONTENT .............................................................................. v
LIST OF TABLES .................................................................................... viii
LIST OF FIGURE ...................................................................................... ix
ABBREVIATIONS ..................................................................................... x
ABSTRACT ................................................................................................ xi
CHAPTER ONE: INTRODUCTION ....................................................... 1
1.1 Background of the Study ................................................................. 1
1.1.1 Voluntary Disclosure ....................................................................... 2
1.1.2 Stock Market Returns ...................................................................... 3
1.1.3 Effect of Voluntary Disclosure on Stock Returns ........................... 5
1.1.4 Firms Listed at the Nairobi Securities Exchange ............................ 6
1.2 Research Problem .................................................................................. 8
1.3 Research Objective .............................................................................. 10
1.4 Value of the Study ............................................................................... 10
CHAPTER TWO: LITERATURE REVIEW ........................................ 12
2.1 Introduction ......................................................................................... 12
2.2 Theoretical Framework ...................................................................... 12
2.2.1 Efficient Market Hypothesis ............................................................ 13
2.2.2 Random Walk Theory...................................................................... 14
2.2.3 Agency Theory .................................................................................. 15
2.3 Determinants of Stock Market Returns ............................................ 16
2.3.1 Internal Developments ..................................................................... 16
2.3.2 Exchange Rates ................................................................................. 17
2.3.3 Investor Sentiment ........................................................................... 17
2.3.4 Interest Rates .................................................................................... 17
Page 6
vi
2.3.5 Inflation ............................................................................................. 18
2.5 Summary of Literature Review .......................................................... 23
CHAPTER THREE: RESEARCH METHODOLOGY ........................ 26
3.1 Introduction ......................................................................................... 26
3.2 Research Design ................................................................................... 26
3.3 Population ............................................................................................ 27
3.4 Sample and Sampling Method ........................................................... 27
3.5 Data Collection Methods ..................................................................... 28
3.6 Validity and Reliability. ...................................................................... 28
3.7 Data Analysis Methods ....................................................................... 29
CHAPTER FOUR: DATA ANALYSIS, RESULTS AND
DISCUSSION ............................................................................................. 32
4.1 Introduction ......................................................................................... 32
4.2 Descriptive Statistics ........................................................................... 32
Table 4.1 Descriptive Statistics ................................................................. 33
4.2.1 Indicators of Study Variables .......................................................... 33
Figure 4.1 Indicators of Study Variables ................................................ 34
4.3 Correlation of Study Variable ............................................................ 34
Table 4.2 Correlation of Study Variable ................................................. 34
4.5 Regression of Study Variables ............................................................ 35
4.5.1 Anova ................................................................................................. 35
Table 4.3 Anova ......................................................................................... 35
Table 4.4: Regression model summary of the effect of independent
variables on the dependent variable ........................................................ 36
Table 4.5: Regression Coefficient of Determination of the effect of
independent variables on the dependent variable .................................. 36
4.6 Discussion of Research Findings ........................................................ 37
CHAPTER FIVE: SUMMARY, CONCLUSION AND
RECOMMENDATIONS .......................................................................... 39
5.1 Introduction ......................................................................................... 39
5.1 Summary of Findings .......................................................................... 39
5.2 Conclusions .......................................................................................... 40
5.3 Recommendation ................................................................................. 41
Page 7
vii
5.5 Limitations of the Study...................................................................... 42
5.6 Suggestion for Further Research ....................................................... 43
REFERENCES .......................................................................................... 44
APPENDICES ........................................................................................... 49
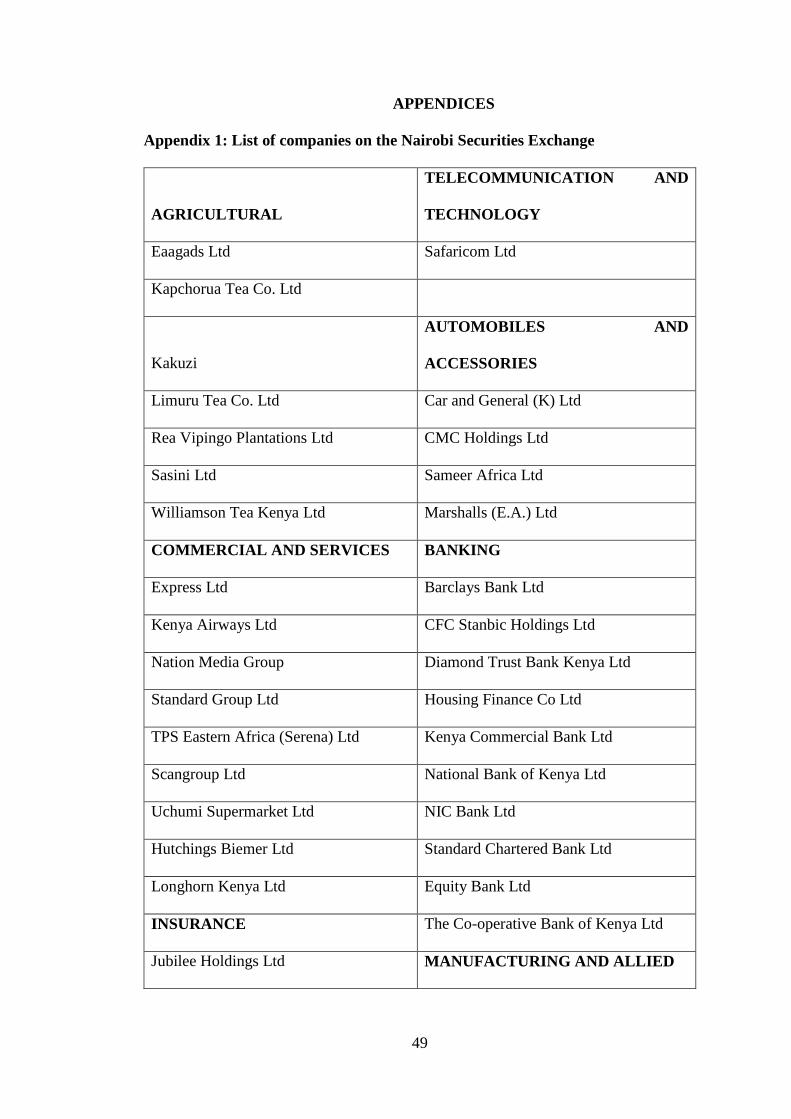
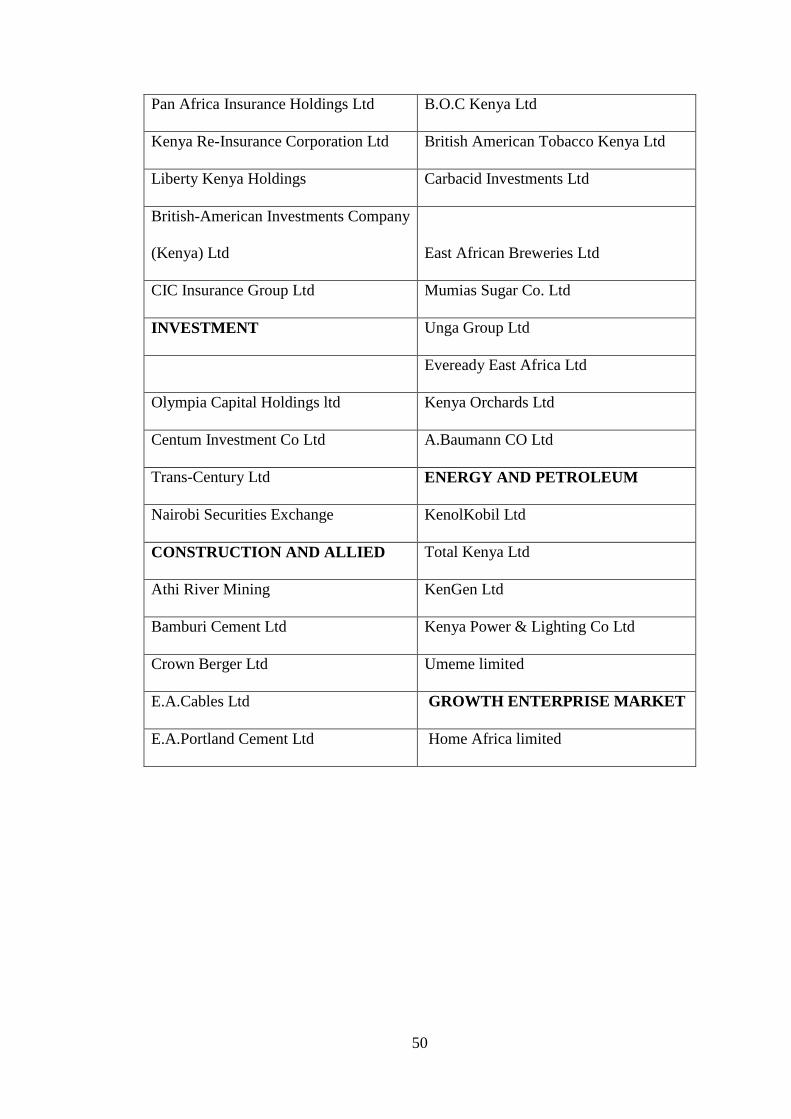
Appendix 1: List of companies on the Nairobi Securities Exchange .... 49
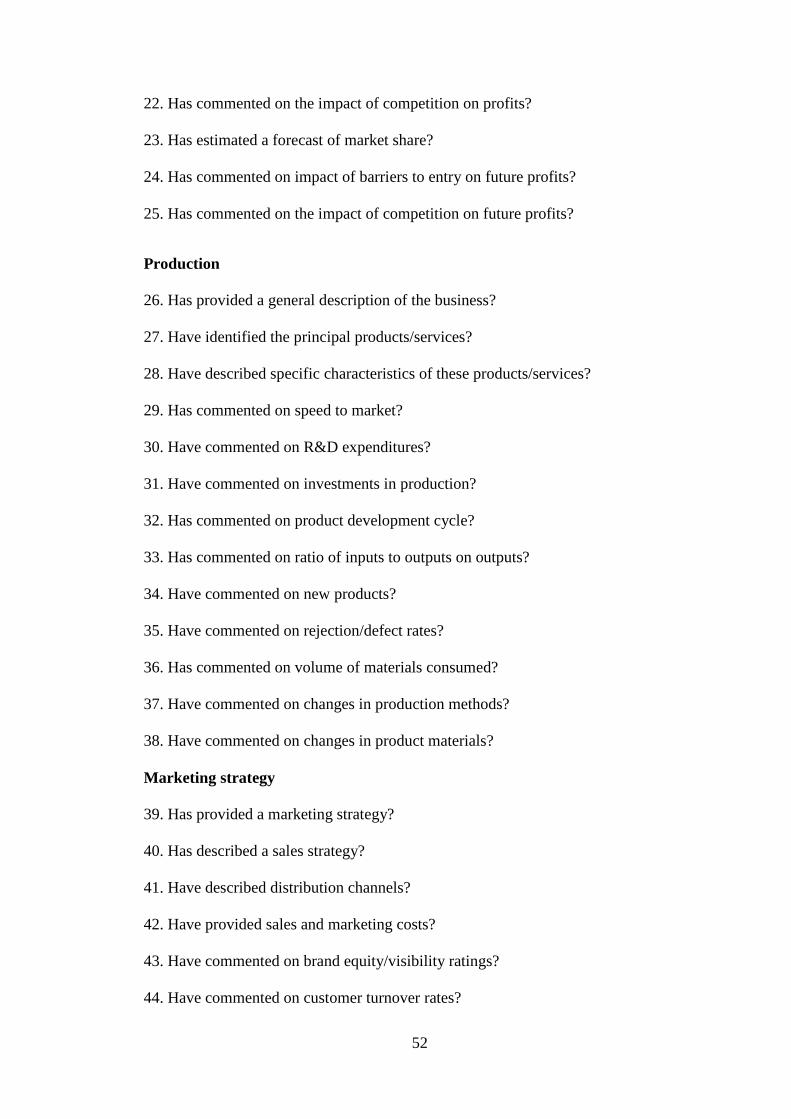
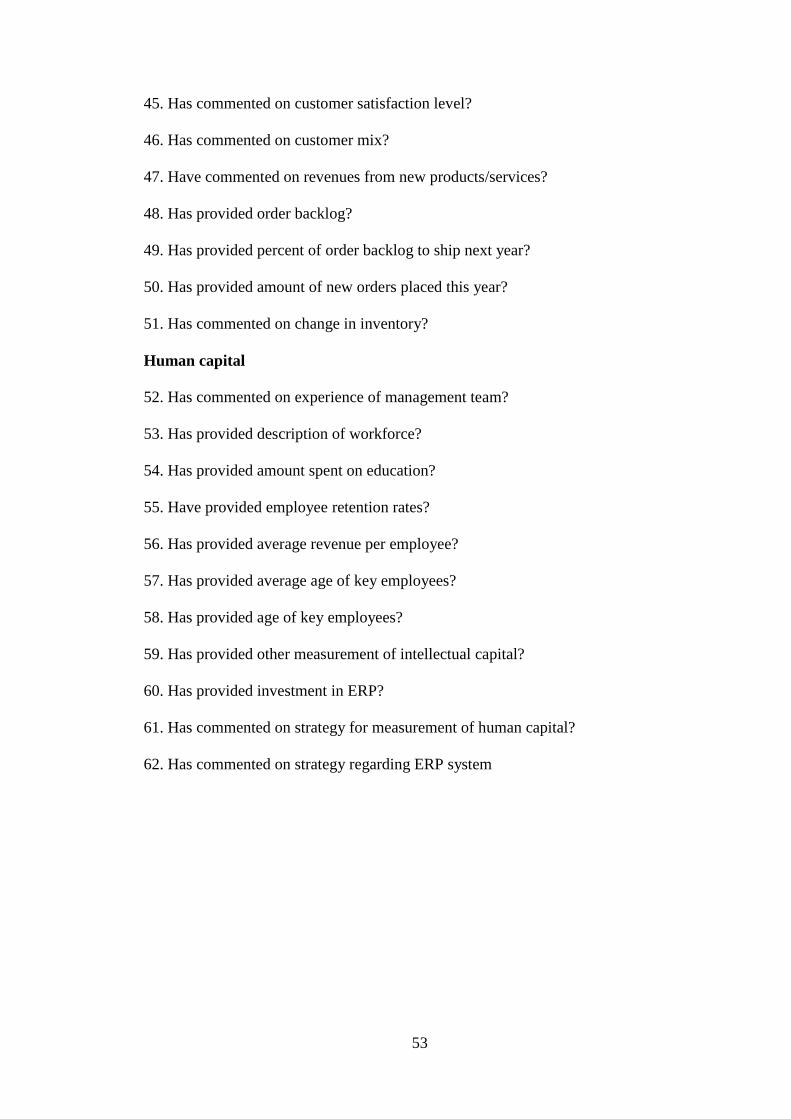
Appendix 2: Voluntary Disclosure Index ................................................ 51
Appendix 3: Computation of Stock Market Returns ............................. 54
Appendix 4: Voluntary Disclosure Index (𝑿𝒏), and Stock Returns(Y) 55
Page 8
viii
LIST OF TABLES
Table 4.1 Descriptive Statistics ................................................................................. 33
Table 4.2 Correlation of Study Variable.................................................................. 34
Table 4.3 Anova .......................................................................................................... 35
Table 4.4: Regression model summary of the effect of independent variables on
the dependent variable .............................................................................................. 36
Table 4.5: Regression Coefficient of Determination of the effect of independent
variables on the dependent variable ......................................................................... 36
Page 9
ix
LIST OF FIGURE
Figure 4.1 Indicators of Study Variables ................................................................. 34
Page 10
x
ABBREVIATIONS
CBK - Central Bank of Kenya
CMA - Capital Market Authority
CPA - Certified Public Accountant
CSR - Corporate Social Responsibility
EMH - Efficient Market Hypothesis
EPS - Earnings per Share
FASB - Financial Accounting Standard Board
FTSE - Financial Times Securities Exchange
NSE - Nairobi Securities Exchange
NASI - NSE All Share Index
ROA - Return on Asset
SPSS - Statistical Package for Social Science
UK - United Kingdom
USA - United States of America
Page 11
xi
ABSTRACT
Transparency and disclosure represent one of the pillars of corporate governance.
Numerous scandals have occurred worldwide due to lack or improper corporate
disclosures. It has been argued that managers should voluntarily disclose information
that would satisfy the needs of various stakeholders. Voluntary disclosure is aimed at
providing a clear view to stakeholders about the business’s long-term sustainability and
reducing information asymmetry and agency conflicts between managers and investors.
Business organizations have over the years reported financial and non-information to
the shareholders and the general public. Included in their reporting are voluntary
disclosures, some of which are not statutorily required to be reported. Notably, every
release of information by an organization has got some cost implication to the firm and
therefore the value addition of such voluntary disclosure ought to be evaluated. The
objective of this study is to determine the effects of voluntary disclosures on stock
market returns of companies listed at the Nairobi Securities Exchange. The findings can
help stock market participants understand the implications of voluntary disclosures on
the company’s stock returns. Company executives can therefore make an informed
decision in engaging on voluntary disclosures. To the stock traders, the research can
help them determine how to action after voluntary disclosures, so as to earn better
returns for their investments. This research studied the effects of voluntary disclosures
on stock market returns for the organizations listed at the NSE. The NSE is divided into
10 different sectors. Samples of 20 companies were selected from the 10 different
sectors. The model shows a goodness of fit as indicated by the coefficient of
determination r² with value of 0.583. This implies that independent variables both
explain 58.3% of the variations as a result of the factors affecting the market
performance. 41.7% of variations are brought about by factors not captured in the
objectives. The study recommends companies to have voluntary disclosure above the
statutory requirements set by the regulatory bodies since it can work as a good corporate
governance tool. There was a strong positive significant relationship was that was
obtained between voluntary disclosure and stock returns therefore, the firms can
increase stock returns by increasing voluntary disclosure. The government should also
put more regulation on disclosure to ensure that individuals investing get more
information.
Page 12
1
CHAPTER ONE: INTRODUCTION
1.1 Background of the Study
Transparency and disclosure represent one of the pillars of corporate governance.
Numerous scandals have occurred worldwide due to lack or improper corporate
disclosures. Different stakeholders use corporate disclosure in their decision-making
(Shehata1, 2013). All decision makers have a framework of what information they need
to accomplish some purpose depending on their mental abilities and experience
(Zareian, 2012). One of the key aims of accounting information reporting is to help the
users of the information to predict the returns on their investment. The stock returns of
an investor’s investments in the stock market are affected by the financial information
provided by the management (Guillaume, 2007). Furthermore, the investors use the
financial information to estimate the rate of return (Asava, 2013). Much of the literature
on voluntary disclosure in accounting considers the economic based models of
disclosure by seeking to link financial reporting to economic consequences (Verrecchia,
2001). Investors - shareholders and debt-holders - are basically savers who want to
invest their money in a ‘good’ business. However, linking savings to business
investment opportunities is a complex process due to information asymmetry, where
entrepreneurs have more and better information about businesses than savers. This
leads to the agency problem: when savers invest in a business, they delegate their
decision-making authority to entrepreneurs; in other words, savers are not actively
involved in a business’s management (Healy and Palepu, 2001).
Zareian (2012) postulates that the extent of the effect of accounting information is
somehow complicated. But since investors invest on any economic unit when they have
enough information, managements’ development of plans and policies to achieve
Page 13
2
succinct levels of information disclosure to the capital markets can effectively
communicate to the investors and leverage their knowledge about the stocks hence
leverage their decision (Francis, 2003). Zareian (2012) linked voluntary accounting
disclosure with stock returns in the capital markets.
1.1.1 Voluntary Disclosure
Disclosure is defined in the accounting literature as informing the public by financial
statements of the firm (Agca and Onder 2007). Disclosure is also defined as “the
communication of economic information, whether financial or nonfinancial,
quantitative or otherwise concerning a company’s financial position and performance”
(Owusu-Ansah, 1998).
Voluntary disclosure refers to disclosure of information regarding the organization up-
and-beyond the statutory requirements (Asava, 2013). The practice of voluntary
disclosure has attracted a lot of attention from researchers. Meek et al. (1995) define
voluntary disclosures as free choices on the part of company managements to provide
accounting and other information deemed relevant to the decision needs of users of
their annual reports. They go ahead and classify voluntary disclosures as strategic, non-
financial and financial information. They classify the disclosures depending on what
they are intended for and the contents of such disclosed information. Since the
management know more about the company than the shareholders, customers,
suppliers, creditors, and government regulators including capital market authorities
(Feng and Li, 2007). The management finds it useful to inform the outsiders what they
know about the company.
Page 14
3
Disclosed financial information is essential for investors to efficiently allocate scarce
resources (Cooke, 1989), and assess investment options (Gray, Meek, Roberts, 1995).
Firms usually reports according to two dominant standards; Generally Accepted
Accounting Principles (GAAPs) and International Financial Reporting Standards
(IFRS). From the investors’ perspective, these standards do not provide all the
necessary information and as a result there are some deficiencies (Schuster and
O’Connel, 2006 ). Voluntary disclosures results in increased transparency and
decreased asymmetry. Agency costs are a consequence of information asymmetry and
arise when investors undervalue the firm due to insufficient information (Guillaume,
2007). Increased transparency shows the true value and makes investors more willing
to invest (Leuz andVerrecchia, 2000).
The key aim of voluntary disclosures is to inform the public more about the company.
In turn, the management hopes that the stakeholders of the company will respond
favorably to the company. Whether strategic, non-financial or financial voluntary
disclosures, Meek, Roberts and Gray (1995) postulates that most organizations gain
some benefits by virtue of disclosing more than is expected if the issued information is
strategically availed to the important parties who are likely to act in favor of the
company. The disclosures are sometimes not periodic while others are periodically
released including voluntary disclosures released together with annual reports of an
organization (Asava, 2013).
1.1.2 Stock Market Returns
Stock market returns is sometimes synonymous to stock prices (Foster, 1986). A strong
market can be seen as one that impounds new information to stock prices and hence
making the stock prices for the firms stable and accurately valued. Due to misvaluations
Page 15
4
of firms by public capital markets, managers provide the information known by them
alone to the capital markets to correct the misvaluations, since stocks value is dependent
on information (Velashani and Mehdi, 2008). Walter (2006), noted that since
organizations in the same industry tend to copy from one another, voluntary disclosure
by one organization is mimicked by other firms, leading to more information released
to the market tending the capital markets towards efficiency.
The information asymmetry and agency conflict can adversely impede the allocation of
resources in capital markets of an economy (Velashani and Mehdi, 2008). The
disclosure requirements themselves and the bodies such as regulators, standards setters,
auditors, and capital market intermediaries seek to facilitate and enhance the credibility
of management disclosures hence playing an important role in mitigating the problem
of information asymmetry and agency conflict (Healy and Palepu, 2001). (Deegan,
2010) postulates that corporate disclosure is critical for the well functioning of an
efficient capital market. Furthermore, companies exercise voluntary disclosures for
capital market reasons.
The market forces exerts pressure on the companies’ such that they can only give
relevant and perceived information so that their securities will fetch reasonable prices
hence leverage their ability to get capital from the markets (Healy and Palepu, 2001).
In support, of Foster (1986), Lim (2007), asserts that there is a relationship between
economic theory and contemporary accounting implying that more disclosure means
lower information asymmetry costs. Hence, the more a company discloses its state of
affairs, the more it mitigates chances of obligations to shareholders or potential buyers
and sellers of the entity’s stocks and hence better performance of the market.
Page 16
5
1.1.3 Effect of Voluntary Disclosure on Stock Returns
There exists many studies reveal that organizations operating in industries highly
dependent on external financing have a considerably higher level of voluntary
accounting disclosures (Velashani and Mehdi, 2008). They further realized that the
results were still up-held after controlling for differences in legal and financial systems
amongst countries, and firm-specific controls for firm size and performance. The
findings revealed that organizations with relatively higher levels of disclosure usually
have lower costs of capital (Walter, 2006). Hence voluntary disclosures lower
information asymmetry costs and hence the cost of external financing for the firm.
Notably, transaction costs reflected in the bid-ask spread should reduce as information
asymmetry reduces. Marilyn and Heibatollah (1994) found out that accounting
disclosure reduces the bid-ask spread as a proxy of transaction costs. Further, Botosan
(1997) also revealed that cost of equity capital is reduced in firms with relatively higher
levels of disclosures. In her research, she noted that companies with relatively more
analyst reports had lower costs of equity capital. Partha (1998) noted that companies
which were ranked highly by financial analysts had lower interest costs of issuing debts.
It is the economic benefits that encourage the managers to provide more information to
the public through voluntary exposure. Also, since regulatory disclosures do not
succinctly reflect the management performance, the management engages in voluntary
disclosure to say more about the company. In turn, the stakeholders get to know more
about the company, while reducing the costs of capital. There is an overall economic
benefit for companies and the capital market since the cost of raising capital is reduced.
Further, the market participants are informed by dealing with the demerits of
Page 17
6
information asymmetry and its related costs. These factors attract more investors to a
market hence an increased success of the market (Healy and Palepu, 2001).
1.1.4 Firms Listed at the Nairobi Securities Exchange
The Nairobi Securities Exchange, until recently was referred to as the Nairobi Stock
Exchange has been providing stock market indexes since its formation in 1953. The
NSE 20-share index was developed to provide a review of weighted movement in price
of major counters. The index was revised in the year 2007 with an aim to ensure that it
was a true barometer of the market since it was felt that the stocks which used to
comprise the index had since lost their prominence in the market and that some sectors
such as telecommunication market segments were not represented. Further NASI was
introduced in the year 2008 as an alternative index which was an overall indicator of
the market performance since it includes all the shares quoted in the market provided
there was activity in the specific stock for the day. NASI has not gained prominence
since its launch and therefore the NSE 20-share index still remains as the main market
index (Asava, 2013). At the heart of the Exchange is market liquidity enhancement by
fostering transformational and utmost ethical practices amongst the participants so that
more investors are assured of free and fair information for their trade related decision
making (Ngugi, 2003).
Therefore, the Kenyan Government has initiated reforms at the NSE aiming to
transform the exchange to be the vehicle to mobilize domestic savings and to attract
foreign capital investments (Barako, 2007). Consequently, corporate financial reporting
and especially enhanced voluntary disclosures is an important ingredient of enhancing
confidence and trust of the market by both local and foreign investors (Ngugi, 2003).
Since the year 2008, the exchange has greatly emphasized on corporate governance
Page 18
7
with some participants punished for faulting the acceptable market regulations (Asava,
2013).
Amongst other changes are enhanced communications by and within the NSE itself. In
November 2011, the exchange launced the FTSE NSE Kenya 15 and FTSE NSE Kenya
25 Indices, as a result of an extensive market consultations with local asset owners and
fund managers. The launch of the indices reveals the interest of growth into the
domestic investment and diversification opportunities in the East African region. This
was followed by the NSE becoming a member of Financial Times Services Division
(FISD) of the Software and Information Industry Association (SIIA) in March 2012.
By providing the indices in its website, the initiative provides the investors with current
information of reliable indication of the Kenyan equity market’s performance during
trading hours (Asava, 2013)
With its emphasis on attracting more investors, NSE has to encourage all the
participants in the market to provide as much information as is practically possible.
Barako (2007) Postulates that the level of disclosures including voluntary disclosures
amongst the participants in the NSE has increased over the years. Definitely, with the
CMA emphasizing on tightening corporate governance amongst the market
participants, the extent of disclosure including voluntary disclosure is bound to be
enhanced at the NSE.
Page 19
8
1.2 Research Problem
It has been argued that managers should voluntarily disclose information that would
satisfy the needs of various stakeholders (Gray, Meek, Roberts, 1995). Voluntary
disclosure is aimed at providing a clear view to stakeholders about the business’s long-
term sustainability and reducing information asymmetry and agency conflicts between
managers and investors (Healy and Palepu, 2001). Financial reporting is anchored on
the agency relationship between the management on one hand and the shareholders and
stakeholders on the other hand. The managers who manage the organizations on behalf
of the shareholders have to report to the shareholders. The stakeholders all make
decisions which either impact the organization or they themselves are affected by the
organizations, since the value of their decision is pegged on the position of the
organization presently and its decisions thereafter (Karamanou and Vafeas, 2005).
Investors get information regarding the organizations trading in NSE through their
annual reports and other announcements. It is the dire need of information so that stock
prices in the NSE reflect the most current information, that the NSE, like any other
exchange market encourages the firms to disclose as much information as is possible.
This is advantageous since literatures reveal that organizations with good corporate
governance, more so in corporate reporting are able to raise capital from the markets
relatively cheap (Zareian, 2012). Furthermore, the greater the disclosures, the greater
the extent to which the stock prices reflect the whole truth hence obeying the market
fundamentals. This helps the investors to rightfully choose the securities to invest in
(Asava, 2013).
Sing and Desay (1971) carried out a research in USA titled an experimental quality
analysis of financial disclosure by firms in USA and found out that disclosure quality
Page 20
9
is better in large firms compared to smaller ones. Dedman and Stephen (2006) carried
out a research on Voluntary disclosure and its impact on share prices, they noted that
the reported earnings of high- R and D expenditure firms were likely to convey less
value-relevant information to investors than those of less research-intensive firms.
Zareian (2012) in his research paper conducted a post event correlation analysis seeking
to establish whether there is a significant relationship between information disclosure
quality and stock returns change in investment firms and noted that the results kept
varying in that in some years there was absolutely no correlation between disclosure
quality and stock returns, while there were some correlation in other years. Hail (2001)
investigated the impact of voluntary corporate disclosure on the expected cost of equity
capital and stated that quality of disclosure is inherently subjective like cost of equity
capital and its evaluation is very difficult. Botosan (1997) carried out a study in USA
to examine the association between expected cost of equity capital and three types of
disclosure and concluded that aggregating across different types of disclosure results in
a loss of information and potentially erroneous conclusions.
Lwangu (2009) performed a study to investigate the link between corporate
governance, company size and company announcements on disclosure compliance for
companies quoted at the NSE. He noted that there was also a positive correlation
between company size and compliance but a negative correlation with company
announcements Wesonga (2008) in his study on the use of financial disclosures for
decision making by investors in Kenya, found out that the majority of the institutional
investors use financial disclosures as a source of vital information for investment
decisions. Mwirichia (2008) carried out a survey of corporate governance disclosures
among Kenyan firms quoted at Nairobi stock exchange. He found out that financial
Page 21
10
sectors make more intensive corporate governance disclosure than the non-financial
sector. Barako (2007) in his study of determinants of voluntary disclosures in Kenyan
Companies Annual Reports observed that organizations cannot link their disclosures
and financial performance.
Literatures from past studies reveal that most researchers have been skewed to the
factors that influence the extent of voluntary disclosure. Those studying the relationship
between voluntary disclosure and stock market returns, like Zarein (2012),Wesonga
(2008) and Mwirichia (2008) concluded that there was no relationship between
voluntary disclosures and stock market returns.Other researchers elsewhere have linked
causality between quality voluntary disclosures and stock returns and in turn the stock
market performance. Yet again, some have had conflicting results. Since voluntary
information disclosures have a cost implication, there is a need to establish whether
voluntary information disclosures impacts the stock market returns expected by the
investors. Hence the question that really begs is whether voluntary information
disclosures by the companies listed in Nairobi Securities Exchange, impacts the market
stock returns of the particular organization.
1.3 Research Objective
The objective of this study is to determine the effects of voluntary disclosures on stock
market returns of companies listed at the Nairobi Securities Exchange.
1.4 Value of the Study
The findings can help stock market participants understand the implications of
voluntary disclosures on the company’s stock returns. Company executives can
therefore make an informed decision in engaging on voluntary disclosures. To the stock
Page 22
11
traders, the research can help them determine how to action after voluntary disclosures,
so as to earn better returns for their investments.
Also,this study will greatly contribute to the body of literatures on the implications of
voluntary accounting disclosures and stock market returns and related fields as not
much work has been done in Kenyan case on the topic. As a result, future researchers
can draw literatures from the study.
Page 23
12
CHAPTER TWO: LITERATURE REVIEW
2.1 Introduction
This chapter provides literatures from past researchers and scholars on the implications
of voluntary accounting disclosures on stock market performance. The chapter
examines the concepts of voluntary accounting disclosures on stock market prices in
relation to the extent to which organizations have exercised voluntary accounting
disclosures and its effect to the stock market performance. By considering the work
from diverse authors, the chapter builds on the theoretical and the conceptual
framework on the effects of voluntary accounting disclosures on stock returns.
2.2 Theoretical Framework
One of the accounting information goals is helping users in predicting the returns on
their investment. Some variables affecting firms’ stock returns in the market result from
financial information provided by management. Extent of effect of this information is
complicated and somehow unknown. Investors, invest on an economic unit when they
have enough information, including financial information (Botosan, 1997).
Decision making requires information; and managers are always confronted with a
problem on which information to release to investors to aid in their decision making.
One of the major difficulties in accounting standards development is the lack of
knowledge of decision making nature and logical process which decision makers
attempt to access (Asava, 2013). The firm’s rate of return on investment is one of the
main decision making criteria for investors and its calculation as a criterion for firm
performance evaluation is obtained from information disclosed by the firm
management (Barako, 2007).
Page 24
13
2.2.1 Efficient Market Hypothesis
The efficient markets hypothesis has historically been one of the main cornerstones of
academic finance research. In finance, a stock price reflects or contains financial
information. Proposed by the University of Chicago's Eugene Fama in the 1960's, the
general concept of the efficient markets hypothesis is that financial markets are
"informationally efficient"- in other words, that asset prices in financial markets reflect
all relevant information about an asset. The efficient-market hypothesis (EMH), also
called Joint Hypothesis Problem (Barako, 2007). Consequently, one cannot consistently
achieve returns in excess of the average market returns on a risk-adjusted basis, given
the information available at the time the investment is made, since before any investor
acts on the information, the market will have adjusted the stock prices to reflect new
information (Fama and French, 1992).
The three major versions of the hypothesis include: weak form, semi-strong form, and
strong form. The weak-form EMH claims that prices on traded assets including stocks,
bonds, or property already reflect all past publicly available information. The semi-
strong-form EMH claims that prices reflect all publicly available information. The
strong-form EMH asserts that prices instantly reflect even hidden or insider
information. Its proponents argue it is pointless to search for undervalued stocks or to
try to predict trends in the market through either fundamental or technical analysis
(Zareian, 2012).
While academics point to a large body of evidence in support of EMH, many
dissensions have been raised. Critics have blamed the belief in rational markets for
many of the late 2000s financial crisis (Asava, 2013). For example, investors, such as
Warren Buffett have consistently beaten the market over long periods of time, which
Page 25
14
by definition is impossible according to the EMH (Feng and Li, 2007). Detractors of
the EMH also point to events, such as the 1987 stock market crash when the Dow Jones
Industrial Average (DJIA) fell by over 20% in a single day, as evidence that stock prices
can seriously deviate from their fair values.
In response, proponents of the hypothesis have stated that market efficiency does not
mean having no uncertainty about the future. Market efficiency is a simplification of
the world which may not always hold true, and that the market is practically efficient
for investment purposes for most individuals (Asava, 2013).
2.2.2 Random Walk Theory
Random walk hypothesis which is consistent with the efficient-market hypothesis is a
financial theory stating that stock market prices evolve in a random fashion hence
cannot be predicted (Hubert, 2001).The theory precisely states that stock price changes
have the same distribution and are independent of each other, so the past movement or
trend of a stock price or market cannot be used to predict its future movement. It is the
notion that stocks take a random and unpredictable path. Proponents of the random walk
theory believe that it is impossible to outperform the market without assuming
additional risk.
Critics of the theory, however, contend that stocks do maintain price trends over time.
They argue that it is possible to outperform the market by carefully selecting entry and
exit points for equity investments. Martin Weber, a leading researcher in behavioral
finance, found trends in stock markets after performing many studies. In one of his ten
years stock market analysis, he looked at the market prices for noticeable trends and
found that stocks with high price increases in the first five years tended to become
Page 26
15
under-performers in the following five years contradicting the random walk hypothesis
(Hubert, 2001). Another contradiction was his findings of stocks that had an upward
revision for earnings outperforming other stocks in the following six months.
Hubert (2001) asserts that an investor with this knowledge has an edge in predicting
which stocks to pull out of the market and which stocks — the stocks with the upward
revision — to leave in. Martin Weber’s studies detract from the random walk
hypothesis, because there are trends and other tips to predicting the stock market.
Furthermore, the contradictions of the efficient market hypothesis allows for some
investors to earn an abnormal earnings by capitalizing on the weaknesses in the market.
2.2.3 Agency Theory
Jensen and Meckling (1976) defines the agency relationship as a contract under which
one or more persons (the principals) engage another person (the agent) to perform some
service on their behalf which involves delegating some decision-making authority to
the agent. Agents correspond to managers, whereas principals correspond to
shareholders from a companies’ perspective. Agency costs arise from the assumption
that the two parties, agents and principals, have different interests. Monitoring costs are
paid by the principals, shareholders, to limit the agents’ aberrant activities. Bonding
costs are paid by the agents, managers, to guarantee that no harm of the principal’s
interests will result from their decisions and actions. Residual loss stems when decisions
of the agents diverge from decisions that would maximize the principal’s welfare.
Accordingly, the agency cost is the summation of the monitoring cost, bonding cost,
and the residual loss (Jensen and Meckling, 1976).
Page 27
16
The agency relationship leads to the information asymmetry problem due to the fact
that managers can access information more than shareholders (Jensen and Meckling,
1976). Optimal contracts is one of the means of mitigating the agency problem as it
helps in bringing shareholders’ interests in line with managers’ interests (Healy and
Palepu, 2001). In addition, voluntary disclosure is another means of mitigating the
agency problem, where managers disclose more voluntary information reducing the
agency costs (Barako, 2006) and also to convince the external users that managers are
acting in an optimal way (Watson, 2002).
Finally, regulations are another means of mitigating the agency problem as they require
managers to fully disclose private information (Healy and Palepu, 2001). However, full
disclosure is never guaranteed even in the presence of regulations (Al-Razeen and
Karhari 2004). The absence of full disclosure is explained by the conflict that exists
between the interests of managers and shareholders (Lev and Penman,1990). In
addition, corporate reporting regulations are intended to provide investors with the
minimum quantity of information that helps in the decision-making process (Al-Razeen
and Karhari 2004).
2.3 Determinants of Stock Market Returns
Some of the factors that affect the stock returns include; internal developments, change
in interest rate, Inflation rate and exchange rates.
2.3.1 Internal Developments
Developments that can occur within companies will affect the price of its stock,
including mergers and acquisitions, earnings reports, the suspension of dividends, the
development or approval of a new innovative product, the hiring or firing of company
Page 28
17
executives and allegations of fraud or negligence. Stock price movements will be most
drastic when these internal developments are unexpected (Healy and Palepu, 2001).
2.3.2 Exchange Rates
Foreign currency rates have a direct impact on the price and value of stocks in foreign
countries, and changes in exchange rates will increase or decrease the cost of doing
business in a country, which will affect the price of stocks of companies doing business
abroad. While long-term movements in exchange rates are affected by fundamental
market forces of supply and demand and purchase price parity, short-term movements
are driven by news, events and futures trading and are difficult to predict (Barako,
2007).
2.3.3 Investor Sentiment
Investor sentiment or confidence can cause the market to go up or down, which can
cause stock prices to rise or fall. The general direction that the stock market takes can
affect the value of a stock a bull market refers to a strong stock market where stock
prices are rising and investor confidence is growing. It's often tied to economic recovery
or an economic boom, as well as investor optimism while a bear market refers to a weak
market where stock prices are falling and investor confidence is fading. It often happens
when an economy is in recession and unemployment is high, with rising prices
(Lopokoiyit, 2012).
2.3.4 Interest Rates
The government through the central bank can raise or lower interest rates to stabilize or
stimulate the economy. This is known as monetary policy. If a company borrows money
to expand and improve its business, higher interest rates will affect the cost of its debt.
Page 29
18
This can reduce company profits and the dividends it pays shareholders. As a result, its
share price may drop. When interest rates are raised, many investors sell or trade their
higher risk stocks for government-backed securities such as bonds to take advantage of
the higher interest rates they yield and to ensure that their investments are protected
(Fama and French, 1992).
2.3.5 Inflation
Inflation means higher consumer prices. This often slows sales and reduces profits.
Higher prices will also often lead to higher interest rates. For example, the Central bank
may raise interest rates to slow down inflation. These changes will tend to bring down
stock prices. Commodities however, may do better with inflation, so their prices may
rise (Fama and French, 1992).
2.4 Empirical Literature
Cases of works on information disclosure are summarized in the following paragraphs
so that it is concluded with ease which information should be reflected in financial
reports and how people process information for achieving their prediction and decision
making regarding future uncertain events as per available literatures.
Sing and Desay (1971) carried out a research in USA titled an experimental quality
analysis of financial disclosure by firms in USA. They argue that information disclosure
by the firms may be in various forms and that an annual report to stockholders is an
important form of periodical disclosure. They found that: disclosure quality is better in
large firms compared to smaller ones. From their research, they also noted that
disclosure quality was better in the firms with more number of stockholders. As part of
Page 30
19
their findings, they argue that disclosure quality is better in the firms audited by CPA
institutes compared to the firms audited by small institutes.
Dedman and Stephen (2006) carried out a research on Voluntary disclosure and its
impact on share prices evidence from the UK biotechnology sector. From their research,
they noted that the reported earnings of high-R and D expenditure firms were likely to
convey less value-relevant information to investors than those of less research-intensive
firms. Using a sample of firms from the high-R and D UK
biotechnology/pharmaceutical sector, they found out that earnings announcements had
a much lower price impact than drug development announcements. They also found out
that there were significantly more ‘good news’ voluntary announcements than ‘bad
news’ announcements. Their findings also indicated that these firms were more likely
to announce late than early stage developments, and that the pattern of disclosures, and
the market’s reaction to them, varied between larger, dominant firms and their smaller
counterparts.
Zareian (2012) in his research paper conducted a post event correlation analysis seeking
to establish whether there is a significant relationship between information disclosure
quality and stock returns change in investment firms. He conducted Kolmogorov -
Smirnov test analysis on all firms listed in the Tehran stock exchange in the period
2004-2008, with disclosure quality and stock returns as the variables, he noted that the
results kept varying in that in some years there was absolutely no correlation between
disclosure quality and stock returns, while there were some correlation in other years.
Hail (2001) investigated the impact of voluntary corporate disclosure on the expected
cost of equity capital and stated that quality of disclosure is inherently subjective like
Page 31
20
cost of equity capital and its evaluation is very difficult. He scaled sample firms in
Switzerland for fiscal year 1997 based on disclosure index in three categories for
calculation of disclosure quality of financial accounts such as; Context and non-
financial information including 10 items and totally 20 scores, procedural analysis and
managerial analysis including 11 items and 20 scores, and information on value based
risk and project related information including 9 items and 14 scores. Hail concluded
that there is a negative and highly significant association between the disclosure quality
and the expected cost of equity capital.
Botosan (1997) carried out a study in USA to examine the association between expected
cost of equity capital and three types of disclosure (annual report, quarterly and other
published reports, and investor relations). His sample consisted of 3,620 firm/year
observations with Value Line data, which were also included in the AIMR’s Annual
Reviews of Corporate Reporting Practices dated from 1985/86 through 1995/96. The
disclosure rankings produced by the AIMR were employed to proxy for disclosure
level. The finding was that cost of equity capital was decreasing in annual report
disclosure level. The magnitude of the difference in cost of equity capital between the
most and least forthcoming firms was approximately ½ - 1% points. These results
confirmed and extended the results of Botosan (1997) to include larger, more heavily
followed firms, across a diverse group of industries, over a number of years. The result
was a positive association between cost of equity capital and the level of more timely
disclosures, such as the quarterly report. The magnitude of the difference in cost of
equity capital between the most and least forthcoming firms being approximately 1 –
2% points. This result, while contrary to that predicted by theory, was consistent with
managers’ claims that greater timely disclosures increase cost of equity capital, possibly
Page 32
21
through increased stock price volatility. They concluded that there was no association
between cost of equity capital and the level of investor relations activities. Based his
results he concluded that aggregating across different types of disclosure results in a
loss of information and potentially erroneous conclusions.
Lwangu (2009) performed a study to investigate the link between corporate
governance, company size and company announcements on disclosure compliance for
companies quoted at the NSE. In his findings, he noted that all 23 companies sampled
had been complying with the corporate governance disclosures, but with the
introduction of the other variables, he noted that most of the firms (84%), didn’t comply
when it came to corporate governance and board size but only 17.2% (4.3%) of the
sample population did comply with the CMA regulations. He also noted that there was
also a positive correlation between company size and compliance but a negative
correlation with company announcements which is attributable to the fact that company
announcements are a prerogative of the company's board and the law is not clear on
what is or is not to be announced.
Wesonga (2008) in his study on the use of financial disclosures for decision making by
investors in Kenya with a case study of institutional investors at Nairobi Stock
Exchange, found out that the majority of the institutional investors use financial
disclosures as a source of vital information for investment decisions. Investors have
exerted little pressure to managers and preparers of information for adequate
disclosures. He also noted that Kenya lacked comprehensive legal framework to ensure
relevant information flow for investment decision making and investor protection. As
part of his findings, he noted that investors do not have confidence in financial analysts
and stockbrokers in the use of relevant and reliable financial information and that
Page 33
22
investment decisions were complex and required both financial and non-financial
information, insight and experience.
Mwirichia (2008) carried out a survey of corporate governance disclosures among
Kenyan firms quoted at Nairobi stock exchange. He found out that financial sectors
make more intensive corporate governance disclosure than the non-financial sector and
that in general; companies have been found to be more active in making financial
disclosures rather than non-financial disclosures. Local ownership, the size of the
company, whether or not the company is a multinational, and size of the company were
found not to have any significant impact on corporate governance disclosure.
Barako (2007) in his study of determinants of voluntary disclosures in Kenyan
Companies Annual Reports observed that most voluntary disclosures are aimed at
informing the public more about the positive attributes of the company than it is for
negative attributes. He also noted that rarely do companies report negative informations
voluntarily. He further postulates that organizations cannot link their disclosures and
financial performance.
Munyao (2012) studied the effects of corporate governance practices on the financial
performance offorex bureaus in Kenya. Established board of diretors, independent
board members and strong internal controls which emphasise inclusive
financialreporting were cited as important corporate governance practises. He cited
benefits such as improved profitability, return on investment and reduced business risk
as accruing to Forex Bureaues with good financial controls and reporting.
Page 34
23
Lopokoiyit (2012) investigated the effect of corporate governance practices on the share
prices of companies listed in theNSE. He noted that there is a direct relationship
between corporate governance practices and share prices. He also observed that
corporate governance practices led to improvement of EPS, debt/equity ratio and return
on assets.
Many literatures reveal that there are various reasons for reluctance of the firms to
increased financial information disclosure level. Firstly, information disclosure informs
everybody including competitors who become aware of the firm’s unfavorable
situation. This is harmful for stockholders. Secondly, they argued that labor unions may
bargain better when they gain information on wages. Thirdly, they argued that investors
are not able to understand accounting procedures and policies and information
disclosure leads to their aberrance rather than their guidance. They also observed that
other available information sources may provide financial information needed by
investors with a lower cost than information provided by financial statements. Lastly,
they advanced that the lack of awareness of investors’ needs is a reason for limiting
information and in fact less information disclosed.
2.5 Summary of Literature Review
Many theories such as Efficient market hypothesis, Agency theory and Random walk
theory have underpinned the importance of financial information in advising the users
of the financial information in their decision making. Since the users of the financial
information are many and have diverse needs, theorists suggest that organizations can
either offer a common financial information or a tailor-made annual report for the
financial users’ needs to be met. They all agree that the level of disclosure is not
possible to be met notwithstanding the diverse needs of the financial information
Page 35
24
users.Furthermore, the cost of disclosure is most of the times uncompensated for. It is
the general costs of information disclosures that calls for organizations to decide the
extent to which to disclose. Executives’ key question is for what value are the voluntary
disclosures.
Literatures reveals that there is no relationship between voluntary disclosures and stock
market returns. Lack of relationship between disclosure quality and stock returns
changes in investment firms is consistent with findings of different authors. On the
other hand, lack of such relationship can be attributed to: limitation due to subjectivity
of the disclosure quality measurement. That is, a change in disclosure quality
measurement index will affect its value which may influence the research results. Also,
it can be attributed to ineffectiveness of the markets. Again, investors in capital markets
may not rely on financial accounts for decision making. The presence of other variables,
of which authors may not be able to control, or may be unknown by the author could
have an influence on the research results. Finally, it may be due to limited voluntary
information items provided by the firms resulting from disclosure culture in the
different markets (Zareian, 2012).
Although no significant relationship was obtained between disclosure quality and stock
returns, it is observed that the relationship direction is mostly positive. In other words,
stock returns increase with increase in disclosure quality. Therefore, the firms can
increase stock returns by increasing disclosure quality, though it is low.
Considering the necessity of increased knowledge in stockholders on investment in
stock exchange, different markets ought to be studied in order to advise investors and
corporate leaders accordingly. Furthermore, Kenya’s capital market is becoming a key
Page 36
25
target by the government to raise necessary capital to meet the national development
needs. This predicts that more investors will invest in the stock markets and that many
unlisted organizations are likely to be listed. The need to link the necessity of voluntary
disclosure amongst the firms listed in the NSE is therefore paramount. Scanty literatures
on the effect of voluntary disclosures on stock returns in the context of the NSE listed
firms exist and hence the necessity of this study.
Page 37
26
CHAPTER THREE: RESEARCH METHODOLOGY
3.1 Introduction
This chapter provides the methods and procedures employed to conduct the study. The
chapter discusses the research design of the study, data collection methods and
techniques employed to analyze the collected data.
3.2 Research Design
A research design refers to a systematic arrangement of the measures, factors and the
tools to be applied in the collection and analysis of the obtained data in order to achieve
the objectives of the study in the most efficient and effective way. Kothari (2004) in
her research postulates that a research design directs the researcher by offering him or
her with guidelines on how to collect, analyse and interpret the data in an coherent
manner.
This study assumed a descriptive research design aiming to determine a causal
relationship between voluntary disclosures and stock returns of the NSE listed firms. A
descriptive study design can be used to find out the present state of affairs in relation to
what extent organizations voluntarily disclose non-statutory required data to the public
and the implications the voluntary disclosure on the stock returns for a firm trading in
the NSE.
Furthermore, the descriptive study design has been preferred since it is suitable in its
applicability within little time and cost constraints (Mugenda and Mugenda, 2003).
Further, it is dependable, valid and generalizablein this kind of a research in that it is
Page 38
27
good for the purpose of data collection and analysis, regardless of whether the data is
qualitative or quantitative.
3.3 Population
A population can be defined as a sum of all the items considered under a study.
(Mugenda and Mugenda, 2003). According to Bryman and Bell (2007), a population is
the totality of the individuals and objects from which a scientifically generalizable
inference can be achieved. The population for this study included the 63 companies in
the Nairobi Securities Exchange as at August 1, 2014. See appendix 1
3.4 Sample and Sampling Method
A sampling frame can be defined as the set of all the available sample units from which
a researcher can choose. (Donald and Theresa, 2009). According to Mugenda and
Mugenda (2003), the sample frame should contain only the elements of the population
which are eligible for selection.
This research studied the effects of voluntary disclosures on stock market returns for
the organizations listed at the NSE. The NSE is divided into 10 different sectors. A
sample of 20 companies were selected from the 10 different sectors. For a firm to be
selected, it had to satisfy the following condition;
(i) Annual reports must be available at the stock exchange and
(ii) The firm must have been listed for the entire period of the study 2009–2013.
Such a cohesive representation enabled the research findings to be generalizable to all
the companies listed on the NSE.
Page 39
28
3.5 Data Collection Methods
This study used secondary data sources. Secondary data can be defined as data that is
already available having been collected in the past by other parties other than the
researcher for the purpose of the current study (Mugenda and Mugenda, 2003). Its main
advantage being availability, hence fast and easy to collect. It is also efficient in both
monitory and time constraints. On the other hand its main disadvantage is its likelihood
for obsolescence. However for the purpose of this study, secondary data collection is
the only method that could be used. Importantly, the impact of out-datedness did not
arise, since the data to be used span within the last 5 years between 2009 and 2013. This
is deemed important since this study sought to describe the effects of voluntary
disclosure on stock returns for the firms listed in Nairobi Securities Exchange.
For the purpose of this study, a brief content analysis on financial reports of the sampled
companies during the period 2009-2013 were analyzed. Specifically, the study looked
for non-statutory disclosures. Four categories of common voluntary disclosures such as
release of; strategy disclosures, competition and outlook, production, marketing
strategy, and human capital were identified.
For the stock returns, the data on annual dividends and share prices of the sampled firms
for the period 2009-2013 were obtained from NSE. The data was used to compute the
stocks return for each period.
3.6 Validity and Reliability.
Reliability is a way of determining the study’s authenticity where a high level of
reliability implies that it is replicable. The study performed regression analysis, and
hence the reliability was not be a problem since subjectivity has been eliminated.
Page 40
29
Validity indicates how well the study actually measure what it intends to measure and
can therefore be described as how well the operationalization of the study examine the
empirical phenomenon it intend to examine
A disclosure index is considered as a useful way of measuring disclosure level when
the index satisfies the requirements of reliability and validity (Marston and Shrives,
1991). Realizing the difficulty in measuring the disclosure level and the problem of the
researchers' subjective assessment applying the scoring model, it is important to assess
the validity of the resulting measure. Therefore, different set of analyses were used to
assess the reliability and validity of a self-constructed disclosure index. These analyses
were suggested by Botosan (1997). Firstly, Cronbach’s coefficient alpha (Cronbach,
1951) is the most common estimate of internal consistency that uses repeated
measurement to assess the degree to which the correlation among the measurements is
attenuated due to random error. The closer the coefficient alpha to one, the more reliable
the generated index is.
3.7 Data Analysis Methods
The collected secondary data was analyzed using Statistical Package for Social Science
(SPSS) version 20. A regression analysis was conducted on the data set. The Pearson
Product Moment was used to analyze the data in which correlation coefficient (𝑅2) and
the coefficient of determination (R) of the data set (each form of voluntary disclosure,
and stock returns) is to be established. The findings from the analysis were organized,
summarized and presented using tables, and used to answer the study question.
The relationship between voluntary disclosures and stock market performance for the
purpose of this study is deemed to take the expression;
Page 41
30
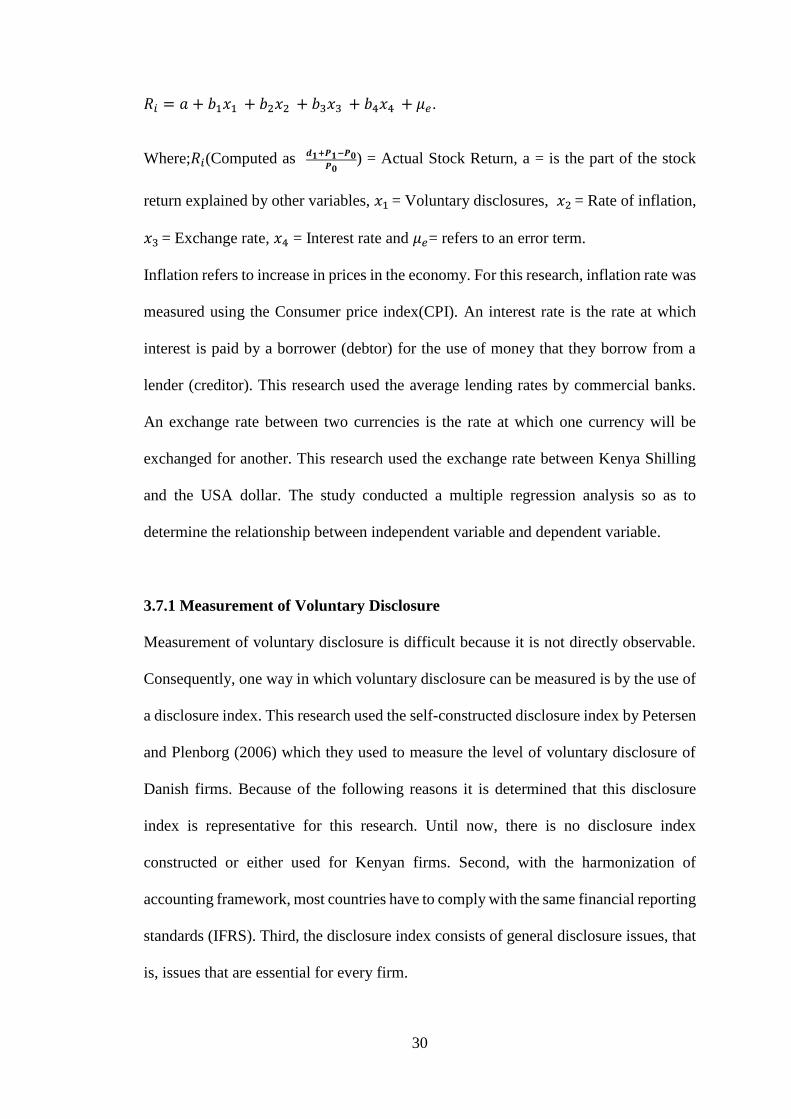
𝑅𝑖 = 𝑎 + 𝑏1𝑥1 + 𝑏2𝑥2 + 𝑏3𝑥3 + 𝑏4𝑥4 + 𝜇𝑒.
Where;𝑅𝑖(Computed as 𝒅𝟏+𝑷𝟏−𝑷𝟎
𝑷𝟎) = Actual Stock Return, a = is the part of the stock
return explained by other variables, 𝑥1 = Voluntary disclosures, 𝑥2 = Rate of inflation,
𝑥3 = Exchange rate, 𝑥4 = Interest rate and 𝜇𝑒= refers to an error term.
Inflation refers to increase in prices in the economy. For this research, inflation rate was
measured using the Consumer price index(CPI). An interest rate is the rate at which
interest is paid by a borrower (debtor) for the use of money that they borrow from a
lender (creditor). This research used the average lending rates by commercial banks.
An exchange rate between two currencies is the rate at which one currency will be
exchanged for another. This research used the exchange rate between Kenya Shilling
and the USA dollar. The study conducted a multiple regression analysis so as to
determine the relationship between independent variable and dependent variable.
3.7.1 Measurement of Voluntary Disclosure
Measurement of voluntary disclosure is difficult because it is not directly observable.
Consequently, one way in which voluntary disclosure can be measured is by the use of
a disclosure index. This research used the self-constructed disclosure index by Petersen
and Plenborg (2006) which they used to measure the level of voluntary disclosure of
Danish firms. Because of the following reasons it is determined that this disclosure
index is representative for this research. Until now, there is no disclosure index
constructed or either used for Kenyan firms. Second, with the harmonization of
accounting framework, most countries have to comply with the same financial reporting
standards (IFRS). Third, the disclosure index consists of general disclosure issues, that
is, issues that are essential for every firm.
Page 42
31
The disclosure index is based on an investor’s perspective, which implies that, the
disclosure items incorporated within the disclosure index are based on what investors
qualified as relevant or important. The disclosure index consists of five disclosure
categories: (1) strategy, (2) competition and outlook, (3) production, (4) marketing
strategy and (5) human capital. It encloses 62 disclosure items spread among these five
categories, see appendix 2.
The use of the disclosure index measured the amount of voluntary disclosure within
annual reports. This research used the company’s annual reports of 2009 to 2013 to
create the disclosure index for each year. To measure the amount of voluntary
disclosure a binary coding scheme was applied in which the presence of each disclosure
item scores one (1) point and the absence of each disclosure item scores zero (0) point.
Consequently, one point was assigned to each of the 62 disclosure items that the firms
provide through their annual report, whereas each firm could reach a maximum of 62
points.
Page 43
32
CHAPTER FOUR: DATA ANALYSIS, RESULTS AND
DISCUSSION
4.1 Introduction
This chapter presents the results of the analysis, findings and discussions on the effect
of voluntary disclosure on stock returns of companies listed at the Nairobi Securities
Exchange. The data of the study was obtained through content analysis of the annual
reports of the 20 companies listed at the NSE. The NSE is divided into 10 different
sectors. A sample of 20 companies were selected from the 10 different sectors. The
study used data from the 10 different sectors as this was deemed to be a better
representation of the companies listed at the NSE as opposed to using the 20 share index
that is mainly composed of the large companies. The study intended to find the
relationship between voluntary disclosures and stock market performance. The
independent variables for the study were Rate of inflation, Exchange rate, Interest rate
and Voluntary disclosures. The dependent variable was market performance.
4.2 Descriptive Statistics
This study undertakes to research on the relationship that exists between stock market
performance and some selected independent variables. Monthly stock market
performance using the NSE All share index was collected from NSE, the monthly
inflation rates were obtained from reports published by various government bodies such
as central bank of Kenya (CBK) and the Kenya National bureau of statistics (KNBS).
Page 44
33
Table 4.1 Descriptive Statistics
Minimum Maximum Mean Median Std. Deviation
Voluntary disclosures (Index) 26.00 42.00 33.86 33.50 4.13
Exchange rate 77.33 88.86 83.22 84.52 4.30
Interest rate% 13.87 20.04 16.76 16.99 2.24
Rate of inflation % 4.100 14.00 8.740 9.400 3.52
Market performance-Ratio -0.29 1.670 0.650 0.570 0.46
Source: Researcher (2014)
The table above shows the descriptive statistics from the study where the study
variables mean, standard deviation and variance are displayed. Where the voluntary
disclosures has a mean of 33.86 and a standard deviation of 4.13, the exchange rate has
a mean of 83.22 and standard deviation of 4.3, interest rate means is 16.76 and a
standard deviation of 2.24, Rate of inflation mean is 8.74 and standard deviation of 3.52
and the market performance has mean of 0.65 and a standard deviation of 0.46.
4.2.1 Indicators of Study Variables
The figure shows the data of changes in independent variable from the year 2008-2013.
This shows the change in data from those years.
Page 45
34
Figure 4.1 Indicators of Study Variables
4.3 Correlation of Study Variable
Correlation tests were carried out on the original data to show the extent or strength and
direction of the relationship between variables. It should be noted that correlation does
not show causality between independent and dependent variables. It only informs on
the magnitude with which a dependent variable changes due to a unit change in the
independent variable. The table below shows correlation of study variables.
Table 4.2 Correlation of Study Variable
Correlations
Market
performance
Voluntary
disclosures
Exchange
rate
Interest
rate
Rate of
inflation
Market
performance 1.000
Voluntary
disclosures .690 1.000
Exchange rate .628 .653 1.000
Interest rate .572 .638 .551 1.000
Rate of inflation .687 .635 .567 .643 1.000
Source: Researcher (2014)
0
20
40
60
80
100
120
140
160
2006 2008 2010 2012 2014
Inflation Rate
Consumer Price Index
voluntary disclosure
Average mean rate
Page 46
35
The researcher analyzed the variables using Pearson correlation which is used to test
the direction, strength and significance of the bivariate relationship among all the
variables that have been measured at interval or ratio level (Sekaran and Bougie, 2012).
As shown in table 4.2 all the predictor variables had a mildly strong and positive
correlation between themselves. The positive correlation means that the variables vary
together in the same direction; when any of the variables increase the others increase
and when any decrease the others decrease and the correlation was all significant at
0.01 two tailed.
4.5 Regression of Study Variables
4.5.1 Anova
The test is a check for whether the homogeneity of variance has been met. The test is
used to examine mean differences between two or more groups. The table below shows
the Anova of the study variables
Table 4.3 Anova
ANOVAb
Model
Sum of
Squares df Mean Square F Sig.
1 Regression 6.153 5 1.538 5.248 .000a
Residual 4.397 15 .293
Total 10.550 19
a. Predictors: (Constant), Rate of inflation, Voluntary disclosures, Interest rate ,
Exchange rate
b. Dependent Variable: Market performance
Source: Researcher (2014)
From table 4.17, the significance value is 0.000; this means all factors have significant
effect because the significance value is lower than 0.05.
Page 47
36
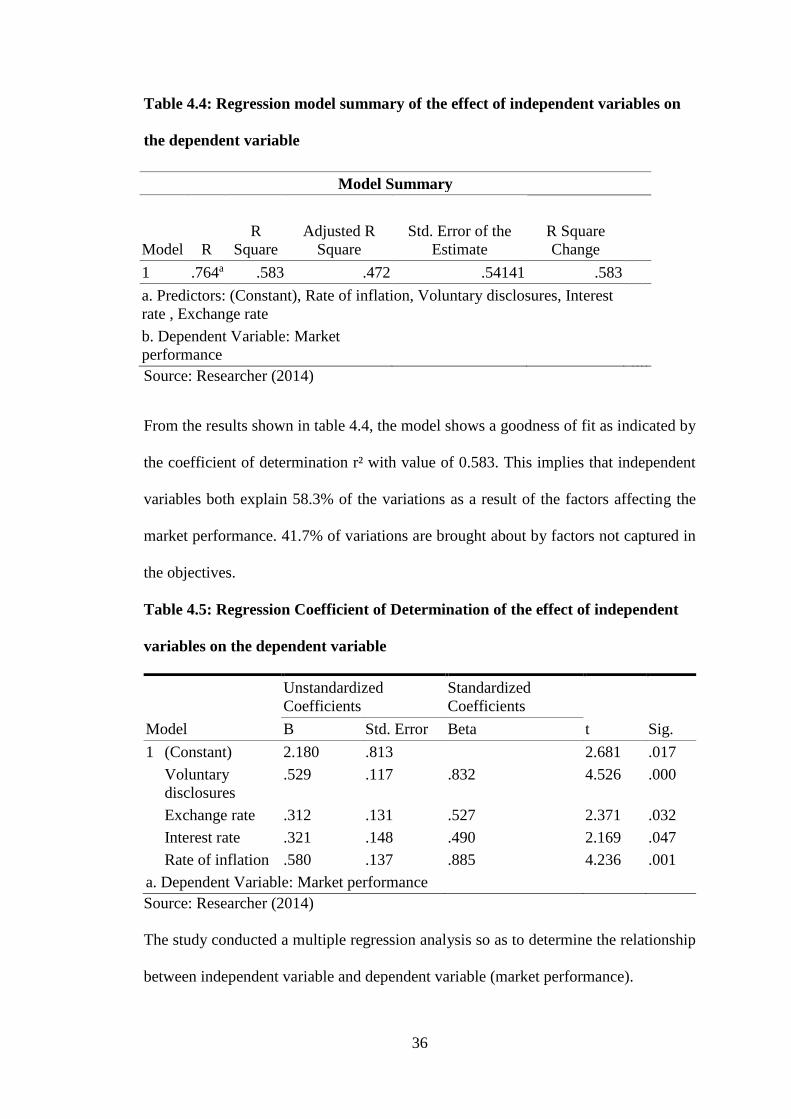
Table 4.4: Regression model summary of the effect of independent variables on
the dependent variable
Source: Researcher (2014)
From the results shown in table 4.4, the model shows a goodness of fit as indicated by
the coefficient of determination r² with value of 0.583. This implies that independent
variables both explain 58.3% of the variations as a result of the factors affecting the
market performance. 41.7% of variations are brought about by factors not captured in
the objectives.
Table 4.5: Regression Coefficient of Determination of the effect of independent
variables on the dependent variable
Model
Unstandardized
Coefficients
Standardized
Coefficients
t Sig. B Std. Error Beta
1 (Constant) 2.180 .813 2.681 .017
Voluntary
disclosures
.529 .117 .832 4.526 .000
Exchange rate .312 .131 .527 2.371 .032
Interest rate .321 .148 .490 2.169 .047
Rate of inflation .580 .137 .885 4.236 .001
a. Dependent Variable: Market performance
Source: Researcher (2014)
The study conducted a multiple regression analysis so as to determine the relationship
between independent variable and dependent variable (market performance).
Model Summary
Model R
R
Square
Adjusted R
Square
Std. Error of the
Estimate
R Square
Change
1 .764a .583 .472 .54141 .583
a. Predictors: (Constant), Rate of inflation, Voluntary disclosures, Interest
rate , Exchange rate
b. Dependent Variable: Market
performance
Page 48
37
The regression equation (Y = β0 + β1X1 + β2X2 + β3X3 + β4X4+ α) was:
Y = 2.180+0.529 X1 + 0.312 X2 + 0.321X3+ 0.580 X4
Whereby Y = Market performance, X1 = Voluntary disclosures; X2 = Exchange
rate; X3 = Interest rate and X4 = Rate of inflation
According to the regression equation established, taking all factors (Voluntary
disclosures, Exchange rate, Interest rate and Rate of inflation) constant at zero, Market
performance of the stock exchange as a result of these independent factors was 2.180.
The data findings analyzed also shows that taking all other independent variables at
zero, a unit increase in voluntary disclosure will lead to a 0.529 increase in market
performance. A unit increase in exchange rate will lead to a 0.312 increase in effect on
market performance; a unit increase in interest rate will lead to a 0.321 increase in effect
on market performance, while a unit increase in rate of inflation will lead to a 0.580
increase in effect on market performance. This therefore implies that all the four
variables have a positive relationship with market performance and the variables
voluntary disclosure and rate of inflation having the most effect.
4.6 Discussion of Research Findings
Lopokoiyit (2012) conducted a research on the effect of corporate governance practices
on the share prices of companies listed in theNSE. He noted that there was a direct
relationship between corporate governance practices and share prices. He also observed
that corporate governance practices led to improvement of EPS, debt/equity ratio and
return on assets.
Zareian (2012) in his research paper conducted a post event correlation analysis seeking
to establish whether there is a significant relationship between information disclosure
Page 49
38
quality and stock returns change in investment firms. He conducted Kolmogorov -
Smirnov test analysis on all firms listed in the Tehran stock exchange in the period
2004-2008, with disclosure quality and stock returns as the variables, he noted that the
results kept varying in that in some years there was absolutely no correlation between
disclosure quality and stock returns, while there were some correlation in other years.
Asava (2013) sought to establish the effect of voluntary disclosures on stock returns of
companies listed in the Nairobi Securities Exchange using a content analysis of annual
reports of companies composing the NSE 20 Share Index. The findings revealed that
there is no relationship between voluntary disclosures and stock returns
Hail (2001) had studied the impact of voluntary corporate disclosure on the expected
cost of equity capital and stated that quality of disclosure is inherently subjective like
cost of equity capital and its evaluation is very difficult.
In this research, it was noted that voluntary disclosures have a positive relationship with
stock returns as depicted by Pearson Product Moment of equal 0.69. Even in the
combined model, it was established that there is positive relationship between voluntary
disclosures and stock returns as depicted by a Pearson Product Moment 0.529
This study conducted a longitudinal analysis of the voluntary disclosures and stock
return of companies 20 Companies listed at the NSE over a five year period from 2009-
2013. The results of the analysis were consistent with past researchers such as
Lopokoiyit and Zareian. However the findings of Asava and Hill were contrary to the
findings of this study.
Page 50
39
CHAPTER FIVE: SUMMARY, CONCLUSION AND
RECOMMENDATIONS
5.1 Introduction
The study sought to establish the effect of voluntary disclosure on stock returns of
companies listed at the Nairobi Securities Exchange. This chapter is a synthesis of the
entire study, and contains summary of research findings, exposition of the findings,
commensurate with objectives, conclusions and recommendations based thereon.
5.1 Summary of Findings
Descriptive statistics were used to analyze the variables Where the voluntary
disclosures has a mean of 33.86 and a standard deviation of 4.13, the exchange rate has
a mean of 83.22 and standard deviation of 4.3, interest rate means is 16.76 and a
standard deviation of 2.24, Rate of inflation mean is 8.74 and standard deviation of 3.52
and the market performance has mean of 0.65 and a mean of 0.46.
Correlation of study variable was done to the variables and the voluntary disclosures
had a correlation of 0.690, exchange rate had a correlation of 0.628, interest rate was
0.572 and Rate of inflation 0.687. This showed that the entire variables had a strong
correlation. This implies that all variables had an effect on the market performance.
The model shows a goodness of fit as indicated by the coefficient of determination r²
with value of 0.583. This implies that independent variables both explain 58.3% of the
variations as a result of the factors affecting the market performance. 41.7% of
variations are brought about by factors not captured in the objectives.
Page 51
40
According to the regression equation established, taking all factors (Voluntary
disclosures, Exchange rate, Interest rate and Rate of inflation) constant at zero, Market
performance of the stock exchange as a result of these independent factors was 2.180.
The data findings analyzed also shows that taking all other independent variables at
zero, a unit increase in voluntary disclosure will lead to a 0.529 increase in market
performance. A unit increase in exchange rate will lead to a 0.312 increase in effect on
market performance; a unit increase in interest rate will lead to a 0.321 increase in effect
on market performance, while a unit increase in rate of inflation will lead to a 0.580
increase in effect on market performance. This therefore implies that all the four
variables have a positive relationship with market performance and the variables
voluntary disclosure and rate of inflation having the most effect.
5.2 Conclusions
The Kenya Government initiated reforms at the Nairobi Stock Exchange (NSE) aimed
at transforming the exchange into a vehicle for mobilizing domestic savings and
attracting foreign capital investment. Given the increasing amount of focus on and the
growing significance of the NSE as an important venue for attracting foreign
investments and to encourage local residents to invest in shares, Kenyan companies
may engage in voluntary disclosure as a means to enhance the value of their stocks.
Moreover, there are empirical evidences suggesting that increased information
disclosure reduces a firm’s cost of capital by reducing information asymmetry
(Botosan, 1997). Several prior studies have investigated various determinants of
companies’ voluntary disclosure practices. A consistent finding is that size is an
important predictor of corporate reporting behaviour. In meta-analysis of 29 disclosure
studies, conducted by Ahmed and Courtis (1999), size, listing status and financial
Page 52
41
leverage were found to have a significant impact on disclosure level. Other company
attributes associated with corporate disclosure include, industry type (Cooke, 1989).
From our findings it was determined that there was a relationship between the
independent variable and the dependent variable. This findings are similar to several
findings by Zareian (2012) noted that while there was absolutely no correlation
between disclosure quality and stock returns in some years, there were some
correlations in other years.
5.3 Recommendation
The study recommends companies to have voluntary disclosure above the statutory
requirements set by the regulatory bodies since it can work as a good corporate
governance tool. The extent of voluntary disclosure in the annual report is related to a
company’s corporate governance practices. There was a strong positive significant
relationship was that was obtained between voluntary disclosure and stock returns, it is
observed that the disclosure helps the investors to make better investments. In other
words, stock returns increase by increase in voluntary disclosure. Therefore, the firms
can increase stock returns by increasing voluntary disclosure, since the relationship is
strong.
The government should also put more regulation on disclosure to ensure that
individuals investing get more information. This is because the since the management
know more about the company than the shareholders, customers, suppliers, creditors,
and government regulators including capital market authorities (Feng and Li, 2007).
The management finds it useful to inform the outsiders what they know about the
company. Disclosed financial information is essential for investors to efficiently
Page 53
42
allocate scarce resources (Cooke, 1989), and assess investment options (Gray, Meek,
Roberts, 1995). This is why further regulation should be necessary.
5.5 Limitations of the Study
In measuring the amount of voluntary disclosure, this research used a self-constructed
disclosure index. It can be argued that this type of measurement method is a subjective
measurement method of voluntary disclosure. A binary coding scheme was used where
1 was allocated to presence of a disclosure and 0 for absence. The subjective
measuremet of voluntary disclosures through assigning an index by the researcher
would have affected the findings since different researchers will no doubt give different
ratings.
The research sample consists of 20 companies listed at the NSE. The companies were
spread across the different sectors. Because this is a relative small sample, this could
bias the results. In addition, the selected years 2009 to 2013 may not be enough to
generalize the results. Furthermore, the research was performed for companies listed at
the NSE in Kenya and consequently the results cannot generalize for other countries.
Limitation about the study’s ability to generalize its findings concerns that this research
only focuses on voluntary disclosure related to one communication source (annual
financial reports) while other communication sources exists that facilitate voluntary
disclosure. This research study only used one type of voluntary disclosure, as a result
the measurement of voluntary disclosure may include an element of bias.
Page 54
43
The criteria used was that; the companies needed to have been listed for throughout the
five year period (2008-2013) as well as financial statements being available at the NSE.
This locked some companies from being selected and hence the research may not
generalize on the companies that have been listed after 2009.
5.6 Suggestion for Further Research
The findings of this study are only confined to the relationship between voluntary
disclosure and stock returns. Based on these findings further research can be done to
determine that relationship between the variables under different business cycles.
The study recommends that further research focusing on the specific industries could
perhaps reveal more focused results as different industries may respond differently to
certain information releases. Also, an analysis of the effect of voluntary information
release on stock returns as soon as it is released can help depict the short term effect of
such information disclosures on stock return.
Further studies can be carried out to determine whether or not there is relationship
between the voluntary disclosure and the cost of equity capital in Kenyan context and
if it is consistent over the years.
Further research can also be carried out to determine the effect of other type of
publications disclosure on the stock market returns in comparison to the annual
financial reports of the companies listed at the Nairobi Securities Exchange.
Page 55
44
REFERENCES
Ağca, A., & Onder, S. (2007). Voluntary disclosure in Turkey: a study on firms listed
in Istanbul stock exchange. Problems and Perspectives in Management, 241-
286.
Ahmed, I., & Courtis, K. (1999). Meta analysis on annual report and corporate
characteristics,. Finance Journal, 22-36.
Al-Razeen, A., & Karbhari,Y. (2004). Interaction between compulsory and voluntary
disclosure in Saudi Arabian corporate annual reports, Managerial Auditing
Journal, 351-360.
Asava, I. K. (2013). Implications of voluntary disclosure on stock market performance.
Journal of accounting research, 25-43.
Barako, D. G. (2007). Determinants of voluntary disclosures in Kenyan Companies
Annual Reports. African Journal of Business Management, 13-28.
Barako, D. H. (2006). Factors influencing voluntary corporate disclosures by Kenyan
companies, Corporate Governance: An International Review, 107-125.
Botosan, C. A. (1997). Disclosure Level and Cost of Equity Capital. The Accounting
Review, 323-349.
Bryman , A., & Bell, E. (2007). Business Research Methods.New York: Oxford
University Press ,12-24
Cooke, T. E. (1989). Voluntary corporate disclosure by Swedish companies. Journal of
International Financial Management and Accounting, 171-185.
Cronbach, L. J. (1951). Coefficient alpha and the internal structure of tests. Psychometrika,
297-334
Dedman, E., & Stephen,W. (2008) Voluntary disclosure and its impact on share prices:
Evidence from the UK biotechnology sector, Journal of Finance.
Page 56
45
Deegan, C. (2010) Social Responsibility Disclosure Practices. The Accounting
Review,68-89
Donald, H. M., & Theresa, L. W. (2009). Research Methods: Examples &
Explanations Series,74-98
Fama, E., & French, K. (1992). The Cross-Section of Expected Stock Returns. Journal
of Finance, 47, 427–65.
Feng, G., & Li, Q. J. (2007). The Credibility of Voluntary Disclosure and Insider Stock
Transactions: Journal of Accounting Research, 45-54
Foster, G. (1986). Financial Statement Analysis. Englewood Cliffs : N.J.: Prentice
Hall. Reprint.12-17
Francis, J.R. (2003). Global Evidence on Incentives for Voluntary Accounting
Disclosures and the Effect on Cost of Capital: College of Business Working
Paper. Missouri: University of Missouri at Columbia,24-67
Guillaume, N. (2007). The relation between accounting policy and voluntary
disclosure. University Maastricht, Journal of accounting research, 35-67
Hail, l. (2002). The impact of voluntary corporate disclosure on the exante cost of
capital for Swiss firms. The European Accounting Review, 11(4), 741-743.
Healy, M. P., & Palepu, G. K. (2001). Information asymmetry, corporate disclosure,
and the capital markets: A Review of Empirical Disclosure Literature. Boston:
Graduate School of Business, Harvard University, 24-78
Hubert, F. (2001). Behavioral Finance-Theory and Practical Application. Business
Economics, 63.
Jensen, M. & Meckling, C (1976). Theory of the firm: managerial behavior, agency
costs and ownership. Journal of Financial Economics, 305-360.
Page 57
46
Karamanou, I., & Vafeas, K. (2005). The Association between Corporate Boards, Audit
Committees, and Management Earnings Forecasts: An Empirical Analysis.
Journal of Accounting Research, 43 (3), 453.
Kothari, C. (2004). Research Methodology: Methods & Techniques (2 Ed ed.). Delhi:
New Age International Ltd,112-234
Leuz, C., &Verrecchia, R. E. (2000). The economic consequencies of increased
disclosures. Journal of accounting research, 91-124.
Lev, B. & Penman, S. H. (1990). Voluntary forecast disclosure, non disclosure and
stock prices. Journal of Accounting Research,, 49-76.
Lim, L. (2007). The Association between Board Composition and Different Types of
Voluntary Disclosure. European Accounting Review, 16(3), 555-83.
Lopokoiyit, P. M. (2012). The Effect of Corporate Governance Practices on the share
prices of Companies Listed at the Nairobi Securities Exchange. University of
Nairobi
Lwangu, A. (2009). Link between Corporate Governance, Company size and Company
Announcements on Disclosure, Compliance for Companies Quoted at the NSE
.
Marilyn, M., & Heibatollah. S. (1994). The Impact of the SEC's. Segment Disclosure
on Bid- Ask Spreads. The Accounting Review, 24-67
Marston, A., & Shrives, G. (1991). Disclosure and Determinants Studies: An
Extension Using the Divisive Clustering Method (DIV)
Meek G.K, Roberts, C. B., & Gray S. J. (1995) Factors influencing voluntary annual
reports disclosures by U.S., U.K and continental European multinationals
corporations, Journal of International Business Studies, 34-99
Page 58
47
Mugenda, A., & Mugenda , A. O. (2003). Quantitative and Qualitative Approaches.
Nairobi Kenya: African Center for Technological Studies, The Accounting
Review.
Mugenda, O. M., & Mugenda, A. G. (2003). Research Methods: Quantitative and
Qualitative Approaches. Nairobi: Acts Press.
Munyao, D. N. (2012). The effect of Corporate Governance Practices on the Financal
Performance of Forex Bureaus in Kenya, published Msc. Finance Project.
Nairobi: University of Nairobi.
Mwirichia, M. G. (2008). A Survey of Corporate Governance Disclosures among
Kenyan Firm Quoted at NSE. University of Nairobi, Journal of accounting
research, 15-34.
Ngugi, W. R. (2003). Development of the Nairobi Stock Exchange: A Historical
Perspective, KIPPRA Discussion Paper No. 27. Nairobi: Kenya Institute for
Public Policy.
Owusu-Ansah, S. (1998). The impact of corporate attributes on the extent of mandatory
disclosure and reporting by listed companies in Zimbabwe. The International
Journal of Accounting, 605-631.
Partha, S. M (1998). Signaling through Financial Disbursements in post-IPO firms
Journal of accounting research,
Petersen, C., & Plenborg, T. (2006). Voluntary disclosure and stock market liquidity:
Evidence from Jordanian capital market
Schuster, S., & O. Connel. (2006 ). Trends towards voluntary corporate disclosures.
Journal of accounting research,57-78
Sekaran, U., & Bougie, R. (2010). Research Methods for Business: A Skill Building
Approach, 60-95.
Page 59
48
Shehata1, N. F. (2013). Theories and Determinants of Voluntary Disclosure. Journal
of accounting research, 18-22.
Sing, V., & Desay, N. (1971). experimental quality analysis of financial disclosure by
firms’ in USA, Journal of Accounting and Economics
Spencer, T. (2011). Porter’s Six Steps of Strategic Positioning. Journal of Financial
Economics, 32-44
Velashani, M. A., & Mehdi, A. (2008). The economic benefits of voluntary disclosure
with particular reference to environmental disclosure. Monash Business
Review, 4(2), 1-8.
Verrecchia, R. (2001). Essays on disclosure,. Journal of Accounting and Economics,
97-180.
Walter, A. (2006). Intra-Industry Imitation in Corporate Environmental Reporting: An
International Perspective. Journal of Accounting and Public Policy, 25(3), 299-
331.
Watson, A. S. (2002). Voluntary disclosure of accounting ratios in the UK. British
Accounting Review, 289-313.
Wesonga, O. A. (2008). The useof Financial DIsclosures for Decision making by
Investors in Kenya: A case study of Institutional Investors at the NSE. MBA
Project at the University of Nairobi.
Zareian, M. (2012). Voluntary Disclosure of Information and Stock Returns.
International Journal of Engineering Research and Applications (IJERA), 2(3),
27,62-66.
Page 60
49
APPENDICES
Appendix 1: List of companies on the Nairobi Securities Exchange
AGRICULTURAL
TELECOMMUNICATION AND
TECHNOLOGY
Eaagads Ltd Safaricom Ltd
Kapchorua Tea Co. Ltd
Kakuzi
AUTOMOBILES AND
ACCESSORIES
Limuru Tea Co. Ltd Car and General (K) Ltd
Rea Vipingo Plantations Ltd CMC Holdings Ltd
Sasini Ltd Sameer Africa Ltd
Williamson Tea Kenya Ltd Marshalls (E.A.) Ltd
COMMERCIAL AND SERVICES BANKING
Express Ltd Barclays Bank Ltd
Kenya Airways Ltd CFC Stanbic Holdings Ltd
Nation Media Group Diamond Trust Bank Kenya Ltd
Standard Group Ltd Housing Finance Co Ltd
TPS Eastern Africa (Serena) Ltd Kenya Commercial Bank Ltd
Scangroup Ltd National Bank of Kenya Ltd
Uchumi Supermarket Ltd NIC Bank Ltd
Hutchings Biemer Ltd Standard Chartered Bank Ltd
Longhorn Kenya Ltd Equity Bank Ltd
INSURANCE The Co-operative Bank of Kenya Ltd
Jubilee Holdings Ltd MANUFACTURING AND ALLIED
Page 61
50
Pan Africa Insurance Holdings Ltd B.O.C Kenya Ltd
Kenya Re-Insurance Corporation Ltd British American Tobacco Kenya Ltd
Liberty Kenya Holdings Carbacid Investments Ltd
British-American Investments Company
(Kenya) Ltd East African Breweries Ltd
CIC Insurance Group Ltd Mumias Sugar Co. Ltd
INVESTMENT Unga Group Ltd
Eveready East Africa Ltd
Olympia Capital Holdings ltd Kenya Orchards Ltd
Centum Investment Co Ltd A.Baumann CO Ltd
Trans-Century Ltd ENERGY AND PETROLEUM
Nairobi Securities Exchange KenolKobil Ltd
CONSTRUCTION AND ALLIED Total Kenya Ltd
Athi River Mining KenGen Ltd
Bamburi Cement Ltd Kenya Power & Lighting Co Ltd
Crown Berger Ltd Umeme limited
E.A.Cables Ltd GROWTH ENTERPRISE MARKET
E.A.Portland Cement Ltd Home Africa limited
Page 62
51
Appendix 2: Voluntary Disclosure Index
Strategy
1. Has provided a statement of corporate goals or objectives?
2. Has provided a general statement of corporate strategy?
3. Have commented on actions taken to achieve the corporate goal?
4. Has provided a period for achieving corporate goals?
5. Has provided attitude towards ethic questions?
6. Has provided strategy towards environmental issues?
7. Has provided detailed segment performance?
8. Have provided changes in ROCE (Return on capital employed) or EVA (Economic
value added)?
9. Have provided commercial risk assessments?
10. Have provided financial risk assessments?
11. Have commented on interest or exchange risks?
12. Have commented on other risk assessments?
Competition and outlook
13. Have identified the principal markets?
14. Have described specific characteristics of these markets?
15. Have estimated the market sizes?
16. Has provided Market share?
17. Have commented on the competitive landscapes?
18. Have commented on barriers to entry?
19. Have estimated the market growths?
20. Has commented on change in market shares?
21. Has commented on impact of barriers to entry on profits?
Page 63
52
22. Has commented on the impact of competition on profits?
23. Has estimated a forecast of market share?
24. Has commented on impact of barriers to entry on future profits?
25. Has commented on the impact of competition on future profits?
Production
26. Has provided a general description of the business?
27. Have identified the principal products/services?
28. Have described specific characteristics of these products/services?
29. Has commented on speed to market?
30. Have commented on R&D expenditures?
31. Have commented on investments in production?
32. Has commented on product development cycle?
33. Has commented on ratio of inputs to outputs on outputs?
34. Have commented on new products?
35. Have commented on rejection/defect rates?
36. Has commented on volume of materials consumed?
37. Have commented on changes in production methods?
38. Have commented on changes in product materials?
Marketing strategy
39. Has provided a marketing strategy?
40. Has described a sales strategy?
41. Have described distribution channels?
42. Have provided sales and marketing costs?
43. Have commented on brand equity/visibility ratings?
44. Have commented on customer turnover rates?
Page 64
53
45. Has commented on customer satisfaction level?
46. Has commented on customer mix?
47. Have commented on revenues from new products/services?
48. Has provided order backlog?
49. Has provided percent of order backlog to ship next year?
50. Has provided amount of new orders placed this year?
51. Has commented on change in inventory?
Human capital
52. Has commented on experience of management team?
53. Has provided description of workforce?
54. Has provided amount spent on education?
55. Have provided employee retention rates?
56. Has provided average revenue per employee?
57. Has provided average age of key employees?
58. Has provided age of key employees?
59. Has provided other measurement of intellectual capital?
60. Has provided investment in ERP?
61. Has commented on strategy for measurement of human capital?
62. Has commented on strategy regarding ERP system
Page 65
54
Appendix 3: Computation of Stock Market Returns
Stock
Start
Price
End
Price
Divid
ends
Capital
gain
Dividend+Ca
pital gain
Stock
market
return
a b c d=b-c e=c+d f=e/a
Centum Investment
Company 0.50
AccessKenya Group
Pan Africa Insurance
Holdings
ScanGroup
CFC Stanbic
Holdings 5.00
Housing Finance Co
Total Kenya
Crown Paints Kenya
Car & General (K)
Jubilee Insurance
Co.
Kenya Commercial
Bank
KenGen.
Rea Vipingo
Plantations
Nation Media Group
Unga Group
Kakuzi
Equity Bank
Sameer Africa
Williamson Tea
Kenya
TPS Eastern Africa
Page 66
55
Appendix 4: Voluntary Disclosure Index (𝑿𝒏), and Stock Returns(Y)
Company Name Year X1 X2 X3 X4 Y
Centum Investment Company 0.50
2009
2010
2011
2012
2013
AccessKenya Group
2009
2010
2011
2012
2013
Pan Africa Insurance Holdings
2009
2010
2011
2012
2013
ScanGroup
2009
2010
2011
2012
2013
CFC Stanbic Holdings 5.00
2009
2010
2011
2012
2013
Housing Finance Co
2009
2010
2011
2012
2013
Total Kenya
2009
2010
2011
2012
2013
Crown Paints Kenya
2009
2010
2011
2012
2013
Car & General (K) 2009
2010
Page 67
56
2011
2012
2013
Jubilee Insurance Co.
2009
2010
2011
2012
2013
Kenya Commercial Bank
2009
2010
2011
2012
2013
KenGen
2009
2010
2011
2012
2013
Rea Vipingo Plantations
2009
2010
2011
2012
2013
Nation Media Group
2009
2010
2011
2012
2013
Unga Group
2009
2010
2011
2012
2013
Kakuzi
2009
2010
2011
2012
2013
Equity Bank
2009
2010
2011
2012
2013
Sameer Africa
2009
2010
2011
Page 68
57
2012
2013
Williamson Tea Kenya 2009
2010
2011
2012
2013
TPS Eastern Africa
2009
2010
2011
2012
2013
Total