THE EFFECT OF WASTE COOKING OIL ON THE WETTABILITY OF
WALLACE SANDSTONE
By
Zakir Ullah
Submitted in partial fulfillment of the requirements
for the degree of Master of Engineering
Major: Petroleum Engineering
at
Dalhousie University
Halifax, Nova Scotia
May 31, 2013
© Copyright by Zakir Ullah, 2013
i
DALHOUSIE UNIVERSITY
PETROLEUM ENGINEERING
The undersigned hereby certify that they have read and recommend to the Faculty of Graduate
Studies for acceptance a thesis entitled “THE EFFECT OF WASTE COOKING OIL ON THE
WETTABILITY OF WALLACE SANDSTONE” by Zakir Ullah in partial fulfillment of the
requirements for the degree of Master of Engineering.
Dated: May 31, 2013
Supervisor: ________________________
Dr. Jan Haelssig
Readers: ________________________
Dr. Adam Donaldson
ii
DALHOUSIE UNIVERSITY
DATE: May 31, 2013
AUTHOR: ZAKIR ULLAH
TITLE: THE EFFECT OF WASTE COOKING OIL ON THE WETTABILITY
OF WALLACE SANDSTONE
DEPARTMENT: PETROLEUM ENGINEERING
DEGREE: M.Eng. CONVOCATION: YEAR: October 8th
, 2013
Permission is herewith granted to Dalhousie University to circulate and to have copied for non-
commercial purposes, at its discretion, the above title upon the request of individuals or
institutions. I understand that my thesis will be electronically available to the public.
The author reserves other publication rights and neither the thesis nor extensive extracts from it
may be printed or otherwise reproduced without the author’s written permission.
The author attests that permission has been obtained for the use of any copyrighted material
appearing in the thesis (other than the brief excerpts requiring only proper acknowledgement in
scholarly writing), and that all such use is clearly acknowledged.
________________________
Signature of Author
iii
Dedicated to my family
iv
CONTENTS
LIST OF TABLES ....................................................................................................................... vi
LIST OF FIGURES .................................................................................................................... vii
ABSTRACT ................................................................................................................................ viii
LIST OF ABBREVIATIONS AND SYMBOLS USED ........................................................... ix
ACKNOWLEDGEMENTS ........................................................................................................ xi
Chapter 1 Introduction................................................................................................................. 1
1.1 Background ........................................................................................................................... 1
1.2 Objectives .............................................................................................................................. 3
Chapter 2 Literature Review ....................................................................................................... 4
2.1 The Global Warming Effect .................................................................................................. 4
2.2 Geological Sequestration of CO2 .......................................................................................... 5
2.2.1 Options for Geological Storage of CO2 .......................................................................... 6
2.2.2 CO2 Trapping Mechanisms ............................................................................................ 7
2.3 CO2 Sequestration Mechanism .............................................................................................. 9
2.3.1 Phase Behaviour of CO2 ................................................................................................. 9
2.3.2 CO2 Flow in Reservoir Formation Rocks ..................................................................... 10
2.4 Waste Cooking Oil .............................................................................................................. 11
2.5 Solubility of Waste Cooking Oil in SCCO2 ........................................................................ 13
2.6 Viscosity of SCCO2 Containing Fats .................................................................................. 14
Chapter 3 Flow through Porous Media .................................................................................... 16
3.1 Porosity................................................................................................................................ 16
3.2 Permeability ........................................................................................................................ 17
3.3 Surface and interfacial tension ............................................................................................ 19
3.4 Capillary Pressure ............................................................................................................... 20
3.5 Saturation ............................................................................................................................ 21
3.6 Gravity Forces ..................................................................................................................... 22
3.7 Viscous Forces .................................................................................................................... 22
3.8 Wettability ........................................................................................................................... 23
3.8.1 Wettability Measurement ............................................................................................. 25
3.8.2 Spontaneous Imbibition ................................................................................................ 29
v
3.9 Instability Phenomenon ....................................................................................................... 30
3.9.1 Mobility ........................................................................................................................ 30
3.9.2 Mobility Ratio............................................................................................................... 31
3.9.3 Fingering ....................................................................................................................... 31
3.10 Crude Oil/Brine/Rock Interaction ..................................................................................... 32
Chapter 4 Experimental Work .................................................................................................. 35
4.1 Rock materials ..................................................................................................................... 35
4.2 Fluid System ........................................................................................................................ 37
4.2.1 Brine ............................................................................................................................. 37
4.2.2 Waste Cooking Oil ....................................................................................................... 38
4.2.3 Crude Oil ...................................................................................................................... 38
4.3 Experimental Procedures..................................................................................................... 39
4.3.1 Core Cleaning ............................................................................................................... 39
4.3.2 Core Saturation ............................................................................................................. 39
4.3.3 Determination of Porosity ............................................................................................ 39
4.3.4 Determination of Absolute Permeability ...................................................................... 40
4.4 Spontaneous Imbibition and Amott wettability test ............................................................ 42
4.4.1 Spontaneous Imbibition Equipment ............................................................................. 42
4.4.2 Spontaneous imbibition of core samples ...................................................................... 43
4.4.3 Water Flooding of Core samples after Spontaneous Imbibition .................................. 44
Chapter 5 Results and Discussions ............................................................................................ 47
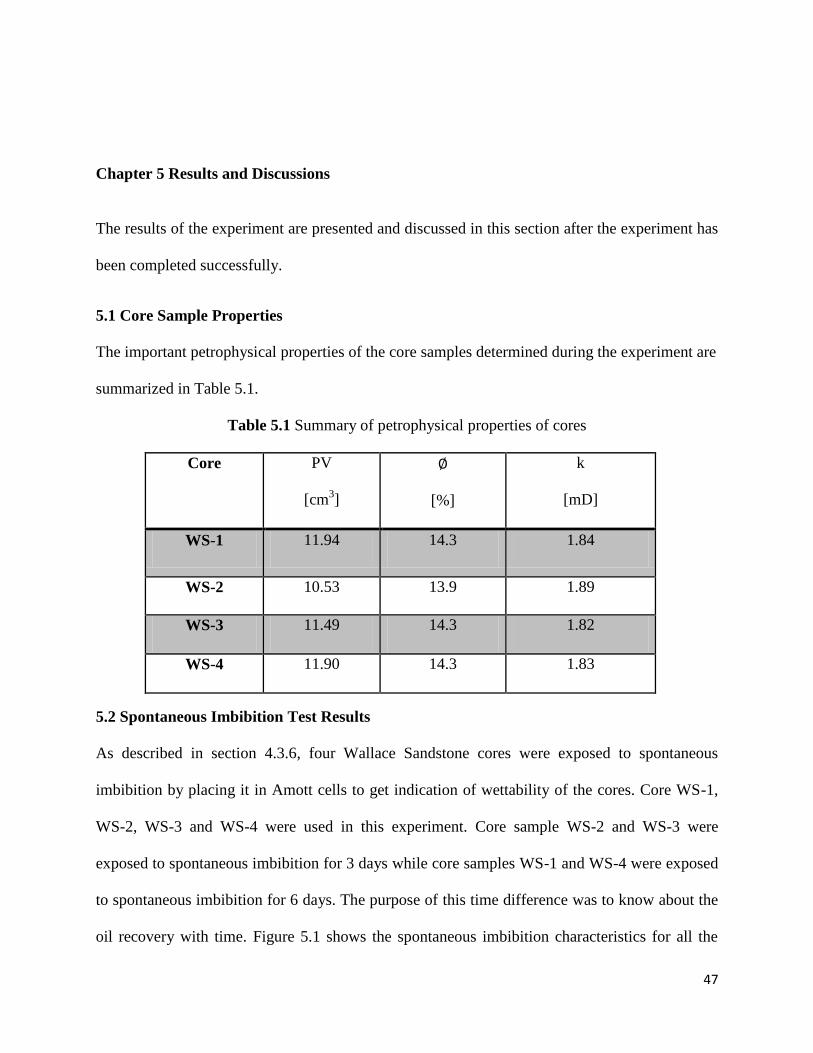
5.1 Core Sample Properties ....................................................................................................... 47
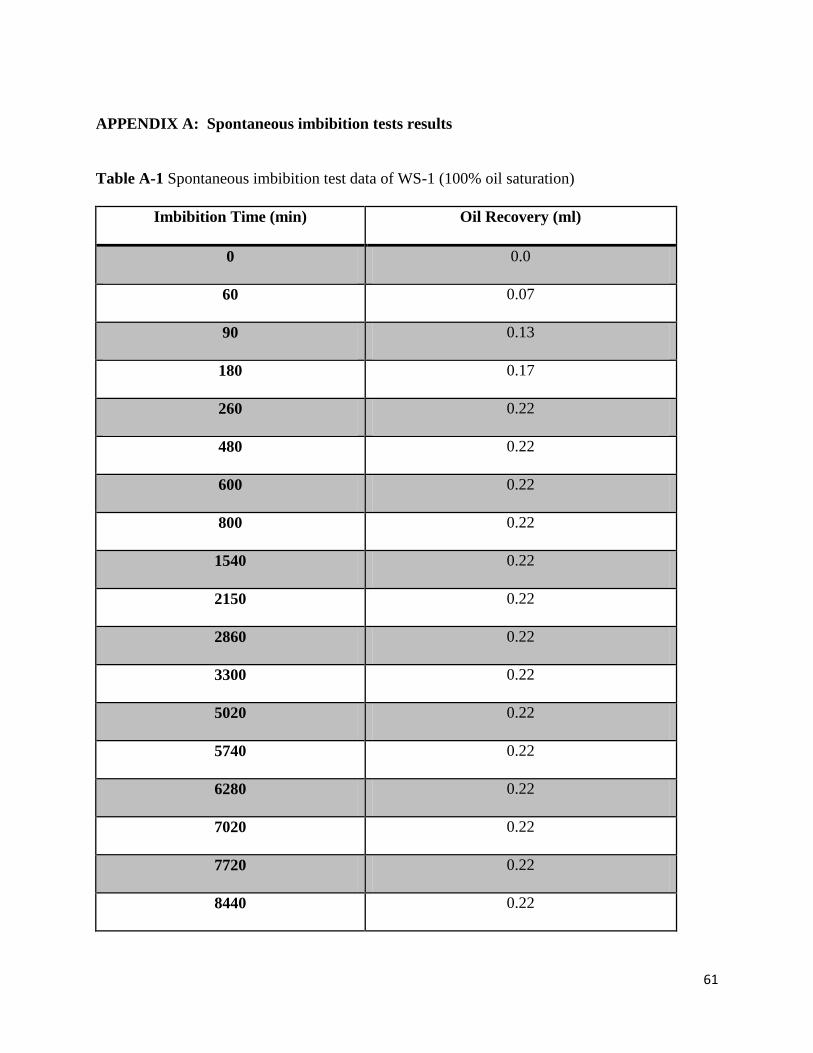
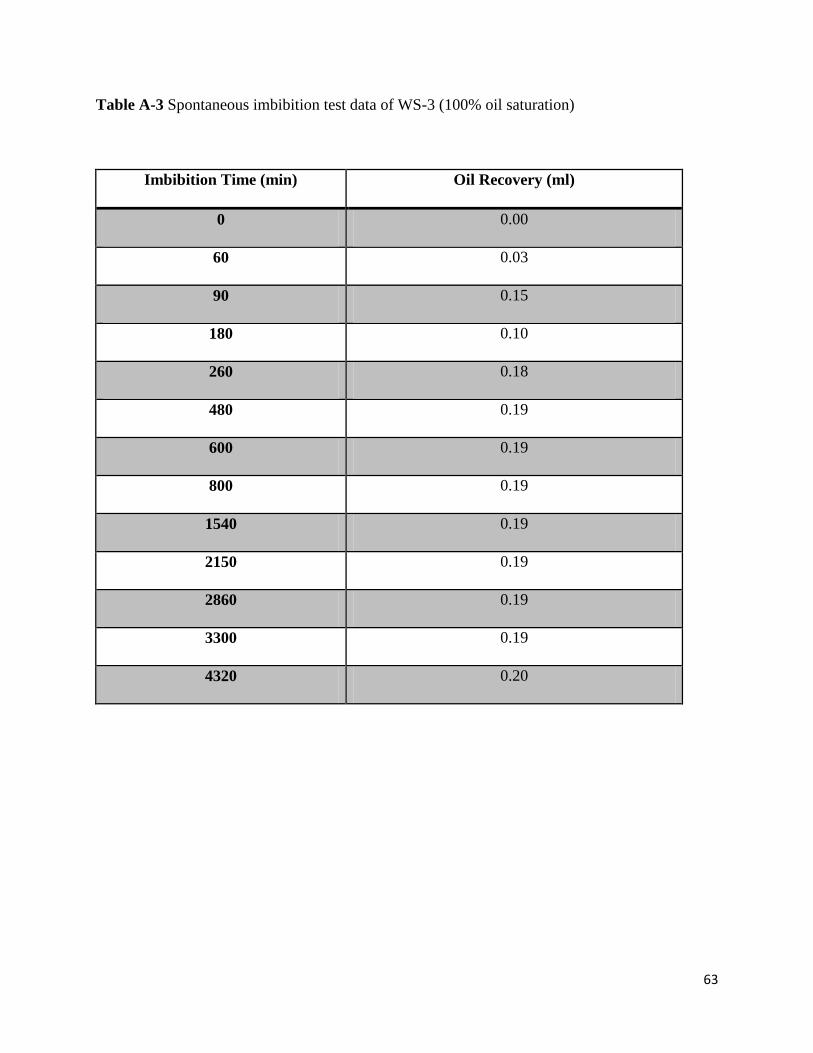
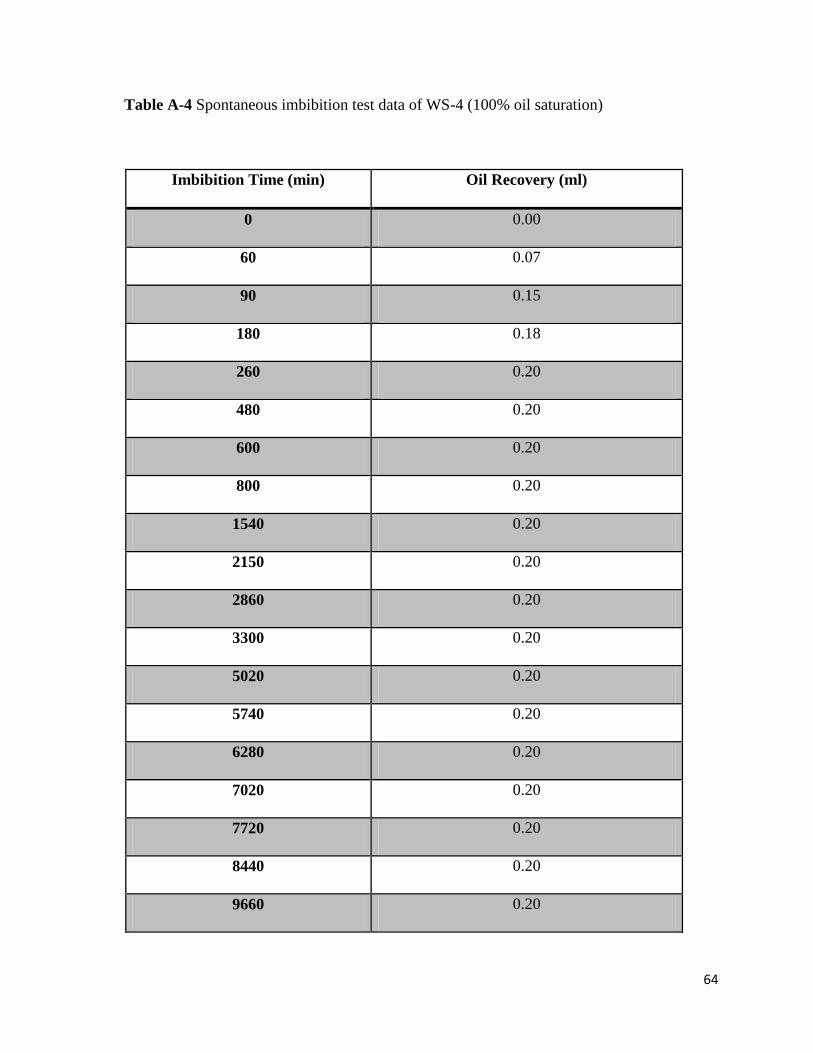
5.2 Spontaneous Imbibition Test Results .................................................................................. 47
5.2 Results of Amott Wettability Test on all core ..................................................................... 49
5.3 General Discussion .............................................................................................................. 50
Chapter 6 Conclusions and Recommendations ........................................................................ 53
6.1 Conclusions ......................................................................................................................... 53
6.2 Recommendations ............................................................................................................... 53
REFERENCES ............................................................................................................................ 55
APPENDIX A: Spontaneous Imbibition Tests Results .......................................................... 61
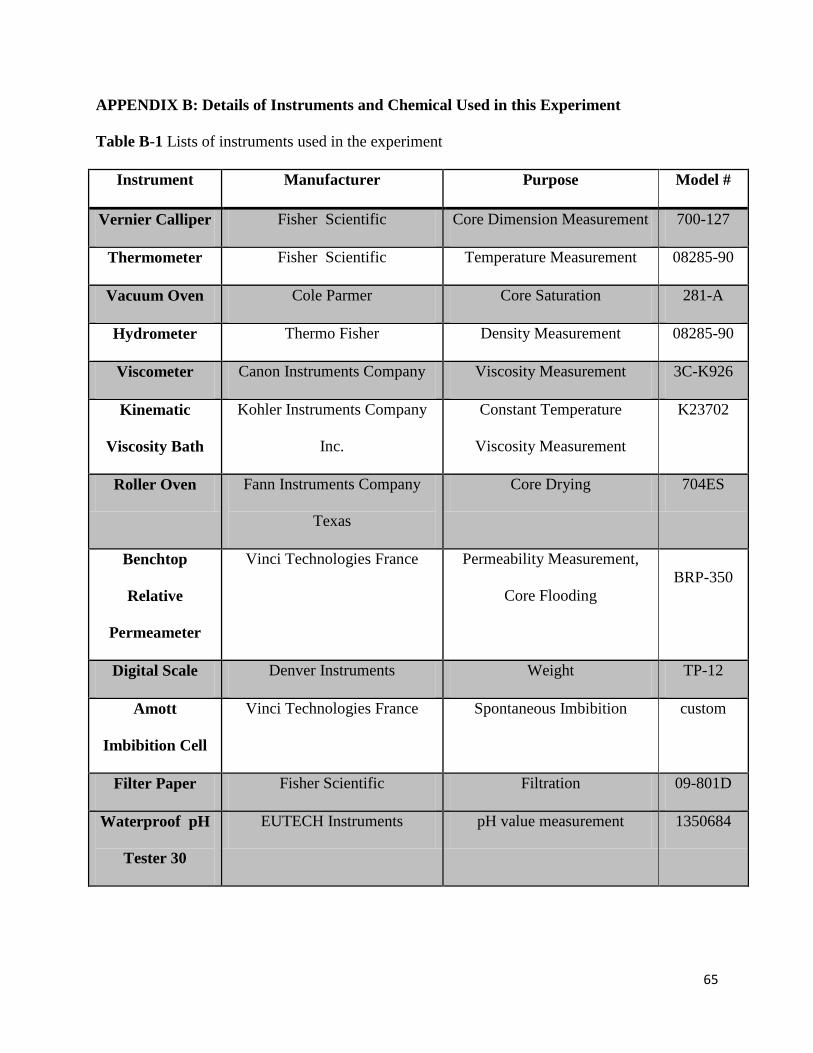
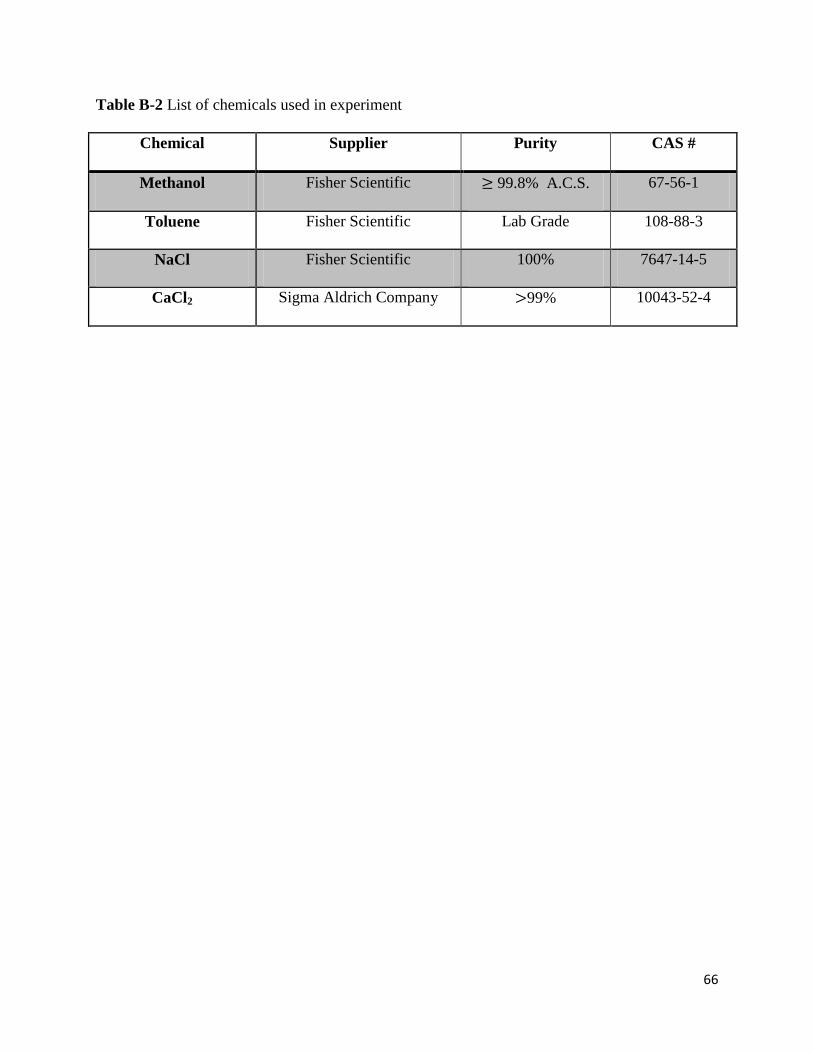
APPENDIX B: Details of Instruments and Chemical Used in this Experiment ................... 65
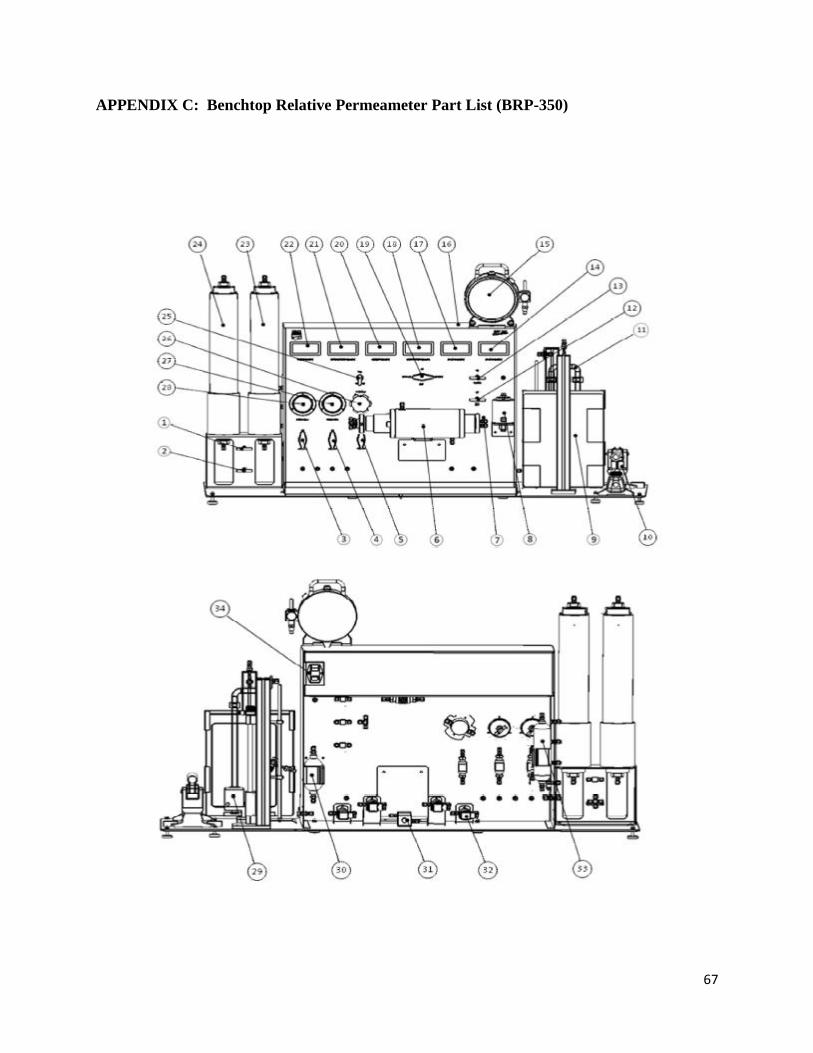
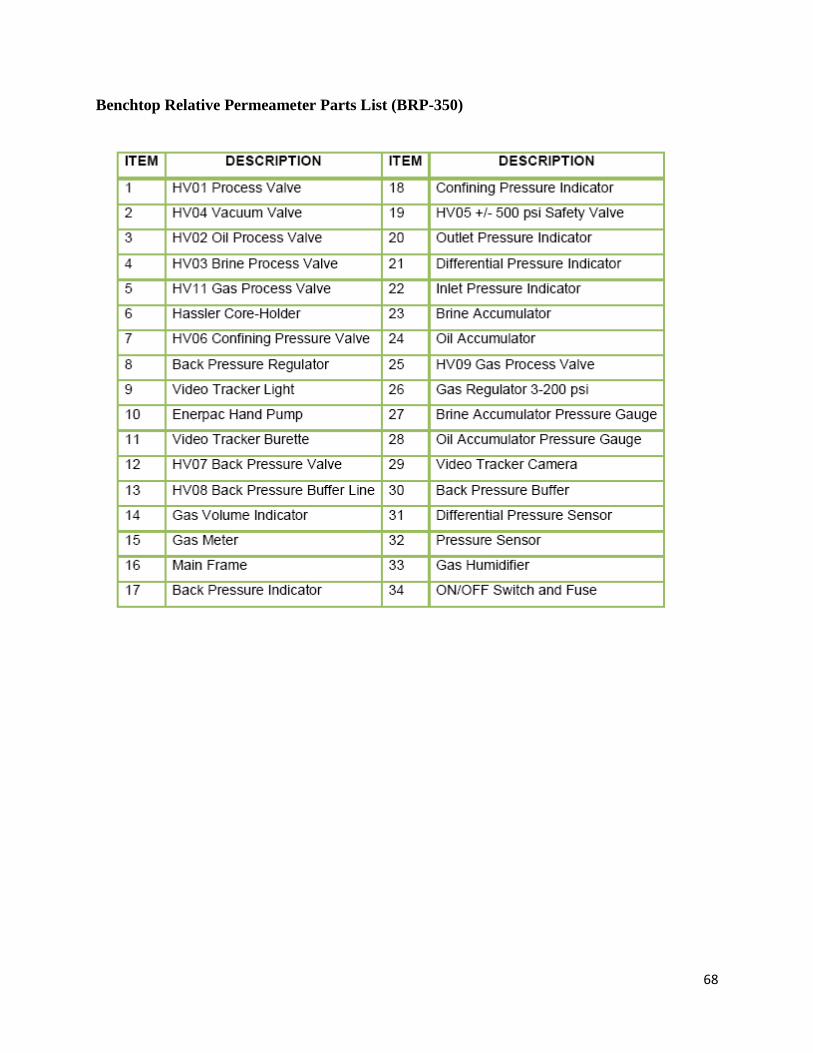
APPENDIX C: Benchtop Relative Permeameter Part List (BRP-350) ................................ 67
vi
LIST OF TABLES
Table 2.1 Main groups of compounds formed during frying (Dobarganes, 2009) ....................... 12
Table 2.2 Extractability as a function of CO2 density (Marsal et al., 2000) ................................. 13
Table 2.3 Estimated viscosity of SCCO2 saturated with a solute at various temperatures and
pressures (Tuan et al., 1999)……………………………………………………………………..14
Table 3.1 Classification of rock permeability (Zhangxin, 1962) .................................................. 18
Table 4.1Mineral Analysis of wallace sandstone (Wallace Quarries Ltd, 2001) ......................... 36
Table 4.2 Properties of cores ........................................................................................................ 37
Table 4.3 Composition of the brine used in experiment ............................................................... 38
Table 4.4 Benchtop relative permeameter (BRP 350) features .................................................... 41
Table 5.1 Summary of specific core parameters ........................................................................... 47
Table 5.2 Amott wettability index for core samples ..................................................................... 50
vii
LIST OF FIGURES
Figure 2.1 Variation of CO2 density with depth (IPCC, 2005) ..................................................... 10
Figure 3.1 Use of capillary tube to measure capillary pressure (Melberg, 2010) ......................... 21
Figure 3.2 Wettability of oil, water and rock system (Jim, 1992) ................................................ 23
Figure 3.3 Amott test techniques (Glover, 1998) ......................................................................... 27
Figure 3.4 Viscous fingering process (Cosse, 1993) .................................................................... 32
Figure 4.1 Wallace sandstone cores used in this experiment ........................................................ 36
Figure 4.2 Benchtop relative permeameter (BRP-350) used in this experiment .......................... 42
Figure 4.3 Amott imbibition cells used in this experiment ........................................................... 43
Figure 4.4 Oil recovery by spontaneous imbibition...................................................................... 44
Figure 4.5 Brine recovery by spontaneous imbibition .................................................................. 46
Figure 5.1 Spontaneous imbibition with brine results for all cores (100% oil saturation) ........... 48
viii
ABSTRACT
Geological sequestration of Carbon dioxide (CO2) is considered as one of the most promising
methods for the reduction of anthropogenic emissions of carbon dioxide (CO2) into the
atmosphere. Deep saline aquifers are considered to be the best storage sites for geological
sequestration of CO2 because of their huge storage capacity and widespread availability around
the world. CO2 injection into the saline aquifers will induce different coupled physical and
chemical processes including multiphase flow, solute transport and chemical reaction of CO2
with different reservoir fluids and minerals. The displacement of formation brine by supercritical
CO2 (SCCO2) is considered to be an unstable immiscible displacement process due to
unfavourable viscosity ratio and density contrast between CO2 and the resident brine, resulting
hydrodynamic instabilities including viscous fingering and gravity override. To reduce viscous
fingering and improve the stability of the displacement process, the increase in viscosity of CO2
by the use of soluble organics (animal fats, waste cooking oil) has been suggested.
The purpose of this study is to examine the effects of waste cooking oil on the wettability of the
formation. In this project, spontaneous imbibition characteristics and how waste cooking oil-
brine-rock interactions affects wettability are studied. A comparative study was performed for
waste cooking oil and crude oil using four Wallace sandstone core samples. Spontaneous
imbibition and Amott wettability test were conducted under laboratory conditions for Wallace
sandstone core samples. The results obtained show that the interaction of both types of oil with
Wallace sandstone core samples have changed their wettability from water wet to near neutral
wet.
ix
LIST OF ABBREVIATIONS AND SYMBOLS USED
API American Petroleum Institute
BRP Benchtop Relative Permeameter
BV Bulk Volume [cm3]
CCS Carbon Capture and Storage
GHG Greenhouse Gases
Gt Giga Tonne
H Height [ft]
IFT Interfacial Tension [dynes/cm]
k Permeability [mD]
kr Relative permeability [Dimensionless]
ke Effective permeability [mD]
L Length [cm]
M Mobility ratio [ Dimensionless]
Pc Capillary pressure [psi]
Pnw Pressure of the non-wetting phase [psi]
Pw Pressure of the wetting phase [psi]
PV Pore volume [cm3]
r Capillary-tube radius [ft]
SCCO2 Supercritical Carbon Dioxide
Wet weight [g]
Dry weight [g]
q Flow rate [cm3/sec]
SI Spontaneous Imbibition
Sg, So, Sw Gas, oil and water saturation respectively [fraction]
WI Wettability index
µ Viscosity [cP]
Density of brine [g/cm3]
Porosity [%]
x
σws Water-Soild IFT [dynes/cm]
σow Oil-Water IFT [dynes/cm]
θc Contact angle [Degrees]
λ Mobility [mD/cP]
xi
ACKNOWLEDGEMENTS
I would like to express my utmost gratitude to Dr. Michael J. Pegg for providing me the
opportunity to work on this interesting project. I am thankful to Dr. Jan Haelssig for his
supervision, advice and guidance throughout this work. I also want to thank Dr. Adam
Donaldson for accepting to be my reader and for extending his support for this project.
I am also thankful to Mr. Mumuni Amadu (PhD student) for his technical support and guidance
throughout the project. I am also grateful to Matt Kujath of Dalhousie University, and Jean of
Vinci Technologies for their technical support.
Special thanks to my friends for their moral support. I would like to express my deepest gratitude
to my parents for their encouragement, prayers and continuous support, which supplied me the
source of inspiration to complete this study.
Finally I acknowledge the Department of Petroleum Engineering and Faculty of Graduate
Studies Dalhousie University for providing me the opportunity to undertake my graduate studies
at Dalhousie University.
1
Chapter 1 Introduction
1.1 Background
The global average temperature of the earth is maintained by greenhouse effect (Hartai, 2012).
The concentration of greenhouse gases in the atmosphere has increased causing global warming.
Carbon dioxide (CO2) is one of the most important greenhouse gases. The current concentration
of CO2 in the atmosphere is 390.5 ppm which has increased from the concentration before the
Industrial Revolution (cdiac, 2012). Carbon Capture and Storage (CCS) is one of the
technologies that can reduce the amount of CO2 released into the atmosphere from the use of
fossil fuel in power plants and other industries. CCS involves the collection or capture of CO2
produced from power plants and other industries, transportation of the captured CO2 to a suitable
storage site and then pumping it deep underground into the rocks for permanent storage away
from the atmosphere. These underground formations may be deep saline aquifers, depleted oil
and gas reservoirs, unmineable coal seams, and deep ocean sediments (IPCC, 2005). Among
these underground formations, deep saline aquifers are consider to be the best storage sites due to
the fact that they are readily available and ubiquitous worldwide, providing an estimated
potential storage volume of 10,000 Gt (Stauffer et al., 2011).
CO2 sequestration in deep saline aquifers involves injection of SCCO2 into these formations
displacing in-situ fluids (brine) from the pore spaces of rocks. The displacement process is
directly affected by the physical and chemical properties of both the injected SCCO2 and
displaced formation fluids (e.g. viscosity, interfacial tension, density, solubility), hydrodynamic
2
forces such as capillary pressure endured during the process, and physical and chemical
properties of the porous matrix (e.g. pore size or permeability distribution, wettability of the
solid surface) (Zhang et al, 2011). Due to lower density and viscosity of CO2 as compared to
that of water, the CO2 produces hydrodynamic instabilities, causing viscous fingering and gravity
override (Garcıa and Pruess, 2003). To reduce viscous fingering and improve the stability of
the displacement process, it has been suggested to increase the viscosity of CO2 by the use of
soluble organics (waste cooking oil, animal fats) (Amadu and Pegg, 2013).
In the petroleum industry, viscosification of CO 2 is achieved by the use different chemicals such
as trialkytin fluorides and aluminum disoap, but these chemicals are very expensive which makes
the cost of the project very high (Enick and Olsen, 2012). In geological sequestration of CO2,
where no valuable product is obtained, the use of such chemicals will increase the operating cost
of the project. Therefore there is a need for a cheaper alternative that will dissolve in supercritical
CO2 and will increase its dynamic viscosity. One such possible cheap source for increasing the
viscosity of CO2 is fats, which are available in abundance (Stoytcheva, 2011). Organic
compounds such as fats dissolve in SCCO2 and increase its viscosity.
Wettability of reservoir rock and minerals is an important factor in controlling the mobility,
residual trapping and caprock breakthrough pressure (leakage) of the injected CO2. Wettability of
reservoir rocks strongly influences CO2 flow and distribution, and quantities of residual trapping.
(Kim et al, 2012). Knowledge of the wettability of reservoir rock and its effects on petro-
physical properties and CO2 sequestration are important factors that are considered in CO2
sequestration.
3
Displacement characteristics of gas-oil-brine-rock systems have been thoroughly investigated in
petroleum sector and there is a lot of data available for CO2-oil-brine-rock systems as a result of
its use for enhanced oil recovery. There is also literature work which describes CO2 and reservoir
rocks interaction (Kim et al., 2012; Wang et al., 2012; Rosenbauer et al., 2005). However
there is no data available for waste cooking oil-brine- rock interaction and this research, together
with its primary objectives, serves to bridge this gap in knowledge and data availability of such
systems.
1.2 Objectives
The main purpose of this study is to investigate the effect of waste cooking on the wettability.
This will be investigated by performing a comparative study for waste cooking oil and crude oil.
Wallace sandstone core samples will be subjected to spontaneous imbibition and Amott test. The
changes in wettability will be observed from oil/brine/rock interaction.
4
Chapter 2 Literature Review
The literature review consists of two sections. The first section describes the global warming
effect, geological sequestration of CO2, waste cooking oil and the viscosity of SCCO2 having
waste cooking oil. The second part focuses on flow through porous media, the forces that
influences flow in porous media, instable displacement, wettability and different mechanisms
that may cause alteration in wettability.
2.1 The Global Warming Effect
The Earth’s atmosphere contains a number of different gases, including greenhouse gases
(GHG). According to the Intergovernmental Panel on Climate Change (IPCC, 2001)
"Greenhouse are those gaseous constituents of the atmosphere, both natural and anthropogenic,
that absorb and emit radiation at specific wavelengths within the spectrum of infrared radiation
emitted by the Earth's surface, the atmosphere and clouds. This property causes the greenhouse
effect. Water vapour (H2O), carbon dioxide (CO2), nitrous oxide (N2O), methane (CH4) and
ozone (O3) are the primary greenhouse gases in the Earth's atmosphere."
The global average temperature of the Earth is maintained by sunlight received, reflected and
heat energy trapped and reradiated back to the earth by the atmosphere. The gases which absorb
and reradiate the emissions are GHG and this process is called the greenhouse effect. The earth is
progressively becoming warmer by this process (Hartai, 2012). According to the U.S.
Environmental Protection Agency, global warming is defined as “The average increase in the
temperature of the atmosphere near the Earth’s surface and in the troposphere, which can
5
contribute to changes in global climate patterns. Global warming can occur from a variety of
causes, both natural and human induced. In common usage, “global warming” often refers to the
warming that can occur as a result of increased emissions of greenhouse gases from human
activities.” Due to anthropogenic carbon dioxide (CO2) emissions, the atmospheric
concentrations of CO2 have risen from 280 ppm to more than 392 ppm. This increase in
concentration of CO2 is affecting the Earth’s atmosphere energy balance, enhancing the
greenhouse effect and thereby causing a warming influence at the Earth’s atmosphere (Bachu,
2003).
Currently more than 40% of CO2 emissions are produced from power generation by electric
power plants worldwide. About 90% of the total primary energy sources in the world are fossil
fuel (Espinoza, 2011). The emission of CO2 is closely related to the use of fossil fuel. The IPCC
(2005) have suggested different options for the reduction of CO2 emission into the atmosphere.
Among them one potential method is the storage of CO2 in underground geological formations.
2.2 Geological Sequestration of CO2
According to Bachu (2003), geological sequestration of CO2 is “the removal of CO2 directly
from anthropogenic sources (capture) and its disposal in geological media either permanently
(sequestration) or for significant time periods (storage)”. Geological sequestration is considered
to have the greatest CO2 storage potential significant enough to result in noticeable reduction of
atmospheric CO2.
The geological storage of CO2 is a complex process and the important factors that should be
considered include preferential flow, sweep efficiency, leakage rates, CO2 dissolution kinetics,
mineral trapping kinetics, microbial interactions with CO2, and the influence of stress changes on
cap rock and formation integrity (Shukla et al., 2010).
6
2.2.1 Options for Geological Storage of CO2
There are several options available for the geological storage of CO2.
Depleted Oil and Gas Reservoirs
Depleted oil and gas reservoirs are suitable candidates for geological storage of CO2. After the
depletion of oil and gas reservoirs, CO2 may be stored in the available pore space previously
occupied by hydrocarbons. The injection of CO2 can also be used for the recovery of additional
oil that was left behind during primary production, known as enhanced oil recovery (Dooley et
al., 2006). The existing wells in these reservoirs provide immediate access to these reservoirs
and also a large amount of data is available about the characteristics of these reservoirs which
will be helpful in understanding the dynamics of CO2 storage.
Unmineable Coal Seams
CO2 can be stored in deep unmineable seams adsorption. Methane is found on the surface of
coal. When CO2 is injected, due to higher chemical preference for CO2 than methane, the coal
releases the previously adsorbed methane and adsorbs CO2. Methane can then be recovered by
enhanced coal bed methane (ECBM) technology. The theoretical global capacity for unmineable
coal seam is 140 GtCO2 (Dooley et al., 2006).
Deep Saline Formations
Deep saline formations offer encouraging storage opportunities because of their occurrence in
sedimentary basins throughout the world. In many parts of the world, injection of waste fluids
into deep saline formation is a common practice (Dooley et al., 2006). The minimum theoretical
global capacity of CO2 storage in deep saline aquifers is estimated to be 1000 GtCO2 (IPCC,
2005).
7
2.2.2 CO2 Trapping Mechanisms
The trapping of CO2 in deep geological formation is based on physical as well as chemical
processes. Structural and stratigraphic trapping by cap rocks, hydrodynamic trapping by slow
aquifer currents and capillary trapping by interfacial forces are types of physical trapping
mechanisms. While dissolution of CO2 in water, mineralization, CO2 adsorption on coal and rich
organic shale, and CO2 hydrate formation are included in chemical trapping (Espinoza et al,
2011).
Stratigraphic and Structural Trapping
This is the most dominant mechanism for trapping CO2. This phase in the trapping process refers
to the trapping of CO2 beneath a seal and requires the presence of structural and stratigraphic trap
of the same type as those that results in the accumulation of hydrocarbons. Structural trapping is
considered to be an unreliable method because CO2 remains mobile and the existence of pre-
existing well or the activation of a fault may cause leakage of CO2 to the shallow formations
(MacMinn and Juanes, 2009).
Hydrodynamic Trapping
In hydrodynamic tapping, CO2 is trapped as a gas or supercritical fluid under a low permeability
cap rock. This method is considered to be a fast trapping mechanism. The density of CO2 is less
than that of formation water therefore it will naturally rise to the top of reservoir. To prevent its
escape, low permeability cap rock is needed. Therefore, characterization of a caprock is
important requirement (Sengul, 2006).
8
Capillary Trapping
Capillary trapping of CO2 occurs during water flooding when the gas saturation is decreasing and
water saturation increases as water invades the pore space. During CO2 injection into the
geological formation, the gas saturation increases in a drainage like process. Due to buoyancy
forces the gas phase migrates upward to the top of the aquifer as it moves away from the
injection well. Once the injection stops, the CO2 continues to migrate upward. At the leading
edge of the plume, gas continues to displace water in a drainage process (increasing gas
saturations) while at the trailing edge water displaces gas in an imbibition process (increasing
water saturations). The presence of an imbibition saturation path leads to snap-off and
subsequently causes trapping of the gas phase. As the plume migrates upward a trail of residual
immobile CO2 is left behind (Juanes et al., 2006). This method is also known as residual
trapping.
Solubility Trapping
CO2 dissolves in other fluids in its gaseous and supercritical state. The injected CO2 dissolves in
formation brine. This dissolving of CO2 in formation brine increases the density of the CO2. The
CO2 saturated brine is denser than the surrounding formation fluids. Therefore it migrates deeper
into the formation and slowly dilutes through contact with unsaturated brine at depth.
Mineral Trapping
Mineral trapping is also an important mechanism but it takes a very long time as compared to
other trapping mechanisms. In this process, CO2 dissolves in formation brine forming carbonic
acid (H2CO3). This weak acid reacts with the minerals in the surrounding rock, forming
carbonate minerals which are then stored as a chemical compound.
9
2.3 CO2 Sequestration Mechanism
2.3.1 Phase Behaviour of CO2
CO2 gas is colourless, odourless and is denser than air. The critical point at which CO2 becomes
a supercritical fluid is 31.1 °C and 7.38 MPa. In the supercritical state, large gradients in
properties such as density, viscosity and solvent strength can occur at conditions near the phase
boundary. CO2 is preferably injected in saline aquifers in the supercritical state. The density of
CO2 at supercritical state is higher than CO2 gaseous state. The density of CO2 at supercritical
condition ranges from 150 kg/m3 to over 800 kg/m
3. The density of CO2 stored in underground
formations depends on the pressure and temperature. Assuming hydrostatic pressure and a
geothermal gradient of 25°C/km from 15°C at the surface, the density of CO2 increases rapidly at
approximately 800m depth, when CO2 reaches a supercritical state as shown in figure 2.1. Cubes
shown in the figure 2.1 represents the relative volume occupied by the CO2 and down to 800m,
this volume can be seen to dramatically decrease with depth. At depths below 1.5 km, the density
and specific volume become nearly constant (IPCC, 2005). The solubility of CO2 in water
increases with increasing pressure and decreases with increasing temperature. In a typical
sequestration reservoir, the temperature and pressure are generally higher than the super critical
values of CO2 but the hydro- mechanical conditions in the reservoir may change in some cases
resulting a change in the phase and behaviour of injected CO2 (Shukla et al., 2010).
10
Figure 2.1 Variation of CO2 Density with depth (IPCC, 2005)
2.3.2 CO2 Flow in Reservoir Formation Rocks
CO2 injection into saline aquifers for storage can be classified as an immiscible displacement
process. During CO2 sequestration, the injection of CO2 into saline aquifers will induce different
physical and chemical processes. The displacement of the resident brine by less dense and less
viscous CO2 is a complex process and is affected by viscous, capillary and buoyancy forces. The
flow is subjected to hydrodynamic instabilities including viscous fingering and gravity override.
According to Garcia (2003), the injection of CO2 into saline aquifers also increases the pore
pressure as there is no production of fluids which may balance the system pressure. As a result,
the pore pressure increases which may alter the effective stress state causing variations in
porosity and permeability. A large change in the stress field can cause leakage of CO2 through
the fractured rocks. Another important process that is considered in CO2 sequestration is the
effect of injected CO2 on formation fluids and minerals. CO2 dissolves in formation brine
11
forming carbonic acid which may react with different rocks. CO2 can also react with certain
minerals directly forming precipitates of carbonates which decreases porosity and can also
reduce permeability.
2.4 Waste Cooking Oil
Waste cooking oil and animal fats are available in huge quantities around the world. The
management and disposal of such oils and fats is a great problem and requires the use of proper
disposal method to avoid possible contamination of the water and land resources. Due to
concerns over sustainability, environmental issues and raw material costs, the use of waste
cooking oil is very attractive to industries. The use of all waste oils as domestic animal feed has
been banned by the European Union because of the harmful compounds that are formed during
frying process (Lam et al., 2010).
Cooking oil is glycerol ester of fatty acids. Cooking oil comprises of fat molecules, which are
composed of triesters. When an acid and alcohol reacts it releases water and forms an organic
compound known as ester. A triester is an organic compound that is formed as a result of
chemical reaction of a molecule that contains three hydroxyl groups (-OH) called glycerol and
three fatty acid molecules, each composed of long hydrocarbon chains (R) and a carboxylic acid
group (-COOH). The terms “oils” is used for fats that are liquid at room temperature while
“fats” that are solid at room temperature are known as fats (Nolte, 2011). Triglycerides are the
main components of fats and oil (95%), while the minor components are mono and diglycerides,
free fatty acids, phosphatides, sterols, fat soluble vitamins, tocopherols, pigment, waxes, and
fatty alcohols. Based on the source of oil, the free fatty content varies from oil to oil (AOCS,
2006). Triglycerides molecules are composed of carbon and hydrogen atoms with only six
12
oxygen atoms per molecule which means that fats and oil are highly reduced (un-oxidized). In
this way they are similar to the hydrocarbons in petroleum (Shakhashiri, 2008).
Waste cooking oil is the product of used cooking oil. Most of the cooking oil is used for deep-
frying processes. During frying, oil is heated under atmospheric condition at temperature of
(160-190 °C) for long period of time again and again. Due to continuous use of same oil for
frying, various physical and chemical changes occur in the oil. Some physical changes that are
commonly observed in vegetable oil after frying are increase in viscosity, increase in specific
heat, change in surface tension and change in colour. In addition, the oil is also subjected to three
types of reactions during frying, mainly thermolytic, oxidative and hydrolytic. These three
reactions cause the formation of many undesirable and harmful compounds if the oil is used
repeatedly (Lam et al., 2010). The table below summarizes the main group of alteration
compounds that are formed during frying process in the presence of air and moisture from oil
and fats at high temperature of around 180° C.
Table 2.1 Main groups of compounds formed during frying (Dobarganes, 2009)
ALTERATION CAUSATIVE
AGENT
NEW COMPOUNDS
Hydrolysis Moisture Fatty acids
Diacylglycerols
Oxidation Air Oxidized monomeric triacylglycerols
Oxidized dimeric and oligomeric triacylglycerols
Volatile compounds (aldehydes, ketones,
alcohols, hydrocarbons, etc.)
Thermal alteration Temperature Cyclic monomeric triacylglycerols
Isomeric monomeric triacylglycerols
Nonpolar dimeric and oligomeric triacylglycerols
13
Hydrolysis takes place due to the presence of moisture in the food. The process involves the
breaking of ester bonds, releasing free fatty acids, diacylglycerols and non-volatile compounds
with molecular weight significantly lower than that of the parent triacylglycerols. Additionally
oxidation and thermal alteration occurs in the unsaturated fatty acids due to the presence of air
and exposure to high temperature forming triacylglycerols with at least one of the three fatty acyl
chains altered. The new compounds that are formed have higher polarity than the polarity
possessed by the initial triglycerides (Ruiz-Méndez et al., 2008).
2.5 Solubility of Waste Cooking Oil in SCCO2
CO2 is the most widely used fluid in supercritical fluid extraction (SFE) technology. SCCO2 is
nontoxic, shows greater affinity to volatile (lipophilic) compounds, easily and completely
removable from any extract at low critical temperature and pressure (Mićić et al, 2011). The
solubility of fats in SCCO2 is evident from food and pharmaceutical industry. The use of SCCO2
for the production of high grade leather products also shows the solubility of animal fats in
SCCO2 (Marsal et al., 2000). The solubility of fats in SCCO2 can be seen from Table 2.2
14
Table 2.2 Extractability as a function of CO2 Density (Marsal et al., 2000)
a Fat extracted by SCCO2
b Fat determined by extraction with methylene chloride after the degreasing process
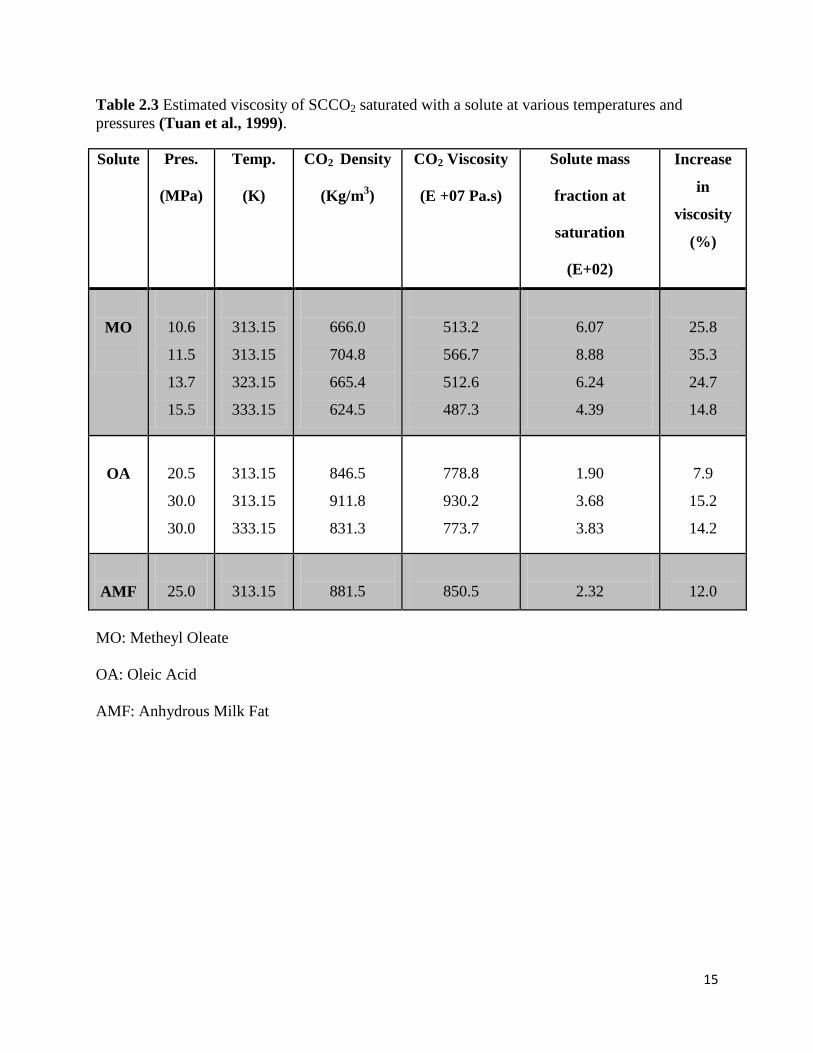
2.6 Viscosity of SCCO2 Containing Fats
SCCO2 behave like a liquid due to high density and at the same time behave like a gas due to its
viscosity that is in the range of gases. To get an idea about the viscosity of SCCO2 containing
fats, the previous published work is reviewed. Yener et al. (1998) measured the viscosities of
SCCO2 containing different levels of methyl oleate and oleic acid. Both the systems were
evaluated at different pressures and temperatures. The evaluation indicated the linear increase of
relative viscosity with concentration. The SCCO2 viscosity increased by 15-20%.at maximum
ethyl oleate concentration (4-5 wt. %) and 6-12 % at the maximum oleic acid concentration (2-3
wt. %). Table 2.3 shows the estimated viscosity of SCCO2 saturated with solute at various
temperatures.
CO2 Density
(g/ml)
0.55 (104 bar)
Extracted fata
(mg)
2.5
1.5
1.5
4.0
Residual fatb
(mg)
40.4
45.2
37.4
36.6
Total fat
(mg)
42.9
46.6
38.9
40.6
Degreasing
Efficiency (%)
6.0
3.2
3.8
9.8
0.70 (133 bar) 6.1
5.2
13.7
6.5
41.1
36.5
31.5
30.7
47.2
41.7
45.2
37.2
13.0
12.5
30.3
17.5
0.85 (240 bar) 24.5
22.4
23.6
23.8
18.3
21.7
19.4
21.4
42.8
44.1
43.0
45.2
57.2
50.8
54.9
52.6
15
Table 2.3 Estimated viscosity of SCCO2 saturated with a solute at various temperatures and
pressures (Tuan et al., 1999).
Solute Pres.
(MPa)
Temp.
(K)
CO2 Density
(Kg/m3)
CO2 Viscosity
(E +07 Pa.s)
Solute mass
fraction at
saturation
(E+02)
Increase
in
viscosity
(%)
MO
10.6
11.5
13.7
15.5
313.15
313.15
323.15
333.15
666.0
704.8
665.4
624.5
513.2
566.7
512.6
487.3
6.07
8.88
6.24
4.39
25.8
35.3
24.7
14.8
OA
20.5
30.0
30.0
313.15
313.15
333.15
846.5
911.8
831.3
778.8
930.2
773.7
1.90
3.68
3.83
7.9
15.2
14.2
AMF
25.0
313.15
881.5
850.5
2.32
12.0
MO: Metheyl Oleate
OA: Oleic Acid
AMF: Anhydrous Milk Fat
16
Chapter 3 Flow through Porous Media
3.1 Porosity
Porosity is defined as the ratio of pore volume (or void space) in a reservoir rock to the total
volume (bulk volume) and is expressed as a percentage. The pore volume basically refers to the
summation or combined volume of all the pore spaces in a given reservoir rock. It is denoted by
and is mathematically expressed by the following relationship (Dandekar, 2006)
According to Ahmad (2000), after the deposition of sediments and the formation of rocks during
past geological times, some void spaces that developed became isolated from the other void
spaces due to excessive cementation. As a result, some of the pores become interconnected while
some of the pore spaces are completely isolated, leading to two different types of porosity,
absolute and effective. Absolute porosity is the ratio of the total pore volume in the rock to the
bulk volume while effective porosity is the ratio of interconnected pore volume to the bulk
volume.
The initial (pre-diagenesis) porosity depends on various factors such as grain size, grain packing,
particle shape, and the distribution of grain sizes. Porosity is also controlled by different
secondary processes that result in compaction and dilatation. These can be categorised into
mechanical process (stress compaction, plastic deformation, brittle deformation, fracture
evolution etc.) and geochemical processes (dissolution, reprecipitation, volume reductions
concomitant upon mineralogical changes etc.) (Glover, 1998). The porosities of petroleum
17
reservoir rocks typically range from 5 to 40%, with a range of 10 to 20% being more common
(Dandekar, 2006).
3.2 Permeability
Permeability is defined as is the measure of the capacity and ability of the medium to transmit
fluids. Permeability is one of the most important fluid flow parameters of porous media
providing information about the fluid flow rate in the reservoir rock. It is denoted by k.
In 1856 a French hydraulic engineer Henry Darcy presented a law known as Darcy’s law. This
law defines permeability in terms of measureable quantities. Mathematically Darcy’s law can be
expressed as (Cosse, 1993)
(3.2)
Where
q = flow rate [m3/s]
∆P = Difference between inlet and outlet pressure [Pa]
k = Permeability coefficient [m2]
= Viscosity [Pa.s]
L = Core length [m]
A = Cross sectional area to flow [m2]
In the SI International system, k is expressed in square meters (m2). The practical unit of
permeability is Darcy (D) but it is a large unit therefore milli-Darcy (mD) is commonly used in
the industry. The permeability of a medium will be one Darcy, if a fluid having a viscosity of one
centiPoise is flowing through a cross sectional area of one square centimeter at a flow rate of one
cubic centimeter per second and a pressure gradient of one atmosphere per centimeter of length.
18
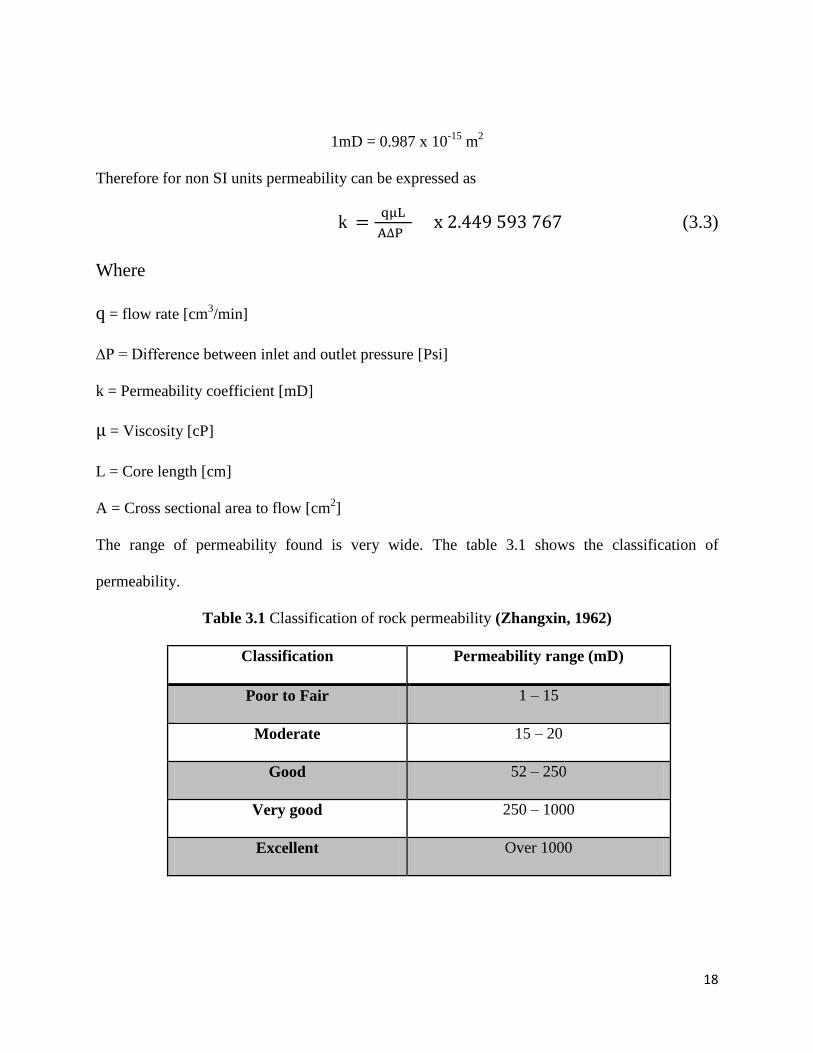
1mD = 0.987 x 10⁻¹⁵
m2
Therefore for non SI units permeability can be expressed as
k
(3.3)
Where
q = flow rate [cm3/min]
∆P = Difference between inlet and outlet pressure [Psi]
k = Permeability coefficient [mD]
= Viscosity [cP]
L = Core length [cm]
A = Cross sectional area to flow [cm2]
The range of permeability found is very wide. The table 3.1 shows the classification of
permeability.
Table 3.1 Classification of rock permeability (Zhangxin, 1962)
Classification Permeability range (mD)
Poor to Fair 1 – 15
Moderate 15 – 20
Good 52 – 250
Very good 250 – 1000
Excellent Over 1000
19
Permeability is generally classified into three types according to the number of fluids that are
present in the reservoir.
Absolute Permeability
It is the measure of the ability or capability to pass or transfer fluids through a rock, performed
when a single fluid, or phase, exists in the rock.
Effective Permeability
If more than one fluid is present in the reservoir together at some partial saturation, we than
measure effective permeability. Effective permeability is the ability of one fluid to flow in the
presence of more than one fluid that is present.
Relative Permeability
Relative permeability is the ratio of the effective permeability of a given phase to the absolute
permeability. Relative permeability is used when multi-phases are present and flowing through
the porous medium.
(3.4)
Where
= Relative permeability
= Effective permeability [mD]
k = Absolute permeability [mD]
3.3 Surface and interfacial tension
20
Surface and interfacial tension (IFT) are measure of the forces that act on the interface when two
immiscible fluids are in contact. The term surface tension is usually used for the tension of a
liquid which is in contact with its vapor or with air. IFT refers to the energy between two liquids
or a liquid and a surface. When two immiscible fluids (gas-liquid or liquid-liquid) are in contact,
there exists a well-defined interface which is only a few molecular diameters in thickness. The
molecules attract each other within the fluid, away from the interface and the walls of the
container. At the surface between two immiscible fluids there are no similar molecules beyond
the interface and therefore there is an inward directed force that attempts to minimize the surface
by pulling it into the shape of a sphere. This surface activity creates a film-like layer of
molecules that are in tension, which is the function of the specific free energy of the interface.
The IFT has the unit of force per unit length (N/m). It is also expressed as dynes/cm (Tiab,
2011).
3.4 Capillary Pressure
Capillary pressure can be defined as the pressure difference across a curved interface between
two immiscible fluids in contact as shown in figure 3.1. When two immiscible fluids are in
contact, a discontinuity in pressure exists between the two fluids that depend upon the curvature
of the interface separating the fluids. This pressure difference is known as capillary pressure and
is denoted by Pc. In petroleum reservoir, capillary pressure is the result of combined effects of
the surface and interfacial tensions of the rock and fluids, the pore size and geometry and IFT of
the rock and fluids. The displacement of one fluid by another in a porous medium is either aided
or opposed by the surface forces of capillary pressure. The pressure of the non-wetting phase
must be greater than the pressure in the wetting phase in order to maintain a porous media
partially saturated with non-wetting fluid in the presence of wetting fluid (Ahmed, 2000).
21
Figure 3.1 Use of capillary tube to measure capillary pressure (Melberg, 2010)
Mathematically, capillary pressure can therefore be expressed as (Melberg, 2010),
Pc =
(3.5)
Where,
Pc = Capillary pressure
σ = IFT between non wetting and wetting phase [
θc = Contact angle measure through the wetting phase [Degrees]
r = Radius of cylindrical pore channel
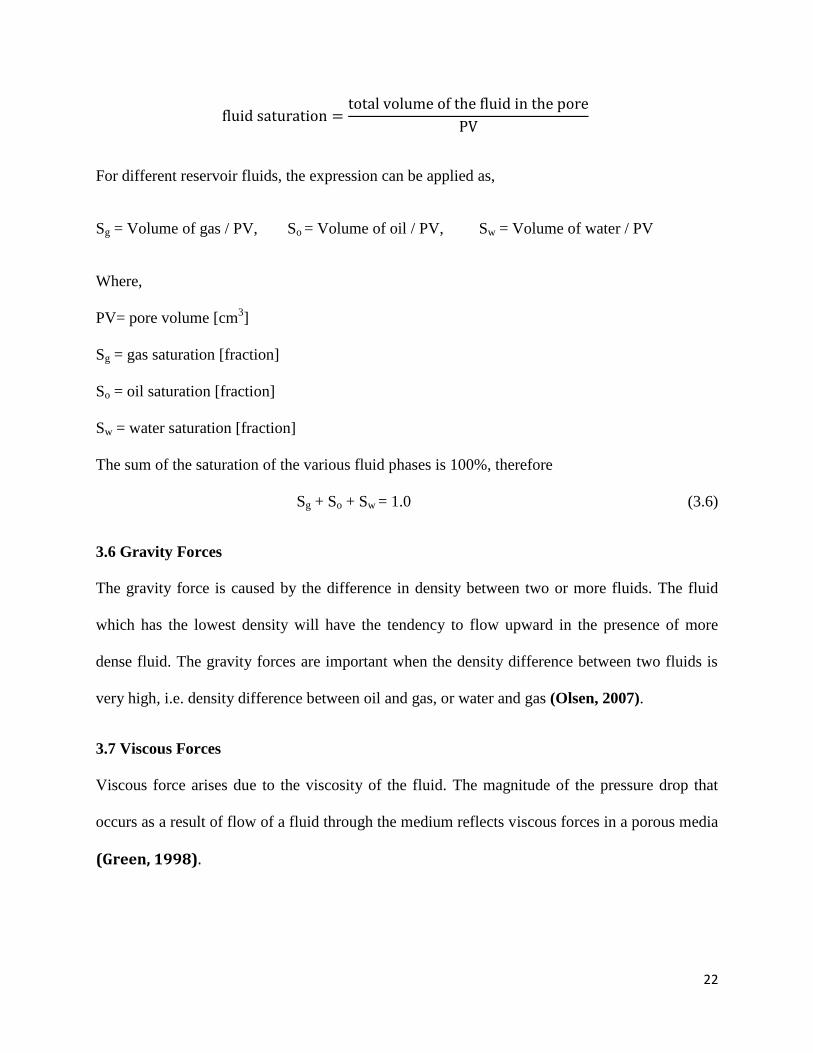
3.5 Saturation
The fraction or percent of the pore volume occupied by a particular fluid (oil, gas or water) is
known as saturation (Ahmed, 2000). Mathematically it can be expressed as,
22
For different reservoir fluids, the expression can be applied as,
Sg = Volume of gas / PV, So = Volume of oil / PV, Sw = Volume of water / PV
Where,
PV= pore volume [cm3]
Sg = gas saturation [fraction]
So = oil saturation [fraction]
Sw = water saturation [fraction]
The sum of the saturation of the various fluid phases is 100%, therefore
Sg + So + Sw = 1.0 (3.6)
3.6 Gravity Forces
The gravity force is caused by the difference in density between two or more fluids. The fluid
which has the lowest density will have the tendency to flow upward in the presence of more
dense fluid. The gravity forces are important when the density difference between two fluids is
very high, i.e. density difference between oil and gas, or water and gas (Olsen, 2007).
3.7 Viscous Forces
Viscous force arises due to the viscosity of the fluid. The magnitude of the pressure drop that
occurs as a result of flow of a fluid through the medium reflects viscous forces in a porous media
(Green, 1998).
23
3.8 Wettability
Wettability can be defined as the tendency of a fluid to adhere to or spread on a solid surface in
the presence of other immiscible fluids (Anderson, 1986a). Wettability is a very important
characteristic of the rock/fluid system. The origin of wettability is not fully understood however
it is admitted that wettability is established as result of the adsorption of polar compounds or
deposition of organic materials on the rock surface. Wettability is influenced by different
variables that include temperature, contact time, roughness, crystal structure, composition,
surface pre-treatment, interfacial segregation, adsorption, and reactions (Donnez, 2007).
The wettability is quantified by the contact angle (θc). The contact angle depends on the oil-soild
IFT, water-soild IFT and oil-water IFT, as described by Young’s equation,
σos= σws + σow cos θc (3.7)
Where σos is oil-soild IFT, σws is water-soild IFT and σow is oil-water IFT as shown in figure
3.2.
Figure 3.2 Wettability of oil, water and rock system (Jim, 1992)
24
The contact angle has become a commonly used measure of wettability. θc is always measured
through the liquid to the solid surface. For solid with a tendency for water, if the contact angle is
less than 90 then the surface is referred to as water wet. Similarly if the surface has the tendency
for oil and the contact angle is greater than 90, the surface will be oil-wet. The term strongly oil-
wet and strongly water-wet has been used for wetting angles near the extreme points as shown in
the table 3.2.
Table 3.2 Wettability preference expressed by contact angle (Zolotukhin, 2000)
Wetting angle (degrees) Wettability preference
0-30 Strongly water-wet
30-90 Preferentially water-wet
90 Neutral wettability
90-150 Preferentially oil-wet
150-180 Strongly oil-wet
Laboratory studies show that wettability of ranges from pure water wet (through neutral wet) to
oil wet can occur within a porous medium. The rocks which have greater affinity for water called
water wet while those rocks which show greater affinity for oil are known to be oil wet.
Fractional wettability also known as heterogeneous or spotted wettability refers to the wettability
condition where the oil is assumed to alter some part of the rock surface to strongly oil-wet while
the remaining parts of the rock remain water-wet. Fractional wettability is different from
intermediate wettability. In intermediate wettability all portions of the rock have a constant
contact angle around 90o, equivalent to an equal affinity to imbibe oil and/or water (Al Sayari,
2009). Mixed wettability is special type of fractional wettability where water wet and oil wet
25
areas are interconnected (Salathiel, 1973). The rocks having mixed wettability contain
continuous water- and oil-wet paths respectively and they are able to imbibe and take up water
and oil spontaneously (Anderson, 1986b).
3.8.1 Wettability Measurement
Different methods have been proposed for the measurement of wettability of a system. Anderson
(1986b) has divided these methods into quantitative and qualitative methods. The quantitative
methods include contact angles, imbibition and forced displacement (Amott), and USBM
wettability method. While qualitative methods are imbibition rates, microscope examination,
flotation, glass slide method, relative permeability curves, permeability/saturation relationships,
capillary pressure curves, capillarimetric method, displacement capillary pressure, reservoir logs,
nuclear magnetic resonance, and dye adsorption. Although no single accepted method exists,
three quantitative methods for determining wettability are generally accepted and most widely
used.
1. Contact-angle measurement
2. The Amott method (imbibition and force displacement)
3. The USBM Method.
Contact Angle Measurement
This method is considered to be the best measurement method when pure fluids and artificial
cores are used because there is no possibility of surfactants or other compounds altering the
wettability. This method is also used to determine whether a crude oil can alter wettability and to
examine the effects of temperature, pressure, and brine chemistry on wettability. Many methods
26
of contact-angle measurement are used but the methods that are generally used in petroleum
industry are the static sessile drop method and dynamic sessile drop method. The contact angle
measures the wettability of a specific surface (Anderson, 1986b).
The Amott Method
The Amott method is commonly used for measuring the wettability of cores. This method is
based on spontaneous and forced imbibition of fluids (Tripathi and Mohanty, 2007). This
method is based on the fact that the wetting fluid will imbibe spontaneously into the core,
displacing the non-wetting fluid. The influence of other factors, such as relative permeability,
viscosity, and the initial saturation of the rock is reduced by using the ratio of fluid displaced by
spontaneous imbibition to forced imbibition (Anderson, 1986b).
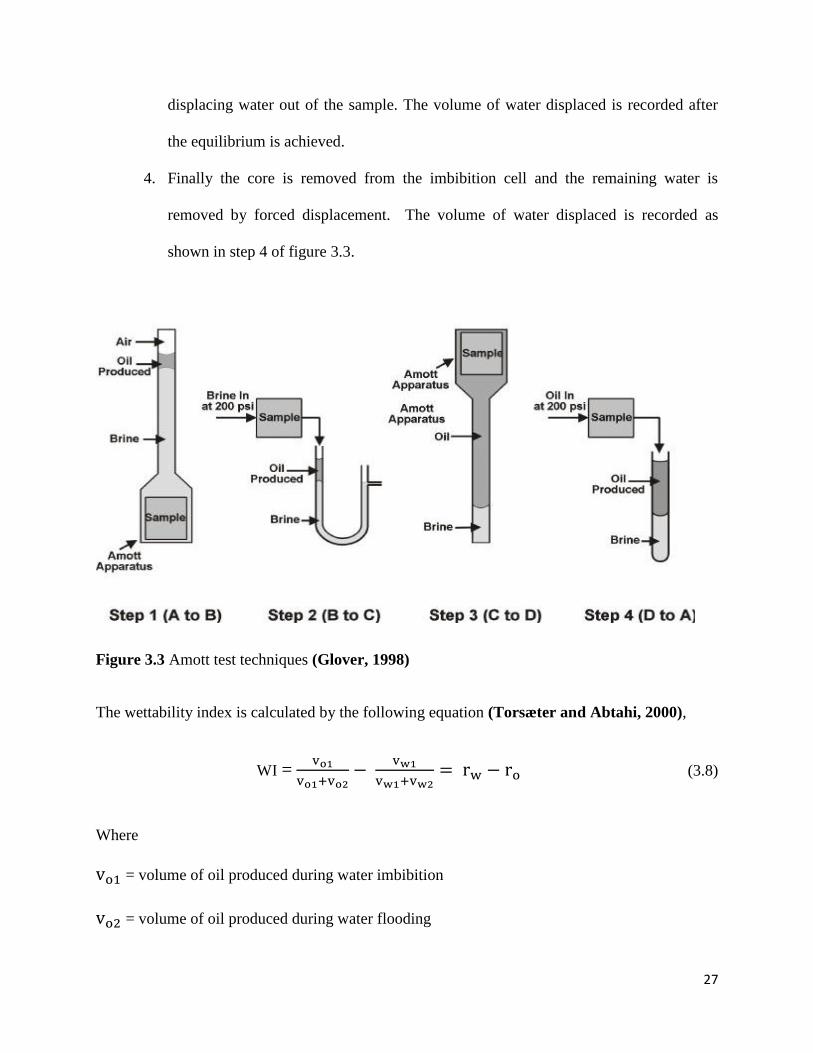
The Amott method consists of the following four steps.
1. The core sample is saturated with oil by placing it in oil for a certain period of time
that depends on the duration of the experiment. When the core sample is saturated
with oil, it is removed and placed in an imbibition cell surrounded by water as shown
in step 1 of figure 3.3. The water is allowed to imbibe into the core sample which
displaces oil out of the sample until equilibrium is reached. The volume of water
imbibed is measured.
2. The core sample is then removed and the remaining oil in the sample is forced down
to residual saturation by displacement with water in a sealed core holder using
centrifuge or pump as shown in step 2 of figure 3.3. The volume of oil recovered is
measured.
3. The core now saturated with water at residual oil saturation is again placed in an
imbibition cell surrounded by oil. Oil is allowed to imbibe into the core sample
27
displacing water out of the sample. The volume of water displaced is recorded after
the equilibrium is achieved.
4. Finally the core is removed from the imbibition cell and the remaining water is
removed by forced displacement. The volume of water displaced is recorded as
shown in step 4 of figure 3.3.
Figure 3.3 Amott test techniques (Glover, 1998)
The wettability index is calculated by the following equation (Torsæter and Abtahi, 2000),
WI =
(3.8)
Where
= volume of oil produced during water imbibition
= volume of oil produced during water flooding
28
= volume of water produced during oil imbibition
= volume of water produced during oil flooding
= displacement with water ratio
= displacement with oil ratio
The wettability index will be a number between -1.0 and 1.0 where
WI = 1.0 completely water wetting
WI = 0.0 neutral
WI = -1.0 completely oil wetting.
The USBM Method
This method was developed by Donaldson et al. (1969) and is called U.S. Bureau of Mines
method. The USBM method is similar to the Amott’s method but considers the required work for
forced displacement. The USBM test compares the work necessary for one fluid to displace the
other. This method gives an average wettability value of the core. This method is used in
industry to compare various core plugs (Glover et al., 1998).
A major advantage of the USBM wettability test over the Amott test is its sensitivity near neutral
wettability. The USBM test cannot determine whether a system has fractional or mixed
wettability, while the Amott test is sometimes sensitive. In some fractional or mixed wet system
both water and oil will imbibe freely. The Amott method will have positive displacement by
water and displacement by oil ratios, indicating that the system is non-uniformly wetted
(Anderson, 1986b).
29
3.8.2 Spontaneous Imbibition
The process by which a wetting phase displaces a non-wetting phase from a porous medium as a
result of capillary forces is called spontaneous imbibition. Imbibition is an immiscible
displacement process whereby a non-wetting fluid within a porous medium is spontaneously
expelled by wetting fluid that surrounds the medium. Wetting fluid is drawn into the medium by
capillary suction. This phenomenon is caused by the differential attraction forces between the
pore walls and fluids. The rate of imbibition is primarily dependent on the rock permeability,
pore structure, wettability and the interfacial tension between the resident phase and the imbibing
phase (Anderson, 1986b).
The Amott and USBM wettability indices are based on spontaneous imbibition. The main
difference between the Amott test and the spontaneous imbibition is that the Amott test depends
mainly on the saturation at which imbibition capillary pressure falls to zero while spontaneous
imbibition rates depend on the magnitude of the imbibition capillary pressure. Measurements of
imbibition rates are of special value as a sensitive measure of wetting in the range where WI is or
close to unity. In an imbibition test core sample is submerged saturated with oil is submerged in
brine underneath a graduated cylinder and the rate and amount of oil displaced by brine
imbibition are measured. The core is strongly water wet if large volumes of brine are rapidly
imbibed, while lower rates and smaller volumes indicate a more weakly water-wet core. The core
either neutrally wet or oil wet if no water is imbibed. Non water wet cores are then driven to
residual oil saturation and submerged in oil. The imbibition apparatus is inverted and the rate and
volume of oil displaced by water is recorded in the graduated cylinder below the core. The core
is oil wet if it imbibes oil. The strength of oil wetness is indicated by the rate and volume of oil
imbibition. The core is neutrally wet in that case when neither oil nor water is imbibed. The
30
cores which have fractional or mixed wettability will imbibe both water and oil (Anderson,
1986b). The imbibition rates measurement also provides information on dynamic interfacial
tension and wetting phenomenon that may be useful in the reservoir but are not reflected by
Amott or USBM wettability test (Morrow, 1990).
3.9 Instability Phenomenon
The flow of different fluids is influenced by several forces acting in the porous medium. It is not
possible to ignore the vertical components of the velocities if the reservoir is thick. The analyses
of these forces show that interfaces and fronts are generally distorted (encroachment). The term
“tongue” refers to the encroachment that occurs on the scale of the front while on smaller scale
(meter or decameter) it is known as “fingering”. These encroachments are governed by
conditions of stability and instability. If a small change in the initial conditions of the movement
(initial coordinates, initial speed) causes a variation in the movement that remains small over
time, of the same order as the initial disturbance then it is called a stable movement otherwise in
opposite case it will be unstable displacement. Studies show that these instabilities depend on the
mobility ratio (Cosse, 1993).
3.9.1 Mobility
Mobility is the relative measure of how easily a fluid moves through a porous media. It is
defined as the ratio of effective phase permeability to phase viscosity.
(3.9)
Where
= Mobility [mD/cP]
31
= Effective Permeability [mD]
= Viscosity [cP]
3.9.2 Mobility Ratio
Mobility ratio is defined as the mobility of the displacing fluid “λD” behind the front divided by
the mobility of the displaced fluid “λd” ahead of the front, thus
(3.10)
Mobility control can be achieved by injection of chemicals to change displacing fluid viscosity
or to preferentially reduce specific fluid relative permeability through injection of foams, or even
through injection of chemicals to modify wettability (Sheng, 2011). A mobility ratio of
approximately 1, or less, is considered favorable, which indicates that the injected fluid cannot
travel faster than the displaced fluid while above 1 is called unfavourable (Cosse, 1993).
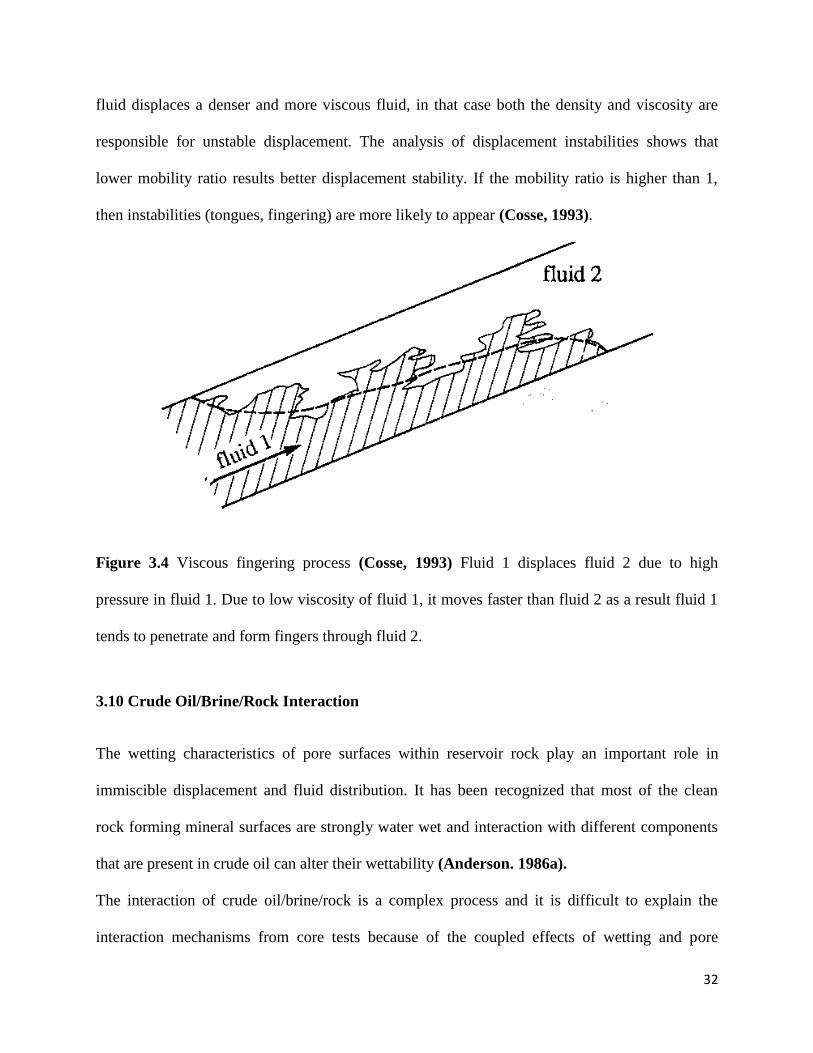
3.9.3 Fingering
The term fingering is used to describe the bypassing of a resident fluid by a displacing agent in a
homogenous, non-uniform medium. The bypassed region is known as finger as shown in figure
3.4. The definition of fingering encompasses the instabilities that are caused by viscous forces
(viscous fingers) and gravity forces (gravity fingers) but does not include bypassing due to
permeability heterogeneities (Lake, 1988). Viscous fingering generally refers to the instability
that occurs in the displacement of fluids in porous media. The mechanism of instability in most
cases is due to the variations in viscosity between phases. When a less dense and less viscous
32
fluid displaces a denser and more viscous fluid, in that case both the density and viscosity are
responsible for unstable displacement. The analysis of displacement instabilities shows that
lower mobility ratio results better displacement stability. If the mobility ratio is higher than 1,
then instabilities (tongues, fingering) are more likely to appear (Cosse, 1993).
Figure 3.4 Viscous fingering process (Cosse, 1993) Fluid 1 displaces fluid 2 due to high
pressure in fluid 1. Due to low viscosity of fluid 1, it moves faster than fluid 2 as a result fluid 1
tends to penetrate and form fingers through fluid 2.
3.10 Crude Oil/Brine/Rock Interaction
The wetting characteristics of pore surfaces within reservoir rock play an important role in
immiscible displacement and fluid distribution. It has been recognized that most of the clean
rock forming mineral surfaces are strongly water wet and interaction with different components
that are present in crude oil can alter their wettability (Anderson. 1986a).
The interaction of crude oil/brine/rock is a complex process and it is difficult to explain the
interaction mechanisms from core tests because of the coupled effects of wetting and pore
33
morphology. Crude oil consists of different components that can adsorb on solid surfaces. It is
not possible to isolate the effect of different components or mechanisms for real crude oil.
Therefore by characterizing acidic and basic oils and oils of varying solvent quality it is possible
to see wetting alteration mechanism that dominates for one or another of the possible interaction
mechanism. The four main types of crude oil/brine/rock interactions that are identified by
Buckley (1998) are discussed here.
Surface Precipitation
Surface precipitation is based and dependent on crude oil solvent properties with respect to
asphaltenes. The tendency of wetting alteration is increased if the oil is not a good solvent for its
asphaltenes. It has been recognized by experimental studies that as the oil become a poor solvent
for its asphaltenes, the tendency of asphaltene adsorption on the rock surface increases and
causes less water wet conditions (Buckley, 1998).
Acid /Base Interactions
Acid/base interaction is the result of surface charge at oil/water and solid/water interfaces. Both
the solid and oil surfaces are charged in the presence of water. The polar functional groups of oil
and mineral behave as acids and bases. The phenomenon of surface charge affects the interaction
between crude oils, brine and solid surfaces in two major ways. First for a given oil or solid
surface, the surface charge depends on the degree of acid base dissociation reactions which in
turn depends on pH at the surface. In case where both oil/water and solid/water interfaces have
similar charge, the resulting repulsive force will stabilize the leading water film. Strongly water
wet conditions are achieved if the water film is stable. If the water film is not stable it will
collapse. At this phase, crude oil components at the oil/brine interface can adsorb on the solid
surface. Weakly water wet condition (WI =0.5) is the result of low pH which favor positive
34
charge of basic functional groups while strongly water wet condition (WI=1) is maintained by
higher pH (Buckley, 2005).
Ion Binding Interaction
When divalent and multivalent ions are present in the aqueous phase then ion-binding interaction
occurs. The divalent and multivalent ion can bind at both oil and solid/water interfaces and/or
bridge between them. Acid/base interaction is important but it cannot be isolated from complex
contributions of the ion binding mechanism. Oil which has higher acid number and low base
number can alter the wettability by ion-binding interaction (Buckley, 2005).
Polar Interaction
Polar interaction occurs between oil and solid surface in the absence of water. Adsorption of
asphaltene directly from oil onto the mineral surface has often been reported. The adsorption of
high molecular weight material on dry mica surfaces have been shown by immersion of dry mica
surfaces in crude oil. The important variables that affect adsorption onto the clay mineral surface
in the absence of water include the type of clay, nitrogen content of the oil, and the solvent in
which the polar compounds are dissolved. In core studies, polar interaction is not considered
important due to the presence of water (Buckley, 1998).
35
Chapter 4 Experimental Work
This section describes the details of the material used in this experiment, i.e., rocks, brine and oil
and the experimental methods that were performed in this experiment. The purpose of this
experiment was to investigate the effects of waste cooking oil and crude oil on wettability of
Wallace sandstone core samples. Spontaneous imbibition and Amott test were performed to
measure the wettability of Wallace sandstone core samples.
4.1 Rock materials
In this experiment, the cores used were Wallace Sandstone obtained from Wallace Quarry (Nova
Scotia, Canada). The mineral analysis of the Wallace Sandstone performed by Dalhousie
University’s Mineral Engineering Center Halifax, Nova Scotia, on February 19th, 2001 is
presented in the table 4.1.
Four cores were drilled from the same block of Wallace sandstone in the Mining Engineering
Lab at Dalhousie University on December 12, 2012 to ensure that they have the same
composition. The edges of the cores were properly cut in order to get a cylindrical shape for
accurate results as shown in figure 4.1. The important properties of the cores along with porosity
and permeability are presented in table 4.2.
36
Table 4.1 Mineral Analysis of Wallace Sandstone (Wallace Quarries Ltd, 2001)
MINERAL COMPOSITION (wt. %)
Silicon Dioxide (SiO2) 82.00
Aluminium Oxide (Al2O3) 8.12
Ferric Oxide (Fe2O3) 3.19
Sodium Oxide (Na2O) 1.67
Potassium Oxide (K2O) 1.13
Magnesium Oxide (MgO) 0.72
Calcium Oxide (CaO) 0.81
Titanium Oxide (TiO) 0.29
Manganese Oxide (MnO) 0.10
Loss on Ignition 2.59
Figure 4.1 Wallace sandstone cores used in this experiment
37
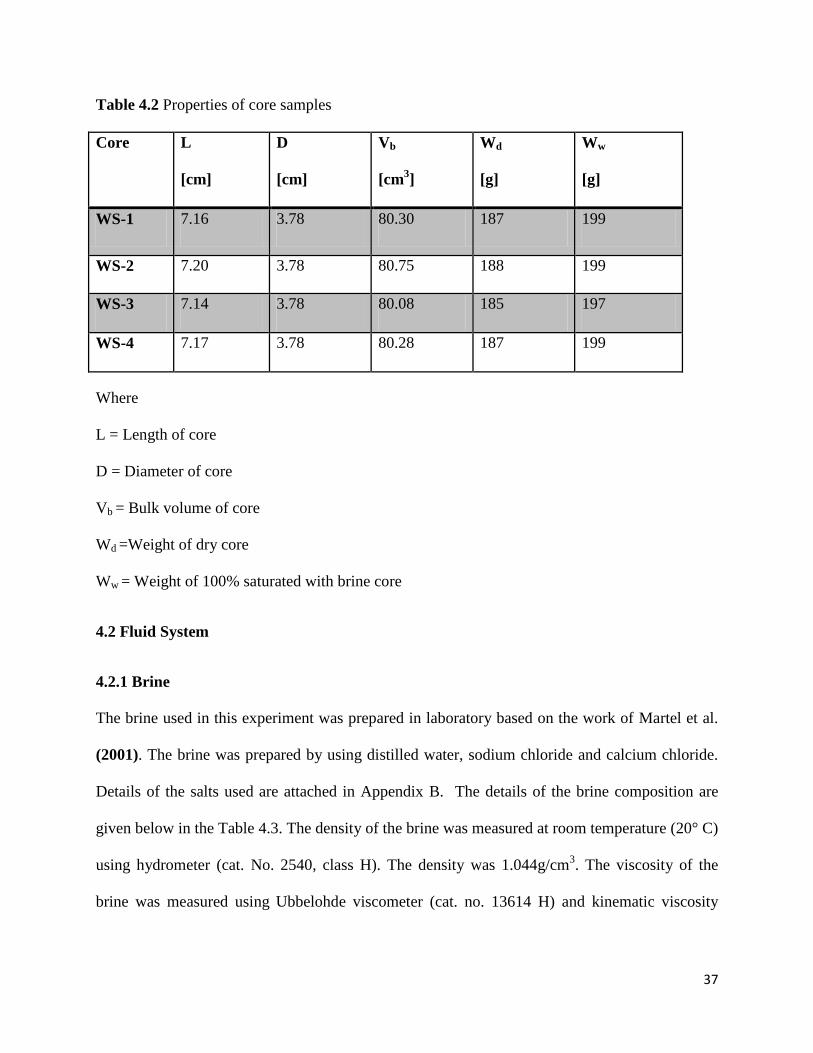
Table 4.2 Properties of core samples
Core L
[cm]
D
[cm]
Vb
[cm3]
Wd
[g]
Ww
[g]
WS-1 7.16 3.78 80.30 187 199
WS-2 7.20 3.78 80.75 188 199
WS-3 7.14 3.78 80.08 185 197
WS-4 7.17 3.78 80.28 187 199
Where
L = Length of core
D = Diameter of core
Vb = Bulk volume of core
Wd =Weight of dry core
Ww = Weight of 100% saturated with brine core
4.2 Fluid System
4.2.1 Brine
The brine used in this experiment was prepared in laboratory based on the work of Martel et al.
(2001). The brine was prepared by using distilled water, sodium chloride and calcium chloride.
Details of the salts used are attached in Appendix B. The details of the brine composition are
given below in the Table 4.3. The density of the brine was measured at room temperature (20° C)
using hydrometer (cat. No. 2540, class H). The density was 1.044g/cm3. The viscosity of the
brine was measured using Ubbelohde viscometer (cat. no. 13614 H) and kinematic viscosity
38
bath. The viscosity was 1.13 cP at 20° C. The pH of brine was determined by Waterproof pH
tester. The accuracy of the pH tester was 0.01 pH. The pH was found to be 7.5.
Table 4.3 Composition of the brine used in experiment
Composition Na Ca Cl TDS
mg/L 43450 12300 68050 92650
4.2.2 Waste Cooking Oil
Waste cooking oil used in experiment was collected from a local restaurant in Halifax, Nova
Scotia Canada. Four liters of waste cooking oil was collected which was a representative sample
of canola oil used for deep frying and was exposed to temperature between 170-180° C for seven
days. The oil sample contained waste and dust particles which were removed by filtering it
through a 20 micron filter paper. The viscosity of the oil was measured at 20° C using
Ubbelohde viscometer (cat. no. 13614 H) and kinematic viscosity bath. The viscosity was
64.95cP while the density of the oil was measured with hydrometer (cat. no. 2534, Class L) at 20
°C and was 0.981g/cm3. The pH of waste cooking oil was determined by Waterproof pH tester.
The accuracy of the pH tester was 0.01 pH.
4.2.3 Crude Oil
Reservoir crude oil ARAB 50 was used in this experiment. The viscosity of the oil at 16 °C was
42.57 cP while the density of the oil at 16°C was 0.8870 g/cm3. The pH of crude oil is 6. The
properties of crude oil used in this experiment were based on the information provided by the
supplier.
39
4.3 Experimental Procedures
4.3.1 Core Cleaning
The purpose of the core cleaning process is to achieve the original wettability state of the core.
Based on Anderson’s (1986a) work, toluene and methanol were selected for core cleaning. The
core samples were cleaned by injecting several pore volume of a 50/50 mixture of
toluene/methanol in order to remove all components of oil and brine. The core samples were
mounted one by one in the BRP 350. The BRP 350 was degassed and checked for leakages.
Several pore volume of the mixture was injected into the core samples. The injection rate water
was cm3/min. Finally the core samples were rinse by injection of distilled water. All the core
samples were cleaned at laboratory temperature of 20 °C. Then the core samples were dried in
the roller oven at 90 °C for 24 hours. The weight of the core samples were measured every time
after cleaning to ensure complete dryness.
4.3.2 Core Saturation
To saturate core samples with brine, cooking oil and crude oil, vacuum oven was used. Cores
were immersed in a beaker containing brine or oil and kept in the vacuum oven under vacuum of
0.147 psia for 72 hours at 20°C.
4.3.3 Determination of Porosity
Porosity was determined by gravimetric method. This method is based on the difference between
dry and wet weight of the cores. The dry weight of the cores was observed. Then the cores were
saturated with brine for 24 hours using vacuum chamber and again the weight of the saturated
cores were observed by EC 4000 digital scale. Then by using the following equation porosity
was calculated.
40
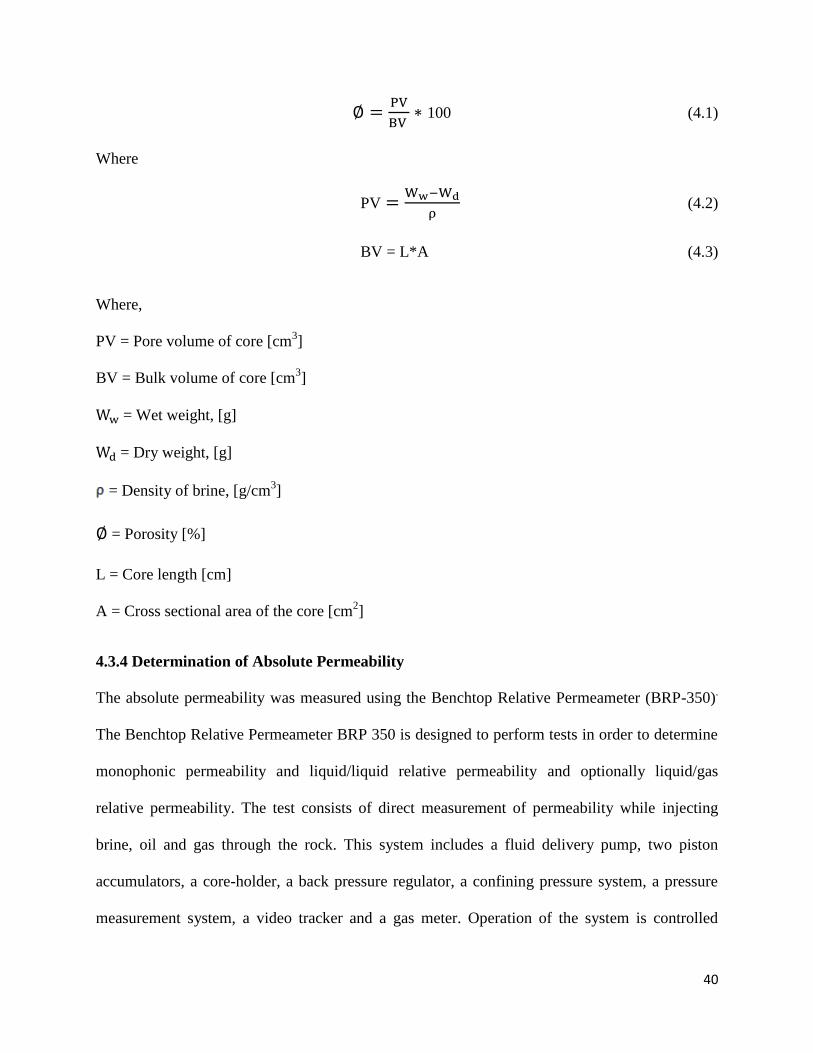
100 (4.1)
Where
PV
(4.2)
BV = L*A (4.3)
Where,
PV = Pore volume of core [cm3]
BV = Bulk volume of core [cm3]
= Wet weight, [g]
= Dry weight, [g]
= Density of brine, [g/cm3]
= Porosity [%]
L = Core length [cm]
A = Cross sectional area of the core [cm2]
4.3.4 Determination of Absolute Permeability
The absolute permeability was measured using the Benchtop Relative Permeameter (BRP-350).
The Benchtop Relative Permeameter BRP 350 is designed to perform tests in order to determine
monophonic permeability and liquid/liquid relative permeability and optionally liquid/gas
relative permeability. The test consists of direct measurement of permeability while injecting
brine, oil and gas through the rock. This system includes a fluid delivery pump, two piston
accumulators, a core-holder, a back pressure regulator, a confining pressure system, a pressure
measurement system, a video tracker and a gas meter. Operation of the system is controlled
41
through a computer interface. The Applilab software included with the system is designed to
allow for automated data acquisition and pump control. Some important features of the BRP 350
are given below while more details of the instrument are present in Appendix.
Table 4.4 Benchtop relative permeameter (BRP 350) features
Working Confining Pressure Up to 5000 psi (option 10000 psi)
Working Pore Pressure Up to 5000 psi (option 10000 psi)
Core Diameter 2.54 - 3.81 cm
Core Length 2.54 - 7.62 cm
Wetted Material Stainless Steel 316 for chemical compatibility
and corrosion resistance
N2 2,000 Psi
Power 220 VAC, 50 Hz
The core samples were loaded in to the Hassler Core Holder of the Benchtop Relative
Permeameter equipment. Before starting the injection of brine into the core sample, the tubes
connected to the Hassler Core Holder were drained to remove any trapped air in it. A confining
pressure of 700 psi and a back pressure of 200 psi (N2) were used in the set up as recommended
by Vinci Technologies. The confining pressure was kept higher than the back pressure to ensure
good sealing between the core and the rubber sleeve inside the core holder. The flooding was
conducted at room temperature of 20 °C. The tubes were then connected and brine was injected
at different flow rates across the sample. The initial flooding rate was 0.2 cm3/min while the final
flow rate was 4 cm3/min.
42
Figure 4.2 Benchtop relative permeameter (BRP-350) used in this experiment
Finally absolute permeability was calculated using the excel file “Permeability Template”
provided with the Applilab software of the Benchtop Relative Permeameter. The “Permeability
Template” works on the principal of Darcy’s law of flow through porous media and calculates
the permeability using equation 3.3.
4.4 Spontaneous Imbibition and Amott wettability test
4.4.1 Spontaneous Imbibition Equipment
All spontaneous imbibition tests were performed in Amott’s cell. The Amott cell consists of a
sealed glass cell for the core sample and a graduation tube to measure the volume of fluid
expelled from the core. The imbibition Amott cell stands by itself while the drainage Amott cell
is maintained using a stand as shown in figure 4.8. The experiments were carried out at
laboratory conditions of 14.7 psi and 20° C.
43
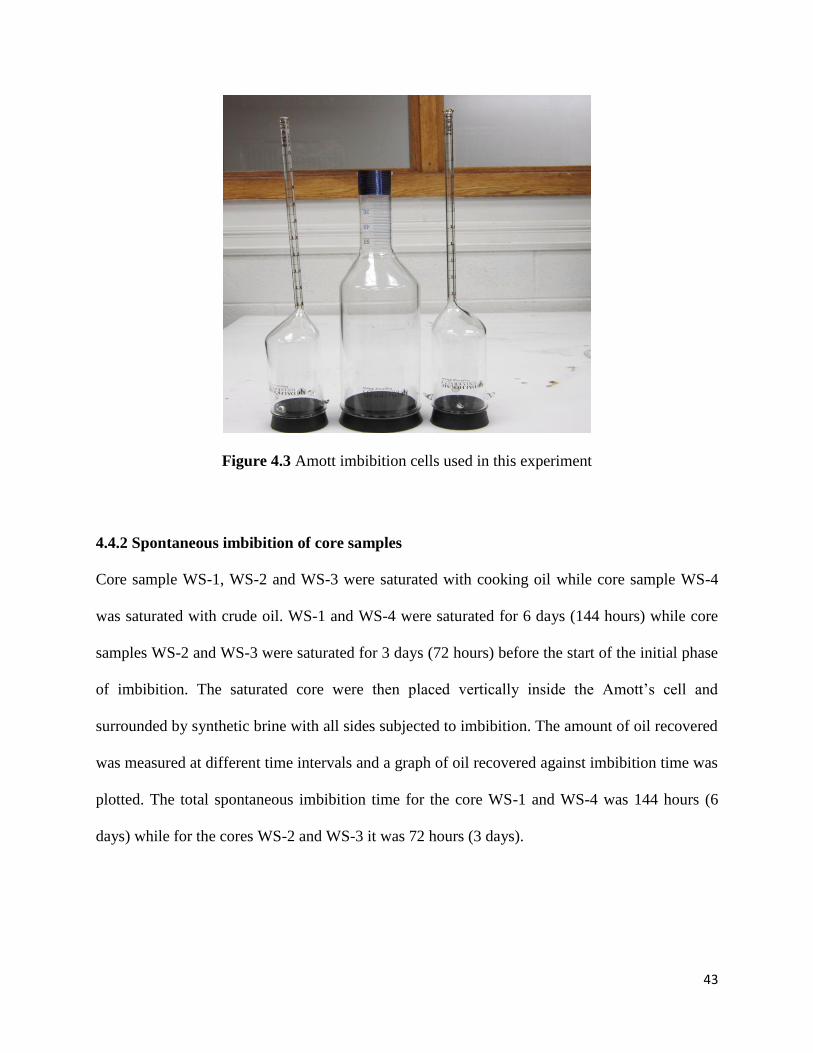
Figure 4.3 Amott imbibition cells used in this experiment
4.4.2 Spontaneous imbibition of core samples
Core sample WS-1, WS-2 and WS-3 were saturated with cooking oil while core sample WS-4
was saturated with crude oil. WS-1 and WS-4 were saturated for 6 days (144 hours) while core
samples WS-2 and WS-3 were saturated for 3 days (72 hours) before the start of the initial phase
of imbibition. The saturated core were then placed vertically inside the Amott’s cell and
surrounded by synthetic brine with all sides subjected to imbibition. The amount of oil recovered
was measured at different time intervals and a graph of oil recovered against imbibition time was
plotted. The total spontaneous imbibition time for the core WS-1 and WS-4 was 144 hours (6
days) while for the cores WS-2 and WS-3 it was 72 hours (3 days).
44
Figure 4.4 Oil recovery by spontaneous Imbibition
4.4.3 Water Flooding of Core samples after Spontaneous Imbibition
After spontaneous imbibition, the core samples were subjected to forced displacement by brine
using the Benchtop Relative Permeameter (BRP 350). The flooding tank was filled with
synthetic brine and a displacement pump was used to force the piston of the tank in order to
pump brine through the pipeline. The core samples were loaded one by one and flooded with
brine. The confining pressure of the system was 700-750 psi while the back pressure was
between 190-200 psi and the temperature was 20° C. The injection flow rate was 3 cm3/min.
Once the inlet pressure exceeded the outlet pressure, the water flooding was initiated and the
core sample was subjected to counter current flow of brine. A mixture of brine and cooking oil
was observed in the separator when the outlet pressure exceeded the back pressure. The separator
was already filled with 20 cm3 of brine and cooking oil prior the experiment inorder to
45
distinguish between the brine and oil phases and record the rise in level of each fluid. The initial
level of the interface was recorded. Vinci Acquisition (V2.3) software was used to monitor and
record the rise in the level of oil in order to determine the volume of oil recovered after flooding.
The software calculates the volume of oil and brine recovered using diameter of the separator.
Each core sample was subjected to water flooding for 48 hours. The core samples were cleaned
and dried at 90° C for 24 hours in oven. All the dried samples were weighed again and found to
be the same weight as before the start of experiment. The core samples were then subjected to
the second phase of experiment.
The core samples were saturated with brine this time under vacuum. The core sample WS-1 and
WS-4 was saturated for 6 days (144 hours) while WS-2 and WS-3 were saturated for 3 days (72
hours) under vacuum. After that the core samples were placed in Amott cell. For WS-1, WS-2
and WS-3 cooking oil was used as imbibing fluid while for WS-4 crude oil was used. The
volume of brine displaced by oil imbibition is recorded after equilibrium is achieved. The core
sample WS-1 and WS-4 was exposed to oil for 6 days (144 hours) while WS-2 and WS-3 cores
were placed in oil for 3 days (72 hours).
46
Figure 4.4 Brine recovery by spontaneous imbibition
The core samples were then removed from Amott cell and subjected to forced displacement by
oil. Again BRP-350 was used. This time the flooding tank was filled with cooking oil for WS-1,
WS-2 and WS-3 while for WS-4 crude oil was used as injecting fluid. The volume of brine
recovered by oil flooding was calculated with the help of Vinci Acquisition (V2.3) software.
47
Chapter 5 Results and Discussions
The results of the experiment are presented and discussed in this section after the experiment has
been completed successfully.
5.1 Core Sample Properties
The important petrophysical properties of the core samples determined during the experiment are
summarized in Table 5.1.
Table 5.1 Summary of petrophysical properties of cores
Core PV
[cm3]
[%]
k
[mD]
WS-1 11.94 14.3 1.84
WS-2 10.53 13.9 1.89
WS-3 11.49 14.3 1.82
WS-4 11.90 14.3 1.83
5.2 Spontaneous Imbibition Test Results
As described in section 4.3.6, four Wallace Sandstone cores were exposed to spontaneous
imbibition by placing it in Amott cells to get indication of wettability of the cores. Core WS-1,
WS-2, WS-3 and WS-4 were used in this experiment. Core sample WS-2 and WS-3 were
exposed to spontaneous imbibition for 3 days while core samples WS-1 and WS-4 were exposed
to spontaneous imbibition for 6 days. The purpose of this time difference was to know about the
oil recovery with time. Figure 5.1 shows the spontaneous imbibition characteristics for all the
48
cores. The plot of oil recovery vs. time depicts the spontaneous imbibition rate for each core
sample.
Figure 5.1 Spontaneous imbibition with brine results for all cores (100% oil saturation)
The plot of oil recovery vs. imbibition time for all the cores show that the oil recovery was high
during the first 3 hours and after that it decreased and stopped almost after 10 hours. From Table
5.1, the PV of WS-1 is 11.94 cm3, the oil recovery due to SI of brine is 0.22 cm
3 which is very
low i.e. only 1.84% of the total oil in place. This shows that the core sample WS-1 is not water
wet. The PV of WS-2 is 10. 53 cm3 and the oil recovery due to SI of brine is 0.24 cm
3 which is
just 2.27% of the total oil in place, which means that the core sample WS-2 is also not water wet.
Similarly, the PV of WS-3 is 11.49 cm3
and the volume of oil recovered as a result of SI of brine
is 0.19 cm3. The oil recovery from WS-3 is 1.65%. The PV of WS-4 is 11.90 cm
3 and the oil
recovery by SI is 0.20 cm3.
Therefore, the oil recovery for WS-4 is 1.68% of the original oil in
place. It is clear that the oil recovery by SI of brine from every core is very low and is less than
49
2% of the original oil in place. It is also clear from this data that although the core saturation
time and spontaneous imbibition time for WS-2 and WS-3 were different but still the overall oil
recovery from each of them as compared to their pore volume is not high. Although the oil
recovery from WS-2 is higher than other cores which are the result of higher permeability of
WS-2 but still the oil recovery as compared to its pore volume is just 2.27 % of the total oil in
place which is still very low.
5.2 Results of Amott Wettability Test on all core
The Amott wettability measurement involves the amount of fluids spontaneously and forcibly
imbibed by a rock sample. This method is used in petroleum industry for comparing wettability
of various core samples.
After the SI of brine, the core samples were subjected to forced displacement by brine. Table 5.1
shows the oil recovered as a result of forced displacement by brine. In the next part of
experiment, the core samples were cleaned dried and 100% saturated with brine. The brine
saturated samples were exposed to SI by oil. As shown in Table 5.1, the core samples have not
imbibed oil. The core samples were then subjected to forced displacement by oil. The brine
recovered due to forced displacement of oil is shown in Table 5.1.
50
Table 5.2 Amott wettability index for core samples
Core
Sample
Displacement by brine
(Oil Recovery )
cm3
Displacement by oil
(Brine Recovery)
cm3
Amott
Wettability
Index
Spontaneous
Forced
Spontaneous
Forced
WS-1 0.22 4.8 0 3.2 0.04
WS-2 0.24 4.4 0 3.1 0.05
WS-3 0.19 4.5 0 3.4 0.04
WS-4 0.20 4.3 0 3.7 0.04
5.3 General Discussion
Sedimentary rocks were formed by deposition of sediments in an aqueous environment. Most
sandstone are therefore water wet by nature, but in contact with oil the wettability of rock surface
may be altered to more oil-wet (Melberg, 2010). Fresh sandstone core samples are water wet
unless they are in contact with crude oil. The Wallace sandstone core samples used in this
experiment were fresh cores which were not previously exposed to any oil contact before this
experiment.
The porosity measurement of the core sample shows that Wallace sandstone core samples have
high porosity while the permeability measurement indicates it has poor permeability. The
spontaneous imbibition data for the cores shows that the spontaneous imbibition rate was very
slow and that the total brine imbibed by each core sample was very low as compared to the total
51
pore volume of the core sample. Also from the above table which shows the Amott wettability
indices, it is clear that Wallace sandstone core samples have now near neutral wettability.
The oil recovered in the separator after waterflooding was also observed and there was no sign of
precipitation or solid particles in it. Also the core samples were weighted every time after they
were cleaned and dried. All the core samples were found of the same weight as they were at the
beginning of the experiment. This shows that there was no dissolution.
Wettability alteration is a complex phenomenon. The wettability of reservoir rocks is affected by
different factors including oil composition, rock mineralogy, connate water composition and pH,
reservoir pressure and temperature (Zolotukhin, 2000). It is possible that more than one
mechanism at a time contributes to oil/brine/rock interaction. Buckley (1998) performed
different experiments in order to identify the different mechanisms which cause wettability
alteration. These mechanisms by which wettability is altered are discussed in chapter 3 (section
3.10).
In this experimental work, we can see that the pH value of the waste cooking oil used was 5. It
has been stated earlier in chapter 3 (section 3.10) that low pH promotes a positive charge of basic
functional groups which causes weakly water wet conditions (Buckley, 1998). Therefore it may
be one of the causes which have altered the wettability from strongly water wet to near neutral
wet condition for cores saturated with waste cooking oil.
The crude oil contains asphaltenes and resins which have polar and polynuclear organic
compounds. High polar compounds adsorb on the surfaces of the grains and alter the wettability
from water wet to oil wet (Anderson, 1986a; Buckley, 1998)
It is also found that the pH of the brine used in this experiment is greater than 7.5, in this case the
dissociation of hydrogen ions is repressed and the surface of Wallace sandstone acidic organic
52
compounds. The divalent ions Ca++
present in the brine adsorbs on the negative silica surface
then permit the adsorption of acidic compounds on the silica rocks which may also be a cause for
wettability alteration from water wet to near neutral wet condition (Tiab and Donaldson, 2011).
It is difficult to explain the interaction mechanisms from core tests because of the coupled effects
of wetting and pore morphology. However it is clear from this experiment that waste cooking oil
and crude oil both have changed the wettability of the Wallace sandstone core samples from
strongly water wet to near neutral wet conditions.
53
Chapter 6 Conclusions and Recommendations
Geological sequestration of CO2 is one of the possible options for reducing large scale CO2
emissions into the atmosphere. The sequestration mechanism is coupled with different physical
and chemical processes. A thorough knowledge and understanding of the displacement process
of CO2 and brine is essential for successful execution of any project.
6.1 Conclusions
From this work, it can be concluded that core samples from Wallace quarry have high porosity in
the range of 7-20% and poor permeability in the range of 1-15mD. Moreover, the experiments
performed on the Wallace sandstone core samples using waste cooking oil and crude oil show
that they have similar effect on the core samples. Both types of oils used have changed the
original wettability of Wallace sandstone core samples from strongly water wet to near neutral
wet conditions.
6.2 Recommendations
Wettability plays an important role in CO2 sequestration. This experiment shows that waste
cooking oil has changed the wettability of Wallace sandstone cores from strongly water wet to
near neutral wet. Therefore, it is suggested that experiments should be perform by using a
mixture of CO2 and waste cooking oil to determine the effects on the wettability of reservoir
rocks. It is also recommended that further study should be performed to know the effect of
change in wettability of reservoir rocks on trapping of CO2 in saline aquifers. Pressure and
temperature also effects wettability of reservoir rocks. This experiment was performed at
laboratory pressure and temperature while the pressure and temperature conditions in the
reservoir are different from the laboratory pressure and temperature. Therefore it is suggested
54
that experiments should also be performed in future under reservoir pressure and temperature to
verify the effect of waste cooking oil on spontaneous imbibition and wettability at reservoir
conditions. It is also recommended that a comprehensive study should be performed about the
cost and feasibility of using waste cooking oil as a CO2 thickener in carbon dioxide sequestration
projects.
55
REFERENCES
Ahmed T. (2000). Reservoir Engineering Handbook, 2nd
Edition; Gulf Professional Publishing.
Al Sayari, S.S. (2009). The Influence of Wettability and Carbon Dioxide Injection on
Hydrocarbon Recovery. Ph. D Thesis Imperial College London, retrieved from
www.imperial.ac.uk/.../Saif%20Al-Sayari%20PhD%20thesis.pdf
Amadu, M, Pegg M. (2013), Availability of soluble organics for mobility control in carbon
geosequestration projects. Unpublished work.
Anderson, W.G. (1986a). Wettability Literature Survey- Part 1: Rock/oil/brine Interactions and
The Effects of Core Handling on Wettability. Journal of Petroleum Technology, Trans.,
AIME 281, pp1125-1144
Anderson, W.G., (1986b). Wettability Literature Survey- Part 2: Wettability Measurement.
Journal of Petroleum Technology, 38(10): p. 1246-1262
AOCS (2009). Food Fats and Oils. AOCS Resource Directory, Institute of Shortening and
Edible Oils U.S.
Buckley, J.S., Liu, Y., Monsterleet, S., (1998). Mechanisms of Wetting Alteration by Crude Oils.
SPE Journal.
Buckley, J.S, Morrow, N.R., (2006). Wettability and Prediction of Oil Recovery from Reservoirs
Developed with Modern Drilling and Completion Fluids. University of Wyoming.
Bachu, S. (2003) Screening and Ranking of Sedimentary Basins for Sequestration of CO2
Geological Media in Response to Climate Change. Environmental Geology 44:277–289
CDIAC (2012). Webpage Carbon Dioxide Information Analysis Center. Retrieved from
http://cdiac.ornl.gov/pns/current_ghg.html on September 08, 2012
56
Cosse, R. (1993). Basics of Reservoir Engineering (Oil and Gas Field Development Techniques).
Editions Technip.
Dandekar, A. Y. (2006). Petroleum Reservoir Rock and Fluid Properties. Taylor and Francis
Group, LLC
Dobarganes, M.C., (2009). Formation of New Compounds during Frying - General
Observations. Retrieved from Lipid library on December 13, 2012.
Dooley, J.J., Dahowski, R.T., Davidson, C.L., Wise M.A., Gupta, N., Kim, S.H., Malone E.L.,
(2006). Carbon Dioxide Capture and Geologic Storage, A core element of a global
energy technology strategy to address climate change. Battelle Memorial Institute.
Donaldson, E. C., Thomas, R. D. and Lorenz, P. B (1969). Wettability Determination and Its
Effect on Recovery Efficiency. SPE 2338, Pages 13-14, Bartlesville, Okla.
Donnez, P. (2007). Essentials of Reservoir Engineering. Editions Technip.
Enick, R.M., and Olsen, D.K., (2012), Mobility and Conformance Control for Carbon Dioxide
Enhanced Oil Recovery (CO2-EOR) via Thickeners, Foams, and Gels – A Detailed
Literature Review of 40 Years of Research. National Energy Technology Laboratory
(NETL) U.S.
Espinoza D. N., Kim S. H. and Santamarina J. C. (2011). CO2 Geological Storage-Geotechnical
Implications. KSCE Journal of Civil Engineering 15(4):707-719
Funk, J. (1992). Wettability: Part 5. Laboratory Methods retrieved on December 15, 2012 from
http://archives.datapages.com/data/specpubs/methodo1/data/a095/a095/0001/0200/0218.
htm#sthash.p7ydZFyF.dpuf
57
Garcıa, J.E. and Pruess K. (2003). Flow Instabilities during Injection of CO2 into Saline Aquifers
PROCEEDINGS, TOUGH Symposium 2003, Lawrence Berkeley National Laboratory,
Berkeley, California, May 12-14
Garcia, J. E., (2003). Fluid Dynamics of Carbon Dioxide Disposal into Saline Aquifers. Doctoral
dissertation, University of California, Berkeley retrieved on November12, 2012 from
http://www.escholarship.org/uc/item/2g11g3t9
Glover, P., (1998a). Formation Evaluation MSc Course Notes. Retrieved from
http://www2.ggl.ulaval.ca/personnel/paglover/CD%20Contents/Formation%20Evaluatio
n%20English/Chapter%205.PDF
Glover, P., (1998b). Formation Evaluation MSc Course Notes. Retrieved from
http://www2.ggl.ulaval.ca/personnel/paglover/CD%20Contents/Formation%20Evaluatio
n%20English/Chapter%207.PDF
Green, D. W., Willhite, G.P. (1998). Enhanced Oil Recovery. Society of Petroleum Engineers
Inc. Richardson Texas U.S.
Hartai, E., (2012). Carbon Dioxide Storage in Geological Reservoirs. Institute of Mineral and
Geology, Hungary
IPCC (2001). IPCC Third Assessment Report - Climate Change 2001 (Intergovernmental Panel
on Climate Change). IPCC.
IPCC (2005). IPCC Special Report on Carbon Dioxide Capture and Storage (Intergovernmental
Panel on Climate Change, 2005). IPCC. Geneva.
Juanes, R., Spiteri, E. J., Orr Jr. F. M., and Blunt M. J., (2006). Impact of Relative Permeability
Hysteresis on Geological CO2 Storage. Water Resource Research, Vol. 42. W12418
58
Jung, J. W. and Wan, J. (2012). Supercritical CO2 and Ionic Strength Effects on Wettability of
Silica Surfaces: Equilibrium Contact Angle Measurements. Energy Fuels, 26 (9), pp
6053–6059 retrieved from http://pubs.acs.org.
Kim Y., Wan J., Kneafsey T. J., Tokunaga T.K., (2012). Dewetting of Silica Surfaces Upon
Reaction with Supercritical CO2 and Brine: Porescale Studies in Micromodels.
Environmental Science and Technology 2012, 46, 4228-4235
Lake, L.W. (1988). Enhanced Oil Recovery. Prentice Hall; Facsimile Edition
Lam, M. K., Lee, K. T., Mohamed, A. R. (2010). Homogeneous, heterogeneous and enzymatic
catalysis for transesterification of high free fatty acid oil (waste cooking oil) to biodiesel:
A review. Biotechnology Advances 28, 500-518
MacMinn C. W., Juanes R., (2009). Post-injection Spreading and Trapping of CO2 in Saline
Aquifers: Impact of the Plume Shape at the End of Injection. Comput. Geosci. 13:483–
491
Martel, A.T., Gibling, M. R., Nguyen, M. (2001). Brines in the Carboniferous Sydney Coal field,
Atlantic Canada. Applied Geochemistry 16, 35-55
Melberg, E. (2010), Experimental study of low salinity EOR effects from the Varg field. Masters
in Petroleum Technology Thesis, University of Stavanger.
Mićić V., Novaković D., Lepojević, Jotanović M., Pejović B., Dugić P., Petrović Z., (2011),
Supercritical Fluid Extraction With Carbon Dioxide at Different Pressures.
Contemporary Materials II−, p 84-87
Morrow, N.R. (1990). Wettability and its effects on Oil Recovery. SPE Paper# 21621
59
Marsal, A., Celma, P. J.,Cot, J. and Cequier, M.,(2000). Supercritical CO2 extraction as a clean
degreasing process in the leather industry. The Journal of Supercritical Fluids. Volume
16, Issue 3, 15 January 2000, Pages 217-223
Nolte, B. (2011). Tanking Up With Cooking Oil. Chemmatter April (2011). retrieved from
www.acs.org/chemmatters.
Olsen, M. (2007). Enhanced oil recovery in limestone, Chemical effects of seawater injection on
the rock surface at different temperatures. Master’s Thesis Stavanger University.
Rosenbauer,R.J., Koksalan, T., Palandri, J. L., (2005). Experimental Investigation of CO2–Brine–
Rock interactions at elevated temperature and pressure: Implications for CO2
sequestration in deep-saline aquifers. Fuel Processing Technology 86 (2005) 1581– 1597
Ruiz-Méndez, M.V., Marmesat,S., Liotta, A. and Dobarganes M.C.(2008). Analysis of Used
Frying Fats for the Production of Biodiesel. GRASAS Y ACEITES, 59 (1), ENERO-
MARZO, 45-50, 2008, ISSN: 0017-3495
Salathiel, R.A. (1973). Oil recovery by surface film drainage in mixed-wettability rocks. Journal
of Petroleum Technology, October, pp. 1216-1224.
Sengul, M. (2006). CO2 Sequestration- A Safe Transition Technology. SPE Paper # 98617
Shakhashiri, B.Z. (2008). Chemical of the Week, Fats and Oils, General Chemistry retrieved
from www.scifun.org. On January 24, 2013
Sheng, J.J., (2011) .Modern Chemical EOR Theory and Practice. Gulf Professional Publishing
Stauffer Philip H., Gordon N. K., Richard S. M., Hari S. V., Kathryn A. B., Rajinder P. S.,
Rajesh J. P., and Anthony M. (2011). Greening Coal: Breakthroughs and Challenges in
Carbon Capture and Storage. Environ. Sci. Technol., 45, 8597–8604
Stoytcheva, M., and Montero, G., (2011). Biodiesel-Feedstocks and Processing Technologies.
60
InTech Publishing.
Shukla, R., Ranjith, P., Haque, A., Choi, X., (2010). A Review of Studies on CO2 Sequestration
and Caprock Integrity. Fuel 89(2010)2651-2664
Tiab, D., Donaldson E. C. (2011). Petrophysics: Theory and Practice of Measuring Reservoir
Rock and Fluid Transport Properties. Gulf Professional Publishing.
Tripathi, I. and Mohanty, K.K. (2007). Flow Instability Associated With Wettability Alteration.
University of Houston, SPE Paper# 110202
Torsæter, O., Abtahi, M.,(2000). Experimental Reservoir Engineering Laboratory Work Book.
Norwegian University of Science and Technology, Trondheim, Norway.
Wallace Quarries Ltd, (2001). Wallace Quarries - Test Data. Retrieved from
http://www.wallacequarries.com/uploads/6/5/0/8/6508836/test_data.pdf
Wang, Y., Zhang, C., Wei, N., Oostrom, M., Wietsma, T. W., Li, Xiaochun, Bonneville, A.
(2012). Experimental Study of Cross Over from Capillary to Viscous Fingering for
Supercritical CO2- Water Displacement in a Homogenous Pore Network. Environmental
Science and Technology retrieved from www.pubs.acs.org/est.
Zhang, C., Oostrom M., Grate J. W.; Wietsma T. W. and Warner M. G. (2011). Liquid CO2
Displacement of Water in a Dual-Permeability Pore Network Micromodel. Environ. Sci.
Technol., 45, 7581–7588
Zhangxin C. (1962). Reservoir Simulation-Mathematical Techniques in Oil Recovery. Society
for Industrial and Applied Mathematics.
Zolotukhin, A.B. and Ursin, J.R. (2000), Introduction to Petroleum Reservoir Engineering,
Høyskoleforlaget, Norwegian Academic Press.
61
APPENDIX A: Spontaneous imbibition tests results
Table A-1 Spontaneous imbibition test data of WS-1 (100% oil saturation)
Imbibition Time (min) Oil Recovery (ml)
0 0.0
60 0.07
90 0.13
180 0.17
260 0.22
480 0.22
600 0.22
800 0.22
1540 0.22
2150 0.22
2860 0.22
3300 0.22
5020 0.22
5740 0.22
6280 0.22
7020 0.22
7720 0.22
8440 0.22
62
Table A-2 Spontaneous imbibition test data of WS-2 (100% oil saturation)
Imbibition Time (min) Oil Recovery (ml)
0 0.00
60 0.05
90 0.15
180 0.18
260 0.24
480 0.24
600 0.24
800 0.24
1540 0.24
2150 0.24
2860 0.24
3300 0.24
4320 0.24
63
Table A-3 Spontaneous imbibition test data of WS-3 (100% oil saturation)
Imbibition Time (min) Oil Recovery (ml)
0 0.00
60 0.03
90 0.15
180 0.10
260 0.18
480 0.19
600 0.19
800 0.19
1540 0.19
2150 0.19
2860 0.19
3300 0.19
4320 0.20
64
Table A-4 Spontaneous imbibition test data of WS-4 (100% oil saturation)
Imbibition Time (min) Oil Recovery (ml)
0 0.00
60 0.07
90 0.15
180 0.18
260 0.20
480 0.20
600 0.20
800 0.20
1540 0.20
2150 0.20
2860 0.20
3300 0.20
5020 0.20
5740 0.20
6280 0.20
7020 0.20
7720 0.20
8440 0.20
9660 0.20
65
APPENDIX B: Details of Instruments and Chemical Used in this Experiment
Table B-1 Lists of instruments used in the experiment
Instrument Manufacturer Purpose Model #
Vernier Calliper Fisher Scientific Core Dimension Measurement 700-127
Thermometer Fisher Scientific Temperature Measurement 08285-90
Vacuum Oven Cole Parmer Core Saturation 281-A
Hydrometer Thermo Fisher Density Measurement 08285-90
Viscometer Canon Instruments Company Viscosity Measurement 3C-K926
Kinematic
Viscosity Bath
Kohler Instruments Company
Inc.
Constant Temperature
Viscosity Measurement
K23702
Roller Oven Fann Instruments Company
Texas
Core Drying 704ES
Benchtop
Relative
Permeameter
Vinci Technologies France Permeability Measurement,
Core Flooding
BRP-350
Digital Scale Denver Instruments Weight TP-12
Amott
Imbibition Cell
Vinci Technologies France Spontaneous Imbibition custom
Filter Paper Fisher Scientific Filtration 09-801D
Waterproof pH
Tester 30
EUTECH Instruments pH value measurement 1350684
66
Table B-2 List of chemicals used in experiment
Chemical Supplier Purity CAS #
Methanol Fisher Scientific 99.8% A.C.S. 67-56-1
Toluene Fisher Scientific Lab Grade 108-88-3
NaCl Fisher Scientific 100% 7647-14-5
CaCl2 Sigma Aldrich Company 99% 10043-52-4
67
APPENDIX C: Benchtop Relative Permeameter Part List (BRP-350)
68
Benchtop Relative Permeameter Parts List (BRP-350)