62
REPORT TO THE CONGRESSIONAL DEFENSE COMMITTEES The Effect of Windmill Farms On Military Readiness 2006 Office of the Director of Defense Research and Engineering

REPORT TO THE CONGRESSIONAL DEFENSE
COMMITTEES
The Effect of Windmill Farms On Military Readiness
2006
Office of the Director of Defense Research and Engineering
EXECUTIVE SUMMARY
SECTION 358, NATIONAL DEFENSE AUTHORIZATION ACT FOR FISCAL YEAR 2006 (PUBLIC LAW 109-163) REPORT ON EFFECTS OF WINDMILL FARMS ON MILITARY READINESS. Not later than 120 days after the date of the enactment of this Act, the Secretary of Defense shall submit to the Committee on Armed Services of the Senate and the Committee on Armed Services of the House of Representatives a report on the effects of windmill farms on military readiness, including an assessment of the effects on the operations of military radar installations of the proximity of windmill farms to such installations and of technologies that could mitigate any adverse effects on military operations identified.
Overview There is growing public and private sector interest in generating electrical power
using wind energy. According to the Department of Energy, over 60,000 megawatts of wind power capacity is in operation worldwide with over 10,000 megawatts installed in the United States. These systems are largely comprised of installations of up to several hundred wind turbines with rotating blades reaching to heights of up to 500 feet. The numbers, height and rotation of these wind turbines present technical challenges to the effectiveness of radar systems that must be carefully evaluated on a case-by-case basis to ensure acceptable military readiness is maintained. For many cases, processes are in place to allow responsible federal authorities to complete determination of acceptability of wind turbine impacts on military readiness. However, since wind energy use in the United States is dramatically increasing, research and interagency coordination is warranted to enhance capability for completing timely determinations and developing measures for mitigating readiness impacts. This report focuses on the effects of wind farms on air defense and missile warning radars and the resulting potential impact on military readiness. Its scope is limited to these specific subjects and is based on the current level of understanding regarding interactions between such defense systems and state-of-the-art wind turbines.
The report begins with a brief introduction of the key principles of radar systems, describes in what circumstances wind farms might cause problems for the Department and under what circumstances such wind farms would not cause problems. Radar test results from multiple flight trials near wind farms performed by the United Kingdom Ministry of Defence are discussed. The results from those flight trials documented that state-of-the-art utility-class wind turbines can have a significant impact on the operational capabilities of military air defense radar systems. The results demonstrated that the large radar cross section of a wind turbine combined with the Doppler frequency shift produced by its rotating blades can impact the ability of a radar to discriminate the wind turbine from an aircraft. Those tests also demonstrated that the wind farms have the potential to degrade target tracking capabilities as a result of shadowing and clutter effects.
2

The Department sponsored a testing campaign as a part of this study to establish a technical database on the radar cross section and Doppler behavior of a modern utility-class wind turbine that can be used to support development of future mitigation approaches. This testing was performed using the state-of-the-art Air Force Research Laboratory Mobile Diagnostic Laboratory (MDL) which is certified to perform radar measurements to the most stringent national standards. The test procedures, samples of the experimental test data, and calibration methodology have been documented in a report. The full data set has been made available to U.S. radar contractors and government-sponsored researchers.
The report discusses a number of mitigation approaches that might be employed to reduce the impact wind turbines can have on an air defense radar. Only three methods so far have been proven to be completely effective in preventing any impairment of primary radar systems. Employment of these or other approaches that could produce marginal, but acceptable, impacts on defense capabilities need to be assessed on a case-by-case basis.
The report discusses potential wind farm impacts on Department test and training capabilities, security on and around defense installations, through introduction of electromagnetic noise in special electronic system testing areas, and the general environment.
The Department recognizes that wind energy use is dramatically increasing in the United States. Development of additional mitigation technologies is important to enable robust expansion of wind generation capacity to continue while concurrently maintaining defense capabilities for our Nation. The also describes exploratory development efforts initiated by the Department to advance the state of maturity of other mitigation approaches that could be employed in the future are also described in the report.
Appendices are provided describing the policies employed in several NATO countries to govern wind farm development and how wind farms can impact the performance of U.S. Comprehensive Test Ban Treaty monitoring systems.
Conclusions and Recommendations Given the expected increase in the U.S. wind energy development, the existing
siting processes as well as mitigation approaches need to be reviewed and enhanced in order to provide for continued development of this important renewable energy resource while maintaining vital defense readiness. The Department of Defense strongly supports the development of renewable energy sources and is a recognized leader in the use of wind energy. As one of the largest consumers of energy, the Department is keenly aware of the budgetary pressures that recent increases in the cost of energy have created for all Americans and continues to invest in the development of alternative energy sources. However, the Department is also mindful of its responsibility to maintain its capabilities to defend the nation.
Consequently, the Department, as a result of this study, makes the following conclusions and recommendations regarding the challenges and areas for further attention, in coordination with other Federal agencies, to allow for construction of wind turbines while maintaining defense readiness capabilities:
3
• Although wind turbines located in radar line of sight of air defense radars can adversely impact the ability of those units to detect and track, by primary radar return, any aircraft or other aerial object, the magnitude of the impact will depend upon the number and locations of the wind turbines. Should the impact prove sufficient to degrade the ability of the radar to unambiguously detect and track objects of interest by primary radar alone this will negatively impact the readiness of U.S. forces to perform the air defense mission.
• The mitigations that exist at present to completely preclude any adverse impacts on air defense radars are limited to those methods that avoid locating the wind turbines in radar line of sight of such radars. These mitigations may be achieved by distance, terrain masking, or terrain relief and requires case-by-case analysis.
• The Department has initiated efforts to develop additional mitigation approaches. These require further development and validation before they can be employed.
• The analysis that had been performed for the early warning radar at Cape Cod Air Force Station was overly simplified and technically flawed. A more comprehensive analysis followed by development of appropriate offset criteria for fixed-site missile early warning radars should be performed on an expedited basis.
• Wind turbines in close proximity to military training, testing, and development sites and ranges can adversely impact the “train and equip” mission of the Department. Existing processes to include engagement with local and regional planning boards and development approval authorities should be employed to mitigate such potential impacts.
• Wind turbines located in close proximity to Comprehensive Test Ban Treaty monitoring sites can adversely impact their ability to perform this mission by increasing ambient seismic noise levels. Appropriate offset distance criteria should be developed to mitigate such potential impacts.
• The Federal Aviation Administration (FAA) has the responsibility to promote and maintain the safe and efficient use of U.S. airspace for all users. The Department defers to the FAA regarding possible impacts wind farms may have on the Air Traffic Control (ATC) radars employed for management of the U.S. air traffic control system. The Department stands prepared to assist and support the FAA in any efforts the FAA may decide to undertake in that regard.
• The National Weather Service (NWS) has the primary responsibility to provide accurate weather forecasting services for the nation. The Department defers to the NWS regarding identification of impacts wind farms may have on weather radars and development of appropriate mitigation measures. The Department stands prepared to work with the NWS in this area on NWS identified mitigation measures that have the potential to benefit Department systems.
4

Table of Contents 1. Introduction
Focus of Study Brief History of the Development of Wind Energy Systems Fundamentals of Radar
2. Types of Radar Systems Primary Surveillance Radar Secondary Surveillance Radar Missile Early Warning Radar Weather Radar 3. General Principles of Operation
Use of Clutter Cells and Background Averagers Moving Target Indication/Moving Target Detection Principles Target Declaration and Tracking 4. Characteristics of Wind Turbines Applicable to Radars
DOD-Sponsored Field Testing of an SOA Wind Turbine 5. Observations of Impacts on Radar Systems United Kingdom Flight Trials and Analyses Observations of Wind Turbine Impacts on U.S. Operational Radars Testing Performed at King Mountain, TX Testing Performed at Tyler, MN Other Observations About U.S. Radar Systems
Comments Regarding Air Traffic Control and Weather Radars 6. Potential Mitigation Approaches Line of Sight Mitigation Techniques Wind Turbine Radar Signature Suppression Concepts Concepts for Radar Hardware/Software Modifications Concepts for Gap Filler Mitigation Approaches Testing and Verification Factors 7. Other Potential Impacts on DOD Readiness Overflight and Obstruction Security Signature Environment Summary of Potential Mitigation Approaches 8. Summary Air Defense Radars - Shadowing Air Defense Radars - Clutter Missile Early Warning Radars Air Traffic Control Radars Weather Radars Other Potential Impacts on DOD Readiness Treaty Compliance Sites 9. Conclusions
5

References Appendix 1: Policies Employed by Select NATO Countries Appendix 2: Impacts on Treaty Compliance Systems
6

List of Figures 1. Scientific American illustration of the 1888 Brush Windmill in Cleveland, Ohio 2. Illustration of a basic radar system 3. Notional main, side, and back lobes of a 2-D radar 4. Geometric approximation to estimate radar line of sight 5. Regions of partial and complete blockage of radar illumination 6. Effect of a diffraction grating on a propagating wave 7. RCS values for several common objects 8. RCS values for C-29 aircraft as a function of view angle 9. Two common types of 3-D radar 10. Notional elevation side lobe for fifth beam of the Figure 9b phased-array radar 11. PSR and SSR antennas of the UK Watchman ATC radar 12. Upgraded Early Warning Radar at Beale AFB, CA 13. First NEXRAD WSR-88D radar, Norman, OK 14. Clutter cell example 15. Relationship between clutter and resolution cells 16. Picture of SOA wind turbines located in Wales, UK 17. AFRL Mobile Diagnostics Laboratory measuring wind turbines at Fenner, NY 18. Layout of the wind farm at Fenner, NY, and locations of the turbines tested 19. Graphical representation of data obtained during field tests at Fenner, NY 20. Example of Doppler characteristics of a wind turbine at L-band 21. Graphical summary of RCS measurements for L-, C-, S-, and X-bands 22. Doppler frequencies and derived tip velocities from measurements at L-, C-, S-, and
X-band frequencies 23. Commander AR327 - Type 101 air defense radar 24. Example of data obtained during Fall 2004 flight trial 25. Sector of clutter cells superimposed on flight trial data obtained during Spring 2005
flight trial 26. Location of wind turbines with respect to ARSR-4 radar at King Mountain 27. Picture of wind turbines and ARSR-2 radar at Tyler, MN 28. Location of wind turbines with respect to ARSR-2 radar at Tyler 29. Tracking performance of ARSR-2 radar over wind farm at Tyler, MN 30. Illustration of “bald earth” line of sight mitigation approach 31. Illustrative results of line of sight distance offsets using a “bald earth” approach 32. Illustration of “terrain masking” line of sight mitigation approach 33. Illustration of “beam propagation” analysis to evaluate “terrain masking” 34. Overlapping radar coverage example
List of Tables 1. Physical data for representative SOA turbines 2. Decibel (dB) equivalents for some common numerical ratios 3. Approximate primary beam elevations for an Early Warning Radar
7
1. INTRODUCTION
Focus of Study
This report has been prepared in response to Section 358 of the National Defense Authorization Act for Fiscal Year 2006 concerning the impacts wind farms may have on U.S. military readiness, to include an assessment on operation of military radar installations and technologies that could mitigate any adverse effects identified. The intent is to ensure that the accelerating development of wind energy systems within the United States will occur in a manner that also preserves the capability of U.S. military forces to protect the homeland.
This report specifically discusses how megawatt (MW) class state-of-the-art (SOA) wind turbines can impact domestically sited U.S. air defense and missile warning radar systems. Wind turbines of this size are typically considered to be “bulk-power utility-scale” units often employed in “wind farms” to provide electricity for local or regional power grids. Within the context of this report, the term “wind farm” will be employed to denote a collection of two or more megawatt class wind turbines within a geographical area that may range in size from a few acres to hundreds of acres.
The report does not attempt to consider impacts that could occur from small “homeowner” type wind turbine systems. Modern versions of such units are relatively small in physical size, with generating capacities in the low kilowatt (kW) range. They are not anticipated to have significant impact unless located directly adjacent to a domestic defense system. This is not considered to be a highly probable occurrence since land directly adjacent to domestic defense systems is generally under the positive control of the federal government.
The report describes existing as well as possible future mitigation techniques that could be employed to mitigate impacts for megawatt wind turbines. Finally, it describes science and technology efforts already being pursued to develop additional future mitigation approaches.
Brief History of the Development of Wind Energy Systems According to the history page of the Danish Wind Industry Association
(www.windpower.org), the first automatically operated windmill employed to generate electricity was built in Cleveland, Ohio, in 1888. Figure 1 provides an illustration of this system that appeared on the front page of the 20 December 1890 edition of Scientific American. While physically large, the 17 m diameter rotor was only able to generate 12 kW of power.
For the next 40 years a variety of low-power wind turbine designs were developed. Some were employed to provide power to local electrical grids or at remotely located farms not connected to electrical grid networks. The development of bulk power utility-scale turbines, units with generating capacities on the order of 100 kW or more, appears to have begun in earnest in the 1930s in multiple nations but this did not lead to the development of any major commercially operated “wind farms” for bulk power
8
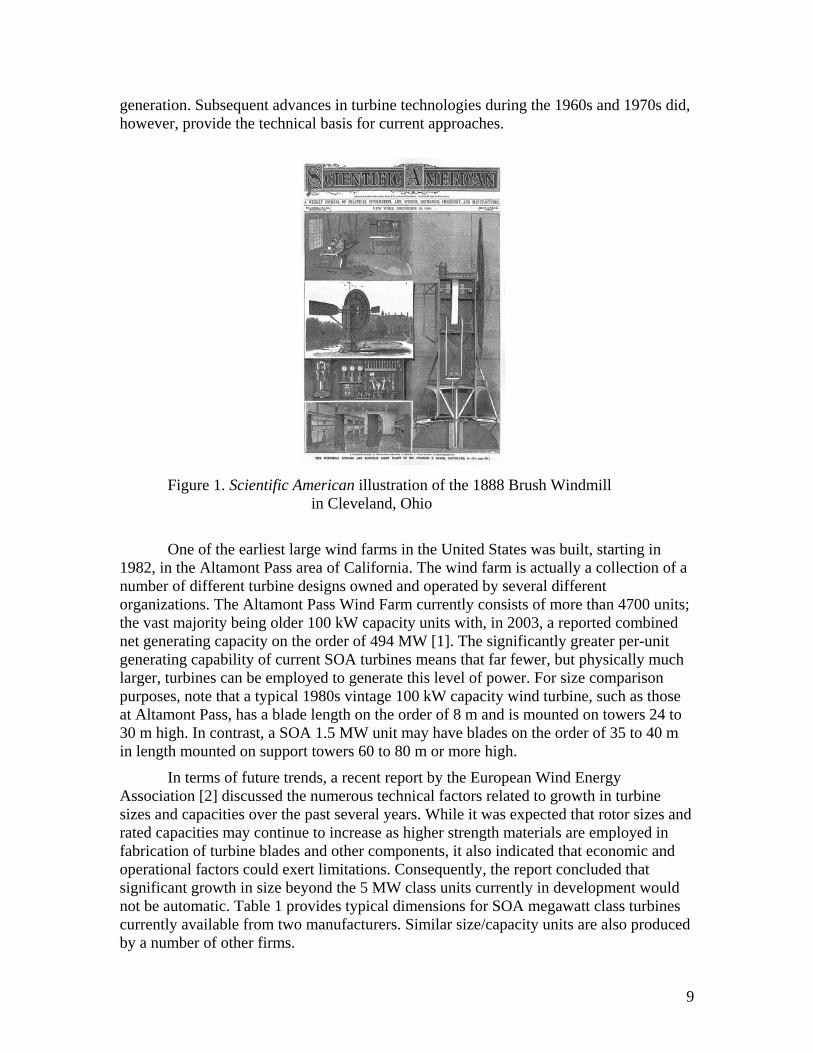
generation. Subsequent advances in turbine technologies during the 1960s and 1970s did, however, provide the technical basis for current approaches.
Figure 1. Scientific American illustration of the 1888 Brush Windmill
in Cleveland, Ohio
One of the earliest large wind farms in the United States was built, starting in 1982, in the Altamont Pass area of California. The wind farm is actually a collection of a number of different turbine designs owned and operated by several different organizations. The Altamont Pass Wind Farm currently consists of more than 4700 units; the vast majority being older 100 kW capacity units with, in 2003, a reported combined net generating capacity on the order of 494 MW [1]. The significantly greater per-unit generating capability of current SOA turbines means that far fewer, but physically much larger, turbines can be employed to generate this level of power. For size comparison purposes, note that a typical 1980s vintage 100 kW capacity wind turbine, such as those at Altamont Pass, has a blade length on the order of 8 m and is mounted on towers 24 to 30 m high. In contrast, a SOA 1.5 MW unit may have blades on the order of 35 to 40 m in length mounted on support towers 60 to 80 m or more high.
In terms of future trends, a recent report by the European Wind Energy Association [2] discussed the numerous technical factors related to growth in turbine sizes and capacities over the past several years. While it was expected that rotor sizes and rated capacities may continue to increase as higher strength materials are employed in fabrication of turbine blades and other components, it also indicated that economic and operational factors could exert limitations. Consequently, the report concluded that significant growth in size beyond the 5 MW class units currently in development would not be automatic. Table 1 provides typical dimensions for SOA megawatt class turbines currently available from two manufacturers. Similar size/capacity units are also produced by a number of other firms.
9
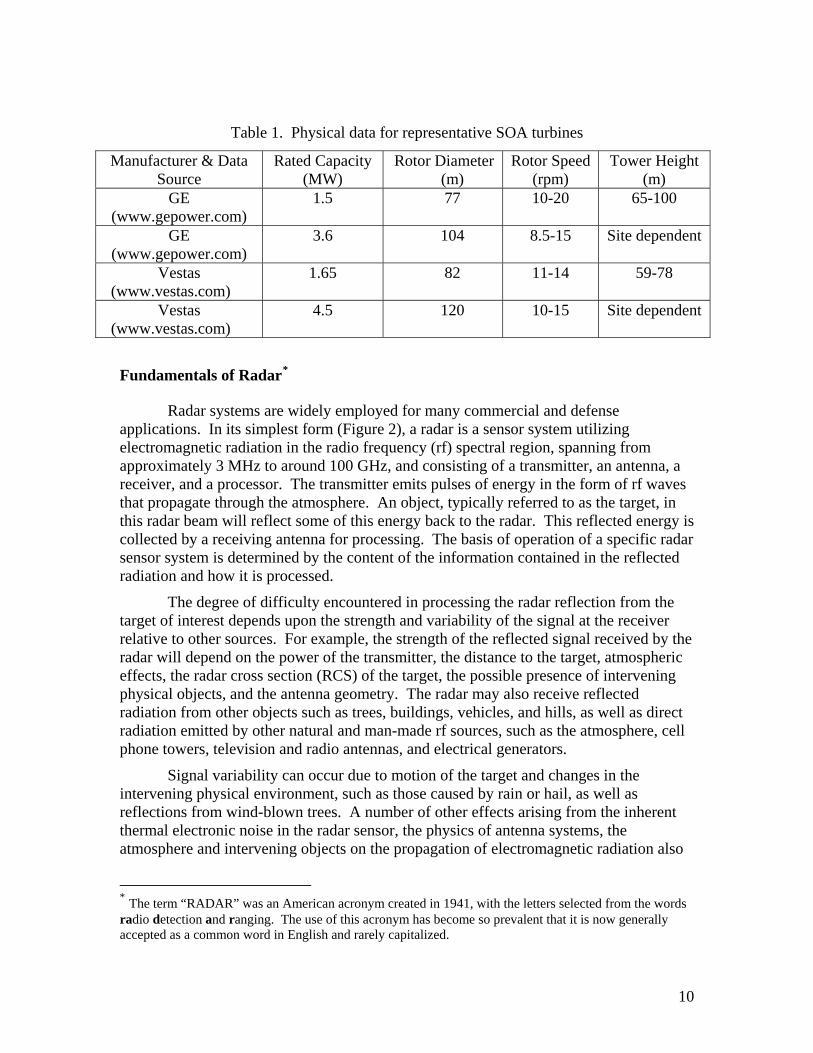
Table 1. Physical data for representative SOA turbines
Manufacturer & Data Source
Rated Capacity (MW)
Rotor Diameter (m)
Rotor Speed (rpm)
Tower Height (m)
GE (www.gepower.com)
1.5 77 10-20 65-100
GE (www.gepower.com)
3.6 104 8.5-15 Site dependent
Vestas (www.vestas.com)
1.65 82 11-14 59-78
Vestas (www.vestas.com)
4.5 120 10-15 Site dependent
Fundamentals of Radar*
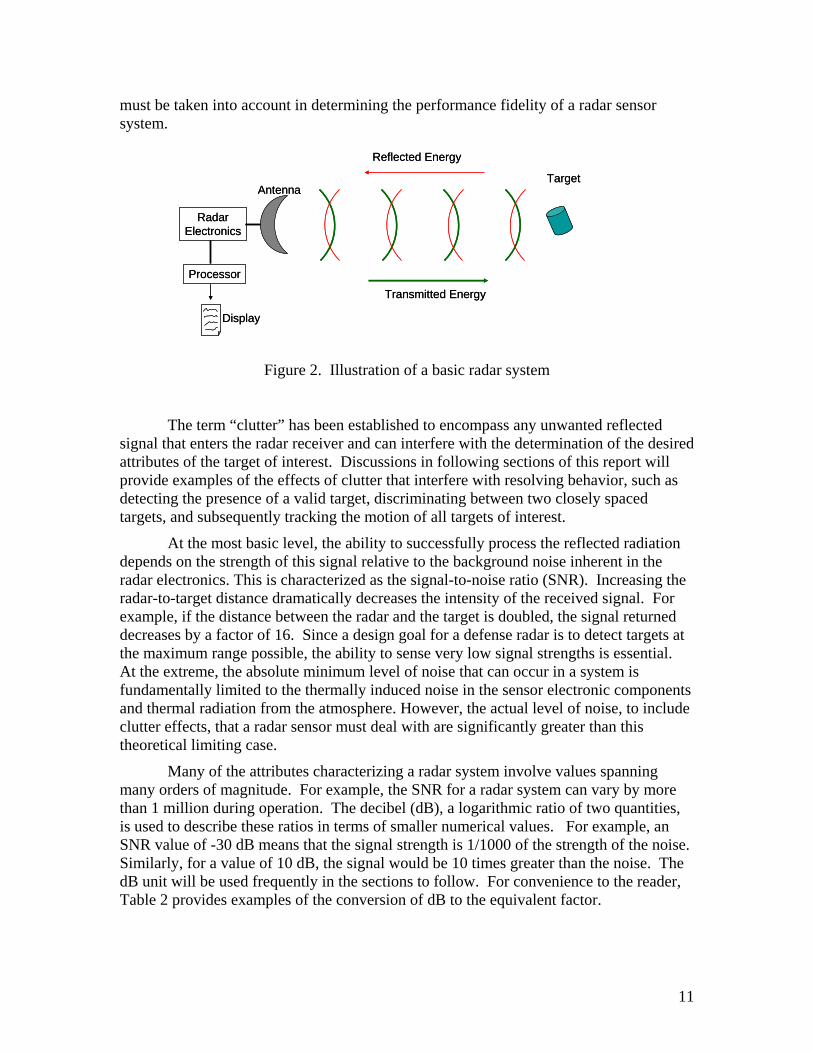
Radar systems are widely employed for many commercial and defense applications. In its simplest form (Figure 2), a radar is a sensor system utilizing electromagnetic radiation in the radio frequency (rf) spectral region, spanning from approximately 3 MHz to around 100 GHz, and consisting of a transmitter, an antenna, a receiver, and a processor. The transmitter emits pulses of energy in the form of rf waves that propagate through the atmosphere. An object, typically referred to as the target, in this radar beam will reflect some of this energy back to the radar. This reflected energy is collected by a receiving antenna for processing. The basis of operation of a specific radar sensor system is determined by the content of the information contained in the reflected radiation and how it is processed.
The degree of difficulty encountered in processing the radar reflection from the target of interest depends upon the strength and variability of the signal at the receiver relative to other sources. For example, the strength of the reflected signal received by the radar will depend on the power of the transmitter, the distance to the target, atmospheric effects, the radar cross section (RCS) of the target, the possible presence of intervening physical objects, and the antenna geometry. The radar may also receive reflected radiation from other objects such as trees, buildings, vehicles, and hills, as well as direct radiation emitted by other natural and man-made rf sources, such as the atmosphere, cell phone towers, television and radio antennas, and electrical generators.
Signal variability can occur due to motion of the target and changes in the intervening physical environment, such as those caused by rain or hail, as well as reflections from wind-blown trees. A number of other effects arising from the inherent thermal electronic noise in the radar sensor, the physics of antenna systems, the atmosphere and intervening objects on the propagation of electromagnetic radiation also
* The term “RADAR” was an American acronym created in 1941, with the letters selected from the words radio detection and ranging. The use of this acronym has become so prevalent that it is now generally accepted as a common word in English and rarely capitalized.
10
must be taken into account in determining the performance fidelity of a radar sensor system.
Reflected Energy
Transmitted Energy
AntennaTarget
Processor
RadarElectronics
Display
Reflected Energy
Transmitted Energy
AntennaTarget
Processor
RadarElectronics
Display
Figure 2. Illustration of a basic radar system
The term “clutter” has been established to encompass any unwanted reflected signal that enters the radar receiver and can interfere with the determination of the desired attributes of the target of interest. Discussions in following sections of this report will provide examples of the effects of clutter that interfere with resolving behavior, such as detecting the presence of a valid target, discriminating between two closely spaced targets, and subsequently tracking the motion of all targets of interest.
At the most basic level, the ability to successfully process the reflected radiation depends on the strength of this signal relative to the background noise inherent in the radar electronics. This is characterized as the signal-to-noise ratio (SNR). Increasing the radar-to-target distance dramatically decreases the intensity of the received signal. For example, if the distance between the radar and the target is doubled, the signal returned decreases by a factor of 16. Since a design goal for a defense radar is to detect targets at the maximum range possible, the ability to sense very low signal strengths is essential. At the extreme, the absolute minimum level of noise that can occur in a system is fundamentally limited to the thermally induced noise in the sensor electronic components and thermal radiation from the atmosphere. However, the actual level of noise, to include clutter effects, that a radar sensor must deal with are significantly greater than this theoretical limiting case.
Many of the attributes characterizing a radar system involve values spanning many orders of magnitude. For example, the SNR for a radar system can vary by more than 1 million during operation. The decibel (dB), a logarithmic ratio of two quantities, is used to describe these ratios in terms of smaller numerical values. For example, an SNR value of -30 dB means that the signal strength is 1/1000 of the strength of the noise. Similarly, for a value of 10 dB, the signal would be 10 times greater than the noise. The dB unit will be used frequently in the sections to follow. For convenience to the reader, Table 2 provides examples of the conversion of dB to the equivalent factor.
11
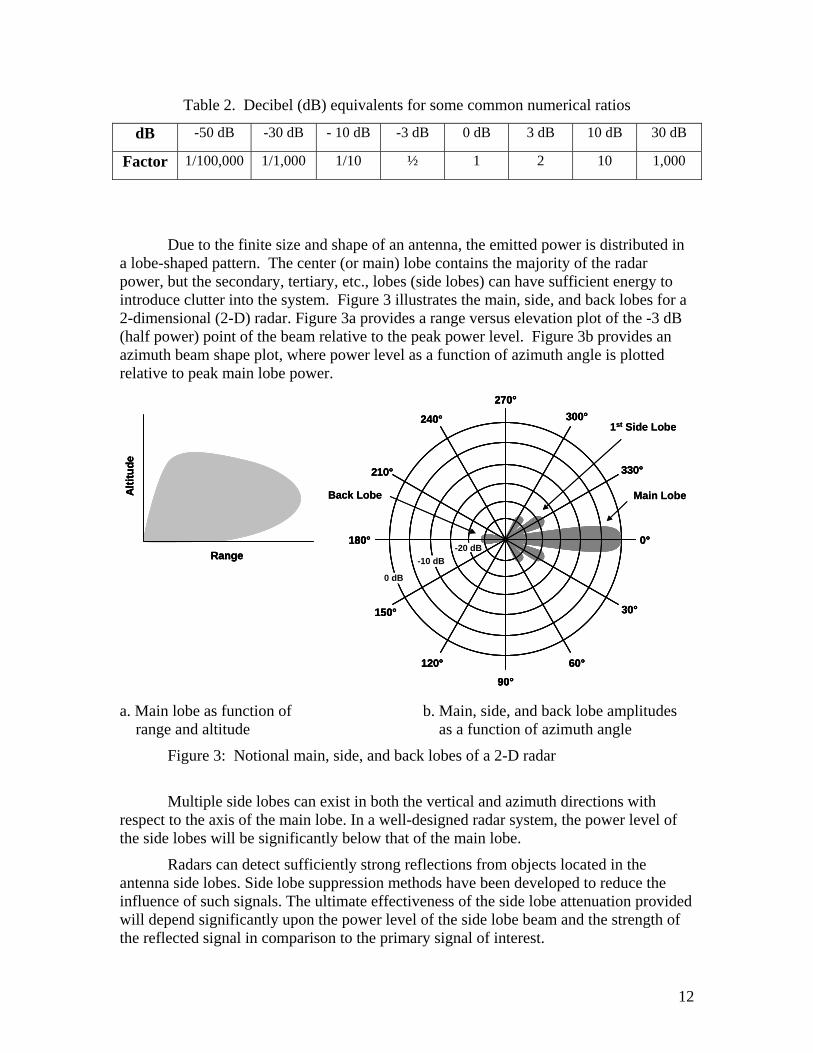
Table 2. Decibel (dB) equivalents for some common numerical ratios
dB -50 dB -30 dB - 10 dB -3 dB 0 dB 3 dB 10 dB 30 dB
Factor 1/100,000 1/1,000 1/10 ½ 1 2 10 1,000
Due to the finite size and shape of an antenna, the emitted power is distributed in a lobe-shaped pattern. The center (or main) lobe contains the majority of the radar power, but the secondary, tertiary, etc., lobes (side lobes) can have sufficient energy to introduce clutter into the system. Figure 3 illustrates the main, side, and back lobes for a 2-dimensional (2-D) radar. Figure 3a provides a range versus elevation plot of the -3 dB (half power) point of the beam relative to the peak power level. Figure 3b provides an azimuth beam shape plot, where power level as a function of azimuth angle is plotted relative to peak main lobe power.
90°
0°
30°
60°
300°
120°
150°
180°
210°
240°
270°
330°
Range
Alti
tude
Main Lobe
1st Side Lobe
Back Lobe
90°
0°
30°
60°
300°
120°
150°
180°
210°
240°
270°
330°
90°
0°
30°
60°
300°
120°
150°
180°
210°
240°
270°
330°
Range
Alti
tude
Range
Alti
tude
Main Lobe
1st Side Lobe
Back Lobe
0 dB
-10 dB-20 dB
a. Main lobe as function of b. Main, side, and back lobe amplitudes range and altitude as a function of azimuth angle
Figure 3: Notional main, side, and back lobes of a 2-D radar
Multiple side lobes can exist in both the vertical and azimuth directions with respect to the axis of the main lobe. In a well-designed radar system, the power level of the side lobes will be significantly below that of the main lobe.
Radars can detect sufficiently strong reflections from objects located in the antenna side lobes. Side lobe suppression methods have been developed to reduce the influence of such signals. The ultimate effectiveness of the side lobe attenuation provided will depend significantly upon the power level of the side lobe beam and the strength of the reflected signal in comparison to the primary signal of interest.
12
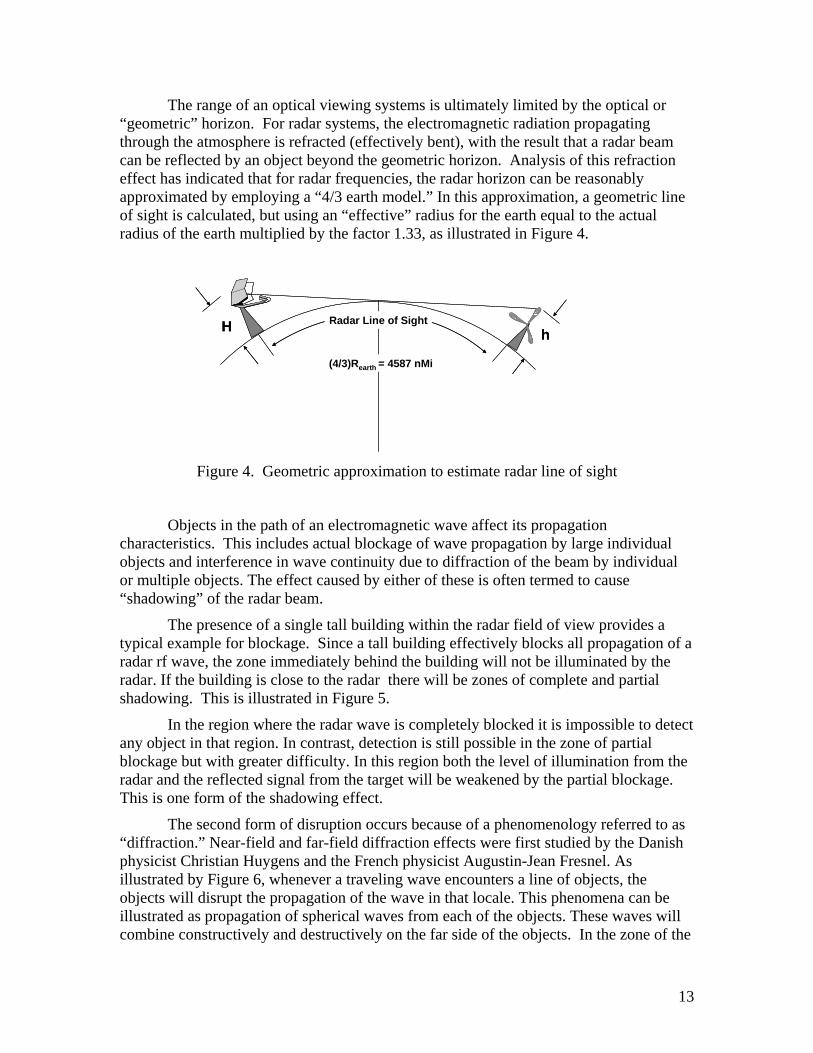
The range of an optical viewing systems is ultimately limited by the optical or “geometric” horizon. For radar systems, the electromagnetic radiation propagating through the atmosphere is refracted (effectively bent), with the result that a radar beam can be reflected by an object beyond the geometric horizon. Analysis of this refraction effect has indicated that for radar frequencies, the radar horizon can be reasonably approximated by employing a “4/3 earth model.” In this approximation, a geometric line of sight is calculated, but using an “effective” radius for the earth equal to the actual radius of the earth multiplied by the factor 1.33, as illustrated in Figure 4.
Radar Line of Sight
(4/3)Rearth = 4587 nMi
hH Radar Line of Sight
(4/3)Rearth = 4587 nMi
hH
Figure 4. Geometric approximation to estimate radar line of sight
Objects in the path of an electromagnetic wave affect its propagation characteristics. This includes actual blockage of wave propagation by large individual objects and interference in wave continuity due to diffraction of the beam by individual or multiple objects. The effect caused by either of these is often termed to cause “shadowing” of the radar beam.
The presence of a single tall building within the radar field of view provides a typical example for blockage. Since a tall building effectively blocks all propagation of a radar rf wave, the zone immediately behind the building will not be illuminated by the radar. If the building is close to the radar there will be zones of complete and partial shadowing. This is illustrated in Figure 5.
In the region where the radar wave is completely blocked it is impossible to detect any object in that region. In contrast, detection is still possible in the zone of partial blockage but with greater difficulty. In this region both the level of illumination from the radar and the reflected signal from the target will be weakened by the partial blockage. This is one form of the shadowing effect.
The second form of disruption occurs because of a phenomenology referred to as “diffraction.” Near-field and far-field diffraction effects were first studied by the Danish physicist Christian Huygens and the French physicist Augustin-Jean Fresnel. As illustrated by Figure 6, whenever a traveling wave encounters a line of objects, the objects will disrupt the propagation of the wave in that locale. This phenomena can be illustrated as propagation of spherical waves from each of the objects. These waves will combine constructively and destructively on the far side of the objects. In the zone of the
13
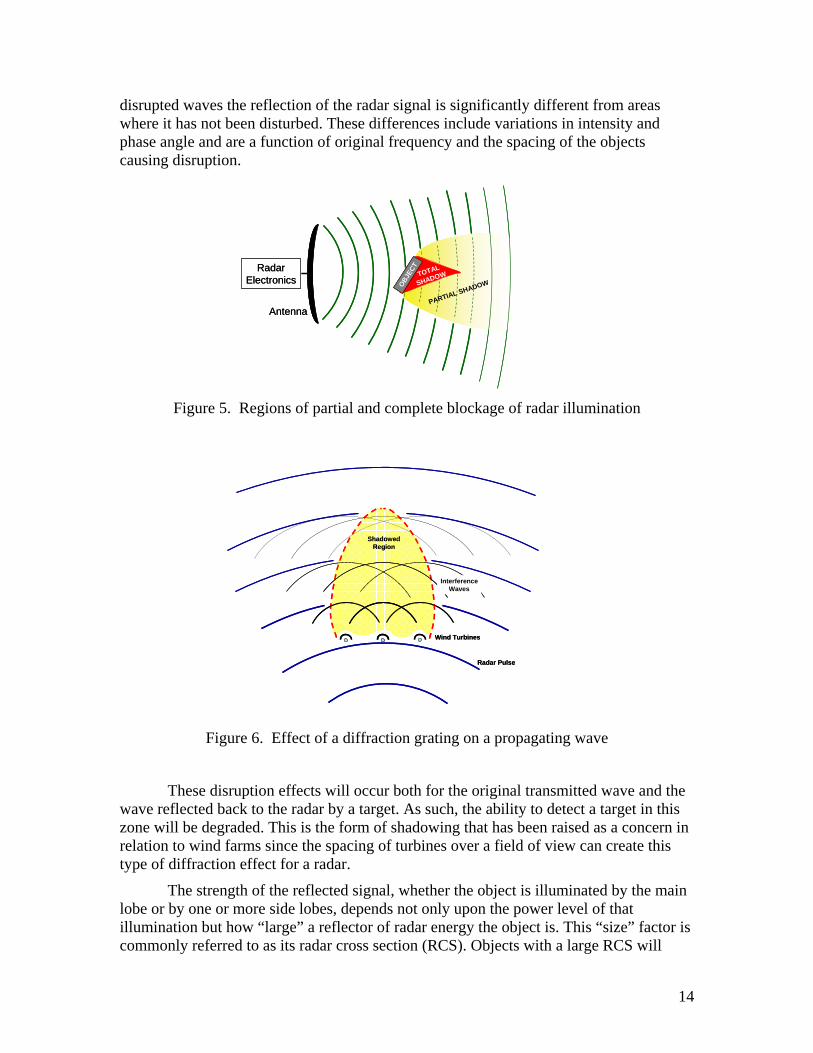
disrupted waves the reflection of the radar signal is significantly different from areas where it has not been disturbed. These differences include variations in intensity and phase angle and are a function of original frequency and the spacing of the objects causing disruption.
Antenna
RadarElectronics OBJ
ECT
TOTAL
SHADOW
PARTIAL SHADOW
Antenna
RadarElectronics OBJ
ECT
TOTAL
SHADOW
PARTIAL SHADOW
Figure 5. Regions of partial and complete blockage of radar illumination
Radar Pulse
Wind Turbines
InterferenceWaves
ShadowedRegion
Radar Pulse
Wind Turbines
InterferenceWaves
ShadowedRegion
Figure 6. Effect of a diffraction grating on a propagating wave
These disruption effects will occur both for the original transmitted wave and the wave reflected back to the radar by a target. As such, the ability to detect a target in this zone will be degraded. This is the form of shadowing that has been raised as a concern in relation to wind farms since the spacing of turbines over a field of view can create this type of diffraction effect for a radar.
The strength of the reflected signal, whether the object is illuminated by the main lobe or by one or more side lobes, depends not only upon the power level of that illumination but how “large” a reflector of radar energy the object is. This “size” factor is commonly referred to as its radar cross section (RCS). Objects with a large RCS will
14
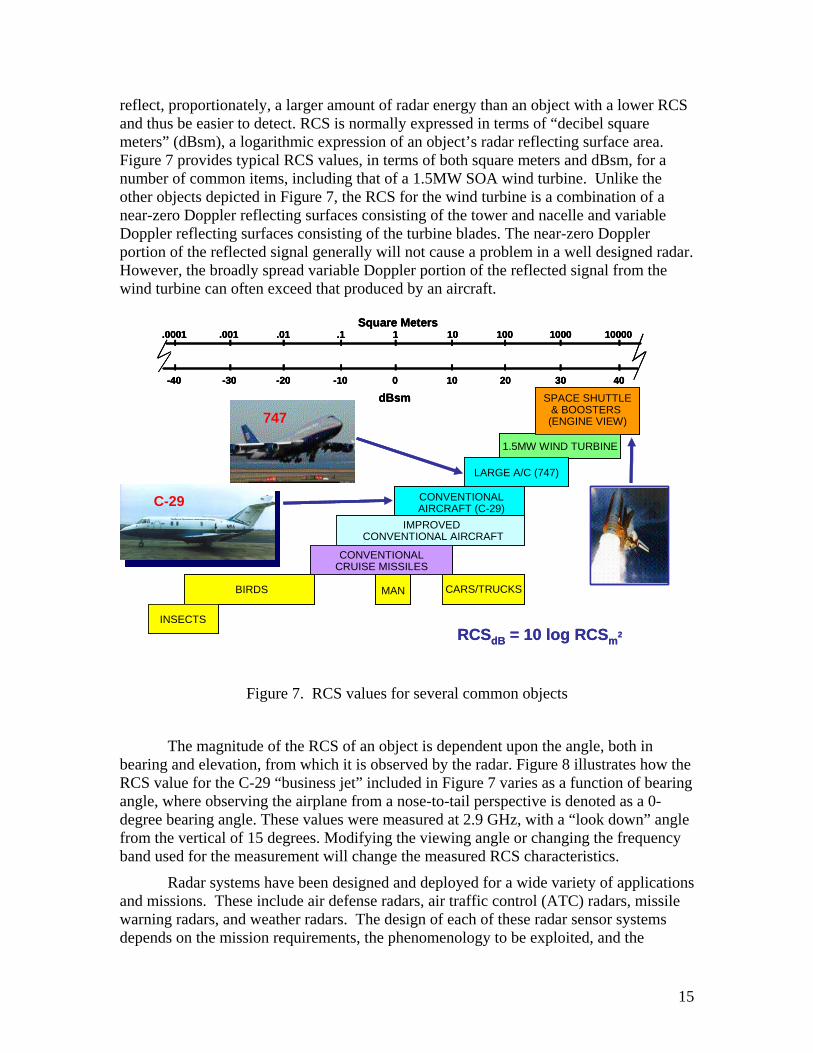
reflect, proportionately, a larger amount of radar energy than an object with a lower RCS and thus be easier to detect. RCS is normally expressed in terms of “decibel square meters” (dBsm), a logarithmic expression of an object’s radar reflecting surface area. Figure 7 provides typical RCS values, in terms of both square meters and dBsm, for a number of common items, including that of a 1.5MW SOA wind turbine. Unlike the other objects depicted in Figure 7, the RCS for the wind turbine is a combination of a near-zero Doppler reflecting surfaces consisting of the tower and nacelle and variable Doppler reflecting surfaces consisting of the turbine blades. The near-zero Doppler portion of the reflected signal generally will not cause a problem in a well designed radar. However, the broadly spread variable Doppler portion of the reflected signal from the wind turbine can often exceed that produced by an aircraft.
1.5MW WIND TURBINE
LARGE A/C (747)
CONVENTIONALAIRCRAFT (C-29)
IMPROVED CONVENTIONAL AIRCRAFT
CONVENTIONALCRUISE MISSILES
CARS/TRUCKSMANBIRDS
INSECTSRCSdB = 10 log RCSm2
dBsm
.0001 .001 .01 .1 1 10 100 1000 10000
400 10 3020-10-40 -30 -20
Square Meters
SPACE SHUTTLE& BOOSTERS (ENGINE VIEW)
Figure 7. RCS values for several common objects
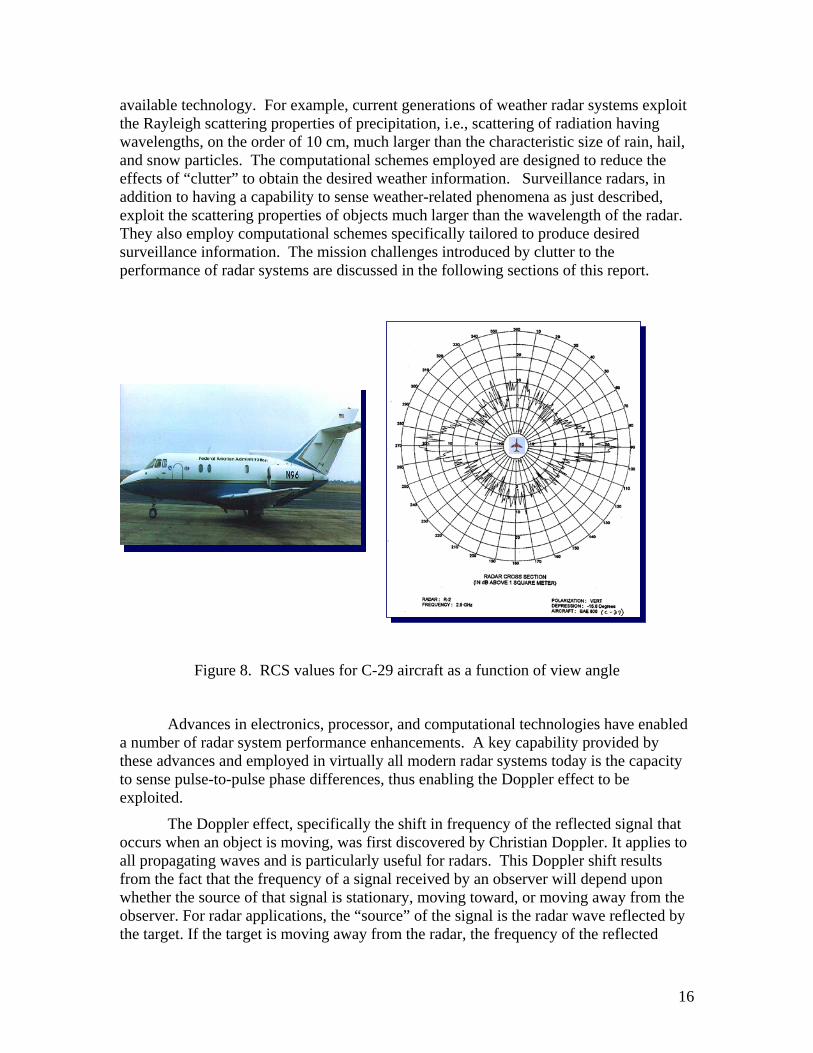
The magnitude of the RCS of an object is dependent upon the angle, both in bearing and elevation, from which it is observed by the radar. Figure 8 illustrates how the RCS value for the C-29 “business jet” included in Figure 7 varies as a function of bearing angle, where observing the airplane from a nose-to-tail perspective is denoted as a 0-degree bearing angle. These values were measured at 2.9 GHz, with a “look down” angle from the vertical of 15 degrees. Modifying the viewing angle or changing the frequency band used for the measurement will change the measured RCS characteristics.
Radar systems have been designed and deployed for a wide variety of applications and missions. These include air defense radars, air traffic control (ATC) radars, missile warning radars, and weather radars. The design of each of these radar sensor systems depends on the mission requirements, the phenomenology to be exploited, and the
C-29
747
1.5MW WIND TURBINE
LARGE A/C (747)
CONVENTIONALAIRCRAFT (C-29)CONVENTIONALAIRCRAFT (C-29)
IMPROVED CONVENTIONAL AIRCRAFT
CONVENTIONALCRUISE MISSILES
CARS/TRUCKSCARS/TRUCKSMANMANBIRDSBIRDS
INSECTSINSECTSRCSdB = 10 log RCSm2
dBsm
.0001 .001 .01 .1 1 10 100 1000 10000
400 10 3020-10-40 -30 -20
Square Meters
dBsm
.0001 .001 .01 .1 1 10 100 1000 10000
400 10 3020-10-40 -30 -20
Square Meters
SPACE SHUTTLE& BOOSTERS (ENGINE VIEW)
C-29
747747
15
available technology. For example, current generations of weather radar systems exploit the Rayleigh scattering properties of precipitation, i.e., scattering of radiation having wavelengths, on the order of 10 cm, much larger than the characteristic size of rain, hail, and snow particles. The computational schemes employed are designed to reduce the effects of “clutter” to obtain the desired weather information. Surveillance radars, in addition to having a capability to sense weather-related phenomena as just described, exploit the scattering properties of objects much larger than the wavelength of the radar. They also employ computational schemes specifically tailored to produce desired surveillance information. The mission challenges introduced by clutter to the performance of radar systems are discussed in the following sections of this report.
Figure 8. RCS values for C-29 aircraft as a function of view angle
Advances in electronics, processor, and computational technologies have enabled a number of radar system performance enhancements. A key capability provided by these advances and employed in virtually all modern radar systems today is the capacity to sense pulse-to-pulse phase differences, thus enabling the Doppler effect to be exploited.
The Doppler effect, specifically the shift in frequency of the reflected signal that occurs when an object is moving, was first discovered by Christian Doppler. It applies to all propagating waves and is particularly useful for radars. This Doppler shift results from the fact that the frequency of a signal received by an observer will depend upon whether the source of that signal is stationary, moving toward, or moving away from the observer. For radar applications, the “source” of the signal is the radar wave reflected by the target. If the target is moving away from the radar, the frequency of the reflected
16

signal will be lower than the originally transmitted frequency. Conversely, if the object is moving toward the radar the frequency will be higher. Additionally, the magnitude of the signal frequency shift is directly proportional to the radial velocity between the object and the radar. Only objects that are stationary or moving perfectly tangentially to the radar wave will not produce a Doppler shift.
The development of high-performance processing capability, along with innovative computational techniques tailored to extract desired information from the massive amounts of data available, has provided desired radar enhancements, particularly for defense capabilities.
2. TYPES OF RADAR SYSTEMS
Primary Surveillance Radar Air defense radars typically operate in what is termed a “Primary Surveillance”
mode. When operated in that manner they are referred to as a “Primary Surveillance Radar” (PSR). A PSR will send out rf waves (radar energy) focused by the antenna to provide an “illuminated” volumetric region of coverage. For a radar with a single transmitting element, the characteristics of this volume of coverage will be governed primarily by the shape of the antenna and whether or not the antenna can be rotated about one or two axes.
Figure 3 illustrated a radar coverage pattern where the antenna has been shaped to produce an illuminated area that is broad in altitude and radial distance (range) but rather narrow in width in terms of azimuth angle coverage. This type of radar is generally rotated about a vertical axis to extend the volume of coverage. The angle of rotation may be as little as a few degrees to observe a small sector or up to 360 degrees to cover the entire airspace surrounding the radar. Alternatively, the antenna may oscillate back and forth over a small angle to cover only a sector of airspace. Systems of this type able to rotate a full 360 degrees can often be observed in use around airports.
Radars of the type illustrated in Figure 3 are often referred to as 2-D radars since they are able to determine the position of an aircraft in terms of range and bearing angle (angular position of the aircraft with respect to north) but are unable to determine the height at which the airplane is above the surface of the earth. In contrast, most radars designed to inherently determine aircraft range, bearing, and altitude employ multiple beams. Radars able to determine all three aircraft parameters are typically referred to as being three-dimensional (3-D) radars. Figure 9 illustrates two different types of multibeam 3-D radars. The first employs several “stacked” transmit units to produce overlapping illumination lobes. Similar to the 2-D radar illustrated in Figure 2, the entire antenna would be rotated about a vertical axis to sweep the illuminated area over the volume of airspace to be covered.
The second type of 3-D radar is known as a phased-array radar. In a phased-array radar, hundreds to thousands of small transmitters and receivers make up the face of the antenna. Radar beam patterns are formed by precisely adjusting (shifting) the phase angle of the signal sent to each transmit element. Employing a similar technique, the receive beam can also be “electronically steered” over an area to cover a specific volume
17
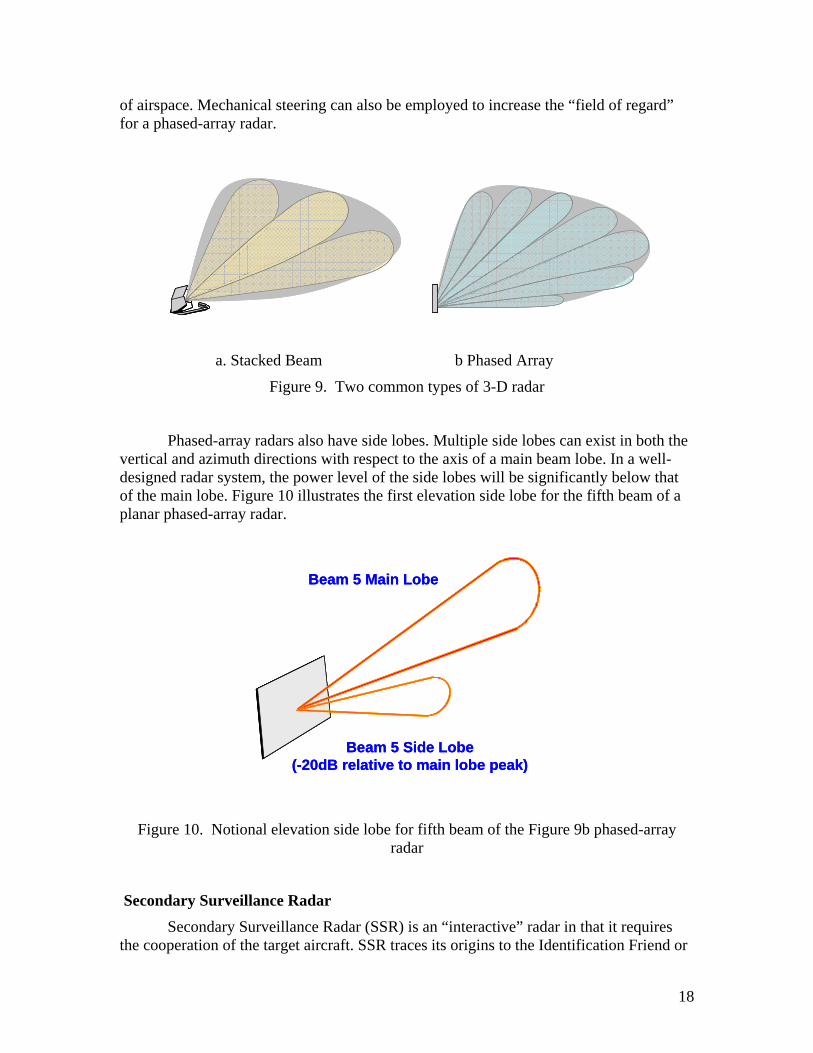
of airspace. Mechanical steering can also be employed to increase the “field of regard” for a phased-array radar.
a. Stacked Beam b Phased Array
Figure 9. Two common types of 3-D radar
Phased-array radars also have side lobes. Multiple side lobes can exist in both the vertical and azimuth directions with respect to the axis of a main beam lobe. In a well-designed radar system, the power level of the side lobes will be significantly below that of the main lobe. Figure 10 illustrates the first elevation side lobe for the fifth beam of a planar phased-array radar.
5Beam 5 Main Lobe
Beam 5 Side Lobe(-20dB relative to main lobe peak)
5Beam 5 Main Lobe
Beam 5 Side Lobe(-20dB relative to main lobe peak)
Figure 10. Notional elevation side lobe for fifth beam of the Figure 9b phased-array radar
Secondary Surveillance Radar Secondary Surveillance Radar (SSR) is an “interactive” radar in that it requires
the cooperation of the target aircraft. SSR traces its origins to the Identification Friend or
18

Foe (IFF) systems first developed during World War II to help air defense personnel to clearly distinguish between friendly and hostile airplanes. SSR systems are sometimes referred to as “beacon tracking” systems.
An SSR operates by sending out a coded signal (interrogation) that is received by a transponder system on an aircraft. The airplane’s transponder system translates the interrogation and responds by transmitting a coded signal back to the radar. This coded signal will contain identification information about the aircraft and other data such as its flight altitude. The frequencies of the interrogation and response are different, and both are different from the primary radar frequency so that the signals do not interfere with each other. The operating frequencies, signal strength, message format, and other key parameters influencing the performance of transponders are defined by published standards [3].
A major advantage of SSR is that the return from the aircraft transponder is much stronger than the typical primary (skin) radar return and is generally unaffected by clutter sources that can affect the primary radar return. This is because the SSR system does not depend upon the “reflection” of its interrogation message. Instead, it receives a different signal actually broadcast by the aircraft. Thus, wave propagation losses in each direction are minimized. This in turn allows a much smaller antenna to be employed for SSR. Figure 11 illustrates both the PSR and SSR antennas for the United Kingdom (UK) Watchman series of Air Traffic Control (ATC) radar.
A disadvantage of the SSR is that the aircraft must have a functioning transponder. Not all aircraft are required to have transponders. Additionally, even for transponder-equipped airplanes, if the transponder fails or is turned off, the SSR will not be able to track the airplane. Under these circumstances, only a primary surveillance radar will be able to detect or track the aircraft.
PSR Antenna
SSR Antenna
PSR Antenna
SSR Antenna
Figure 11. PSR and SSR antennas of the UK Watchman ATC radar
Missile Early Warning Radar
There are two fixed-site missile Early Warning Radars (EWR) within the continental United States. One is located at Cape Cod Air Force Station (AFS), MA. The
19
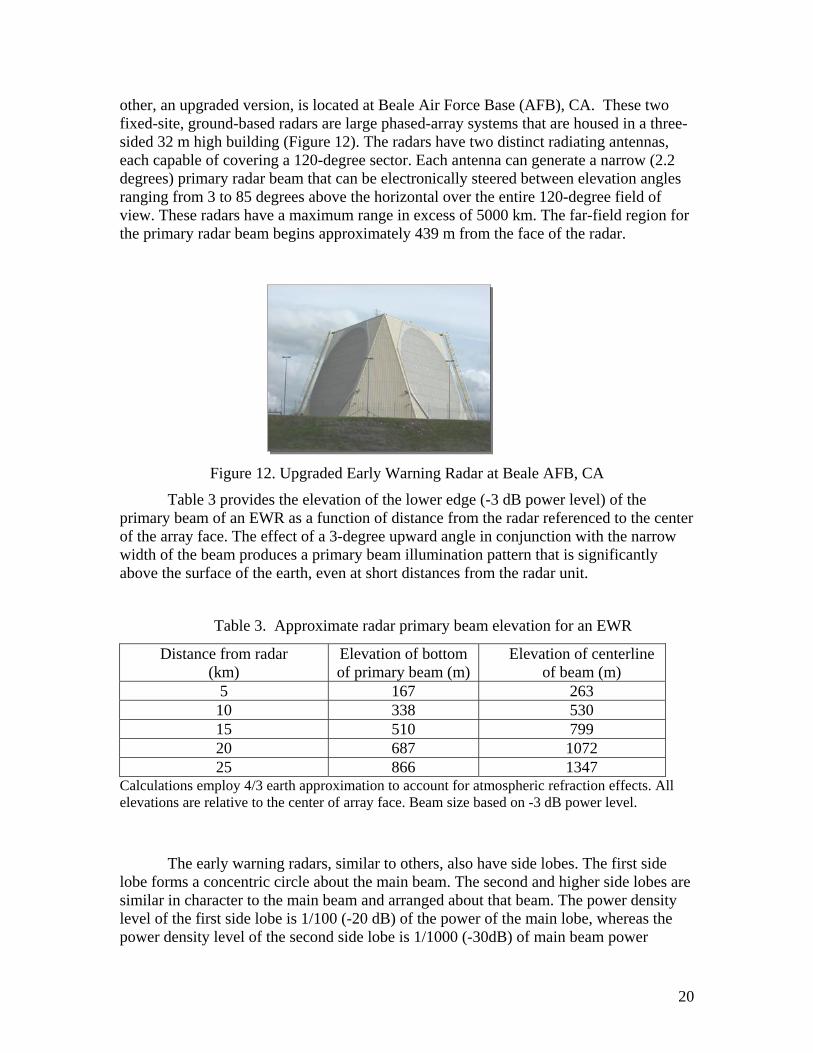
other, an upgraded version, is located at Beale Air Force Base (AFB), CA. These two fixed-site, ground-based radars are large phased-array systems that are housed in a three-sided 32 m high building (Figure 12). The radars have two distinct radiating antennas, each capable of covering a 120-degree sector. Each antenna can generate a narrow (2.2 degrees) primary radar beam that can be electronically steered between elevation angles ranging from 3 to 85 degrees above the horizontal over the entire 120-degree field of view. These radars have a maximum range in excess of 5000 km. The far-field region for the primary radar beam begins approximately 439 m from the face of the radar.
Figure 12. Upgraded Early Warning Radar at Beale AFB, CA
Table 3 provides the elevation of the lower edge (-3 dB power level) of the primary beam of an EWR as a function of distance from the radar referenced to the center of the array face. The effect of a 3-degree upward angle in conjunction with the narrow width of the beam produces a primary beam illumination pattern that is significantly above the surface of the earth, even at short distances from the radar unit.
Table 3. Approximate radar primary beam elevation for an EWR
Distance from radar (km)
Elevation of bottom of primary beam (m)
Elevation of centerline of beam (m)
5 167 263 10 338 530 15 510 799 20 687 1072 25 866 1347
Calculations employ 4/3 earth approximation to account for atmospheric refraction effects. All elevations are relative to the center of array face. Beam size based on -3 dB power level.
The early warning radars, similar to others, also have side lobes. The first side lobe forms a concentric circle about the main beam. The second and higher side lobes are similar in character to the main beam and arranged about that beam. The power density level of the first side lobe is 1/100 (-20 dB) of the power of the main lobe, whereas the power density level of the second side lobe is 1/1000 (-30dB) of main beam power
20
density. The first and second side lobes do intercept the ground in front of the array [4]. The distance away from the radar at which this intersection will occur varies based upon how far above the horizontal the main beam is pointed.
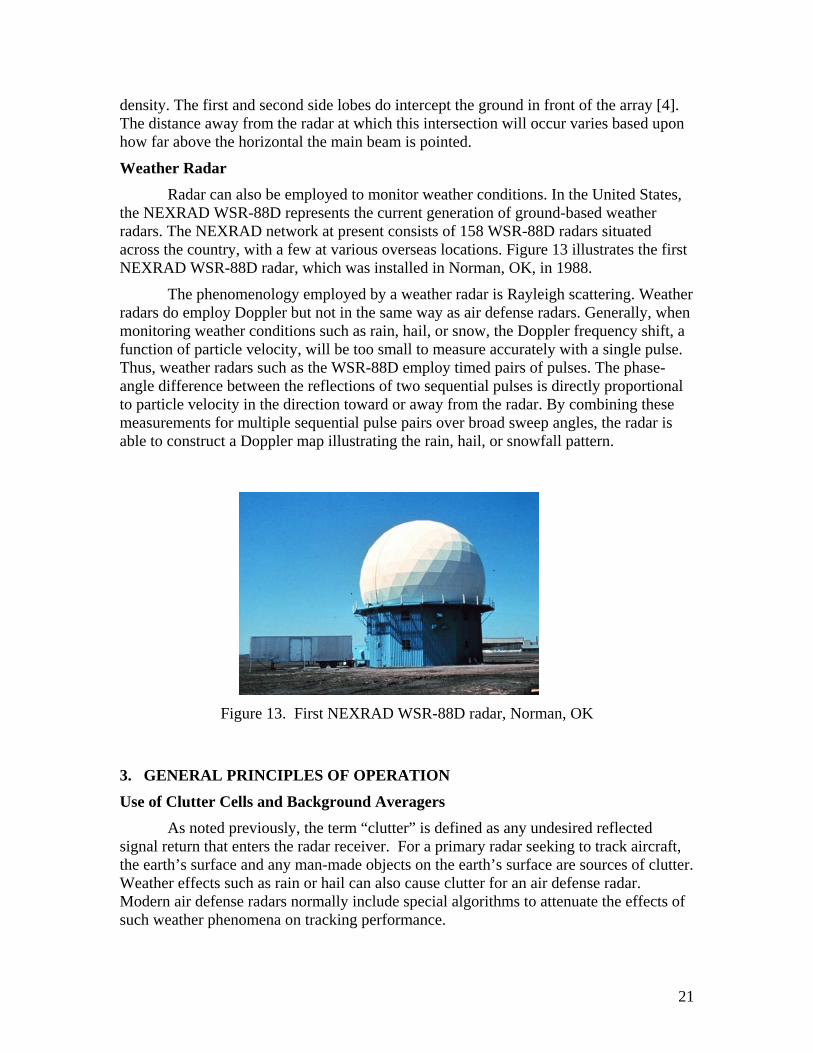
Weather Radar Radar can also be employed to monitor weather conditions. In the United States, the NEXRAD WSR-88D represents the current generation of ground-based weather radars. The NEXRAD network at present consists of 158 WSR-88D radars situated across the country, with a few at various overseas locations. Figure 13 illustrates the first NEXRAD WSR-88D radar, which was installed in Norman, OK, in 1988.
The phenomenology employed by a weather radar is Rayleigh scattering. Weather radars do employ Doppler but not in the same way as air defense radars. Generally, when monitoring weather conditions such as rain, hail, or snow, the Doppler frequency shift, a function of particle velocity, will be too small to measure accurately with a single pulse. Thus, weather radars such as the WSR-88D employ timed pairs of pulses. The phase-angle difference between the reflections of two sequential pulses is directly proportional to particle velocity in the direction toward or away from the radar. By combining these measurements for multiple sequential pulse pairs over broad sweep angles, the radar is able to construct a Doppler map illustrating the rain, hail, or snowfall pattern.
Figure 13. First NEXRAD WSR-88D radar, Norman, OK
3. GENERAL PRINCIPLES OF OPERATION
Use of Clutter Cells and Background Averagers As noted previously, the term “clutter” is defined as any undesired reflected
signal return that enters the radar receiver. For a primary radar seeking to track aircraft, the earth’s surface and any man-made objects on the earth’s surface are sources of clutter. Weather effects such as rain or hail can also cause clutter for an air defense radar. Modern air defense radars normally include special algorithms to attenuate the effects of such weather phenomena on tracking performance.
21
The level of clutter a radar may see is highly dependent on the viewing geometry of the radar in relation to the clutter sources. In general, the level of clutter will increase when the radar views a larger area of the earth’s surface or of objects on the earth’s surface. Clutter can occur at any angle within the radar field-of-view angle and at any range within the radar line of sight. Clutter returns can be spread in Doppler frequency due to the motion of the radar platform or motion of the source of clutter.
Traditionally, clutter for an air defense radar has been considered to be either stationary or possessing a low velocity. Cars and trucks moving on roads, trees, buildings, and even flags waving in a breeze can create this type of clutter. Stationary or nearly stationary objects result in a return signal with a fluctuating near-zero Doppler frequency shift. Since quasi-stationary objects will generally provide nearly identical radar returns from successive scans, methods have been developed to eliminate such returns from further processing and thereby reduce their influence on tracking capability.
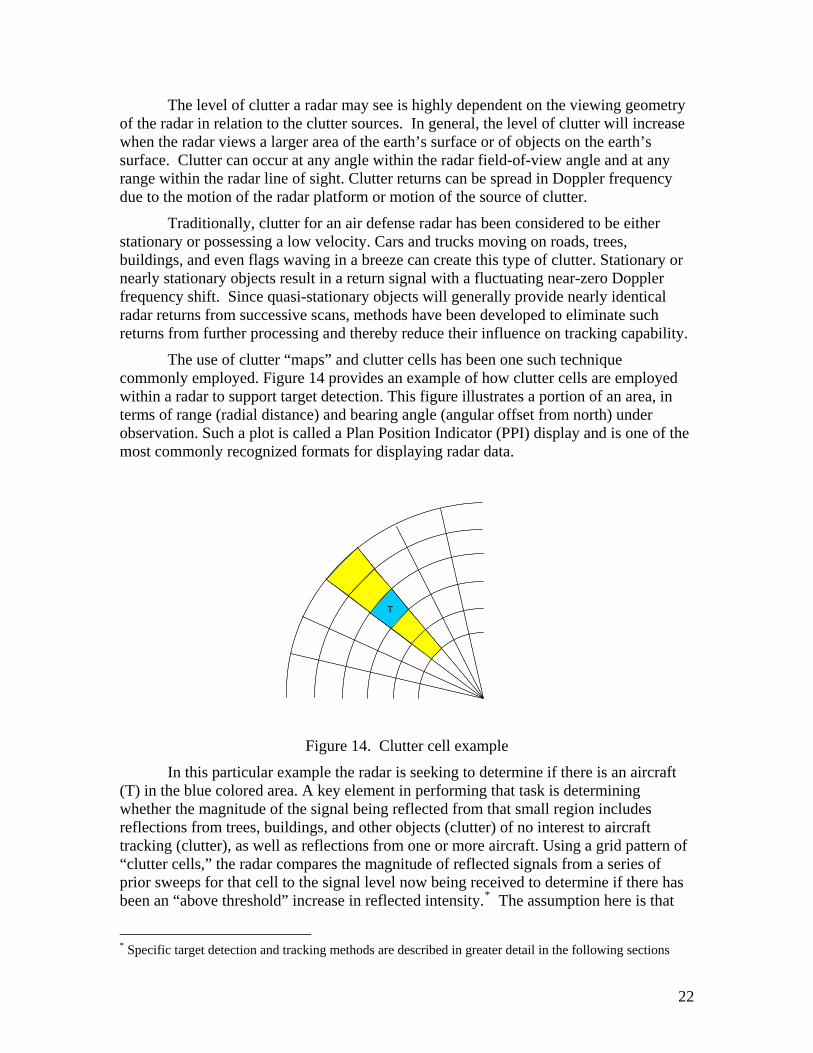
The use of clutter “maps” and clutter cells has been one such technique commonly employed. Figure 14 provides an example of how clutter cells are employed within a radar to support target detection. This figure illustrates a portion of an area, in terms of range (radial distance) and bearing angle (angular offset from north) under observation. Such a plot is called a Plan Position Indicator (PPI) display and is one of the most commonly recognized formats for displaying radar data.
TT
Figure 14. Clutter cell example
In this particular example the radar is seeking to determine if there is an aircraft (T) in the blue colored area. A key element in performing that task is determining whether the magnitude of the signal being reflected from that small region includes reflections from trees, buildings, and other objects (clutter) of no interest to aircraft tracking (clutter), as well as reflections from one or more aircraft. Using a grid pattern of “clutter cells,” the radar compares the magnitude of reflected signals from a series of prior sweeps for that cell to the signal level now being received to determine if there has been an “above threshold” increase in reflected intensity.* The assumption here is that
* Specific target detection and tracking methods are described in greater detail in the following sections
22
typical clutter signals, representing reflections from stationary or nearly stationary objects, will not change significantly over a short period time and thus will produce a relatively stable history of clutter. Consequently, any sudden increase in received signal level would imply that a new object has now appeared in this cell.
This “clutter history” for a given clutter cell is also usually averaged, using weighting factors, with current clutter levels being observed in other cells in front of and behind the cell of interest. In some cases, current clutter levels in cells adjacent to the cell of interest also may be included in this weighted-averaging process. The yellow colored cells in Figure 14 provides a simplified example of cells included in the process. This weighting of clutter levels in adjacent cells enables the radar to adapt its performance to short-term variations in atmospheric wave propagation parameters and other environmental factors such as rain. Averaging of clutter cells is typically employed only when the radar is operated in a surveillance mode. When in surveillance mode, the radar will be sweeping over large volumes of airspace to determine how many aircraft are in that region and where they are located.
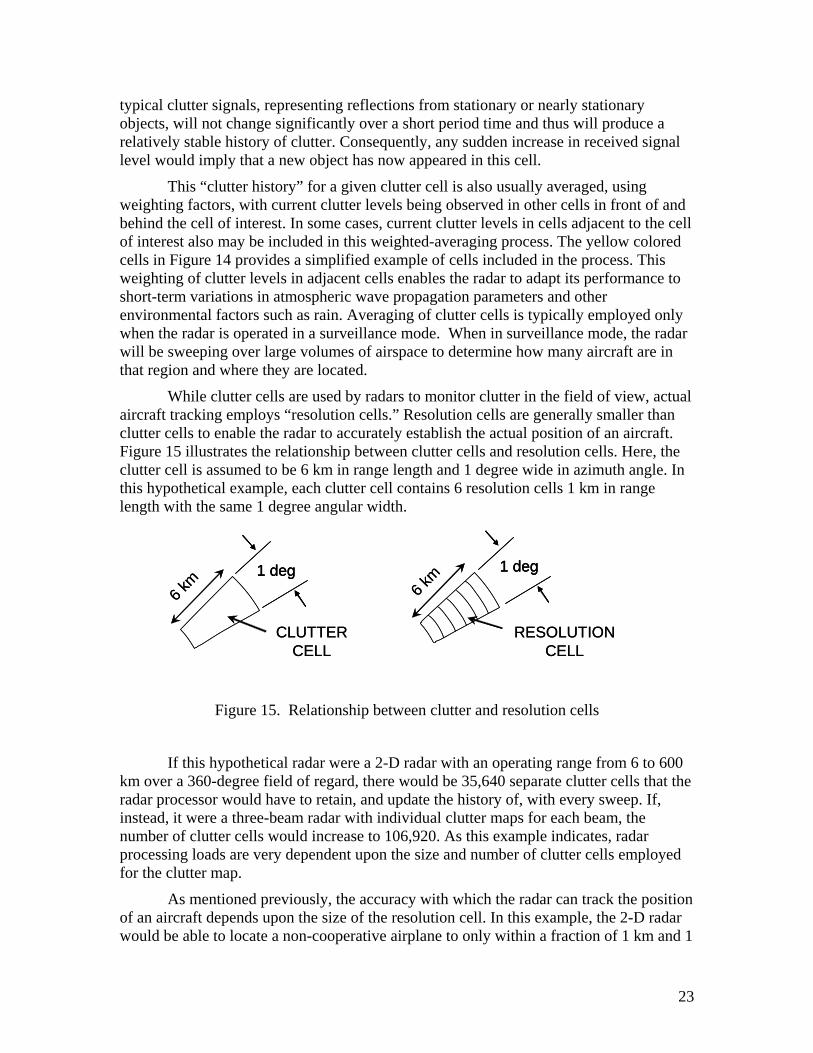
While clutter cells are used by radars to monitor clutter in the field of view, actual aircraft tracking employs “resolution cells.” Resolution cells are generally smaller than clutter cells to enable the radar to accurately establish the actual position of an aircraft. Figure 15 illustrates the relationship between clutter cells and resolution cells. Here, the clutter cell is assumed to be 6 km in range length and 1 degree wide in azimuth angle. In this hypothetical example, each clutter cell contains 6 resolution cells 1 km in range length with the same 1 degree angular width.
CLUTTER CELL
RESOLUTION CELL
6 km
1 deg
6 km
1 deg
CLUTTER CELL
RESOLUTION CELL
6 km
1 deg1 deg
6 km
1 deg1 deg
Figure 15. Relationship between clutter and resolution cells
If this hypothetical radar were a 2-D radar with an operating range from 6 to 600 km over a 360-degree field of regard, there would be 35,640 separate clutter cells that the radar processor would have to retain, and update the history of, with every sweep. If, instead, it were a three-beam radar with individual clutter maps for each beam, the number of clutter cells would increase to 106,920. As this example indicates, radar processing loads are very dependent upon the size and number of clutter cells employed for the clutter map.
As mentioned previously, the accuracy with which the radar can track the position of an aircraft depends upon the size of the resolution cell. In this example, the 2-D radar would be able to locate a non-cooperative airplane to only within a fraction of 1 km and 1
23

degree of its exact position depending upon signal-to-noise ratio. Additionally, it would be unable to tell if there is more than one aircraft in that small region since its tracking ability is based only on detecting an above-threshold level of signal return in a given resolution cell. Thus, a precision flight team flying in very close formation could appear to the radar as a single target without other aids such as transponder returns.
This report noted earlier that certain types of air defense radars have the capability to track individual aircraft. These are generally 3-D phase-array radars, but other arrangements are possible as well. When operated in this mode, the radar will focus an individual radar beam on the aircraft of interest much like a spotlight is used to illuminate a small area on a stage. Rather than employing “clutter maps” as described above, such target tracking systems often employ a “background averager” methodology to reduce the impacts of clutter around the target. With this technique, the radar electronics and processor systems will create a relatively small “sliding window” that is passed over the volume of airspace where the target is located. Unlike a clutter cell, these sliding windows are typically on the order of a few resolution cells in size. For the Figure 15 example, a two-cell size window could be “slid” over a few cells in front of and a few cells behind the resolution cell of interest to establish a “background” level of average clutter in that small zone. That is then used to set a clutter threshold level subsequently employed in the target tracking algorithm.
Note that a key difference between a clutter-map approach and the background-averager techniques is that a clutter map will be based on clutter levels observed over multiple sequential scans, whereas the “clutter levels” determined by a background averager are based only on observed clutter in the present scan and thus are a measure of “instantaneous” clutter surrounding the target.
Moving Target Indication/Moving Target Detection Principles.
Moving target indicator (MTI) and subsequently moving target detection (MTD) techniques have been developed to assist in the process of separating radar returns from moving objects from those produced by stationary items. A radar employing the simplest form of MTI compares two consecutive received pulses. The first pulse is stored in memory and is subsequently subtracted from the second received pulse. Consecutive return pulses from a nonmoving object will appear almost identical. Thus, subtracting one pulse from the other produces a near-zero net result. On the other hand, the Doppler shift from a moving target will have a relative change in the phase between consecutive pulses. In this case, subtracting the first pulse from the second does not yield a near-zero result. The remaining signal from the moving target is then processed to determine particular characteristics about the moving target, such as target speed and direction. This method is called filtering, where zero- (or low-) Doppler frequency signals are rejected but high-Doppler frequency signals are passed for further processing. There are alternative MTI filters that process more than two pulses, but in general they are limited to five pulses or fewer.
While MTI filters cancel the stationary land clutter, they do not provide good performance against moving clutter like rain. They also do not provide an indication of the moving target’s radial velocity. Such performance can be obtained using banks of Doppler filters. Typical designs use cascaded filtering systems, where MTI is used to
24
remove most of the very strong land clutter and banks of Doppler filters are used to provide improved detection in rain and improve estimates of the target’s radial velocity.
With the development of digital technology in the mid-1970s, several versions of this technique were developed and implemented in laboratories. By the late-1970s, improved systems were developed and procured to replace the older radars then being used for long-range air surveillance. A similar Doppler radar approach to address the short-range air surveillance needs was also developed. This particular radar used an MTI followed by a bank of specially weighted Doppler filters to provide near-optimum detection of moving targets. It also employed a zero-Doppler filter that passed the land clutter, but used a clutter map to float the detection threshold just above the land clutter return. This clutter-map technique prevented the land clutter from being detected, but provided “super clutter visibility,” the ability to detect stronger aircraft returns over areas of weak stationary land clutter. This enhanced radar-processing technique was subsequently called a “Moving Target Detector” (MTD) method. With the increased use of digital hardware, modern radar signal processing could now create near-optimum Doppler filters directly.
Doppler filters do have drawbacks and limitations. For instance, Doppler filters also have side lobes analogous to the range side lobes in pulse compression waveforms. Most current air defense radars are designed to use a low-Doppler side lobe weighting such that the Doppler side lobes of one aircraft are below the noise level and do not inhibit the detection of another aircraft in the same range cell. However, since the clutter models used in the design and procurement of these radars did not provide any strong moving-clutter sources, the Doppler side lobes of some of these radar filters will be inadequate in the presence of strong moving clutter.
The output signals of the Doppler filters will still contain noise and clutter, as well as targets. The detection and track initiation process is started when a detection threshold is exceeded by one of the output signals. Since a radar has limited resources for performing the detection process, it is desirable to limit the tracking processes initiated by noise and clutter (false alarms) while allowing all target signals to cross the detection threshold. Modern radars are designed with resources to handle a limited number of false alarms and make use of processing that tries to float the detection threshold just above the noise and clutter, but low enough to detect the presence of an aircraft target. This processing is called Constant False Alarm Rate (CFAR) processing. The specific objective of CFAR processing is to set the detection thresholds so that the radar can successfully track the most challenging targets of interest while keeping false target declarations (false alarms) due to noise and clutter at a constant but manageable rate.
The two figures of merit that are used to rate the detection ability of a radar are probability of detection (Pd) and probability of false alarm (Pfa). Probability of detection is the likelihood that a target is detected when a target is present. Probability of false alarm is the likelihood that a target is detected when no target is present. Note that a third option, the probability that a target is not detected when a target is present, is also possible. This is called probability of miss (Pm). Since Pm is directly related to Pd by the equation: , only probability of detection and the probability of false alarm are required to specify CFAR performance.
dm PP −= 1
25
In the CFAR processing scheme, a constant Pfa is established for the radar. Typical values for Pfa range from 10-4 (1 false alarm in 10,000 samples) to 10-6 (1 false alarm in 1,000,000 samples). A typical cell-averaging CFAR routine uses values from either the clutter map or the background averager to estimate the clutter and noise background. The threshold for target detection is then set at a level above the average background, based on the clutter and noise statistics, to ensure a very low probability that a background signal will cross the threshold and be declared a target. This processing does presume that all the received signal values have the same noise and clutter statistics as the cell under test and that the values used to determine the threshold level do not contain a target.
Target Declaration and Tracking
Once a detection threshold is crossed, the detection and track initiation process is started. This involves the estimation of the detected signal’s range, azimuth, height, Doppler velocity, and other features. This information is passed to a tracker as a target file and the tracker prepares a filter to correlate this return with future returns to confirm the presence of a valid target. Once a track has been established, the tracker can predict the expected location of the target during the next scheduled beam in the target’s direction and even instruct the radar to lower the detection threshold at the expected range, azimuth, and elevation to provide a higher probability of detection.
The trackers used in modern air defense radars have a large, but still limited, target-handling capability. Furthermore, multiple detections in the same range-azimuth-elevation volume create problems with track integrity. Therefore, it is important to limit the number and frequency of false alarms that are passed to the tracker. On the other hand, the most important criterion for air defense radar systems is the ability to provide an acceptable probability of detection, track initiation, and track maintenance for all targets within a certain range and within a specific velocity window. If a new clutter source is created that cannot be controlled by the radar’s filtering and CFAR processing, target detection, track initiation, and track maintenance will be severely impaired in the vicinity of that clutter source. Maintaining a low false-alarm rate at the expense of sacrificing detection and tracking performance is not an acceptable option for air defense radars.
4. CHARACTERISTICS OF WIND TURBINES APPLICABLE TO RADARS Modern SOA “utility-class” wind turbines consist of three major elements, as
shown in Figure 16. The actual power-generating unit is located in a nacelle mounted at the top of a vertical column. Most columns today are tapered hollow cylindrical structures fabricated from steel. The height of the tower is, at times, adapted to the specific site conditions where the turbine is to be located. Increasing tower height can position the turbine blades in more favorable wind conditions but conversely can increase construction costs. Table 1 provides representative tower heights for some common SOA wind turbines. The towers of the wind turbines tested at Fenner, NY, were approximately 113 m tall. From the perspective of a radar, the tower will appear as a stationary reflector with no Doppler.
26

Tower
Nacell
Turbine Blade
Figure 16. Picture of SOA wind turbines located in Wales, UK
The nacelle houses the power generator. For the wind turbines at Fenner, NY, the nacelle is approximately 10 m long, 4 m wide, and 3 m high. In SOA turbines, the nacelle can rotate a full 360 degrees to enable the turbine blades to face into the wind and provide maximum efficiency. Rotation rates for the nacelle tend to be relatively low. Thus the nacelle will appear to the radar as a virtually stationary object even when rotating. The nacelle housing may be fabricated from a metal or glass-reinforced plastic (GRP) to reduce its weight. Materials such as GRP can be partially transparent to rf waves. This means that some of the radar energy striking the nacelle surface can be transmitted to and reflected by the components within the nacelle. Since the majority of these internal components will also be nearly stationary (moving only when the nacelle rotates) these internal reflections should have only a second-order impact with little apparent Doppler.
The turbine blades are large, aerodynamically shaped structures that operate on the same principle as the wing of an airplane. In accordance with Bernoulli’s Law, the flow of air over the surface of the turbine blade creates a pressure differential due to differences in flow path length. This pressure differential creates a net force which, in the case of the turbine blades, causes them to rotate. In SOA turbines, the blade angle of attack is usually computer controlled to maximize power production while maintaining blade rotation rates within a relatively narrow range.
Typical SOA turbine blades are fabricated using GRP and can include surface-mounted metal inserts and internal wiring for lightning protection as well as internal damping systems to control blade vibration. Again, due to the partial transparency of GRP, the internal elements within the blade can serve as secondary reflection sources for radar waves.
Most SOA turbines, including those tested at Fenner, NY, are “upwind” designs. In this arrangement, the nacelle rotates so that the blades always remain on the windward side of the tower, thus providing the blades an undisturbed flow of air. As indicated in Table 1, blade rotation rates generally fall within a speed range of approximately 10 to 20
27

rpm. For the two GE systems listed in Table 1, tip velocities fall in the range of 40 to 80 m/s (78 to 158 knots). Faster rotation rates, and thus tip velocities, are generally avoided to limit centripetal acceleration forces and to minimize generation of acoustic noise.
The significant physical size of the turbine blades results in a substantial RCS target irrespective of whether the blades are viewed face on or edge on by a radar. The tip velocities for these blades fall within a speed range applicable to aircraft. Consequently, the turbine blades will appear to a radar as a “moving” target of significant size if they are within the radar line of sight. The following section provides specific technical data on the RCS and Doppler characteristics for a 1.5 MW wind turbine based on field testing conducted at Fenner, NY, in May 2006.
DOD-Sponsored Field Testing of an SOA Wind Turbine
The first comprehensive effort to measure the RCS and Doppler characteristics of an SOA wind turbine reported in the literature [5] was performed by QinetiQ, a research organization in the UK. Sponsored by the UK Department of Trade and Industry, QinetiQ performed analytic modeling, compact range (scale model) tests, and actual field measurements of SOA turbines under that effort. QinetiQ’s results documented that SOA wind turbines possess a significant RCS signature and create Doppler frequency shifts that will impact the ability of a radar to distinguish them from actual aircraft.
While this report provided important insights, the field test data were taken at only a single frequency, 3.0 GHz (S-band), with only the upper portion of the tower in the line of sight and at just one look-up angle. It also did not measure behavior when two or more turbines were in the line of sight to determine whether or not effects added in a linear manner. Instead, QinetiQ employed compact range testing and analytic models to evaluate some of these other factors. However, it is well recognized that compact range testing is very difficult to perform accurately for such large structures due to the difficulty in replicating fine details at the extremely large scaling factors that are required. Thus, their ability to predict with confidence behavior for other commonly employed radar bands is limited. Finally, all the QinetiQ data were only available in the form of charts and tables. This format is useful in describing behavior but inadequate as a source of data to directly insert into radar performance models.
Consequently, the Department, as part of this study, undertook an effort to create a digital database of actual radar signatures for an SOA wind turbine for all of the common radar bands. This testing was performed using the Air Force Research Laboratory’s (AFRL) Mobile Diagnostic Laboratory (MDL) (Figure 17). The MDL is an SOA radar signature measurement and characterization van. It has been in use since 1997 to measure the radar reflectivity of aircraft (B-2, F/A-22) and, recently, to characterize the Space Shuttle Orbiter Discovery for susceptibility to radar interference prior to returning to space. It is currently certified to perform radar measurements to the most stringent national standards, ANSI-Z-540-1994-1.
28
.
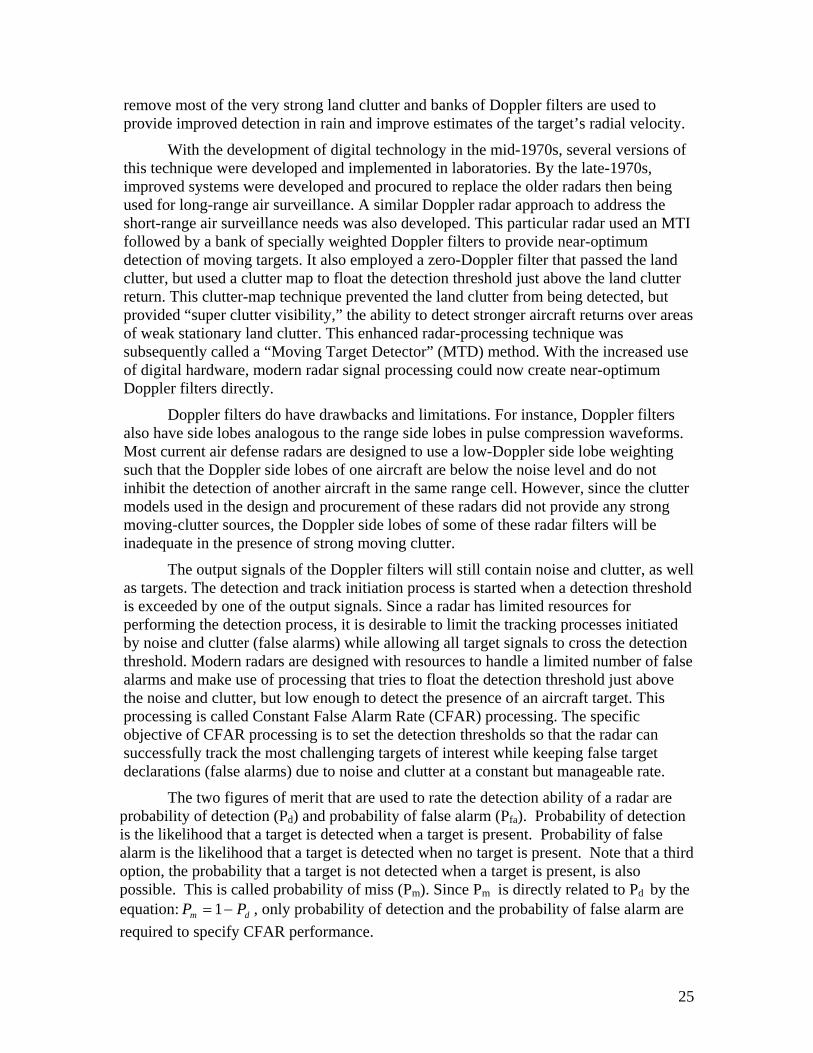
Figure 17. AFRL Mobile Diagnostics Laboratory measuring wind turbines at Fenner, NY
The wind farm at Fenner, NY, was selected for the testing site because it contained 20 modern GE 1.5 MW wind turbines, was located in close proximity to the AFRL Rome Research Site, included both locally flat and rolling terrain combinations typical of many proposed U.S. wind farms, and had co-located GE personnel. The cooperation of GE in providing access to turbine operating data during the test period was vital to the success of the measurement campaign and is gratefully acknowledged. Figure 18 provides a map of the overall layout of the wind farm at Fenner, NY, with red circles employed to indicate the turbines measured during the testing.
RCS and Doppler characteristics were obtained for a total of 10 different wind turbines tested during the 10-day test window from 29 April 2006 through 9 May 2006. A total of 479 individual calibrated measurements of turbines at L-, S-, C-, and X-bands* for both horizontal and vertical polarization were obtained. Figure 19 provides a graphical representation of the data obtained as a function of the approximate radar aspect angle to the axis of the turbine and radar frequency band (L-band: blue, S-band: yellow, C-band: green, X-band: orange).
The test procedures, samples of test data, and calibration methodology are documented in a report [6]. The full data set, in a digital format directly employable in radar analysis routines, has been made available to U.S. radar contractors and government-sponsored researchers.
* The test frequencies used for these bands were 1.3 GHz, 3.3 GHz, 6.8 GHz and 9.7 GHz, respectively
29

Figure 18. Layout of the wind farm at Fenner, NY, and locations of the turbines tested
Vertical Polarization Horizontal Polarization
Figure 19. Graphical representation of data obtained during field tests at Fenner, NY
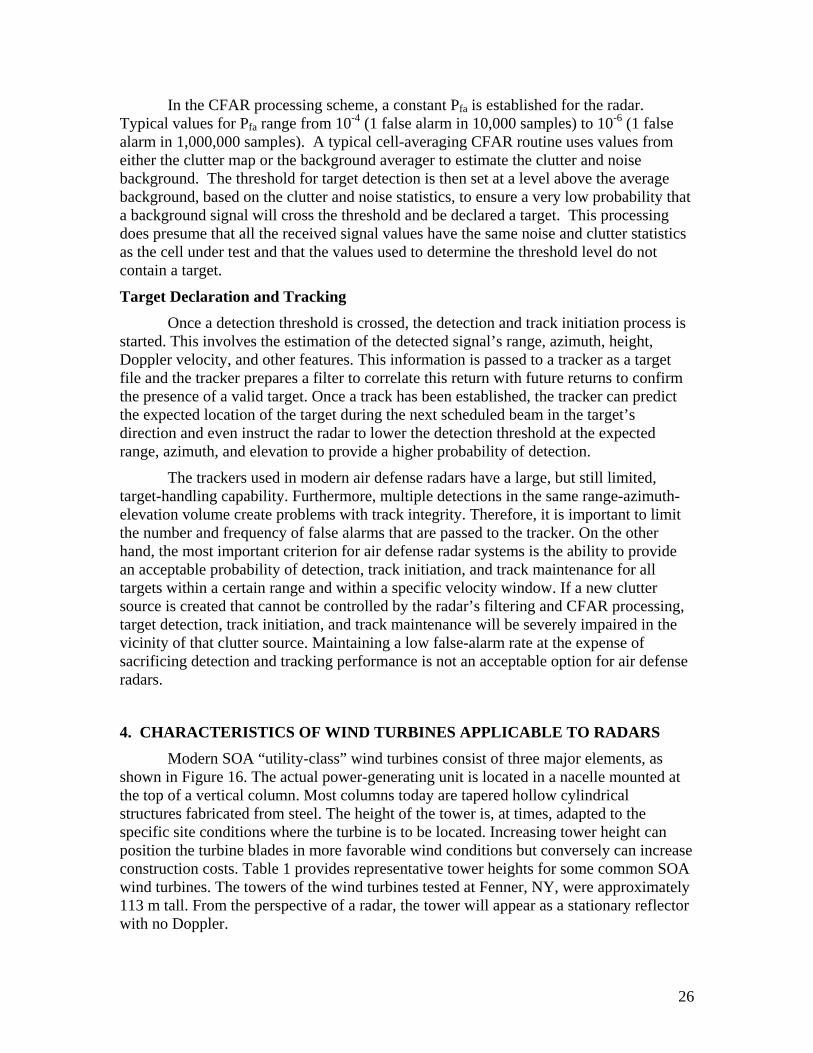
Figure 20 provides one example of the actual measured Doppler characteristics for one of these turbines. These particular results were obtained at L-band, observing the turbine blades almost edge on. Each positive peak represents the Doppler behavior as each blade rotates into the line of sight while moving toward the top of its arc of rotation. The negative peak that follows is produced by the change in Doppler shift as the blade passes below the center of rotation and begins to move away from the radar.
Although difficult to see in this illustration, there is also a second, fainter return at twice the apparent maximum Doppler shift. This signifies a “multi-bounce” reflection of the radar wave. Multi-bounce of this nature occurs when the radar wave is reflected off two different surfaces with relative velocity to one another before it returns to the radar receiver. In the case of wind turbines, multi-bounce can occur, for example, when a radar
30
wave is reflected by the turbine blade, then the turbine tower, and then again by the blade before returning to the radar.
Horizontal Polarization Vertical Polarization
Figure 20. Example of Doppler characteristics of a wind turbine at L-band
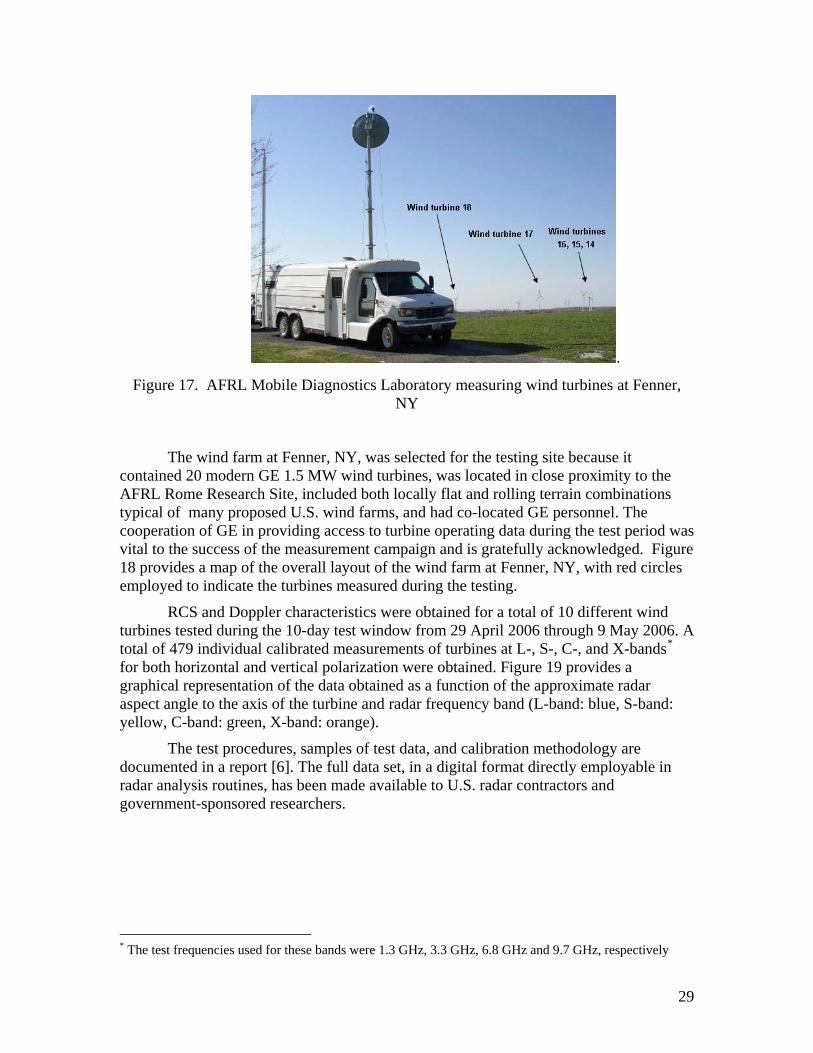
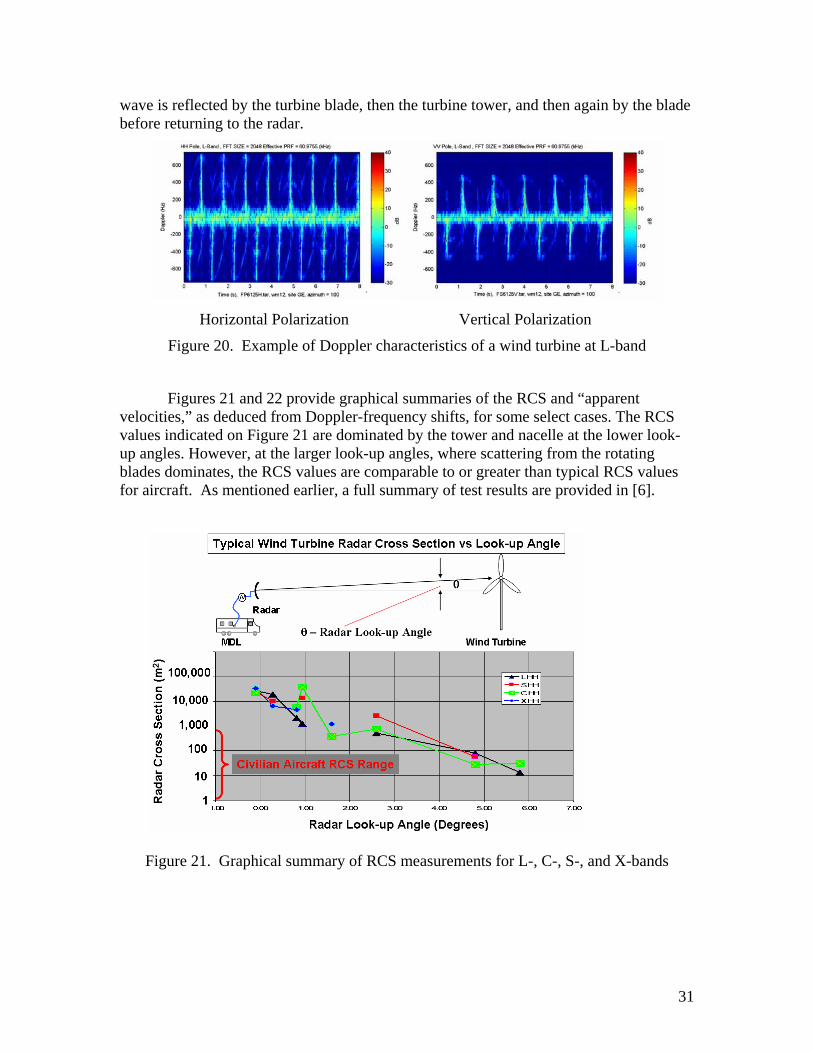
Figures 21 and 22 provide graphical summaries of the RCS and “apparent velocities,” as deduced from Doppler-frequency shifts, for some select cases. The RCS values indicated on Figure 21 are dominated by the tower and nacelle at the lower look-up angles. However, at the larger look-up angles, where scattering from the rotating blades dominates, the RCS values are comparable to or greater than typical RCS values for aircraft. As mentioned earlier, a full summary of test results are provided in [6].
Figure 21. Graphical summary of RCS measurements for L-, C-, S-, and X-bands
31

Figure 22. Doppler frequencies and derived tip velocities from measurements at L-, C-,
S-, and X-band frequencies
5. OBSERVATIONS OF IMPACTS ON RADAR SYSTEMS
During the past several years there has been an increased effort to explore and document impacts that wind turbines have on operational air defense and ATC radar systems. This has been a direct result of the increase in the number of wind farms already built, the number of wind farms now being proposed for construction, and the number of wind turbines included in these wind farms, as well as the dramatic increase in their physical size. The first documented structured flight trials and analyses of these potential impacts were conducted by the UK Ministry of Defence (MoD) in 1994 [7]. This set of trials conducted ground measurements and flight trials using an ATC radar located near a small wind turbine farm. Starting in 2004 and continuing through this year, the UK MoD has sponsored an extensive series of subsequent trials employing both mobile air defense and ATC radar systems placed within a radar line of sight of several wind farms. Behavior observed during the UK tests correlates well with observations made at an operational U.S. long-range air defense radar site where wind farms have been constructed within radar line of sight.
United Kingdom Flight Trials and Analyses The 1994 trials undertaken by the UK MoD were conducted to understand the
characteristics and impacts of the radar interference observed immediately following construction of a wind farm consisting of fourteen 300 kW wind turbines located about 7 km away and in the radar line of sight of a Watchman ATC radar. The significant interference that was being observed in the radar primary surveillance mode of operation had led to a degradation in detection performance.
This was a relatively small-scale trial that involved flying a Sea King Helicopter over and around the wind turbines. This trial was structured to focus on the shadowing
32
effect that the turbines could have on targets just above or behind the wind farm, to estimate the RCS of the turbines and to investigate the Doppler shift they would produce.
The primary conclusion of that study [7] was Wind turbines cause interference to primary surveillance radars. The responses appear as valid targets on the radar display. Responses cannot be inhibited using normal MTI based techniques since they are generated by a moving structure.
As a result of the trial, the MoD decided it needed to be consulted on all proposals for wind turbines closer than 60% of the maximum instrumented range of military radars. This 60% range was translated to be within 66 km (35.6 nmi) of an ATC radar and within 74 km (40 nmi) of an air defense radar.*
In 2004, the policy of carefully scrutinizing wind turbine proposals so far away from operational radars was increasingly being questioned by wind farm developers, especially in light of much less restrictive constraints imposed by other European countries. Consequently, the UK MoD commissioned additional studies to ascertain the impact of wind farms on air defense and ATC radar systems in more detail. The studies were conducted in 2004 and 2005 by the Air Command and Control Operational Evaluation Unit (Air C2 OEU)** of the Royal Air Force (RAF) Air Warfare Centre (AWC). Details of the flight trials, results, and recommendations are presented in the three RAF reports completed in 2005 [8,9,10].
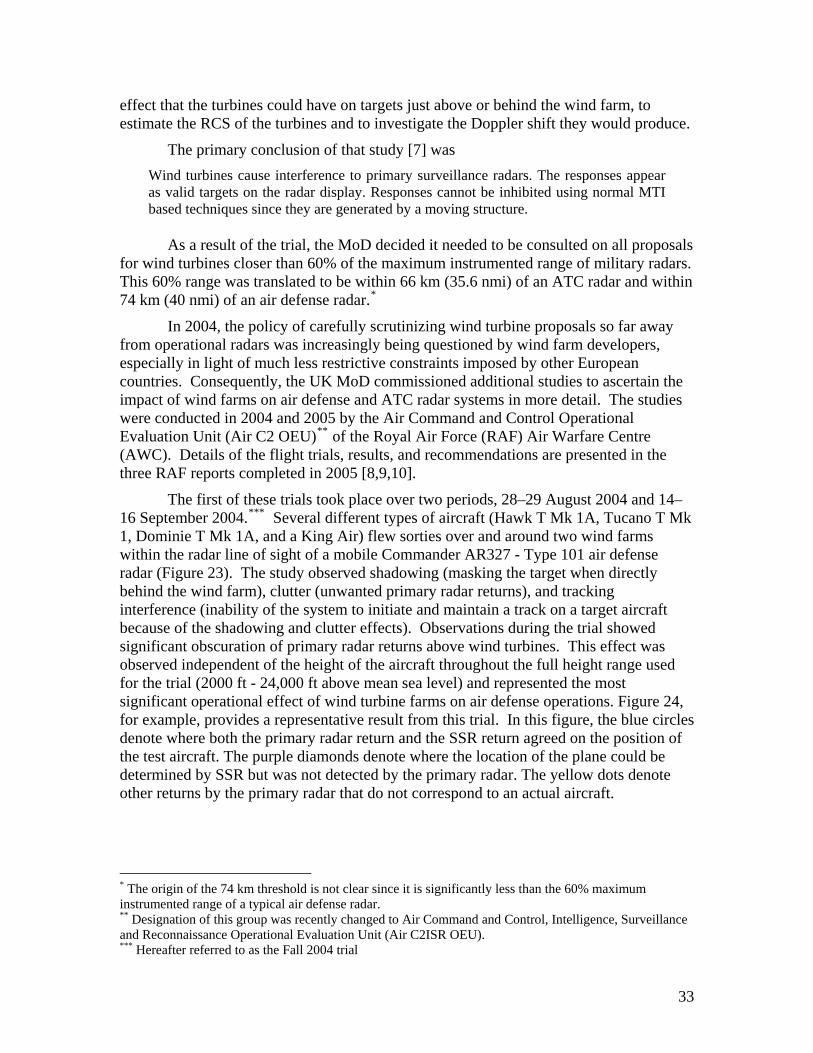
The first of these trials took place over two periods, 28–29 August 2004 and 14–16 September 2004.*** Several different types of aircraft (Hawk T Mk 1A, Tucano T Mk 1, Dominie T Mk 1A, and a King Air) flew sorties over and around two wind farms within the radar line of sight of a mobile Commander AR327 - Type 101 air defense radar (Figure 23). The study observed shadowing (masking the target when directly behind the wind farm), clutter (unwanted primary radar returns), and tracking interference (inability of the system to initiate and maintain a track on a target aircraft because of the shadowing and clutter effects). Observations during the trial showed significant obscuration of primary radar returns above wind turbines. This effect was observed independent of the height of the aircraft throughout the full height range used for the trial (2000 ft - 24,000 ft above mean sea level) and represented the most significant operational effect of wind turbine farms on air defense operations. Figure 24, for example, provides a representative result from this trial. In this figure, the blue circles denote where both the primary radar return and the SSR return agreed on the position of the test aircraft. The purple diamonds denote where the location of the plane could be determined by SSR but was not detected by the primary radar. The yellow dots denote other returns by the primary radar that do not correspond to an actual aircraft.
* The origin of the 74 km threshold is not clear since it is significantly less than the 60% maximum instrumented range of a typical air defense radar. ** Designation of this group was recently changed to Air Command and Control, Intelligence, Surveillance and Reconnaissance Operational Evaluation Unit (Air C2ISR OEU). *** Hereafter referred to as the Fall 2004 trial
33
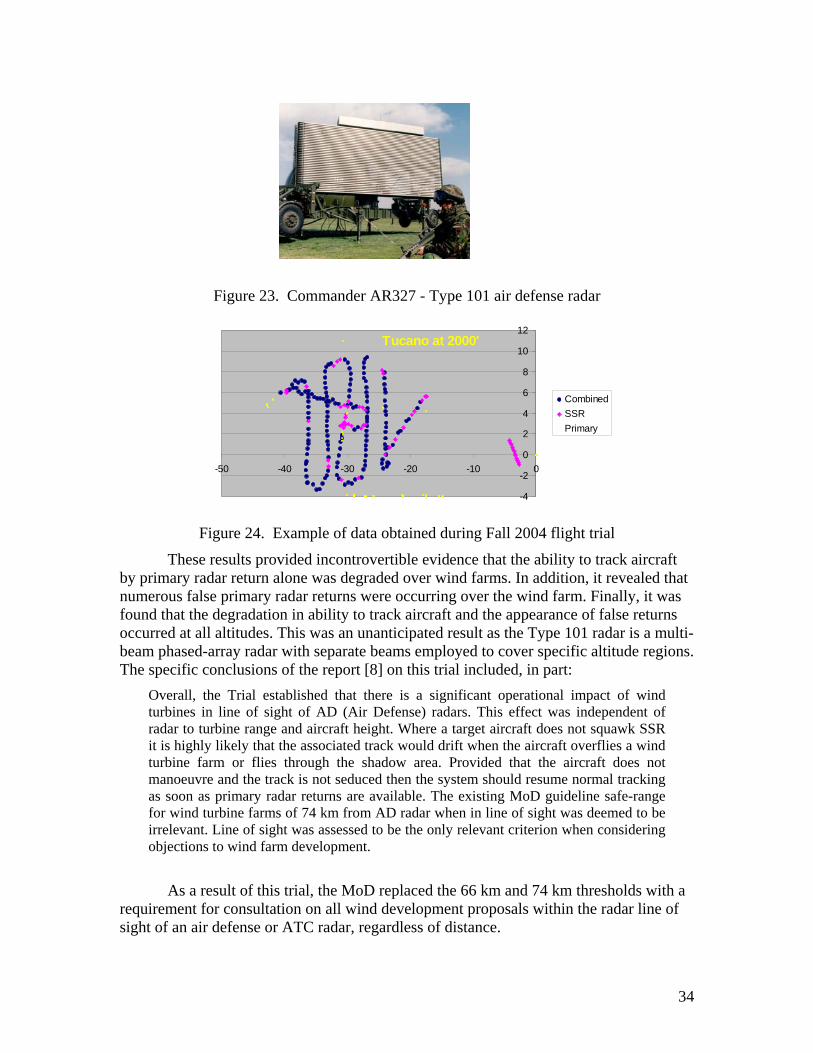
Figure 23. Commander AR327 - Type 101 air defense radar
Tucano at 2000'
-4
-2
0
2
4
6
8
10
12
-50 -40 -30 -20 -10 0
CombinedSSRPrimary
Figure 24. Example of data obtained during Fall 2004 flight trial
These results provided incontrovertible evidence that the ability to track aircraft by primary radar return alone was degraded over wind farms. In addition, it revealed that numerous false primary radar returns were occurring over the wind farm. Finally, it was found that the degradation in ability to track aircraft and the appearance of false returns occurred at all altitudes. This was an unanticipated result as the Type 101 radar is a multi-beam phased-array radar with separate beams employed to cover specific altitude regions. The specific conclusions of the report [8] on this trial included, in part:
Overall, the Trial established that there is a significant operational impact of wind turbines in line of sight of AD (Air Defense) radars. This effect was independent of radar to turbine range and aircraft height. Where a target aircraft does not squawk SSR it is highly likely that the associated track would drift when the aircraft overflies a wind turbine farm or flies through the shadow area. Provided that the aircraft does not manoeuvre and the track is not seduced then the system should resume normal tracking as soon as primary radar returns are available. The existing MoD guideline safe-range for wind turbine farms of 74 km from AD radar when in line of sight was deemed to be irrelevant. Line of sight was assessed to be the only relevant criterion when considering objections to wind farm development.
As a result of this trial, the MoD replaced the 66 km and 74 km thresholds with a requirement for consultation on all wind development proposals within the radar line of sight of an air defense or ATC radar, regardless of distance.
34
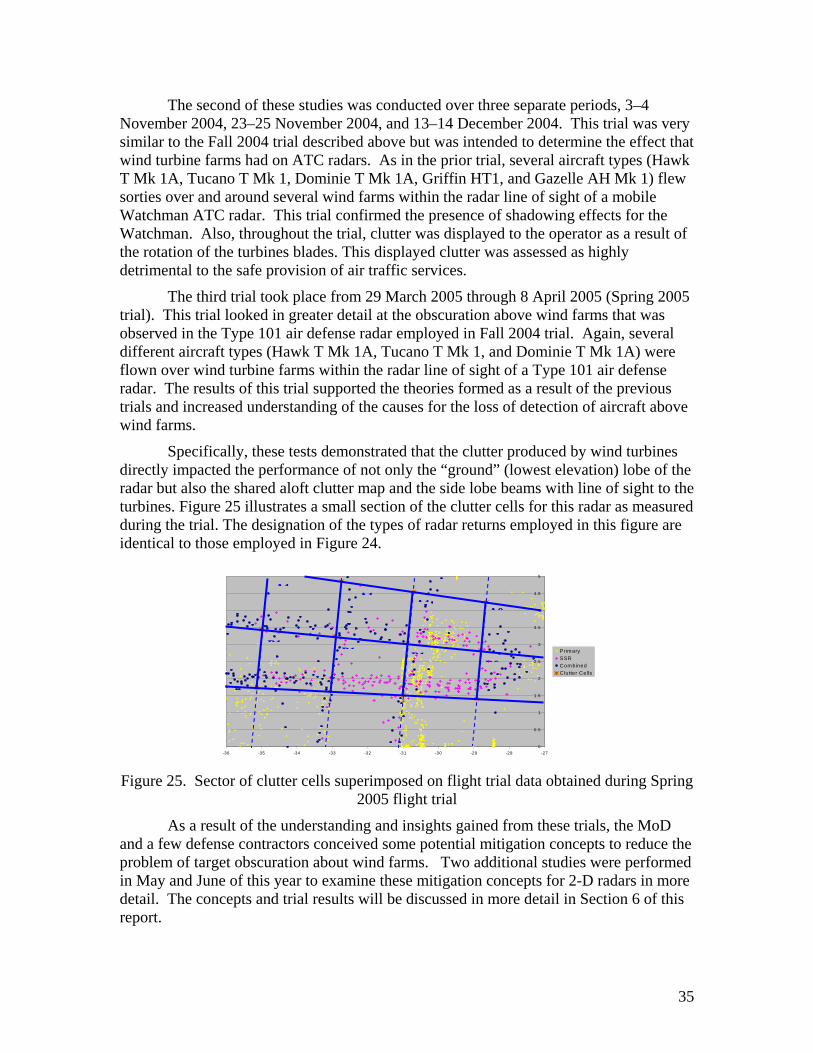
The second of these studies was conducted over three separate periods, 3–4 November 2004, 23–25 November 2004, and 13–14 December 2004. This trial was very similar to the Fall 2004 trial described above but was intended to determine the effect that wind turbine farms had on ATC radars. As in the prior trial, several aircraft types (Hawk T Mk 1A, Tucano T Mk 1, Dominie T Mk 1A, Griffin HT1, and Gazelle AH Mk 1) flew sorties over and around several wind farms within the radar line of sight of a mobile Watchman ATC radar. This trial confirmed the presence of shadowing effects for the Watchman. Also, throughout the trial, clutter was displayed to the operator as a result of the rotation of the turbines blades. This displayed clutter was assessed as highly detrimental to the safe provision of air traffic services.
The third trial took place from 29 March 2005 through 8 April 2005 (Spring 2005 trial). This trial looked in greater detail at the obscuration above wind farms that was observed in the Type 101 air defense radar employed in Fall 2004 trial. Again, several different aircraft types (Hawk T Mk 1A, Tucano T Mk 1, and Dominie T Mk 1A) were flown over wind turbine farms within the radar line of sight of a Type 101 air defense radar. The results of this trial supported the theories formed as a result of the previous trials and increased understanding of the causes for the loss of detection of aircraft above wind farms.
Specifically, these tests demonstrated that the clutter produced by wind turbines directly impacted the performance of not only the “ground” (lowest elevation) lobe of the radar but also the shared aloft clutter map and the side lobe beams with line of sight to the turbines. Figure 25 illustrates a small section of the clutter cells for this radar as measured during the trial. The designation of the types of radar returns employed in this figure are identical to those employed in Figure 24.
0
0.5
1
1.5
2
2.5
3
3.5
4
4.5
5
-36 -35 -34 -33 -32 -31 -30 -29 -28 -27
A1A1 A1
A0
B1 B1 PrimaryB1 SSRB0 Com bined
Clutter Cells
Figure 25. Sector of clutter cells superimposed on flight trial data obtained during Spring
2005 flight trial
As a result of the understanding and insights gained from these trials, the MoD and a few defense contractors conceived some potential mitigation concepts to reduce the problem of target obscuration about wind farms. Two additional studies were performed in May and June of this year to examine these mitigation concepts for 2-D radars in more detail. The concepts and trial results will be discussed in more detail in Section 6 of this report.
35

The results presented in the UK reports clearly demonstrate degradation in the target detection and tracking performance of the primary radar for air defense and ATC radar systems. These flight trials constitute a reasonable set of operational tests to enable identification of the probable failure mechanisms when combined (as these were) with post-trial analyses. However, since by their very nature, they can only include a limited number of flight sorties, aircraft types, variety of deceptive maneuvers employed, and other relevant factors, they do not provide a sufficiently robust statistical database to enable quantitative computations to be performed in terms of actual reduction in probability of detection, increase in probability of loss of track, and increase in probability of false alarms. Only analytic tools able to incorporate wind turbine behavior as part of their input can accomplish that task. Such tools are currently unavailable.
Observations of Wind Turbine Impacts on U.S. Operational Radars The testing described in the preceding section involved only UK radar systems.
Those tests demonstrated that wind farms would disrupt the ability to track aircraft using only primary radar returns through two distinct phenomena. The first was that the presence of a number of turbines within a limited zone would produce shadowing due to diffraction effects. This is expected based on well-established physics principles. The second disruption was due to increasing clutter levels, which adversely impacted the clutter cell threshold levels and background average performance in ways that inhibited the ability of the radar to distinguish aircraft from that clutter. From a behavioral perspective, the UK systems operate on the same basic principles as U.S. air defense and ATC radars. Thus, it would be reasonable to expect that similar performance degradation would occur for U.S. systems.
There have been two limited opportunities where DOD has been able to obtain some data from testing of operational U.S. long-range air defense radars to investigate this question. These were at King Mountain, TX, in 2002 and Tyler, MN, in 2004. Results from both of these are described in the following sections.
Testing Performed at King Mountain, TX King Mountain, TX, provided a fledgling opportunity for a U.S. radar optimization team to explore performance of an air defense long-range radar before and after construction of a wind farm within the radar line of sight. Upon learning that a very large wind farm was proposed for construction within the radar line of sight of the Air Route Surveillance Radar-4 (ARSR-4) radar located at King Mountain, TX, a joint team from the USAF 84th Radar Evaluation Squadron (84th RADES) and the Federal Aviation Administration (FAA) conducted a very limited number of flight tests before and after partial construction of the wind farm. The ARSR-4 is a modern long-range radar with sophisticated clutter-control automation.
The wind farm proposed for construction was to consist of 214 1.3 MW turbines arranged in several nearly linear groups at distances running from 7 to 20 nmi from the radar over an azimuth sector spanning from 80 to 180 degrees with respect to north. Figure 26 provides a topographical view of the relative locations of those turbines with respect to the King Mountain radar. Approximately 80 of the 214 proposed turbines had been installed at the time that the second set of flight tests was performed.
36
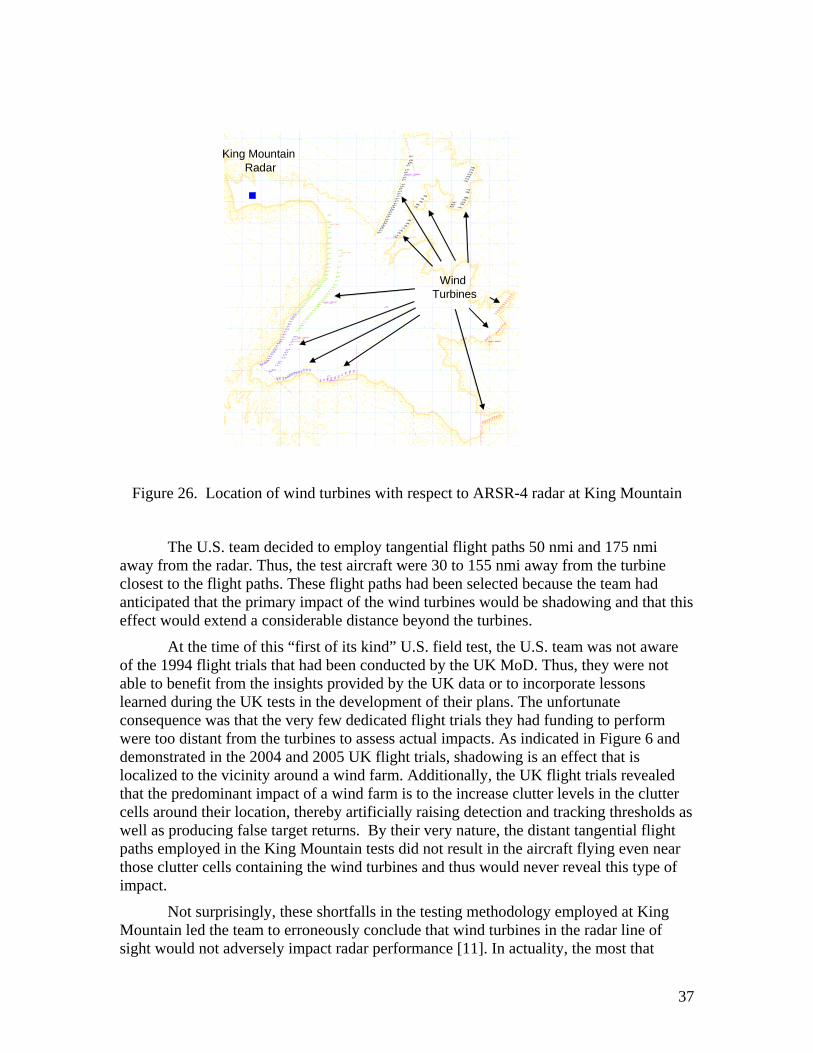
King MountainRadar
Wind Turbines
King MountainRadar
Wind Turbines
Figure 26. Location of wind turbines with respect to ARSR-4 radar at King Mountain
The U.S. team decided to employ tangential flight paths 50 nmi and 175 nmi away from the radar. Thus, the test aircraft were 30 to 155 nmi away from the turbine closest to the flight paths. These flight paths had been selected because the team had anticipated that the primary impact of the wind turbines would be shadowing and that this effect would extend a considerable distance beyond the turbines.
At the time of this “first of its kind” U.S. field test, the U.S. team was not aware of the 1994 flight trials that had been conducted by the UK MoD. Thus, they were not able to benefit from the insights provided by the UK data or to incorporate lessons learned during the UK tests in the development of their plans. The unfortunate consequence was that the very few dedicated flight trials they had funding to perform were too distant from the turbines to assess actual impacts. As indicated in Figure 6 and demonstrated in the 2004 and 2005 UK flight trials, shadowing is an effect that is localized to the vicinity around a wind farm. Additionally, the UK flight trials revealed that the predominant impact of a wind farm is to the increase clutter levels in the clutter cells around their location, thereby artificially raising detection and tracking thresholds as well as producing false target returns. By their very nature, the distant tangential flight paths employed in the King Mountain tests did not result in the aircraft flying even near those clutter cells containing the wind turbines and thus would never reveal this type of impact.
Not surprisingly, these shortfalls in the testing methodology employed at King Mountain led the team to erroneously conclude that wind turbines in the radar line of sight would not adversely impact radar performance [11]. In actuality, the most that
37
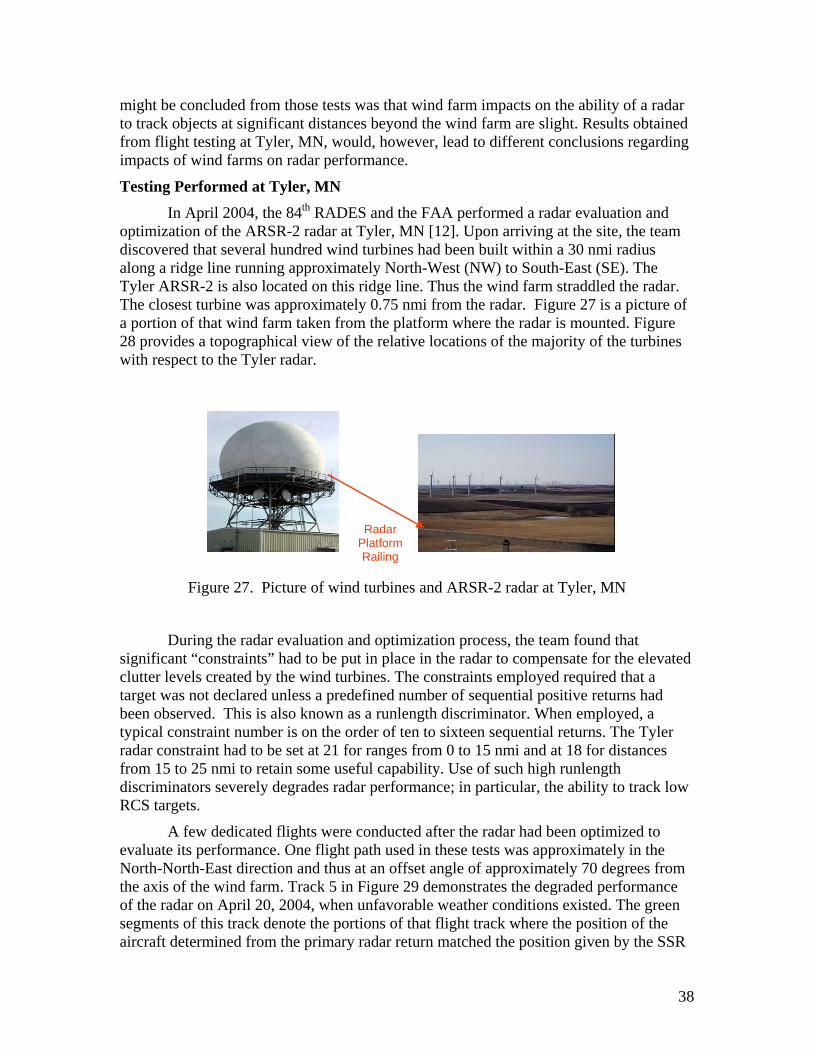
might be concluded from those tests was that wind farm impacts on the ability of a rato track objects at significant distances beyond the wind farm are slight. Results obtained from flight testing at Tyler, MN, would, however, lead to different conclusions regarding impacts of wind farms on radar performance.
Testing Performed at Tyler, MN
dar
ES and the FAA performed a radar evaluation and optimiz
r.
re 27. Picture of wind turbines and ARSR-2 radar at Tyler, MN
During the radar evaluation and optim zation process, the team found that signific evated
er
track low
dedicated flights were conducted after the radar had been optimized to evaluat
m
R
In April 2004, the 84th RADation of the ARSR-2 radar at Tyler, MN [12]. Upon arriving at the site, the team
discovered that several hundred wind turbines had been built within a 30 nmi radius along a ridge line running approximately North-West (NW) to South-East (SE). The Tyler ARSR-2 is also located on this ridge line. Thus the wind farm straddled the radaThe closest turbine was approximately 0.75 nmi from the radar. Figure 27 is a picture ofa portion of that wind farm taken from the platform where the radar is mounted. Figure 28 provides a topographical view of the relative locations of the majority of the turbineswith respect to the Tyler radar.
Radar Platform Railing
Figu
iant “constraints” had to be put in place in the radar to compensate for the el
clutter levels created by the wind turbines. The constraints employed required that a target was not declared unless a predefined number of sequential positive returns hadbeen observed. This is also known as a runlength discriminator. When employed, a typical constraint number is on the order of ten to sixteen sequential returns. The Tylradar constraint had to be set at 21 for ranges from 0 to 15 nmi and at 18 for distances from 15 to 25 nmi to retain some useful capability. Use of such high runlength discriminators severely degrades radar performance; in particular, the ability to RCS targets.
A few e its performance. One flight path used in these tests was approximately in the
North-North-East direction and thus at an offset angle of approximately 70 degrees frothe axis of the wind farm. Track 5 in Figure 29 demonstrates the degraded performance of the radar on April 20, 2004, when unfavorable weather conditions existed. The green segments of this track denote the portions of that flight track where the position of the aircraft determined from the primary radar return matched the position given by the SS
38
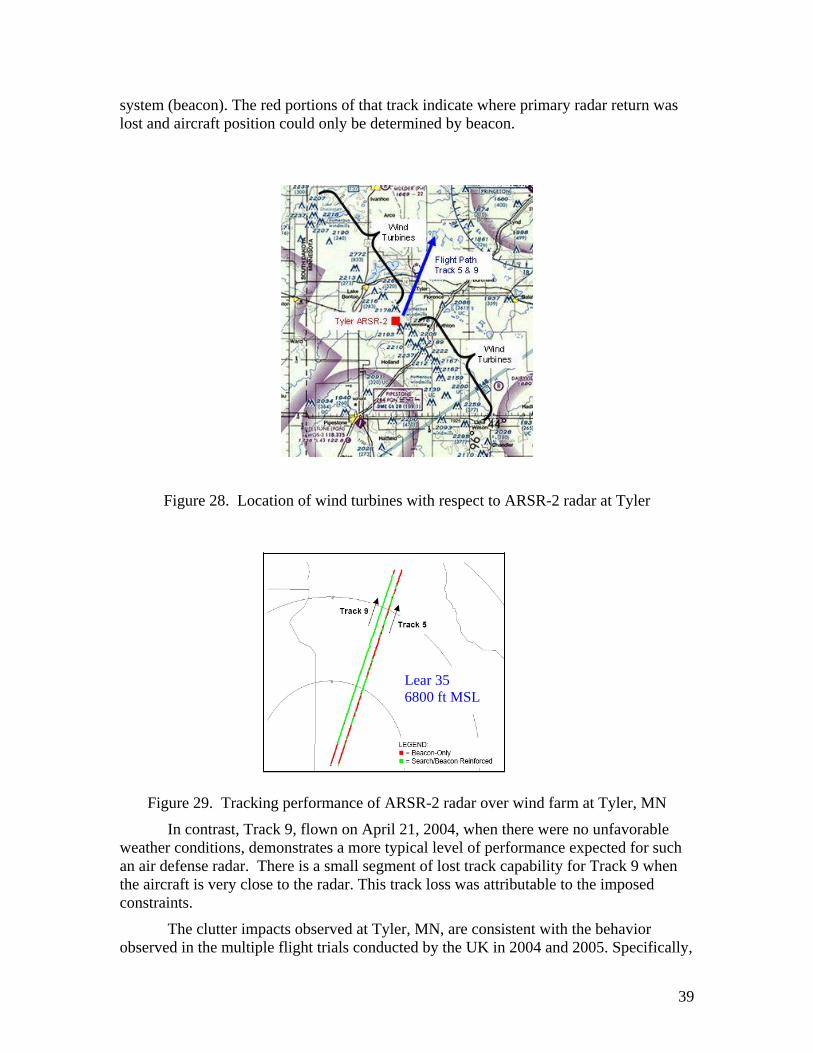
system (beacon). The red portions of that track indicate where primary radar return was lost and aircraft position could only be determined by beacon.
Figure 28. Location of wind turbines with respect to ARSR-2 radar at Tyler
at Tyler, MN
weathe
tter impacts observed at Tyler, MN, are consistent with the behavior observed in the multiple flight trials conducted by the UK in 2004 and 2005. Specifically,
Figure 29. Tracking performance of ARSR-2 radar over wind fa
Lear 35 SL6800 ft M
rm
In contrast, Track 9, flown on April 21, 2004, when there were no unfavorable r conditions, demonstrates a more typical level of performance expected for such
an air defense radar. There is a small segment of lost track capability for Track 9 when the aircraft is very close to the radar. This track loss was attributable to the imposed constraints.
The clu
39
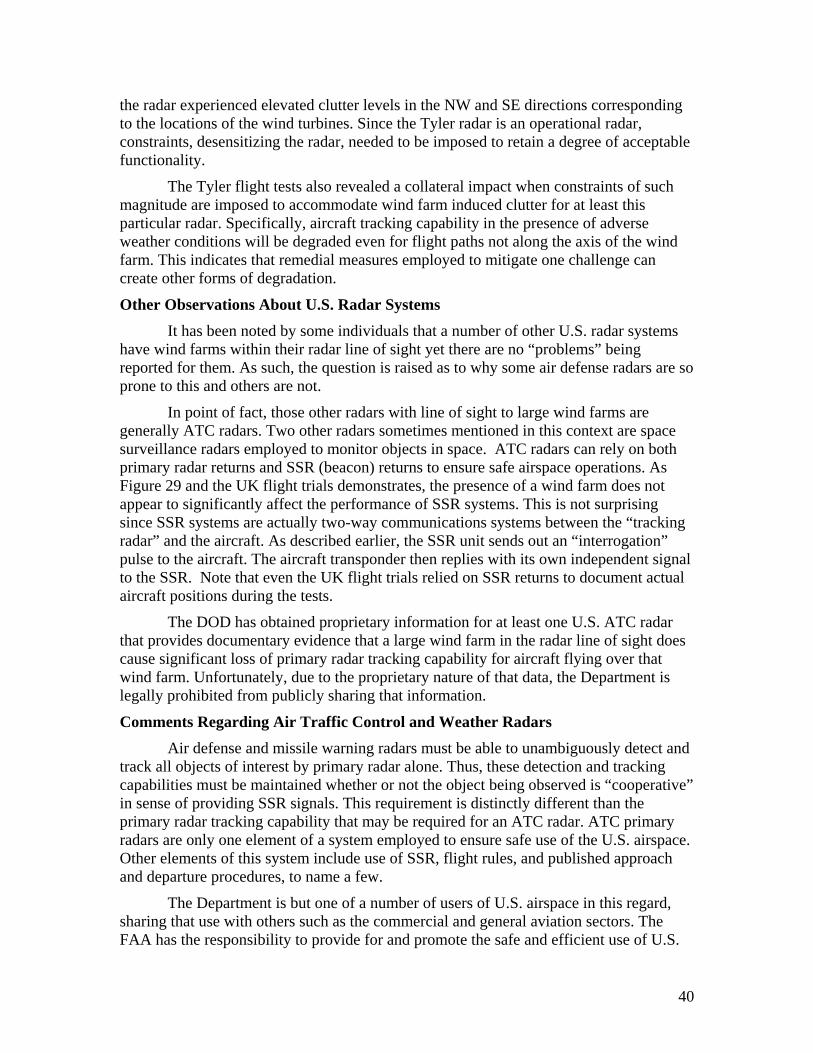
the rad ing
posed to accommodate wind farm induced clutter for at least this particu
ind
number of other U.S. radar systems here are no “problems” being
o
radars sometimes mentioned in this context are space oth
g
l
e that a large wind farm in the radar line of sight does cause s
biguously detect and ion and tracking
space.
mercial and general aviation sectors. The FAA has the responsibility to provide for and promote the safe and efficient use of U.S.
ar experienced elevated clutter levels in the NW and SE directions correspondto the locations of the wind turbines. Since the Tyler radar is an operational radar, constraints, desensitizing the radar, needed to be imposed to retain a degree of acceptablefunctionality.
The Tyler flight tests also revealed a collateral impact when constraints of such magnitude are im
lar radar. Specifically, aircraft tracking capability in the presence of adverse weather conditions will be degraded even for flight paths not along the axis of the wfarm. This indicates that remedial measures employed to mitigate one challenge cancreate other forms of degradation.
Other Observations About U.S. Radar Systems
It has been noted by some individuals that a have wind farms within their radar line of sight yet treported for them. As such, the question is raised as to why some air defense radars are sprone to this and others are not.
In point of fact, those other radars with line of sight to large wind farms are generally ATC radars. Two othersurveillance radars employed to monitor objects in space. ATC radars can rely on bprimary radar returns and SSR (beacon) returns to ensure safe airspace operations. As Figure 29 and the UK flight trials demonstrates, the presence of a wind farm does not appear to significantly affect the performance of SSR systems. This is not surprising since SSR systems are actually two-way communications systems between the “trackinradar” and the aircraft. As described earlier, the SSR unit sends out an “interrogation”pulse to the aircraft. The aircraft transponder then replies with its own independent signal to the SSR. Note that even the UK flight trials relied on SSR returns to document actuaaircraft positions during the tests.
The DOD has obtained proprietary information for at least one U.S. ATC radar that provides documentary evidenc
ignificant loss of primary radar tracking capability for aircraft flying over that wind farm. Unfortunately, due to the proprietary nature of that data, the Department is legally prohibited from publicly sharing that information.
Comments Regarding Air Traffic Control and Weather Radars
Air defense and missile warning radars must be able to unamtrack all objects of interest by primary radar alone. Thus, these detectcapabilities must be maintained whether or not the object being observed is “cooperative” in sense of providing SSR signals. This requirement is distinctly different than the primary radar tracking capability that may be required for an ATC radar. ATC primary radars are only one element of a system employed to ensure safe use of the U.S. airOther elements of this system include use of SSR, flight rules, and published approach and departure procedures, to name a few.
The Department is but one of a number of users of U.S. airspace in this regard, sharing that use with others such as the com
40

airspace. Since ATC radars are an integral contributor to that overarching mission, the Department does not believe it would be appropriate to independently evaluate how thpresence of wind farms in the radar line of sight of those ATC radar could influence the air traffic management system. Instead, the Department is prepared, as one of multiple stakeholders, to work with the FAA in such evaluations and, as appropriate, develop mitigation approaches that would be mutually applicable to air defense and ATC radars.
In a similar manner, the National Weather Service of the National Oceanic and Atmospheric Administration (NOAA/NWS) has the primary responsibility to provide weather forecasts for the United States. These weather forecasts do, in part, depend upon
e
A/NWS r
f potential mitigation approaches
rse impacts wind turbines can have air defense and missile warning radars. For the purposes of this section, the word
mitiga
been wing
rs
t be affected by objects that do not appear l circumstances exist. With respect to objects e earth, such as wind turbines, radar line of sight
e
sest
proper operation of the WSR-88D (NEXRAD) system of weather radars. The Atmospheric Radar Research Center at Oklahoma University (http://arrl.ou.edu) is currently conducting studies to examine potential impacts of wind turbines on ground-based weather radars for NOAA/NWS. As such, the Department defers to NOAregarding assessment of potential impacts of wind turbines on ground-based weatheradars. The Department, as a consumer of their product, is prepared to assist NOAA/NWS in development of mitigation measures where they have mutual applicability for air defense and missile warning radars.
6. POTENTIAL MITIGATION APPROACHES
The following sections will describe a number othat could be employed to reduce or eliminate the adveon“ tion” is specifically defined to include either an approach that completely preventsany negative impact from occurring or an approach that sufficiently attenuates any negative impacts so that there is no significant influence on the capability of an air defense or missile warning radar. Additionally, it is noted that the ability to describe a technique as a potential mitigation is not equivalent to saying that this technique hastested and verified. Significantly, only a few of the techniques described in the follosections have been proven to actually work and can be employed today. All of the otheare best characterized as “works in progress” still requiring further development and field or analytic validation of effectiveness.
Line of Sight Mitigation Techniques The performance of a radar will nowithin its line of sight unless exceptionaprojecting upward from the surface of this determined by four factors when there is no intervening terrain. These factors are thheight of the focal point of the radar above the earth’s surface, the height of the wind turbine, its distance from the radar, and how much the atmosphere will refract the radar beam. Figure 30 illustrates how these parameters interact. The yellow zone outlines the portion of the airspace that will be in the radar line of sight. Thus, the two turbines cloto the radar are in the radar line of sight. The third turbine, on the far right-hand side, is not. In fact, in colloquial terminology, this particular turbine would be described as being“below the radar.”
41
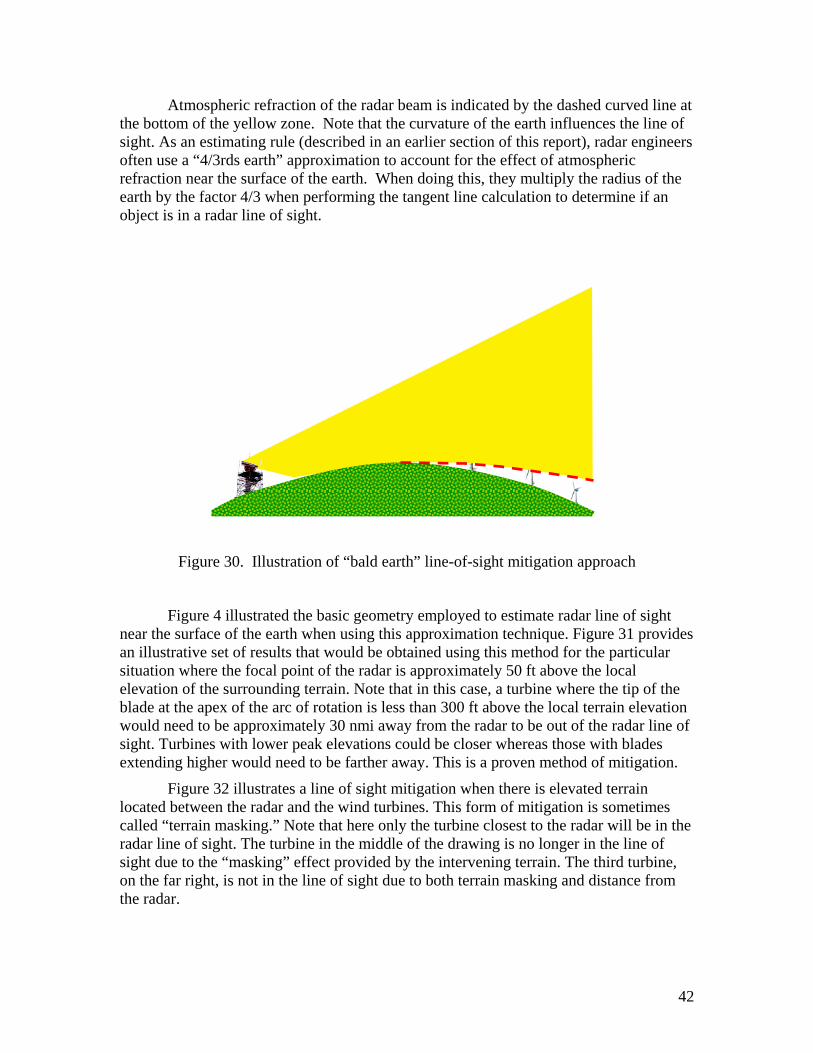
Atmospheric refraction of the radar beam is indicated by the dashed curved line athe bottom of the yellow zone. Note that the curvature of the earth influences the line of sight. As an estimati
t
ng rule (described in an earlier section of this report), radar engineers often u
n approach
Figure 4 illustrated the basic geomnear the rovides n illustrative set of results that would be obtained using this method for the particular
situatio
of
e
radar li f
se a “4/3rds earth” approximation to account for the effect of atmospheric refraction near the surface of the earth. When doing this, they multiply the radius of the earth by the factor 4/3 when performing the tangent line calculation to determine if an object is in a radar line of sight.
Figure 30. Illustration of “bald earth” line-of-sight mitigatio
etry employed to estimate radar line of sight surface of the earth when using this approximation technique. Figure 31 p
an where the focal point of the radar is approximately 50 ft above the local
elevation of the surrounding terrain. Note that in this case, a turbine where the tip of the blade at the apex of the arc of rotation is less than 300 ft above the local terrain elevation would need to be approximately 30 nmi away from the radar to be out of the radar line sight. Turbines with lower peak elevations could be closer whereas those with blades extending higher would need to be farther away. This is a proven method of mitigation.
Figure 32 illustrates a line of sight mitigation when there is elevated terrain located between the radar and the wind turbines. This form of mitigation is sometimescalled “terrain masking.” Note that here only the turbine closest to the radar will be in th
ne of sight. The turbine in the middle of the drawing is no longer in the line osight due to the “masking” effect provided by the intervening terrain. The third turbine,on the far right, is not in the line of sight due to both terrain masking and distance from the radar.
42
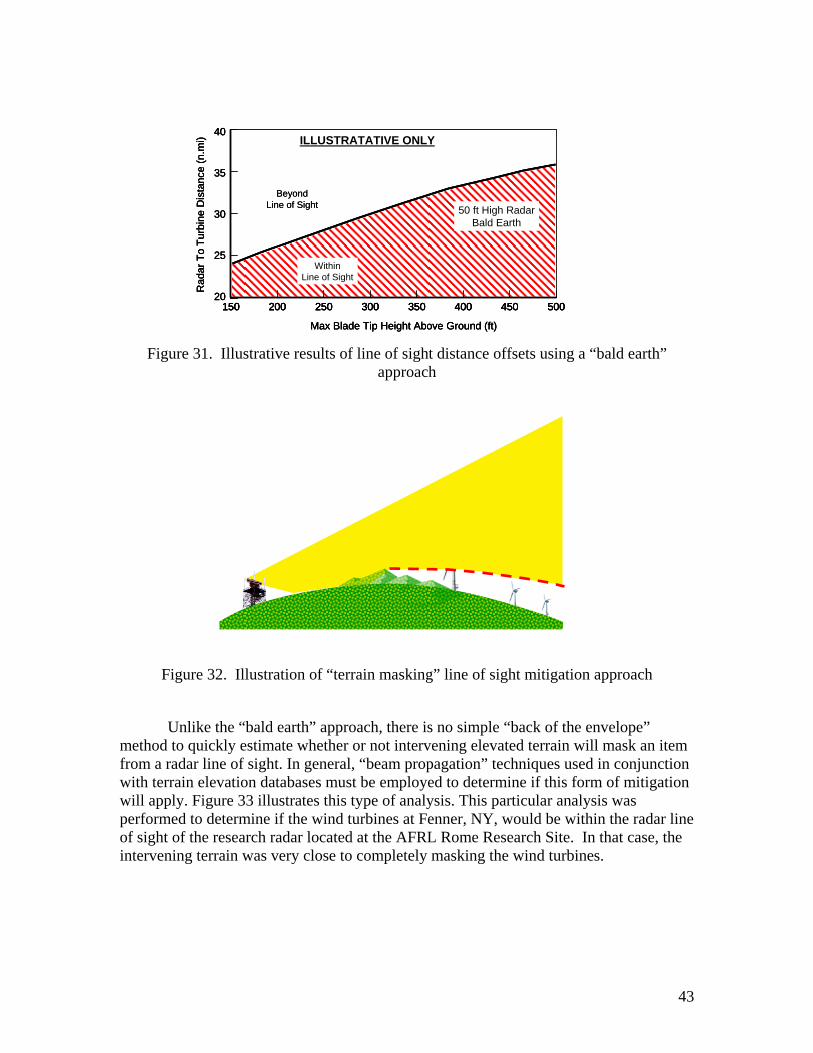
20
25
35
30
40
Figure 31. Illustrative results of line of sight distance offsets using a “bald earth”
approach
Figure 32. Illustration of “terrain masking” line of sight mitigation approach
Unlike the “bald earth” approach, there is no simple “back of the envelope” metho item from a radar line of sight. In general, “beam propagation” techniques used in conjunction with te in elevation databases must be employed to determine if this form of mitigation will ap
d to quickly estimate whether or not intervening elevated terrain will mask an
rraply. Figure 33 illustrates this type of analysis. This particular analysis was
performed to determine if the wind turbines at Fenner, NY, would be within the radar lineof sight of the research radar located at the AFRL Rome Research Site. In that case, the intervening terrain was very close to completely masking the wind turbines.
200 300 400 500150 250 350 450
Max Blade Tip Height Above Ground (ft)
Rad
ar T
o Tu
rbin
e D
ista
nce
(n.m
i)
20
25
35
30
40
BeyondLine of Sight
WithinLine of Sight
50 ft High RadarBald Earth
ILLUSTRATATIVE ONLY
200 300 400 500150 250 350 450
Max Blade Tip Height Above Ground (ft)
Rad
ar T
o Tu
rbin
e D
ista
nce
(n.m
i)
20
25
35
30
40
200 300 400 500150 250 350 450200 300 400 500150 250 350 450
Max Blade Tip Height Above Ground (ft)
Rad
ar T
o Tu
rbin
e D
ista
nce
(n.m
i) ILLUSTRATATIVE ONLY
BeyondLine of Sight 50 ft High Radar
Bald Earth
WithinLine of Sight
43
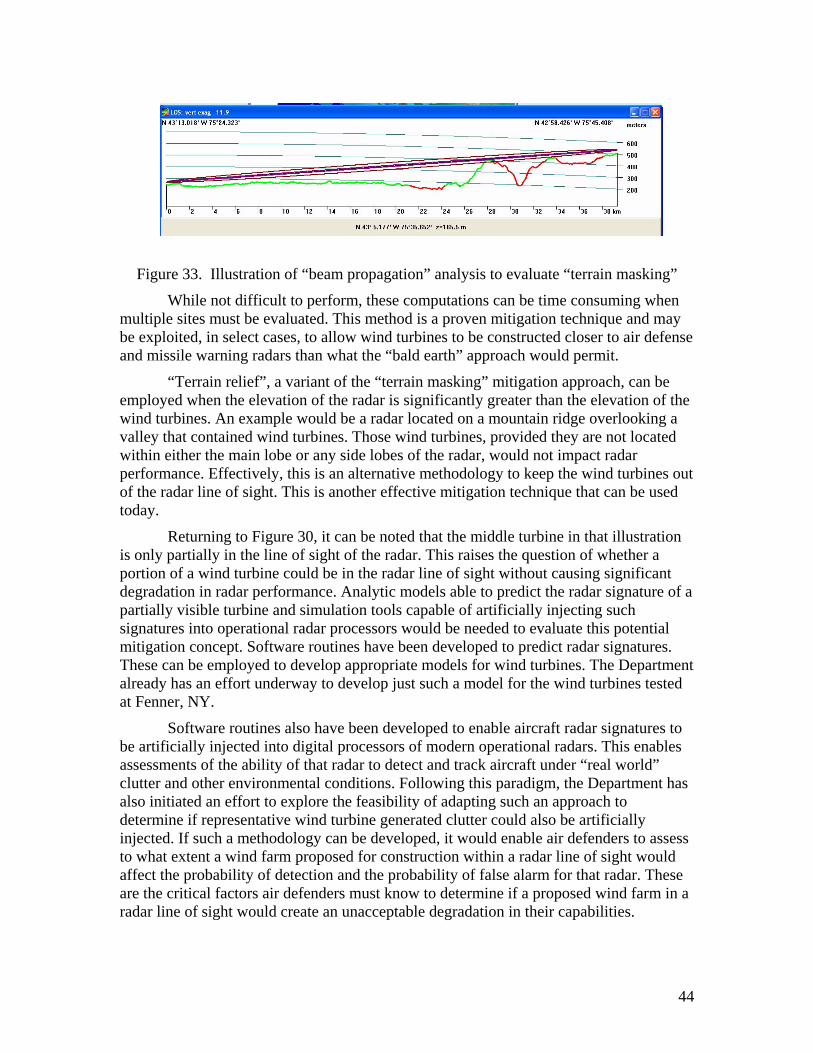
Figure 33. Illustration of “beam propagation” analysis to evaluate “terrain masking”
mbe expl e
on of the wind tu
t used
artially in the line of sight of the radar. This raises the question of whether a portion
a
ures. nt
ected into digital processors of modern operational radars. This enables assessm
to assess uld
While not difficult to perform, these computations can be time consuming when ultiple sites must be evaluated. This method is a proven mitigation technique and may
oited, in select cases, to allow wind turbines to be constructed closer to air defensand missile warning radars than what the “bald earth” approach would permit.
“Terrain relief”, a variant of the “terrain masking” mitigation approach, can be employed when the elevation of the radar is significantly greater than the elevati
rbines. An example would be a radar located on a mountain ridge overlooking avalley that contained wind turbines. Those wind turbines, provided they are not located within either the main lobe or any side lobes of the radar, would not impact radar performance. Effectively, this is an alternative methodology to keep the wind turbines ouof the radar line of sight. This is another effective mitigation technique that can betoday.
Returning to Figure 30, it can be noted that the middle turbine in that illustration is only p
of a wind turbine could be in the radar line of sight without causing significant degradation in radar performance. Analytic models able to predict the radar signature ofpartially visible turbine and simulation tools capable of artificially injecting such signatures into operational radar processors would be needed to evaluate this potential mitigation concept. Software routines have been developed to predict radar signatThese can be employed to develop appropriate models for wind turbines. The Departmealready has an effort underway to develop just such a model for the wind turbines testedat Fenner, NY.
Software routines also have been developed to enable aircraft radar signatures to be artificially inj
ents of the ability of that radar to detect and track aircraft under “real world” clutter and other environmental conditions. Following this paradigm, the Department has also initiated an effort to explore the feasibility of adapting such an approach to determine if representative wind turbine generated clutter could also be artificially injected. If such a methodology can be developed, it would enable air defenders to what extent a wind farm proposed for construction within a radar line of sight woaffect the probability of detection and the probability of false alarm for that radar. These are the critical factors air defenders must know to determine if a proposed wind farm in aradar line of sight would create an unacceptable degradation in their capabilities.
44
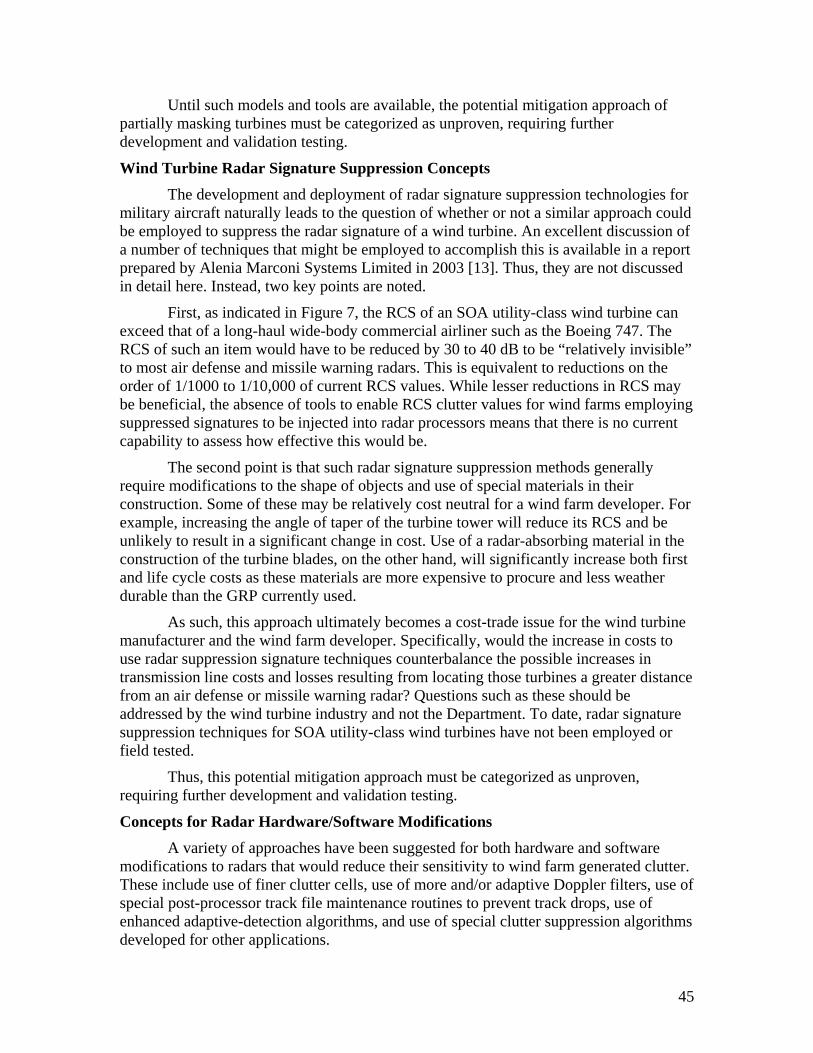
Until such models and tools are available, the potential mitigation approach of partially masking turbines must be categorized as unproven, requiring further development and validation testing.
Wind Turbine Radar Signature Suppression Concepts The development and deployment of radar signature suppression technologies for military aircraft naturally leads to the question of whether or not a similar approach could be employed to suppress the radar signature of a wind turbine. An excellent discussion of a number of techniques that might be employed to accomplish this is available in a report prepared by Alenia Marconi Systems Limited in 2003 [13]. Thus, they are not discussed in detail here. Instead, two key points are noted.
First, as indicated in Figure 7, the RCS of an SOA utility-class wind turbine can exceed that of a long-haul wide-body commercial airliner such as the Boeing 747. The RCS of such an item would have to be reduced by 30 to 40 dB to be “relatively invisible” to most air defense and missile warning radars. This is equivalent to reductions on the order of 1/1000 to 1/10,000 of current RCS values. While lesser reductions in RCS may be beneficial, the absence of tools to enable RCS clutter values for wind farms employing suppressed signatures to be injected into radar processors means that there is no current capability to assess how effective this would be.
The second point is that such radar signature suppression methods generally require modifications to the shape of objects and use of special materials in their construction. Some of these may be relatively cost neutral for a wind farm developer. For example, increasing the angle of taper of the turbine tower will reduce its RCS and be unlikely to result in a significant change in cost. Use of a radar-absorbing material in the construction of the turbine blades, on the other hand, will significantly increase both first and life cycle costs as these materials are more expensive to procure and less weather durable than the GRP currently used.
As such, this approach ultimately becomes a cost-trade issue for the wind turbine manufacturer and the wind farm developer. Specifically, would the increase in costs to use radar suppression signature techniques counterbalance the possible increases in transmission line costs and losses resulting from locating those turbines a greater distance from an air defense or missile warning radar? Questions such as these should be addressed by the wind turbine industry and not the Department. To date, radar signature suppression techniques for SOA utility-class wind turbines have not been employed or field tested.
Thus, this potential mitigation approach must be categorized as unproven, requiring further development and validation testing.
Concepts for Radar Hardware/Software Modifications A variety of approaches have been suggested for both hardware and software modifications to radars that would reduce their sensitivity to wind farm generated clutter. These include use of finer clutter cells, use of more and/or adaptive Doppler filters, use of special post-processor track file maintenance routines to prevent track drops, use of enhanced adaptive-detection algorithms, and use of special clutter suppression algorithms developed for other applications.
45
There is ongoing development work on some of these approaches being conducted by the radar industry under internal research and development efforts. In most cases, this work is focused on developing enhancements for existing products. Outputs from some of these development activities are being tested in “engineering” units, but to date none appear to have been deployed into operational units.
The Department is supporting these efforts by providing U.S. radar companies access to, and free use of, the database the Department obtained from the testing efforts conducted at Fenner, NY. In fact, this government-owned nonproprietary database was created for this specific purpose.
In May and June of this year, the UK MoD conducted independent flight trials of two proposed approaches developed for 2-D radars. Representatives from the Department were invited to, and did observe, portions of those trials. The impression of the Department’s observers was that both approaches showed promise, but neither was fully successful.
Consequently, as a result of the above, it is concluded that all of the hardware and software approaches described above must still be categorized as unproven, requiring further development and validation testing.
Concepts for Gap Filler Mitigation Approaches The underlying idea for this concept is exceptionally simple: if one radar cannot see an object due to obscuration created by a wind farm, then use a second radar that provides overlapping coverage. Figure 34 illustrates how such an arrangement would operate. The lines denote the limits of the areas beyond the blocking item where radar coverage would be inhibited. As indicated by this drawing, the radar zone of coverage for the radar on the left-hand side covers all the area blocked from the view of the radar on the right. Conversely, the radar on the right-hand side covers all the region where the view of the radar on the left has been blocked.
Coordinating two radars by software does present a number of challenges. First, a radar can locate the position of a target only within a finite level of accuracy determined by the size of the resolution cell. In the example, the resolution cells for one radar unit will never align with those of the other due to the offset positioning. Thus, inherent uncertainties are created in actual position when returns from one must be compared with returns from the other.
Second, it is unrealistic to expect that the radar beams from each unit will sweep the exact same area of interest at precisely the same moment. As such, relative target motion will always occur between the observations made by each radar. The coordination software would need to account for that as well.
If the “blocking area” is a wind farm, each radar will also experience false returns due to the rotation of the turbine blades and bleed through from the clutter map. There are no data available at present to determine if such false returns will be seen by both radars concurrently. If they are not, then the coordination software also will face the challenge of determining if the changes in observed position are due only to positional uncertainty and relative motion of the target or represent track “seductions” caused by false returns seen by one radar but not the other. This further increases the coordination challenge.
46
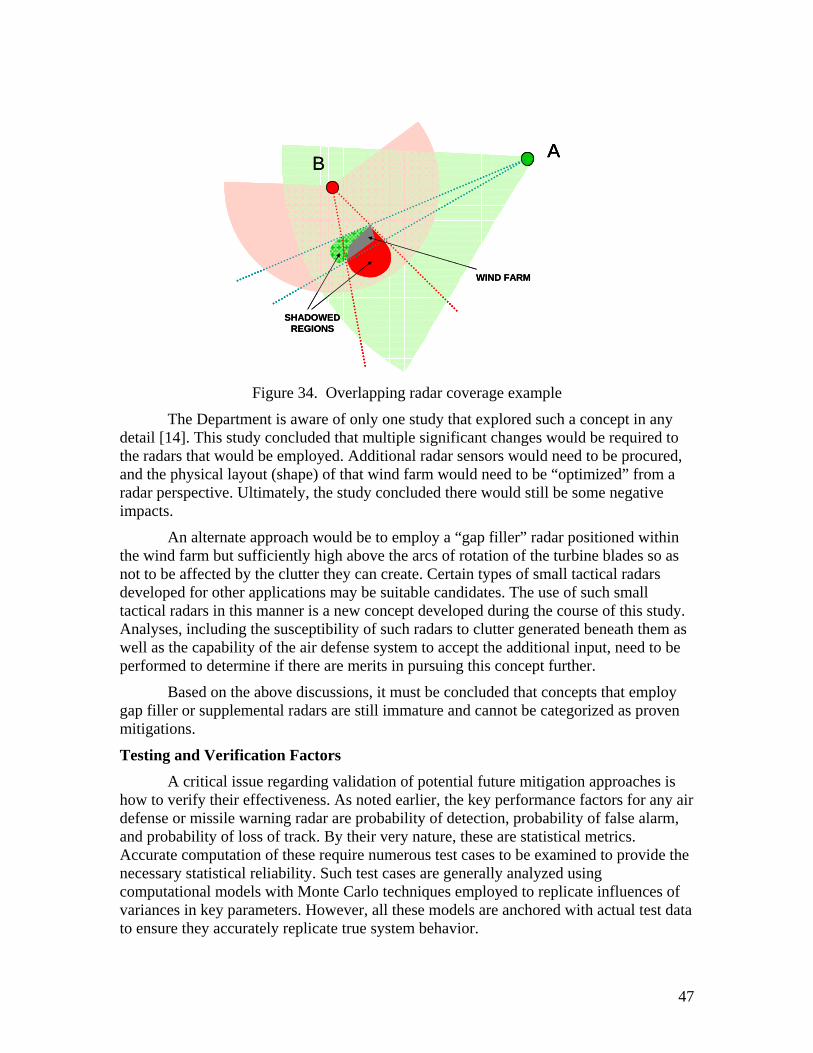
AB
AB
SHADOWEDREGIONS
WIND FARM
AB
AB
SHADOWEDREGIONS
WIND FARM
Figure 34. Overlapping radar coverage example
The Department is aware of only one study that explored such a concept in any detail [14]. This study concluded that multiple significant changes would be required to the radars that would be employed. Additional radar sensors would need to be procured, and the physical layout (shape) of that wind farm would need to be “optimized” from a radar perspective. Ultimately, the study concluded there would still be some negative impacts.
An alternate approach would be to employ a “gap filler” radar positioned within the wind farm but sufficiently high above the arcs of rotation of the turbine blades so as not to be affected by the clutter they can create. Certain types of small tactical radars developed for other applications may be suitable candidates. The use of such small tactical radars in this manner is a new concept developed during the course of this study. Analyses, including the susceptibility of such radars to clutter generated beneath them as well as the capability of the air defense system to accept the additional input, need to be performed to determine if there are merits in pursuing this concept further.
Based on the above discussions, it must be concluded that concepts that employ gap filler or supplemental radars are still immature and cannot be categorized as proven mitigations.
Testing and Verification Factors A critical issue regarding validation of potential future mitigation approaches is how to verify their effectiveness. As noted earlier, the key performance factors for any air defense or missile warning radar are probability of detection, probability of false alarm, and probability of loss of track. By their very nature, these are statistical metrics. Accurate computation of these require numerous test cases to be examined to provide the necessary statistical reliability. Such test cases are generally analyzed using computational models with Monte Carlo techniques employed to replicate influences of variances in key parameters. However, all these models are anchored with actual test data to ensure they accurately replicate true system behavior.
47
With regard to wind farms, the Department has initiated efforts to develop an analytic model to replicate the RCS and Doppler characteristics of a specific SOA utility-class wind turbine. Ultimately, additional models may need to be developed to replicate other brands, styles, and sizes of wind turbines. This will ensure that wind turbine models used in analytic simulation tools will be sufficiently robust to capture the key characteristics of all current generation SOA utility-class wind turbines in an appropriate statistical manner.
The Department also has initiated efforts to explore the feasibility of creating simulations of wind farms that could be numerically injected into the processors of operational radars. These would provide important tools to assess impacts that could result from construction of future wind farms within radar line of sight of an air defense or missile warning radar.
The final issue that must be addressed is how to anchor these models and tools with test data to ensure they accurately replicate real-world behavior. The testing the Department has already performed at Fenner, NY, should be sufficient to validate that analytic RCS and Doppler models can be created for an SOA utility-class turbine. Flight trials using radars that already have wind farms within the radar line of sight can provide another critical validation tool. However, the selection of what specific site or sites that should be used for this purpose requires careful consideration.
For example, the Altamont wind farm contains a very large number of wind turbines where the overwhelming percentage are “out-of-date” designs with relatively small turbine blades. The RCS characteristics of those blades inherently will be significantly lower than current generation systems. Additionally, many of those wind turbines are mounted on relatively short tubular truss towers. Those towers will have significantly different RCS characteristics than the tapered cylindrical towers being used now. Finally, the older model turbines at Altamont rotate at higher rate than that used for more modern designs. All of these factors suggest that this particular location would not serve as the best test site to explore or verify any proven mitigation strategy.
Consequently, an effort will need to be undertaken to establish appropriate criteria for selection of test sites to conduct flight trials. Such an effort should be performed before U.S.-sponsored flight trials are attempted to ensure the results obtained will provide the data required for modeling and simulation purposes.
7. OTHER POTENTIAL IMPACTS ON DOD READINESS
This section of the report describes other areas where the presence of wind
turbines or wind farms have the potential to influence Department readiness. These generally fall under the requirements associated with the Department mission to train and equip U.S. forces. The discussions in this section are specifically limited to those aspects as they pertain to Department facilities and sites within the 50 states and U.S. territories and possessions. Possible impacts at overseas locations are not included as they must be evaluated in light of existing agreements with host nations.
48
The Department must carry out its national security missions effectively with careful attention to the safety of the general public and Department personnel. The presence of wind turbines in the vicinity where these military missions occur has the potential to impact the effectiveness of such missions and thus military readiness.
It is important to note that while this section discusses potential areas of impact to readiness it would be inappropriate to draw sweeping or broad-based conclusions that these would occur at all facilities and sites employed by the Department. As operational requirements at different locations vary, the particular characteristic of a wind farm may present a challenge in one location but not others. Consequently, within the context of this section, potential impacts on readiness due to any particular proposed wind farm development need to be evaluated on a case-by-case basis. Where possible impacts to readiness could occur it is important to ensure that appropriate measures to mitigate risk are identified and implemented.
Finally, it should be noted that many of the potential impacts discussed in this section are similar to those that can be posed by other tall objects such as radio antennas, cell phone towers, and buildings proposed for construction in the vicinity of Department sites and facilities. The Department has developed and employed, for many years, strategies and mitigation techniques to effectively address those possible impacts. To date, the Department has not identified any specific information that would lead to the conclusion that those methods would not be similarly effective for addressing potential impacts from proposed wind farm developments as they relate to the items in this section of the report. As such, these items have been included in the report only to ensure completeness of this overall assessment.
The potential impacts to readiness are generally categorized into the following areas: 1) Overflight and Obstruction, 2) Security, 3) Signature, and 4) Environment. Potential impacts to flying safety are considered in the area of overflight where obstructions are introduced. Potential security issues during and after development are addressed near installations or where the Department conducts operations. Potential impacts related to the electromagnetic signature associated with wind turbines are evaluated. Finally, possible impacts related to the responsibilities of the Department with regard to environmental stewardship are discussed.
Overflight and Obstruction The potential overflight obstruction hazard impact to readiness is a shared
potential impact to all aviation users including the Department, commercial, business, and general aviation users. As with other large vertical construction projects, such as telecommunication towers, the Department considers the potential impacts of wind farm development on flight safety from obstructions introduced near Department airfields and in other areas used for military flight operations.
The potential impact of any tall vertical development near Department airfields is virtually identical to the risks associated with development near civilian airports such as potential interference with flight operations during take off, departure, approach and landing. In relation to flight operations away from airfields, excessive development of
49
wind turbines in, under or adjacent to airspace, test ranges and training ranges where low-flying operations are conducted may adversely affect the altitude at which operations can be conducted. There is a potential increased risk due to the increased likelihood of encountering tall vertical structures during low altitude flight operations. The nearby location of overhead transmission lines to connect the wind turbines to the local power grid can also present a flight hazard to low altitude flight operations. The individual evaluation of any proposal considers such impacts of any specific development on a specific section of airspace. Further, the Department must consider the potential for wind farm development to obstruct or restrict military surface missions, ground maneuver operations; sea surface and sub-surface operations.
Effective management procedures already are in place to deal with questions that may arise from potential obstruction of airspace due to the proposed construction of wind turbines. As a general rule, specific Department installations are assigned management responsibilities for a section of airspace. If a proposed wind turbine is to extend more than 199 ft above local elevation, a notification of proposed construction should come through the FAA’s Obstruction Evaluation / Airport, Airspace, Analysis (OE/AAA) process. The FAA will notify the managers of any affected military flying routes. The affected Services evaluate the proposal for any possible detrimental impacts to operations.
Security In some circumstances, wind farm developments near Department facilities and
sites may pose temporary or long-term security risks of various degrees. Similar to other large construction projects near Department installations, the increased level of personnel and activity during construction requires increased monitoring for security purposes. Additionally, similar to other tall vertical development, wind turbines can provide increased visual and sensor access to sensitive Department areas and activities.
The Department, as part of its normal practices, adapts its security measures in such situations. Thus wind farm development is not anticipated to create any special challenges in this regard.
Signature
As discussed in other sections of this report, a wind turbine has a unique electromagnetic “signature” that can vary based on environmental conditions. The specific signature characteristics of a given development may have potential impact on certain types of Department systems. Examples of the areas of potential impact include, among others, systems specifically designed to operate in or influence the electromagnetic spectrum such as electronic warfare activity for communications, surveillance, threat, and radar systems. Further, the Department must determine potential impacts to space launch activities and telemetry operations. The potential impact of the signature may be increased in areas where the Department conducts high fidelity developmental testing and evaluation in the electromagnetic spectrum.
50
Additionally, the electromagnetic signature of a given development either created by the wind turbine itself or as a result of reflection from other sources should be evaluated for potential electromagnetic interference with electronic systems routinely employed in military missions. The potential impact could be on Department installations or in areas where the Department conducts operations. This includes systems under development as well as those already fielded.
Special analyses will need to be conducted to evaluate situations where potential electromagnetic signature impacts could occur.
Environment
Military installations, testing and training facilities expend considerable effort to ensure adequate measures are being taken to conserve and protect the nation’s environment and natural resources. Under the Readiness and Environmental Protection Initiative (REPI), 10 USC 2684a, many Department installations have, or are developing, encroachment and conservation buffer partnerships on lands in the vicinity of, or ecologically related to, a military installation or training/testing area. These partnerships are aimed at relieving encroachment pressure from either incompatible development and/or loss of natural habitat, which could adversely impact military operations. This program applies to installations, airspace, and coastal waters within the United States and its territories.
Where such encroachment and conservation buffer partnerships exist or are in development, proposals to develop wind farms in or adjacent to those areas should be carefully evaluated to ensure compatibility with such partnerships and related activities.
Summary of Potential Mitigation Approaches
General recommendations for mitigation of potential impact include establishment of multi-agency stakeholder groups to improve the processes used by developers and the federal, state and local governments in the proposal and evaluation phases. This will involve establishing stakeholder groups with other federal agencies that have equities in this subject area. Such interagency forums should review and evaluate existing processes and adjust those as necessary to identify and address potential impacts.
As a general rule, Department installations are assigned management responsibilities for specific sections of airspace. In many cases, proper documentation and charting of the location will provide sufficient mitigation. Methods to provide aircrew with development notices and updates to air navigation charts that are prepared and distributed expeditiously as wind power development continues to accelerate will be reviewed and revised as appropriate to mitigate the potential risks associated with overflight and obstruction.
Potential security risks identified may be mitigated through increased awareness by Department personnel during and after construction depending on the nature of the potential impact. Any unique, site-specific impact, would be addressed by the appropriate Department organization and the potentially impacted facility.
51
Additionally, at the regional and local installation level, community-outreach programs provide viable venues for installation commanders to work with wind farm developers to mitigate potential impacts. One successful Department initiative has been the development of “Red/ Yellow/ Green,” traffic light charts to be used by both the Department and developers for discussion and dialog. These charts identify specific areas around installations where Red is employed to designate areas where a wind farm development is highly likely to impact readiness, Yellow to denote areas where collaboration is needed to avoid or mitigate impact and, Green to identify areas where there is no anticipated impact to Department readiness. It is critical to note that this approach is applicable to the topics discussed in this section but not appropriate to address impacts on air defense and missile warning radars that were discussed elsewhere in this report.
8. SUMMARY Air Defense Radars - Shadowing
Wind turbines are physically large structures that will block the transmission of radar waves in a manner similar to tall buildings. The blockage caused by a single turbine, due to its slender shape, will be relatively small, resulting in a negligible shadow area behind that single turbine. Multiple turbines located in proximity of each other will also cause diffraction of radar waves. Decreasing the separation distance between the turbines increases the diffraction effect.
The diffraction of the radar waves will reduce the intensity of the propagating wave directly behind the turbines (see Figure 6) as well as the reflected signal from a target. This two-way reduction in signal strength will increase the difficulty in detecting and tracking targets flying at low altitude in the immediate vicinity of the wind turbines. This effect will be most pronounced for targets with a small RCS. Such targets inherently are the most challenging in all circumstances, and this added burden will result in a noticeable reduction in probability of detection for them.
Predicting the reduction in signal strength due to diffraction effects is potentially a mathematically tractable problem when it is assumed the turbine blades are stationary. This has been the basis for the “spacing algorithms” employed by a few nations. No method exists at present to accurately calculate the reduction in signal strength that will occur when the turbine blades are rotating.
Turbine blade rotation will also create false returns when attempting to detect and track targets at very low altitudes. This further complicates the situation, leading to the potential that low-RCS targets can successfully employ wind turbines to execute a “covert” approach to a high-value asset. This will compromise the ability of on-site or nearby security forces to detect such a possible attack with sufficient lead time to react. Consequently, special case-by-case analyses will be required to assess potential impacts on local air defense systems for high-value assets to determine if a nearby wind farm could compromise reaction capability. In such cases, any proposed wind farm should be located at a sufficient distance so that the on-site defense forces are able to identify any potential threat with sufficient warning time to enable them to react as required. Failure
52
to incorporate such considerations in locating wind turbines either on site or in the nearby vicinity will degrade military readiness for this mission.
Air Defense Radars - Clutter
Modern utility-class wind turbines, due to their large size, possess a significant RCS at all common radar bands. Based on the data obtained during this study, the RCS for one particular turbine ranged from that of a “business class” airplane to a value greater than that of a long-haul, wide-body aircraft. In addition, the rotating blades of such wind turbines create Doppler shifts equivalent to the velocities of aircraft.
Since the wind turbines in a wind farm are geographically stationary and near the surface of the earth, these two effects will combine to appear as “clutter” to an air defense radar. The amount of clutter produced will increase in direct proportion to the number of turbines within the line of sight of the air defense radar. A single turbine located a reasonable distance away from an air defense radar will have minimal impact on the ability of that radar to successfully detect and track all potential targets of interest to include challenging low-RCS targets. However, a large number of wind turbines spread over a wide sector of coverage for that radar will significantly degrade the ability of that radar to perform its mission. This form of impact has been documented in numerous UK MoD-sponsored trials.
At present no tools exist to accurately determine where the transition point lies between the minimal impact created by a single turbine and the unacceptable level of degradation that will be produced by a large wind farm located in radar line of sight. The Department has initiated efforts to develop such tools. Until such tools have been developed and validated, the Department will be unable to ensure that fixed-site U.S. air defense radars are not compromised in their performance should a wind farm be constructed within the radar line of sight. Degradation in the detection and tracking ability of long-range air defense radars will reduce their mission effectiveness and thereby degrade the ability to defend the nation.
As discussed in a prior section of this report, the only currently proven mitigation techniques to prevent compromising U.S. air defenses is to ensure wind farms are not within radar line of sight of fixed-site air defense radars. As illustrated by Figures 4 and 31, radar line of sight near the surface of the earth is dependent upon the height of the radar unit, the height of the wind turbine, and the separation distance between them. Additionally, terrain irregularities, of the type illustrated in Figure 32, between the radar and the wind farm can significantly reduce the distance to where the wind turbines will no longer be within radar line of sight. Alternatively, a substantial elevation difference between the radar and the wind farm can produce a similar effect. Since all these parameters are site specific, each proposed wind farm would need to be evaluated on a case-by-case basis for the present.
The DOD/DHS Long Range Radar Joint Program Office already has established an informal consultation service to work with wind farm developers to assist them in identifying locations where radar line of sight concerns could exist. This approach should be continued and possibly expanded to include other defense-related concerns. This
53
informal advisory assistance should remain optional and not replace or supplant existing regulatory review processes.
A special note needs to be mentioned regarding protection provided during “special events.” As part of its support to the homeland security mission, the Department will, at times, deploy supplemental air defense assets to provide additional protection during special events such as the Super Bowl, the World Series, Olympic type sporting events, political conventions, and other major gatherings that could be targets for terrorists. Air defenders providing such supplemental coverage will require knowledge of the locations of all nearby wind farms so that they can optimally position and operate those supplemental assets. The assistance of the wind energy industry to compile and maintain a database that can provide such information in a readily accessible manner by air defenders would be highly desirable.
Missile Early Warning Radars
The EWR fixed-site radars are required to be able to detect and track exceptionally low-RCS objects at extreme ranges with high confidence and accuracy. This also includes a requirement to be able to accurately discriminate between closely spaced objects so that Inter-Continental Ballistic Missile delivered nuclear weapon reentry vehicles can be distinguished from potential countermeasures specifically employed to confuse defensive systems.
The early warning radars are large, high-power phased-array radar systems specifically designed to accomplish this task. The high power level is required to ensure adequate illumination of potential threat complexes at very long ranges. The phased-array antenna is designed to enable the main beam to be focused on such complexes. The critical technical performance requirement is to ensure that the signal-to-noise ratio (SNR) is sufficient to accomplish the detect, track, and discriminate functions.
A simplified analysis had been performed for the early warning radar at Cape Cod AFS to assess if a wind farm being proposed for construction in the Nantucket Sound area would impact that radar. This simplified analysis contained three specific faults. First, it incorrectly employed the sine function rather than the tangent function to calculate beam elevation as a function of distance. This particular error, however, was numerically insignificant since, for the small angle considered, the values for sine and tangent of that angle are almost equal.
The second error in that analysis was the failure to account for atmospheric refraction of the beam and curvature of the earth. At low altitudes, such as in the immediate vicinity of the radar antenna, the main beam will be refracted by the atmosphere. The result of this flaw is to incorrectly predict the elevation of the high sensitivity region of the main beam as a function of distance from the radar. This was a more significant error.
The third error was that the analysis assumed a wind turbine would only impact radar performance if it was located in the main beam. In point of fact, a wind turbine could provide “clutter” reflections to the radar if any portion of that turbine appears in any portion of the main beam or in the side lobes, were the resulting level of the reflected
54
signal to exceed allowable noise thresholds. If that were to occur, it would reduce the SNR and thereby degrade the ability of the radar to detect, track, and discriminate the most challenging threat objects. This error, too, is a potential source of significant error.
Consequently, a more comprehensive analysis needs to be performed for these radars. Such an analysis should also include consideration of whether range gating or other possible approaches can be employed to mitigate impacts. This analysis should also seek to establish generalized “red zone” areas for U.S.-based fixed-site early warning radars so that locations for future wind farms can be selected without requiring additional studies. In this regard, such “red zones” should also consider impacts on “back lobes,” to the extent they may exist, so as to guide placement of turbines on either Cape Cod AFS or Beale AFB. The Department will be unable to assess if wind farms in the nearby vicinity of either fixed-site early warning radar will impact their performance until such a more comprehensive investigation is performed.
Air Traffic Control Radars
As with air defense radars, wind turbines within the radar line of sight of ATC radars can cause reduction in their capability to track aircraft by primary radar return. However, the primary radar element in an ATC radar employed for air traffic management is only one part of a system developed to ensure the safe and efficient use of U.S. airspace. Other elements of this system, for example, include SSR systems, flight rules, and published approach and departure procedures for military airfields and civilian airports.
The FAA has the responsibility for promoting and maintaining the safe and efficient use of U.S. airspace for all users, to include the military. The Department, consistent with the long tradition of cooperation with the FAA, is prepared to assist the FAA in any subsequent investigations or analyses the FAA believes may be required to assess how wind turbines in radar line of sight of ATC radars might influence the U.S. air traffic control management system. As such, the Department defers any recommendations in relation to this particular aspect to the FAA. As is standard practice, the Department will adjust its processes and operating procedures for U.S.-based ATC radars operated by the military consistent with any subsequent guidance developed by the FAA.
Weather Radars
A number of studies have been performed to explore the impact wind turbines can have on the performance of ground-based weather radars when located within their radar line of sight. The bibliography provides just a few references [15-18] for some studies that have been performed in both the United States and Europe on this topic.
The National Weather Service (NWS) of the National Oceanic and Atmospheric Administration has been exploring this aspect and sponsoring efforts to develop mitigation techniques. As such, the Department defers to the NWS regarding identification of impacts on weather radars and development of any necessary mitigation
55

approaches. The Department is willing to provide technical assistance, when appropriate, where potential mitigation measures under development have specific applicability to air defense and missile warning radar systems.
Other Potential Impacts on DOD Readiness
The Department conducts its operations in an increasingly complex environment. Wind farm development has the potential to influence Department activities in such diverse areas as military training, testing and development of current and future weapon and other systems, security, and land use to name a few. As operational requirements vary from location to location, any particular characteristic of a wind farm may present a challenge in one location but not at others. In this regard, the challenges that may be posed often but not always, will be similar to those associated with construction of other large objects such as telecommunication towers and in this respect, are not, in fact, unique to wind farms. For example, the de-confliction of land or airspace is an issue that the Department manages in concert with other stakeholders on a daily basis.
The Department has developed and employed, for many years, strategies and
mitigation techniques to effectively address those possible impacts. To date, the Department has not identified any specific information that would lead to the conclusion that those methods would not be similarly effective for addressing potential impacts from proposed wind farm developments as they relate specifically to the subject of Other Potential Impacts on DOD Readiness.
Treaty Compliance Sites
The Department, in conjunction with the National Nuclear Security Agency (NNSA) of the Department of Energy, employs special sites to monitor compliance with the Comprehensive Test Ban Treaty. Those sites that employ seismic type sensors to accomplish this task are sensitive to background seismic noise. Increasing the ambient level of seismic noise will degrade the ability of these sites to perform their required task.
The UK has a similar site at Eskadalemuir and has conducted an in-depth study [19] to establish guidelines to ensure adequate offset distances for any wind turbines proposed for construction in that local area. The Department believes an effort should be undertaken to develop similar guidelines for U.S. sites employed to monitor treaty compliance. Additional information on this subject is provided in Appendix 2.
9. CONCLUSIONS
1. Wind farms located within radar line of sight of an air defense radar have the potential to degrade the ability of that radar to perform its intended function. The magnitude of the impact will depend upon the number and locations of the turbines. Should the impact prove sufficient to degrade the
56
ability of the radar to unambiguously detect and track objects of interest by primary radar alone this will negatively influence the ability of U.S. military forces to defend the nation.
2. The currently proven mitigations to completely prevent any degradation in primary radar performance of air defense radars are limited to methods that avoid locating wind turbines within their radar line of sight. These mitigations may be achieved by distance, terrain masking or by terrain relief and must be examined on a case-by-case basis.
3. The Department has initiated research and development efforts to develop additional mitigation approaches that in the future could enable wind turbines to be within radar line of sight of air defense radars without impacting their performance. Such development efforts should be continued. Such future mitigation techniques will require adequate test and validation before they can be employed.
4. A more comprehensive analysis is required to determine how close wind turbines can be built to early warning radars without causing negative impacts on their performance.
5. The FAA has the responsibility to promote and maintain the safe and efficient use of U.S. airspace for all users. The Department defers to the FAA regarding possible impacts wind farms may have on the Air Traffic Control (ATC) radars employed for management of the U.S. air traffic control system. The Department is prepared to assist the FAA in efforts the FAA may decide to undertake in this regard.
6. The Department is prepared to assist the NWS, where appropriate, in its efforts to develop mitigation techniques for ground-based weather radars where such techniques may have mutual benefit for Department systems.
7. Wind turbines in close proximity to military training ranges, as well as test and development sites, can adversely impact the “train and equip” mission of the Department. Existing processes to include engagement with local and regional planning boards and development approval authorities can be employed to mitigate potential concerns in relation to this.
8. Construction of wind turbines near Comprehensive Test Ban Treaty monitoring sites can adversely impact their performance by increasing ambient seismic noise levels. Analyses should be performed to develop appropriate guidelines regarding how close wind turbines may be built to such sites.
9. Given the expected increase in the U.S. wind energy development, the existing siting processes as well as mitigation approaches need to be reviewed and enhanced in order to provide for continued development of this important renewable energy resource while maintaining vital defense readiness.
57

REFERENCES
1. Wind Performance Report Summary 2002-2003, California Energy Commission, June 06
2. Wind Energy--THE FACTS: An Analysis of Wind Energy in the EU-25, European Wind Energy Association, circa 2003
3. Technical Standard Order C74c: Airborne ATC Transponder Equipment, Federal Aviation Administration, February 20, 1973
4. Upgraded Early Warning Radar Supplement to the National Missile Defense (NMD) Deployment Draft Environmental Impact Statement, US Army Space and Missile Defense Command, January 21, 2000
5. Wind Farms Impact on Radar Aviation Interests-Final Report, QinetiQ, September 2003
6. The Air Force Research Laboratory (AFRL) Mobile Diagnostics Laboratory (MDL) Wind Farm Turbine Measurements Fenner, NY – Final Report, July 20, 2006
7. Study Into the Effects of Wind Turbines On Radar Performance, UK Royal Air Force Signals Engineering Establishment Technical Report 94010, December 1994.
8. The Effects of Wind Turbine Farms on AD RADARS, Air Warfare Center, Royal Air Force, January 6, 2005
9. The Effects of Wind Turbine Farms on ATC RADARS, Air Warfare Center, Royal Air Force, May 10, 2005
10. Further Evidence of the Effects of Wind Turbine Farms on AD RADARS, Air Warfare Center, Royal Air Force, August 12, 2005
11. Special Evaluation Report to Assess Effect of Wind Turbine Farm on Air Route Surveillance Radar-4, at King Mountain, Texas, USAF 84 RADES & FAA, May 30, 2002
12. Baseline Evaluation of the ARSR-2 RADAR at Tyler, MN, FAA and USAF 84 RADES, September 10, 2004
13. Feasibility of Mitigating the Effects of Windfarms on Primary Radar, Alenia Marconi Systems Limited, 2003
14. Technical and Operational Feasibility Study on the Use of Additional Sensor(s) to Mitigate Round 2 Offshore Windfarms in the Greater Wash Area, BAE Systems, August 2005
15. Anomalous Propagation (AP) Ground Clutter in WSR-88D Base Data, Pratte, ERL/FSL and NCAR/ATD, November 15, 1996
16. Developments in the DWD radarnetwork, Hafner, et al, Proceedings of the Second European Conference on Radar Meteorology (ERAD 2004), 2004
17. The AP Ground Clutter Mitigation Scheme for the WSR-88D, Kessinger, NCAR, undated
18. Impact of Wind Turbines on Weather Radars, EUMETNET, March 31, 2005 19. Microseismic and Infrasound Monitoring of Low Frequency Noise and Vibrations
from Windfarms (Eskdalemuir), Final Report and Summary & Recommendations (2 items), Styles, Keele University, 18 Jul 05
58

APPENDIX 1. POLICIES EMPLOYED BY SELECT NATO COUNTRIES
Several European governments have developed policies and procedures to address the siting of wind turbines in locations to reduce their impact on air defense and air traffic control radars. The policies vary considerably, reflecting different degrees of understanding that government policymakers have of the effects that wind turbines have on radar, different radar systems employed by that country, and different relationships between the military and industrial communities of that country. This appendix briefly describes the current policy employed by each of several NATO governments in regulating/influencing the placement of wind turbines in the vicinity of radar systems.
In November 2005, the Department, in cooperation with the UK Ministry of Defence, co-sponsored a NATO research and development study on this topic. The specific goal of that study is:
To assess studies, analyses and field trials already conducted by the participating member nations to enable identification of gaps in understanding of underlying phenomenology. To develop a coordinated approach to address these gaps and any other concerns raised by participants. Finally, to develop a coordinated plan to conduct the necessary studies, analyses, or field trials to obtain any additional data deemed to be essential to fully comprehend this issue.
United Kingdom
As a result of several years of extensive flight trials and analysis described elsewhere in this report, the United Kingdom has the most robust understanding of the various effects that wind turbines have on their specific air traffic control (ATC) and air defense radar systems. Their regulatory process has undergone considerable evolution to reach its current state.
For UK ATC radars, the civilian operators must always honor the presence of displayed radar returns. Thus, displayed returns from wind turbines must be treated as real aircraft. Under instrumented meteorological conditions, ATC must be used to ensure safe separation between aircraft, including returns from wind turbines. On this basis the UK policy is that a wind farm close to an airfield is not compatible with ATC operations. A minimum lateral separation of 5 nmi should be maintained where critical ATC operations take place.
For UK air defense radars, the radar operators must be able to reliably track all aircraft that could pose a threat. The operators must include the ability to track by primary radar alone if necessary. UK studies to date have concluded that the radar’s probability of detection is reduced in air space over wind turbines due to technical aspects of radars and the large radar cross section of wind turbines, and no mitigation solutions have yet proven to provide the required level of radar coverage. On this basis, the UK Ministry of Defence must be consulted on all proposed wind turbines that are within the radar line of sight of an air defense radar, regardless of distance.
59

Germany
The major concern of the German government was the shadowing of targets by wind turbines when it developed its wind farm policy. A “protection zone” of 10 km around all military ATC radars is protected by German law. An “area of interest” is defined as the region up to 18 km from the ATC radars. The German policy is that specific permission for construction of obstacles (buildings, high-voltage lines, wind farms, etc.) must be granted by the German Defense Administration. For wind turbine proposals the Bundeswehr Air Traffic Services Office evaluates potential impacts to radar performance. Proposed construction within the “area of interest” is evaluated for line of sight, height, distance, turbine size, existing obstacles, radar frequency, and local topography. Technical comments and recommendations are requested from responsible military commands and a determination, including potential mitigation options, is communicated to the proposer by the German Defense Administration.
Netherlands
The Royal Netherlands Air Force (RNLAF) was concerned about the impact that shadowing by wind turbines had on radars. The policy of the Netherlands’ government is that plans for wind turbines within 15 nmi of military radars must be submitted to the RNLAF, which then requests an impact analysis from The Netherlands Organisation for Applied Scientific Research (TNO). TNO then performs analyses based on modeling and simulation, helicopter-based field tests, and laboratory experiments and provides these to RNLAF, who makes the final determination. Austria
The Austrian Air Force, based on limited field tests, is concerned about wind farms causing electromagnetic interference to radars, radio relays, and high-frequency direction finders as well as being obstacles to low-flying routes. Austrian policy is for wind turbine construction proposals to be evaluated by local authorities (mayor, district governor) in consultation with the Austrian Ministry of Defense. For turbine proposals further than 10 km from an air-defense radar no objections are raised; between 5 and 10 km an objection is raised unless the mast and gondola are outside the coverage volume (i.e., the radar line of sight of the area that the radar surveils) and the angle of obstruction is less than 5%; inside 5 km an objection is raised unless the whole turbine is outside the coverage volume.
Norway
Norway is concerned about false tracks from wind farms within 50 km of a military radar. Approval for construction is obtained from the Ministry of Oil and Energy after consultation with the Ministry of Defense and its research establishment and defense components. Possible mitigations that are considered include adjustments to the wind farms, adjustments to the radar (if the cost is less than $3M), or moving the radar/purchasing a new radar (if the costs to adjust the radar are greater than $3M).
60
APPENDIX 2. IMPACTS ON TREATY COMPLIANCE SYSTEMS
In addition to impacts on defense radar systems, wind turbines generate seismic and infrasound noise that could potentially contaminate monitoring stations providing data to support the Comprehensive Test Ban Treaty (CTBT) and U.S. nuclear explosion monitoring efforts.
United Kingdom Eskdalemuir Seismometer Array
The longest operating steerable seismometer array in the world is located at Eskdalemuir, in Scotland. The array is one of a global network that monitors compliance with the CTBT. This area has very little background seismological noise, and the seismometer array is very accurately calibrated, having monitored approximately 400 nuclear explosions at distances up to 15,000 km and numerous other seismic events (including detonations of conventional explosives, earthquakes etc.). It has recorded explosions from detonations as small as 100 tons of conventional explosives in Kazakhstan (about 5250 km away).
The Eskdalemuir area happens to be attractive to wind energy developers because of a high average wind speed, the availability of good connections to the national grid, and relatively few people living in the area who could object.
UK Microseismic and Infrasound Monitoring Studies To assess the potential impact of wind turbines, in early 2004 the UK Ministry of Defence, the Department of Trade and Industry, and the British Wind Energy Association funded a study by Professor Peter Styles of the School of Earth Sciences and Geography at Keele University to collect and analyze data about wind farms and their seismic and infrasound noise generation. The study included review of existing research in the United Kingdom and United States, and empirical tests at Dun Law and Ardrossan wind farms. The Styles study reported their results and recommendations in July 2005. [19]
The Styles study included the installation and almost continuous 6-month operation of 10 three-component seismic sites at increasing distances away from the Dun Law wind farm, the deployment of 4 infrasound stations at certain distances from Dun Law, and the installation of accelerometers on wind turbine towers and strong motion detectors in the immediate vicinity of turbines at Dun Law and Ardrossan. The study analyzed the seismic background noise levels recorded at Eskdalemuir at different times and with different weather conditions. Seismic background noise results from several different sources including: cultural, which includes vehicle and railroad traffic; coastal noise, which results from ocean waves and surf, and local weather and seasons, which are storm and wind-produced. Styles concluded that seismic and infrasound noise was produced by wind turbines, the seismic noise is at a primary frequency related to the frequency at which the turbine blades pass in front of the support post of the turbine, this frequency covers a broad range from about 0.5 Hz to about 10 Hz, and this noise can be detected at distances greater than 10 km from the turbines. Styles found that at Eskdalemuir, wind was the predominant factor in noise and determined the median root-
61

mean-square vertical displacement of a seismometer on windy days is 0.336 nanometers thereby establishing the level of anticipated background noise.
UK Government Policy Concerning Wind Farm Development near Eskdalemuir
The Styles study also developed a method to estimate the seismic noise created by wind farms. The study made recommendations concerning the amount of additional noise that the Eskdalemuir array could tolerate, what impact that would have on its operational performance, and how best to constrain wind farm development near it to maximize wind energy output while remaining under this tolerable additional noise amount.
The study assumed that the maximum additional noise “budget” that could be accepted from wind farm development near the array to be 0.336 nanometers. This means a potential doubling of the background noise level and with the model of noise and detectability they present, the threshold of detection would rise from 100 tons in Kazakhstan (distance 5250 km) to about 160 tons.
As a result of this research the UK Ministry of Defence has prohibited the construction of wind turbines within 10 km of Eskdalemuir. Turbine development between 10 and 50 km is constrained to not exceed the cumulative noise “budget” outlined above. There are no restrictions on wind farm development outside of 50 km.
United States Monitoring Activities
In contrast to the single International Monitoring System (IMS) auxiliary monitoring station in the United Kingdom, there are 4 primary IMS seismic stations and 10 auxiliary IMS seismic stations located in the United States. In addition to the IMS stations, there are several stations of the U.S. Atomic Energy Detection System (USAEDS) located in the United States. The USAEDS stations provide data for the U.S. nuclear explosion monitoring effort.
Recommended U.S. Approach
The methodology used by Styles in measuring the noise spectrum of wind turbines and assessing their effect on array sensitivity is comprehensive and based on sound scientific principles.
The United States should adopt a similar methodology to assess the impact of wind farms on U.S. monitoring activities and to develop objective criteria for evaluating wind farm development activities near their location. Since seismic background noise varies from site to site, site-unique measurements are needed for U.S. sites. A decision about what level of additional noise is acceptable also needs to be made. In addition, the measurements of seismic noise generated by wind turbines that Styles made must be updated to reflect the increased size of SOA wind turbines. This recommended approach should undergo a peer review within the seismic monitoring community to ensure all concerns and possible alternative courses of action are robustly examined.
62


![Antibiotics bugs- us1 [autosaved]](https://static.documents.pub/doc/80x56/588281a11a28ab24788b6901/antibiotics-bugs-us1-autosaved.jpg)


