25
The Effectiveness of a Model for Addressing School-Related Gender-Based Violence (SRGBV) in South Africa: An Evaluation of the ‘Zero Tolerance School Alliance’
i
The Effectiveness of a Model
for Addressing School-Related
Gender-Based Violence (SRGBV)
in South Africa:
An Evaluation of the ‘Zero Tolerance School Alliance’

ii
The Thohoyandou Victim Empowerment Programme (TVEP) focuses on turning victims into survivors
and provides support, prevention, and empowerment services in five thematic areas: HIV and AIDS,
child abuse, domestic violence, sexual assault, and LGBTI/vulnerable minorities. TVEP provides
counseling, shelter, and one-on-one pyscho-social and legal support through its Trauma Centers,
Help Desks, and Access to Justice sectors. TVEP firmly believes that there is “no excuse for abuse”
or discrimination, and works every day in communities to spread that message and empower
communities to change from within.
TVEP
P.O. Box 754
Sibasa, 0970
South Africa
www.tvep.org.za
Suggested citation: Fiona Nicholson and Tapiwa Mukaro. 2018. The Effectiveness of a Model
for Addressing School-Related Gender-Based Violence in South Africa: An Evaluation of the ‘Zero
Tolerance School Alliance.’ TVEP: Limpopo Province, South Africa.

iii
TABLE OF CONTENTS
List of Abbreviations ........................................................................................................................................... iv
Executive Summary ............................................................................................................................................. v
Background........................................................................................................................................................... 1
Introduction ....................................................................................................................................................... 1
The Zero Tolerance Village Alliance Model ................................................................................................... 1
Project Goal ....................................................................................................................................................... 2
Intervention Description: The Zero Tolerance School Alliance .................................................................. 2
Methodology ......................................................................................................................................................... 3
Study design and setting ................................................................................................................................. 3
Data Collection .................................................................................................................................................. 3
Data Management and Analysis .................................................................................................................... 4
Ethical Considerations ..................................................................................................................................... 4
Background Characteristics of Students ...................................................................................................... 4
Results ................................................................................................................................................................... 6
Students’ Perceptions of Safety in and around School .............................................................................. 6
Students’ Experience of SRGBV ..................................................................................................................... 7
Students’ Perpetration of SRGBV ............................................................................................................... 10
Students’ Reporting of SRGBV (Help-Seeking) ......................................................................................... 11
Awareness of Children’s Rights ................................................................................................................... 12
Summary of Key Messages ............................................................................................................................. 15
Conclusion ......................................................................................................................................................... 16
Appendix ............................................................................................................................................................ 17
iv
LIST OF ABBREVIATIONS
CBO Community-based Organization
CLO Community Liaison Officer
DiD Difference-In-Differences
FGD Focus Group Discussion
IPV Intimate Partner Violence
SGBV Sexual and Gender-Based Violence
SRGBV School-related Gender-based Violence
TVEP Thohoyandou Victim Empowerment Programme
ZTSA Zero Tolerance School Alliance
ZTVA Zero Tolerance Village Alliance
v
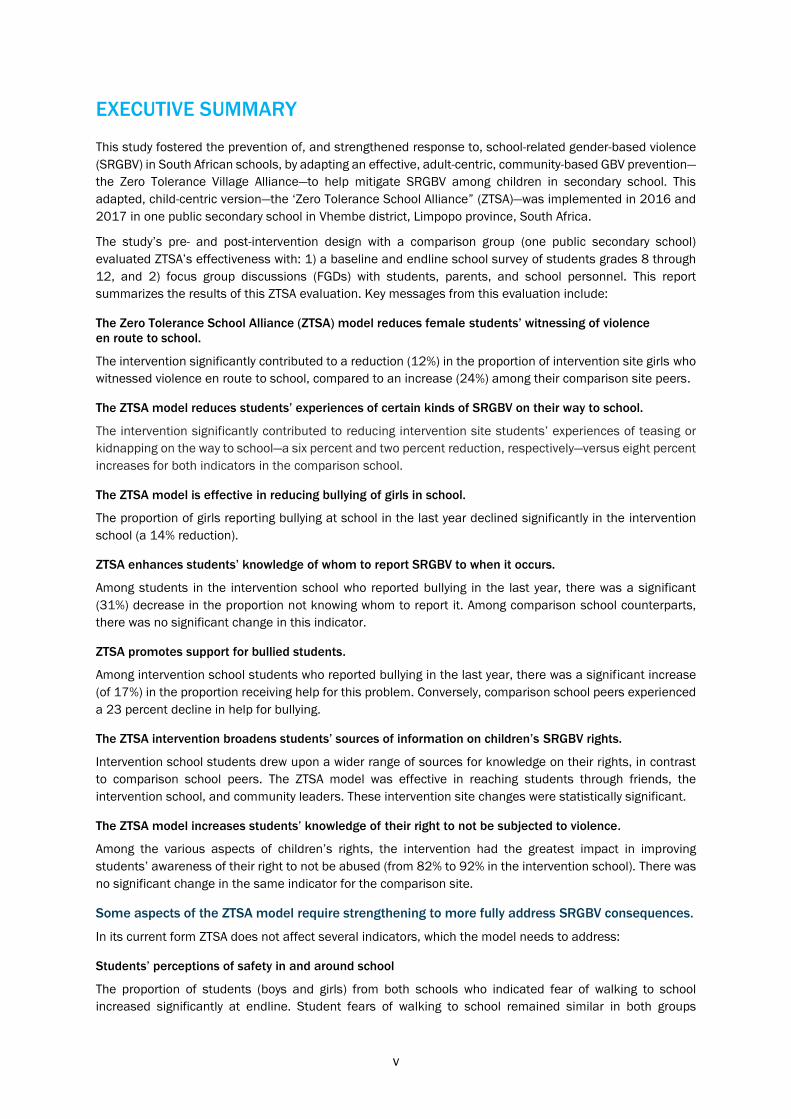
EXECUTIVE SUMMARY
This study fostered the prevention of, and strengthened response to, school-related gender-based violence
(SRGBV) in South African schools, by adapting an effective, adult-centric, community-based GBV prevention—
the Zero Tolerance Village Alliance—to help mitigate SRGBV among children in secondary school. This
adapted, child-centric version—the ‘Zero Tolerance School Alliance” (ZTSA)—was implemented in 2016 and
2017 in one public secondary school in Vhembe district, Limpopo province, South Africa.
The study’s pre- and post-intervention design with a comparison group (one public secondary school)
evaluated ZTSA’s effectiveness with: 1) a baseline and endline school survey of students grades 8 through
12, and 2) focus group discussions (FGDs) with students, parents, and school personnel. This report
summarizes the results of this ZTSA evaluation. Key messages from this evaluation include:
The Zero Tolerance School Alliance (ZTSA) model reduces female students’ witnessing of violence
en route to school.
The intervention significantly contributed to a reduction (12%) in the proportion of intervention site girls who
witnessed violence en route to school, compared to an increase (24%) among their comparison site peers.
The ZTSA model reduces students’ experiences of certain kinds of SRGBV on their way to school.
The intervention significantly contributed to reducing intervention site students’ experiences of teasing or
kidnapping on the way to school—a six percent and two percent reduction, respectively—versus eight percent
increases for both indicators in the comparison school.
The ZTSA model is effective in reducing bullying of girls in school.
The proportion of girls reporting bullying at school in the last year declined significantly in the intervention
school (a 14% reduction).
ZTSA enhances students’ knowledge of whom to report SRGBV to when it occurs.
Among students in the intervention school who reported bullying in the last year, there was a significant
(31%) decrease in the proportion not knowing whom to report it. Among comparison school counterparts,
there was no significant change in this indicator.
ZTSA promotes support for bullied students.
Among intervention school students who reported bullying in the last year, there was a significant increase
(of 17%) in the proportion receiving help for this problem. Conversely, comparison school peers experienced
a 23 percent decline in help for bullying.
The ZTSA intervention broadens students’ sources of information on children’s SRGBV rights.
Intervention school students drew upon a wider range of sources for knowledge on their rights, in contrast
to comparison school peers. The ZTSA model was effective in reaching students through friends, the
intervention school, and community leaders. These intervention site changes were statistically significant.
The ZTSA model increases students’ knowledge of their right to not be subjected to violence.
Among the various aspects of children’s rights, the intervention had the greatest impact in improving
students’ awareness of their right to not be abused (from 82% to 92% in the intervention school). There was
no significant change in the same indicator for the comparison site.
Some aspects of the ZTSA model require strengthening to more fully address SRGBV consequences.
In its current form ZTSA does not affect several indicators, which the model needs to address:
Students’ perceptions of safety in and around school
The proportion of students (boys and girls) from both schools who indicated fear of walking to school
increased significantly at endline. Student fears of walking to school remained similar in both groups

vi
between baseline and endline, with no statistically significant changes in the proportion of students who feel
“very or somewhat safe” at school.
Students’ experience of SRGBV in and around school
While the intervention significantly contributed to reducing experience of certain aspects of violence (such
as being teased or kidnapped), it did not lead to reductions in other forms of violence, such as being
attacked, bullied, or unwanted touching. ZTSA did not lead to a reduction in the proportion of intervention
school boys (as opposed to girls) experiencing bullying in school, nor in the proportion of intervention school
boys and girls alike who experienced unwanted sexual touching at school.
Conclusion
The Zero Tolerance School Alliance is a promising intervention engendering prevention of certain aspects of
SRGBV in as little as a year. Along with several encouraging findings, this study reveals remaining gaps and
areas that require strengthening if SRGBV is to be more comprehensively and effectively addressed.
The study results suggest that a more balanced focus on both boys and girls (rather than girls, primarily) will
help produce equally positive results for boys. Findings also indicate gender differences in the experience
and reporting of violence. These differences should be taken into account for targeted approaches.
The gaps revealed by this study also point to a need for integrating new, targeted components into the overall
intervention model to address areas in which the intervention produced no change.
Findings from this study are currently being used by the Thohoyandou Victim Empowerment Programme to
further refine ZTSA.

1
BACKGROUND
Introduction
School-related gender-based violence (SRGBV) includes “acts of sexual, physical or psychological violence
inflicted on children in and around schools because of stereotypes and roles or norms attributed to or
expected of them because of their sex or gendered identity. It also refers to the differences between girls’
and boys’ experience of and vulnerabilities to violence.”1
An estimated one in five cases (21%) of sexual assaults in South Africa occur within school contexts, with
sexual abuse report rates higher for Limpopo than other provinces.2 Findings from South Africa’s 2005
National Youth Victimisation Survey show that rural children are most likely to report sexual assault at school
(Leoschut and Burton 2006). An earlier study—the first National South African Youth Behavior Survey—
indicated that about one third of students (32%) felt unsafe at school, and that a considerable proportion of
SRGBV perpetrators are fellow students.3
Although corporal punishment in educational institutions is prohibited by the South African Schools Act (84,
of 1996), over half of student respondents in a national survey reported corporal punishment at school in
South Africa.4 The same study notes that physical and non-physical bullying are prevalent in South African
schools. This study concludes that the issue of violence against children in South Africa requires urgent and
serious attention, stating that while the policy and legislative environments are encouraging, a key challenge
is effective implementation not only of policy and legislation, but programs that can help address the issue
of violence children’s lives.
Given school’s significance in children’s lives, and the evidence that violence often features in children’s
lives while at school, our study seeks to evaluate the effectiveness of an intervention designed to address
SRGBV in South Africa. This intervention is adapted from an adult-centric intervention—a community-based
prevention model, the Zero Tolerance Village Alliance, designed and pioneered by the Thohoyandou Victim
Empowerment Programme in South Africa (TVEP).
The Zero Tolerance Village Alliance Model
TVEP developed and tested its Zero Tolerance Village Alliance (ZTVA) approach, a community GBV prevention
and response model. The model articulates communities’ needs for achievement, and provides a series of
criteria that communities must meet for public awards and induction to an alliance of communities and
villages that have similarly met these criteria.
An evaluation of this intervention in Limpopo province demonstrated a statistically significant increase in the
proportion of men and women with progressive beliefs about women’s sexual autonomy, as well as a
statistically significant increase in the proportion of men and women who knew where to obtain GBV
services.5 The ZTVA model has also been shown to be an effective means of fostering SGBV prevention in
emergency settings. An evaluation of this intervention in Ugandan refugee settings showed that the model
was effective in changing negative gender attitudes and GBV beliefs related, reducing physical intimate
partner violence (IPV)—for men and women, sexual IPV (for men), non-partner physical violence (for men and
women), and non-partner sexual violence (for women), and increasing awareness of SGBV interventions.6
1 Greene, M., Robles, O., Stout, K. and Suvilaakso, T. 2013. A girl’s right to learn without fear: working to end gender-based violence
at school. Woking: Plan International. 2 DSD, DWCPD and UNICEF. 2012. Violence Against Children in South Africa. Pretoria: Department of Social
Development/Department of Women, Children and People with Disabilities/UNICEF. 3 Medical Research Center. 2003. The First National South African Youth Behavior Survey. 4 DSD, DWCPD and UNICEF. 2012. Violence Against Children in South Africa. Pretoria: Department of Social
Development/Department of Women, Children and People with Disabilities/UNICEF. 5 Nicholson, F.and C. Carty. 2015. "The 'Zero Tolerance Village Alliance': A promising intervention for addressing sexual and gender-
based violence in rural communities." BMC Proceedings 9(4): A4. 6 Undie et al., 2016. Effectiveness of a Community-Based SGBV Prevention Model in Emergency Settings in Uganda: Testing the
‘Zero Tolerance Village Alliance’ Intervention.” Nairobi, Kenya: Population Council.

2
Given the positive effects of the ZTVA intervention, TVEP’s work has been replicated numerous times in
various villages and provinces in South Africa and beyond. Direct engagement with children through this
model has been limited, however. The Zero Tolerance School Alliance (ZTSA)—an adapted ZTVA intervention
tailored to the needs of children and for the realities of SRGBV—is designed to fill this gap.
Project goal
The overall goal of this project was to foster SRGBV prevention, and strengthen the response to it, in South
Africa. The project specifically aimed to: 1) adapt tested, adult-centric responses to the needs of children
and 2) assess the combined effects of these responses in schools.
The study hypothesized that children in school contexts who are exposed to the Zero Tolerance School
Alliance intervention would:
Be more likely to be aware of their rights than before
Have greater self-efficacy for responding to SRGBV (e.g. by reporting SRGBV incidents) than before
Be more likely to feel safe in and around school than before
Be less likely to experience SRGBV than before, and
Be less likely to perpetrate SRGBV than before.
Intervention description—the Zero Tolerance School Alliance
The intervention was implemented for 12 months, from March 2016 to March 2017, and involved an
intensive community mobilization effort with several inter-connected elements including:
Community dialogues
Stakeholder forum
Development of community maps
Training
Promotion of adherence to Zero Tolerance School Alliance criteria, and
Pledge ceremony and award of ZTSA membership
Community Dialogues: Participatory dialogues with various stakeholders of the intervention school
introduced the project in detail and promoted its sponsorship and investment. Separate dialogues were held
for students, school personnel, parents, and the wider community.
School Stakeholder Forum: A stakeholder forum included various sectors (parents, education, social work,
health, police) operating around the intervention school, and members were identified as individuals of high
moral standing and accountable to those in the study area. In addition to approving, facilitating, and
monitoring ZTSA activities, members of the stakeholder forum were charged with appointing a Community
Liaison Officer (CLO) and ensuring ZTSA membership criteria. The stakeholder forum was encouraged to
become invested in the ZTSA project (including the project’s problems and solutions). TVEP provided
technical assistance throughout the process.
Development of Community Maps: The mapping exercise helped identify all potential “targets” for
children’s school empowerment, enhanced service provision for child survivors, and SRGBV messaging. The
mapping exercise also revealed potential risks, such as shebeens (informal drinking places), bottle stores,
main roads, and truck stops.
Training: TVEP informed various groups including stakeholder forum members and the CLO on good
governance procedures and policies, rights and responsibilities, accountability monitoring, and SRGBV
issues. To further encourage behavioral change, participant capacities were built to address any violation of
their own rights, and hold relevant service providers accountable. Stakeholder forum members were trained
as ‘Trainers of Trainers’ who would, in turn, train other community members.

3
Induction into Zero Tolerance School Alliance Criteria: Induction into the Alliance was contingent upon the
school and surrounding community fulfilling criteria by the end of the intervention period. (The full list of
criteria may be found in the Appendix.)
Pledge Ceremony and Award of ZTSA Membership: TVEP sponsored a public pledge ceremony for the
intervention school upon fulfilling all criteria. At the ceremony, boys in the school and men of the village
were invited to the school for a public pledge (in the presence of a Magistrate) to proactively address the
eradication of GBV in their school and village. Those who took the pledge were asked to sign a ‘Roll of Honor,’
to be stored in a secure place available to the public, the school, and wider village. They were issued a “TVEP
Badge of Honor” to identify them as men and boys who had taken the pledge. Community members who
contributed to ‘Breaking the Silence’ by reporting abuse they had experienced (during the intervention
period) were also recognized at the ceremony, and awarded Badges of Courage. At the ceremony,
participants were informed that men and boys breaking the pledge would have their names removed from
the Roll of Honor.
The ceremony culminated in the unveiling of a large billboard at the inducted school, declaring their “Zero
Tolerance” status. A small allowance was made available for the school and its surrounding community to
foster a sense of community, for road signs or a community notice board, among other options.
METHODOLOGY
Study design and setting
The study’s pre- and post-intervention design with a comparison group assessed the intervention’s
effectiveness. Two public secondary schools (one intervention, one comparison) in Vhembe district, Limpopo
province, were purposively selected due to their locations in villages where TVEP’s Zero Tolerance Village
Alliance intervention was not previously implemented; each had at least 100 students in eighth and ninth
grades (combined), with school principals willing to have their school participate.
Data collection
Data collection involved school surveys with students at baseline and endline, and focus group discussions
(FGDs) with students, parents, and school personnel.
School Surveys
School surveys with students were at baseline (in February 2016) and endline (March 2017). At baseline, all
students in grades 8, 9, and 10 in both schools were invited to participate in an anonymous, self-
administered survey. This process was repeated in both schools at endline with the same cohort of students
(including students repeating the year, and new students who had enrolled after the baseline survey). By
endline, the school calendar had changed in the study sites, resulting in secondary students advancing two
grades and, thus, at endline the cohort of participating students comprised grades 10, 11, and 12.
A total of 179 students from the intervention school and 177 from the comparison school participated in the
baseline survey. At endline, a total of 198 participants from the intervention school and 222 from the
comparison school took part in the survey. Students older than 19 years were omitted from analysis, given
the study’s focus on SRGBV as a form of violence against adolescents. (The study used the World Health
Organization’s definition of adolescence as being the period between 10 and 19 years of age.)
The surveys captured information on students’ SRGBV knowledge, attitudes, and practices before and after
the interventions.

4
Focus Group Discussions
All FGDs were during the endline period and facilitated by a semi-structured discussion guide, to help elicit
participants’ perceptions about what had occurred in the study environment (or what had not), or what they
had or had not observed over the life of the intervention.
A total of six audio-recorded FGDs were held with students, parents, teachers, and support staff from the
intervention school only. Three FGDs were held with students—two single-sex and one mixed-sex. The other
three FGDs were with parents, teachers, and support staff, as separate groups.
Data management and analysis
The quantitative data from the self-administered interviews were entered in Excel and analyzed using STATA
and SPSS. Analysis entailed simple frequencies, percentages, and cross-tabulations. Significance tests of
proportions were conducted at 95 percent confidence level to determine whether any differences between
baseline and endline indicators were statistically significant. A comparison of baseline and endline results
between intervention and comparison schools was made to determine the effectiveness of the intervention.
A difference-in-differences (DiD) estimation (referring to the difference in changes over time between
intervention and comparison sites) compared changes in proportions over time in the intervention and
comparison sites, and then estimated bivariate logit models with interactions between the indicators for the
sites at baseline and endline. DiD estimations consider the ‘natural dynamics’ that might bring change over
time even without an intervention, so that additional changes in the intervention site compared to the
comparison site could be attributed to the effect of the intervention.
All audio-recorded FGDs were transcribed in Microsoft Word. Content analysis techniques were used to
examine the transcripts, and identified common themes from participants’ responses, based on the areas
of inquiry in the discussion guides.
Ethical considerations
The study received ethical and research clearance from the Research Ethics Committee of the University of
Venda in South Africa. Ethical approval was also obtained from the Population Council’s Institutional Review
Board.
Prior to the administration of the school surveys and FGDs, students were given a copy of a parental consent
form to take home for their parents’ or guardians’ review and signature. Only students who received such
consent and provided their own assent to participate in the surveys and FGDs were eligible for participation
in those aspects of the study. Given that the school surveys (unlike the FGDs) focused on individual SRGBV
experiences, a TVEP trauma counselor was part of the data collection team at baseline and endline, for on-
site trauma counseling to any survey participant in need of it. Each survey participant was also given a TVEP
brochure, outlining TVEP’s services for children with phone numbers and physical addresses of TVEP’s
trauma centers.
Student background characteristics
Table 1 (following page) presents the distribution of students interviewed at the intervention and comparison
schools, by background characteristics. The proportion of male students interviewed at baseline was slightly
more than females at both schools. At endline, however, the proportion of male and female students was
similar at the intervention school, with more females at the comparison school. The majority of participating
students at both schools were in grade 9 at baseline and grade 10 at endline, which was expected given
that just over a year elapsed between baseline and endline data collections. Most students were between
the ages of 15 and 17. The majority of intervention group students walked to school with others, at both
baseline and endline, while most students in the comparison group walked to school alone, at endline.

5
Table 1: Background characteristics of study population at baseline and endline
Baseline Endline
Intervention
(N=179)
Comparison
(N=177) p-value
Intervention
(N=165)
Comparison
(N=143) p-value
Sex
Male 59.2 55.1
0.463
50.3 43.4
0.223 Female 40.8 44.4 49.7 56.6
Missing 0.0 0.6 0.0 0.0
Grade
8th 31.3 28.9
0.905
- -
<0.001
9th 41.9 44.5 - -
10th 25.7 24.1 54.5 44.8
11th - - 37.6 29.4
12th - - 7.3 25.9
Not recorded 1.1 2.5 0.6 0.0
Age
12 years old 1.7 0.0
0.216
0.0 0.0
0.534
13 years old 15.6 7.3 0.0 1.4
14 years old 10.6 16.9 2.4 1.4
15 years old 28.5 30.3 21.8 24.5
16 years old 20.1 14.6 18.2 14.7
17 years old 12.8 14.0 23.0 17.5
18 years old 10.1 11.8 21.8 18.9
19 years old 0.0 0.0 12.7 21.7
Not recorded 0.6 5.1 0.0 0.0
How student travels
to school
Walk to school on my
own 16.2 38.4
<0.001
29.3 55.0
<0.001 Walk to school
with other people 51.4 45.2 39.9 26.6
In a vehicle (bus, car) 27.4 11.3 29.3 16.7
Not recorded 5.0 5.1 1.5 1.8

6
RESULTS
Student perceptions of safety in and around school
Students’ perceptions of safety on the way to and from school were assessed by asking students to indicate
if they ever feared walking to school, regardless of how they traveled to school. The proportion of students
from both schools indicating fear of walking to school significantly increased at endline. The increase
occurred among both boys and girls (Table 2). The change at the intervention school was not statistically
different from the comparison school, however, according to DiD estimates. As the ZTSA intervention was
designed to enhance students’ feelings of safety, these results suggest that the model did not have its
desired effect; certain incidents could have occurred within the community to cause the increase in the
proportion of students who reported fear of walking to school.
Table 2: Proportion of students scared of walking to school
Intervention Comparison DiD
Baseline Endline % ∆ Baseline Endline % ∆
% (N) % (N) % (N) % (N)
Boys 34.0 (106) 45.8 (83)* 11.8 36.7 (98) 50.0 (62)* 13.3 0.034
Girls 35.6 (73) 51.2 (82)* 15.6 32.9 (79) 59.3 (81)** 26.4 -0.115
All 34.6 (179) 48.5 (165)** 13.9 35.0 (177) 55.2 (143)*** 20.2 -0.041
Note:*p<0.05; **p<0.01; ***p<001
DiD: Difference-in-Difference estimator
Students from both schools who reported fear of walking to school were further asked to indicate what they
were afraid of, and their fears were similar (Table 3). At endline, the primary fears remained the same for
students who walked to school and who reported fear, namely: being attacked, bullied, kidnapped, or hit by
a car, motorcycle, or bicycle while walking to school. Among those scared of walking to school, there was
also a significant increase (in both schools) at endline in the proportion indicating fear of being intimately
touched against their wishes. The difference in changes in the intervention and comparison schools was not
statistically significant, as shown by DiD estimates, suggesting that underlying factors in the environments
of both schools could have contributed to increased fear, and were not captured by the study.
Table 3: Distribution of students by fears experienced during daily walks to school
Intervention Comparison
DiD Fears reported
Baseline
(N=62)
Endline
(N=79) % ∆
Baseline
(N=69)
Endline
(N=79) % ∆
I am afraid of…
…being attacked 32.2 58.2** 26.0 41.3 55.1* 13.8 0.101
…being bullied 25.4 29.1 3.7 17.5 33.3 15.8 -0.124
…being teased 15.3 11.4 -3.9 6.3 5.1 -1.2 -0.025
…witchcraft 6.8 6.3 -0.5 6.3 7.7 1.4 -0.020
...getting lost 10.2 8.9 -1.3 6.3 1.3 -5.0 0.024
…being kidnapped 35.6 57.0* 21.4 20.6 34.6* 14.0 0.045
…getting hit by a car/motorcycle/
bicycle 8.5 25.3* 16.8 3.2 15.4* 12.2 0.034
…dogs 13.6 16.5 2.9 3.2 19.2** 16.0 -0.014
…being touched, private body part 8.5 22.8* 14.3 4.8 14.1* 9.3 -0.064
Note:*p<0.05; **p<0.01
At endline, there was a significant increase in the proportion of students in both schools who reported fear
of certain spaces at their schools (Table 4). The proportion of boys in the intervention school reporting fear
of certain spaces at school significantly increased at endline. There was no significant increase, however, at
endline in the proportion of girls reporting the same. At the comparison school, the proportions of both girls
and boys reporting fear of certain spaces at school increased significantly at endline. Overall, by endline, the
proportion of students who felt ‘very or somewhat safe’ at school reduced significantly at both schools,

7
among both boys and girls. DiD estimates demonstrate, however, that the difference in changes observed
in intervention and comparison schools was not statistically significant.
As mentioned, it is plausible that certain incidents may have occurred within the communities to inspire fear
in students—and for students, these fears spilled over from the wider community into the schools. The ZTSA
model features intensive engagement with girls in particular, through clubs and female school activists (see
Appendix), which may explain girls’ lower likelihood of being frightened of school spaces.
Table 4: Distribution of students by perceptions of safety at current school
Intervention Comparison DiD
Baseline Endline % ∆ Baseline Endline % ∆
% (N) % (N) % (N) % (N)
Are there spaces that makes the student feel afraid at current school?
Boys 58.3 (106) 74.7 (83)** 20.9 59.2 (98) 72.6(62)* 13.4 0.039
Girls 56.2 (73) 63.4 (82) 7.2 67.1 (79) 86.4(81)** 19.3 -0.085
All 54.7 (179) 61.9 (165)** 14.4 62.4 (177) 80.4(143)*** 18.0 -0.031
Feels very or somewhat safe at current school
Boys 69.8 (106) 30.1 (83)*** -39.7 62.3 (98) 16.1(62)*** -46.2 0.004
Girls 72.6 (73) 40.2 (82)*** -32.4 45.5 (79) 13.6(81)*** -31.9 -0.043
All 70.9 (179) 35.2 (165)*** -35.7 54.5 (177) 14.7(143)*** -39.8 -0.007
Note:*p<0.05; **p<0.01; ***p<001
Students were asked about the specific school spaces they fear (Table 5). Areas mentioned did not vary
between baseline and endline, nor by intervention and comparison group. In most cases, school toilets,
areas just outside school gates, and staff rooms were reported as inspiring fear. At endline, the proportion
of students at both schools who reported a ‘classroom block of students in higher grades’ diminished as a
places that scared them; the changes were not statistically significant, however. The increase in the
proportion of students reporting fear of school toilet areas was significantly higher among comparison school
students, according to DiD estimates; this could indicate greater feelings of safety around toilet areas at the
intervention school. DiD estimates also show that the decreased proportion of comparison school students
reporting fear of the area right outside the school gate was significantly different from the increased
proportion of intervention school students reporting such fear, suggesting other factors outside school
compounds that contribute to these feelings not captured by the study.
Table 5: School spaces that make students feel afraid
Intervention Comparison
Baseline
(N=98)
Endline
(N=114) % ∆
Baseline
(N=111)
Endline
(N=115) % ∆ DiD
Sports field or playground 0.0 0.9 0.9 7.5 4.3 -3.2 0.037
School toilets 53.1 56.1 3.0 70.1 89.6 19.5 -0.179**
Right outside school gate 15.6 19.3 3.7 19.6 9.6 -10.0 0.133*
Staff room 37.5 42.1 4.6 11.2 13.0 1.8 0.031
Classroom/classroom block 3.1 1.8 -1.3 8.4 2.6 -5.8 0.033
Classroom block of students
in higher grades 13.5 1.8 -11.7 9.3 0.0 -9.3 0.034
Other school buildings 5.2 4.4 -0.8 7.5 3.8 -3.7 0.048
Note:*p<0.05; **p<0.01
Student Experiences of SRGBV
In both schools, there was a slight increase between baseline and endline in the proportion of students
scared of walking to school who reported being attacked by, or scared of, dogs en route in the past year
(Table 6, following page). The difference was not statistically significant, however. While a larger proportion
of intervention school students who were scared of walking to school reported bullying at endline (37%) than
from the comparison group (32%), the changes were also not significant.

8
DiD estimates show statistically significant differences in changes in student proportions who were scared
of walking to school from both schools reporting teasing, getting lost, or being kidnapped in the last year.
The proportions of intervention school students scared of walking to school who reported being teased or
kidnapped reduced, while students reporting those experiences at the comparison school increased. In
contrast, the proportion of students reporting getting lost increased at the intervention site, but declined at
the comparison school. These findings indicate that the intervention significantly contributed to reductions
in experiences of certain aspects of violence perpetuated by others (such as teasing or kidnapping) among
exposed students, while changes in other indicators (such as getting lost) could have been influenced by
factors not captured by the study.
Table 6: Distribution of students by experience of violence on the way to school
Intervention Comparison
Baseline
(N=62)
Endline
(N=79)
% ∆ Baseline
(N=69)
Endline
(N=79)
% ∆ DiD
Which of these things you are afraid of or have ever happened to you while walking to school
in the last year?
Attacked 22.2 30.2 8.0 32.1 43.9 11.8 -0.120
Bullied 35.6 37.2 1.6 34.0 31.8 -2.2 -0.063
Teased 20.0 14.0 -6.0 7.5 15.2 7.7 -0.139*
Witchcraft attack 6.7 9.3 2.6 11.3 6.1 -5.2 -0.038
Getting lost 2.2 7.0 4.8 7.5 0.0 -7.5 0.079**
Kidnapped 11.1 9.3 -1.8 3.8 12.1 8.3 0.103*
Hit by a car/motorcycle/bicycle 6.7 4.7 -2.0 5.7 7.6 1.9 0.063
Scared by a dog 13.3 20.9 7.6 9.4 15.2 5.8 0.019
Unwanted touching 6.7 7.0 0.3 3.8 4.5 0.7 0.020
Note:*p<0.05; **p<0.01
The majority of students scared of walking to school, from both schools, reported witnessing a violation en
route (Table 7). At endline, the proportion of intervention school students who had witnessed someone being
violated en route reduced, albeit insignificantly. In contrast, the proportion of comparison school students
who had witnessed someone being violated en route increased significantly at endline. Similar trends were
observed among boys and girls alike, at both schools. The reduction in the proportion of girls and all students
who witnessed someone being violated en route was significantly different from the comparison school
increase, which indicate that the intervention significantly contributed to reductions in occurrences of
violence witnessed by female students who were exposed to it, versus those not exposed. Changes among
all students were largely a result of changes among girls, given that the differences in changes among boys
in both schools were not statistically significant.
Table 7: Proportion of students that witnessed someone being violated on the way to school
Intervention Comparison DiD
Baseline Endline % ∆ Baseline Endline % ∆
% (N) % (N) % (N) % (N)
Boys 61.1 (36) 55.3 (38) -5.8 59.5 (42) 74.2 (31) 14.7 -0.110
Girls 61.5 (26) 50.0 (41) -11.5 59.3 (27) 83.3 (48)* 24.0 -0.379**
All 61.3 (62) 52.5 (79) -8.8 59.4 (69) 79.8 (79)** 20.4 -0.245** Note:*p<0.05; **p<0.01
Experience of SRGBV was measured by asking questions about whether, in the past year, students had ever
been bullied—slapped, kicked, beaten, punched, teased, or threatened with harm—or were touched
intimately against their wishes while in school (see Table 8, next page). At endline, there was a significant
decline in the proportion of intervention school students reporting bullying. The proportion of girls who
reported bullying at school in the past year declined at endline at the intervention school, while girls at the
comparison school were significantly more likely to report bullying at school. DiD estimates show that the
reduction in the proportion of girls reporting bullying at the intervention school was significantly different

9
from the increase observed for the same indicator at the comparison school, which further indicates that the
intervention significantly contributed to reductions in bullying among girls exposed to the intervention.
Findings further suggest that changes among all students were largely driven by changes among girls, since
the difference in changes among boys was not statistically significant.
There was no significant change at endline in the proportion of students reporting being touched intimately
against their wishes in the last year. The results were similar for both schools. DiD estimates also show no
statistically significant differences in changes in proportions of students in both schools reporting touching
against their wishes.
Table 8: Distribution of students who reported experiencing SRGBV in their current school
in the last year
Intervention Comparison
DiD Baseline
% (N)
Endline
% (N) % ∆
Baseline
% (N)
Endline
% (N) % ∆
Ever been bullied at school in the last year
Boys 59.4 (106) 51.8 (83) -7.6 67.3 (98) 62.9 (62) -4.4 -0.048
Girls 61.6 (73) 47.6 (82)* -14.0 57.7 (79) 72.8 (81)* 17.1 -0.327***
All 60.3 (179) 49.79 (165)* -10.6 62.1 (177) 68.5 (143) 6.4 -0.185**
Ever experienced unwanted touching of private parts while at school in the past one year
Boys 34.9 (106) 34.9 (83) 0.0 37.8 (98) 51.6 (62) 13.8 0.129
Girls 38.4 (73) 36.6 (82) -1.8 41.8 (79) 72.8 (81) -6.0 0.035
All 36.3 (179) 35.8 (165) -0.5 39.3 (177) 68.5 (143) 3.4 -0.033 Note:*p<0.05; **p<0.01; ***p<001
Qualitative data corroborate these survey findings. In the FGDs with stakeholders at the intervention school,
most participants pointed out that incidents of school bullying reduced after the ZTSA intervention:
“I have noticed that the incidents of bullying have stopped because, before, you would find a
teacher bullying you by mocking you through your family situation, but such things have since
stopped.” FGD, female students
“We have noticed a significant reduction on some behaviors that students had before, such as
fights within school premises. Students used to fight a lot but now they are no longer fighting
because they are aware that this program also involves the police. Knowing that this program
involves police scares them off because they are aware that the law will always side with their
victims.” FGD, Teachers
“Since the arrival of ZTSA we are now able to openly talk about issues. ZTSA also helped our
students gain self-confidence to speak out when they are being abused. Even the cases of bullying
have significantly gone down, even those that took place outside the school gates because
students know that the case can still be reported the following day and ZTSA would definitely take
action against the perpetrator.” FGD, Parents
While most FGD participants felt that bullying incidents reduced after ZTSA’s introduction, some students—
mainly boys—maintained that some students persistently violated others. They emphasized the need for
deeper engagement with boys, to make the program more effective. Parents underscored the same need:
“Although girls would tell you that there is TVEP and we are going to report you to TVEP, it is just
empty threats and boys have noticed that we are just being threatened and they can never act on
it. So they continue to touch girls inappropriately and then apologize. However, we all know that
when boys apologize they don’t always mean it. So in my view this problem hasn’t been completely
eliminated.” Male student, FGD, mixed-sex
students
“This behavior cannot be completely eliminated because what I have noticed is that others
continue to touch each other. This means this program should continue throughout this year,
including boys as well.” Male student, FGD, mixed-sex
students
10
“Lack of engagement with boys. Things that I can say didn’t go according to plan [under ZTSA] is
that when the people from TVEP first arrived and started a girls’ club, they should have also started
a boys’ club as well, just because boys are lagging behind. This becomes a challenge because boys
also need to learn about these things.” FGD, Parents
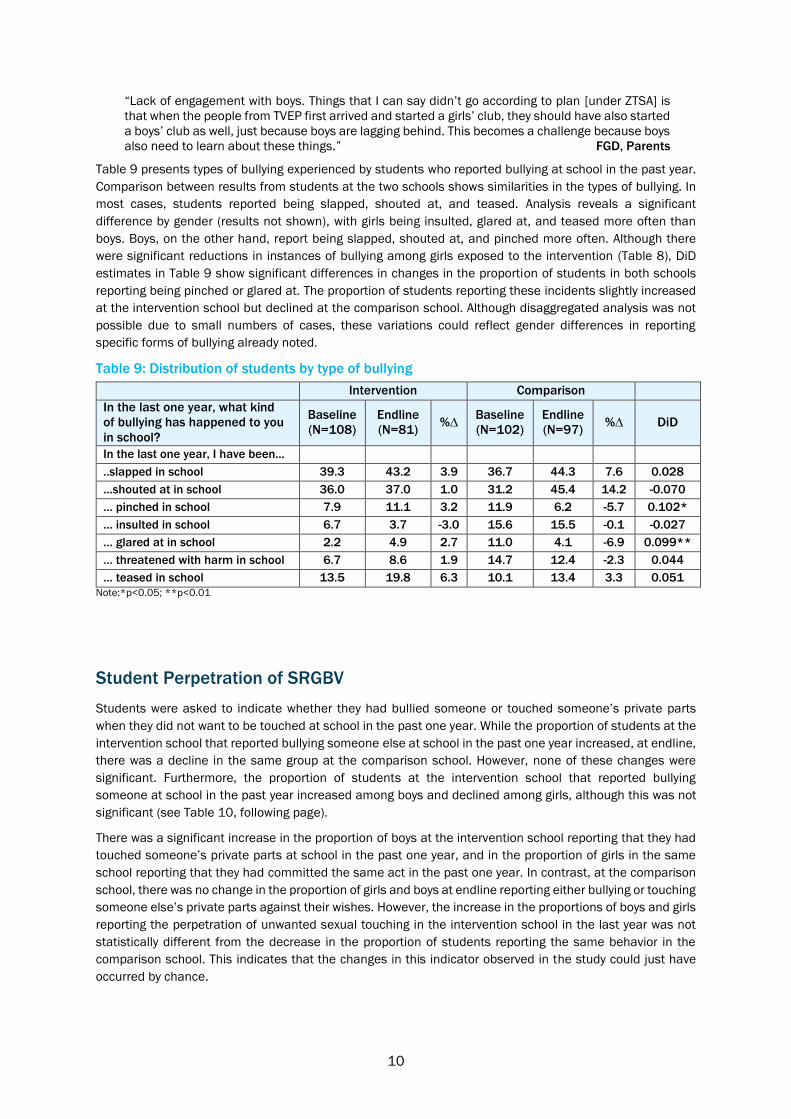
Table 9 presents types of bullying experienced by students who reported bullying at school in the past year.
Comparison between results from students at the two schools shows similarities in the types of bullying. In
most cases, students reported being slapped, shouted at, and teased. Analysis reveals a significant
difference by gender (results not shown), with girls being insulted, glared at, and teased more often than
boys. Boys, on the other hand, report being slapped, shouted at, and pinched more often. Although there
were significant reductions in instances of bullying among girls exposed to the intervention (Table 8), DiD
estimates in Table 9 show significant differences in changes in the proportion of students in both schools
reporting being pinched or glared at. The proportion of students reporting these incidents slightly increased
at the intervention school but declined at the comparison school. Although disaggregated analysis was not
possible due to small numbers of cases, these variations could reflect gender differences in reporting
specific forms of bullying already noted.
Table 9: Distribution of students by type of bullying
Intervention Comparison
In the last one year, what kind
of bullying has happened to you
in school?
Baseline
(N=108)
Endline
(N=81) %∆
Baseline
(N=102)
Endline
(N=97) %∆ DiD
In the last one year, I have been…
..slapped in school 39.3 43.2 3.9 36.7 44.3 7.6 0.028
…shouted at in school 36.0 37.0 1.0 31.2 45.4 14.2 -0.070
… pinched in school 7.9 11.1 3.2 11.9 6.2 -5.7 0.102*
… insulted in school 6.7 3.7 -3.0 15.6 15.5 -0.1 -0.027
… glared at in school 2.2 4.9 2.7 11.0 4.1 -6.9 0.099**
… threatened with harm in school 6.7 8.6 1.9 14.7 12.4 -2.3 0.044
… teased in school 13.5 19.8 6.3 10.1 13.4 3.3 0.051
Note:*p<0.05; **p<0.01
Student Perpetration of SRGBV
Students were asked to indicate whether they had bullied someone or touched someone’s private parts
when they did not want to be touched at school in the past one year. While the proportion of students at the
intervention school that reported bullying someone else at school in the past one year increased, at endline,
there was a decline in the same group at the comparison school. However, none of these changes were
significant. Furthermore, the proportion of students at the intervention school that reported bullying
someone at school in the past year increased among boys and declined among girls, although this was not
significant (see Table 10, following page).
There was a significant increase in the proportion of boys at the intervention school reporting that they had
touched someone’s private parts at school in the past one year, and in the proportion of girls in the same
school reporting that they had committed the same act in the past one year. In contrast, at the comparison
school, there was no change in the proportion of girls and boys at endline reporting either bullying or touching
someone else’s private parts against their wishes. However, the increase in the proportions of boys and girls
reporting the perpetration of unwanted sexual touching in the intervention school in the last year was not
statistically different from the decrease in the proportion of students reporting the same behavior in the
comparison school. This indicates that the changes in this indicator observed in the study could just have
occurred by chance.

11
Table 10: Distribution of students by SRGBV practices
Intervention Comparison
DiD Baseline
% (N)
Endline
% (N) % ∆
Baseline
% (N)
Endline
% (N) % ∆
Ever bullied someone at school in the last one year
Boys 17.9 (106) 27.7 (83) -2.6 31.6 (98) 29.0(62) -2.6 0.137
Girls 23.3 (73) 20.7 (82) 4.1 29.1 (79) 22.2(81) -6.9 0.040
All 20.1 (179) 24.2 (165) -2.6 30.5 (177) 25.2(143) -5.3 0.104
Ever touched someone’s private parts against their wishes at school in the past one year
Boys 13.2 (106) 24.1 (83)* 10.9 41.8 (98) 38.7 (62) -3.1 0.152
Girls 19.2 (73) 6.1 (82)* -13.1 20.3 (79) 16.0 (81) -4.3 -0.106
All 15.6 (179) 15.2 (165) -0.4 32.0 (177) 25.9 (143) -6.1 0.54
Note:*p<0.05
Student Reporting of SRGBV (Help-Seeking)
Students who reported being bullied or having intimate areas touched against their will in the past year were
asked if they had reported the incident to anyone. Overall, there was no significant change at both schools
in the proportions of students seeking help after bullying, but girls were more likely to report violence than
boys in both sites.
While the proportion of boys in the intervention school reporting bullying increased slightly at endline, the
proportion of girls declined. These changes were not significant. At the comparison school, the proportion of
both girls and boys reporting bullying increased at endline. The changes were also not significant (Table 11).
Results in Table 11 further show a reduction in the proportion of students who sought help after having their
private parts touched against their will in the past one year. The decline was significant at the comparison
school and not at the intervention school. The proportion of students who sought help after being touched
inappropriately reduced significantly among girls at the comparison school. According to the DID estimates,
changes in the proportion of students from intervention and comparison schools who sought help following
unwanted sexual touching at school in the last year were not statistically significant.
Table 11: Distribution of students by help-seeking for SRGBV
Intervention Comparison
DiD Baseline
% (N)
Endline
% (N) % ∆
Baseline
% (N)
Endline
% (N) % ∆
Sought help for bullying experienced at school last year
Boys 28.6 (63) 32.6 (41) 4.0 34.8 (66) 38.5 (39) 3.7 0.006
Girls 46.7 (45) 38.5 (37) -8.2 43.2 (44) 47.5 (58) 4.3 -0.185
All 36.1 (108) 35.4 (78) -0.7 37.8 (110) 43.9 (97) 6.1 -0.083
Sought help for unwanted sexual touching experienced at school last year
Boys 21.6 (37) 17.2 (29) -4.4 29.7 (37) 12.5 (32) -17.2 0.150
Girls 50.0 (28) 40.0 (30) -10.0 45.5 (33) 20.7 (29)* -24.8 0.198
All 33.8 (65) 28.8 (59) -5.0 37.1 (70) 16.4 (61)** -20.7 0.192
Note:*p<0.05; **p<0.01
The proportion of students reporting some aid after reporting SRGBV was higher at the intervention school
at endline (Table 12), having increased, but not significantly, while significantly declining at the comparison
school. The difference in changes at the intervention and comparison schools was statistically significant, as
shown by DiD estimates, indicating that the intervention significantly contributed to promoting support for
bullying among exposed students.
The proportion of students who received some help after reporting inappropriate touching at school declined
for both schools, although their difference was not statistically significant, according to DiD estimates.

12
Table 12: Proportion of students that received some help after reporting SRGBV
Intervention Comparison
DiD Baseline
% (N)
Endline
% (N) % ∆
Baseline
% (N)
Endline
% (N) % ∆
Received some help
after reporting bullying
experienced at school last
year
59.0 (39) 75.9 (28) 16.9 66.7 (42) 44.2 (43)* -22.5 0.353**
Received some help
after reporting unwanted
touch experienced at school
last year
77.3 (22) 70.6 (17) -6.7 73.1 (26) 40.0 (10)* -33.1 -0.228
Note:*p<0.05; **p<0.01
Students who experienced bullying in the last year but who did not report it were asked their reasons for not
doing so (Table 13). Between baseline and endline there was a significant decline in the proportion of
students at the intervention school who indicated not knowing whom they should report it. A significant
proportion of students (38%) did not respond to this question at endline, however. While the proportion of
students who mentioned embarrassment as a reason for not reporting bullying significantly increased at the
intervention site, there was no change in fear of reporting as a reason. At the comparison school there were
no significant changes in any of these indicators.
DiD estimates reveal that the reduction in intervention school students not knowing whom to report bullying
to was significantly greater than its reduction at the comparison school, indicating that the intervention
significantly improved awareness of where to seek help among exposed students. DiD estimates also show
that the increase in the proportion of intervention school students who felt too embarrassed to report bullying
was significantly different from the decrease observed for the same indicator among comparison school
students, indicating that there could be factors contributing to students’ embarrassment not addressed by
the interventions or not captured by the study.
Table 13: Reasons for not reporting SRGBV
Intervention Comparison
Reasons for not reporting
bullying
Baseline
(N=60)
Endline
(N=52) % ∆
Baseline
(N=64)
Endline
(N=54) % ∆ DiD
I did not know whom to report to 45.0 13.5*** -31.5 26.6 16.7 -9.9 -0.216*
I felt that there was no need of
reporting 16.7 17.3 0.6 14.1 20.4 6.3 -0.074
I was afraid to report 25.0 25.0 0.0 37.5 44.4 6.9 -0.015
I was too embarrassed to report 0.0 5.8* 5.8 14.1 7.4 -6.7 0.138*
Note:*p<0.05; ***P<0.01
Awareness of children’s rights
Awareness of their rights (including the right to a safe, violence-free school environment) among students in
both schools was virtually unchanged from baseline to endline, due in part to the high level of awareness of
children’s rights. The majority of students—at least nine out of 10—from intervention and comparison school
sites reported that they had ever heard of the term “children’s rights” (Table 14, next page).
Table 14: Proportion of students aware of children’s rights
Have heard
of ‘children’s
rights’
Intervention Comparison
DiD Baseline
% (N)
Endline
% (N) % ∆
Baseline
% (N)
Endline
% (N) % ∆
Boys 90.6 (106) 91.6 (83) 1.0 90.8 (98) 91.9 (62) 1.1 -0.023
Girls 89.0 (73) 93.9 (82) 4.9 94.9 (79) 95.1 (81) 0.2 0.008
All 90.5 (179) 92.7 (165) 2.2 92.1 (177) 93.7 (143) 1.6 -0.009
13
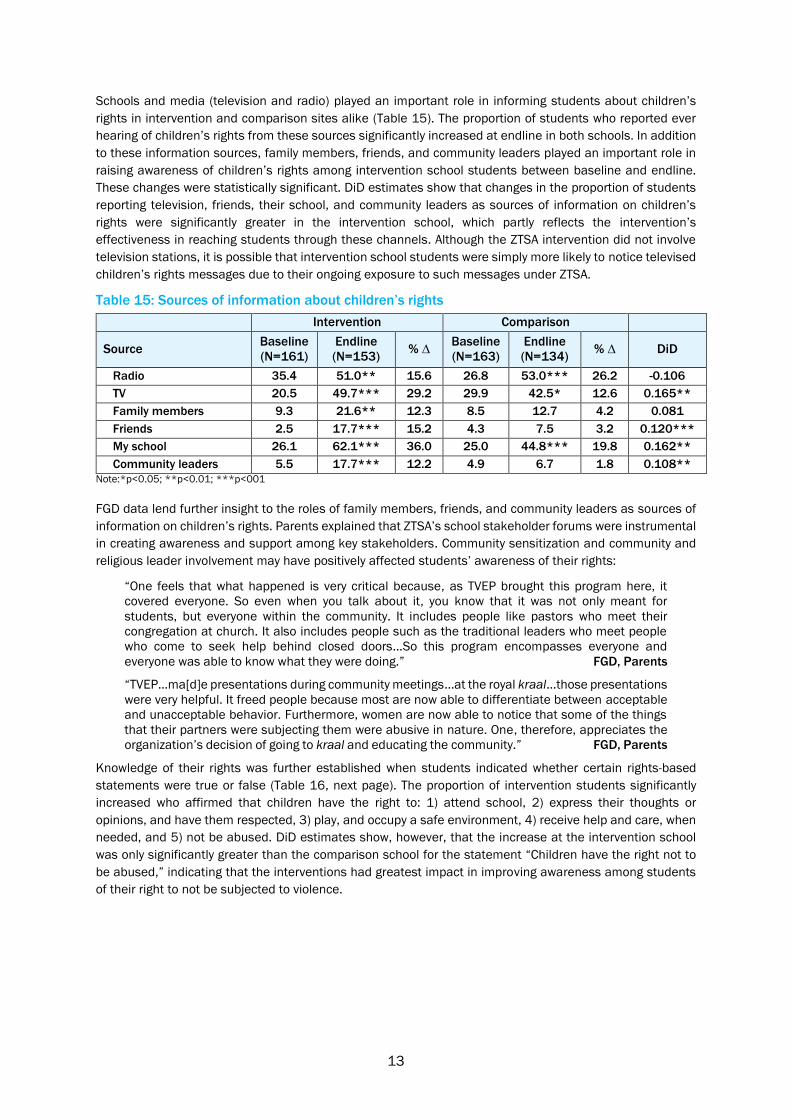
Schools and media (television and radio) played an important role in informing students about children’s
rights in intervention and comparison sites alike (Table 15). The proportion of students who reported ever
hearing of children’s rights from these sources significantly increased at endline in both schools. In addition
to these information sources, family members, friends, and community leaders played an important role in
raising awareness of children’s rights among intervention school students between baseline and endline.
These changes were statistically significant. DiD estimates show that changes in the proportion of students
reporting television, friends, their school, and community leaders as sources of information on children’s
rights were significantly greater in the intervention school, which partly reflects the intervention’s
effectiveness in reaching students through these channels. Although the ZTSA intervention did not involve
television stations, it is possible that intervention school students were simply more likely to notice televised
children’s rights messages due to their ongoing exposure to such messages under ZTSA.
Table 15: Sources of information about children’s rights
Intervention Comparison
Source Baseline
(N=161)
Endline
(N=153) % ∆
Baseline
(N=163)
Endline
(N=134) % ∆ DiD
Radio 35.4 51.0** 15.6 26.8 53.0*** 26.2 -0.106
TV 20.5 49.7*** 29.2 29.9 42.5* 12.6 0.165**
Family members 9.3 21.6** 12.3 8.5 12.7 4.2 0.081
Friends 2.5 17.7*** 15.2 4.3 7.5 3.2 0.120***
My school 26.1 62.1*** 36.0 25.0 44.8*** 19.8 0.162**
Community leaders 5.5 17.7*** 12.2 4.9 6.7 1.8 0.108**
Note:*p<0.05; **p<0.01; ***p<001
FGD data lend further insight to the roles of family members, friends, and community leaders as sources of
information on children’s rights. Parents explained that ZTSA’s school stakeholder forums were instrumental
in creating awareness and support among key stakeholders. Community sensitization and community and
religious leader involvement may have positively affected students’ awareness of their rights:
“One feels that what happened is very critical because, as TVEP brought this program here, it
covered everyone. So even when you talk about it, you know that it was not only meant for
students, but everyone within the community. It includes people like pastors who meet their
congregation at church. It also includes people such as the traditional leaders who meet people
who come to seek help behind closed doors…So this program encompasses everyone and
everyone was able to know what they were doing.” FGD, Parents
“TVEP…ma[d]e presentations during community meetings…at the royal kraal…those presentations
were very helpful. It freed people because most are now able to differentiate between acceptable
and unacceptable behavior. Furthermore, women are now able to notice that some of the things
that their partners were subjecting them were abusive in nature. One, therefore, appreciates the
organization’s decision of going to kraal and educating the community.” FGD, Parents
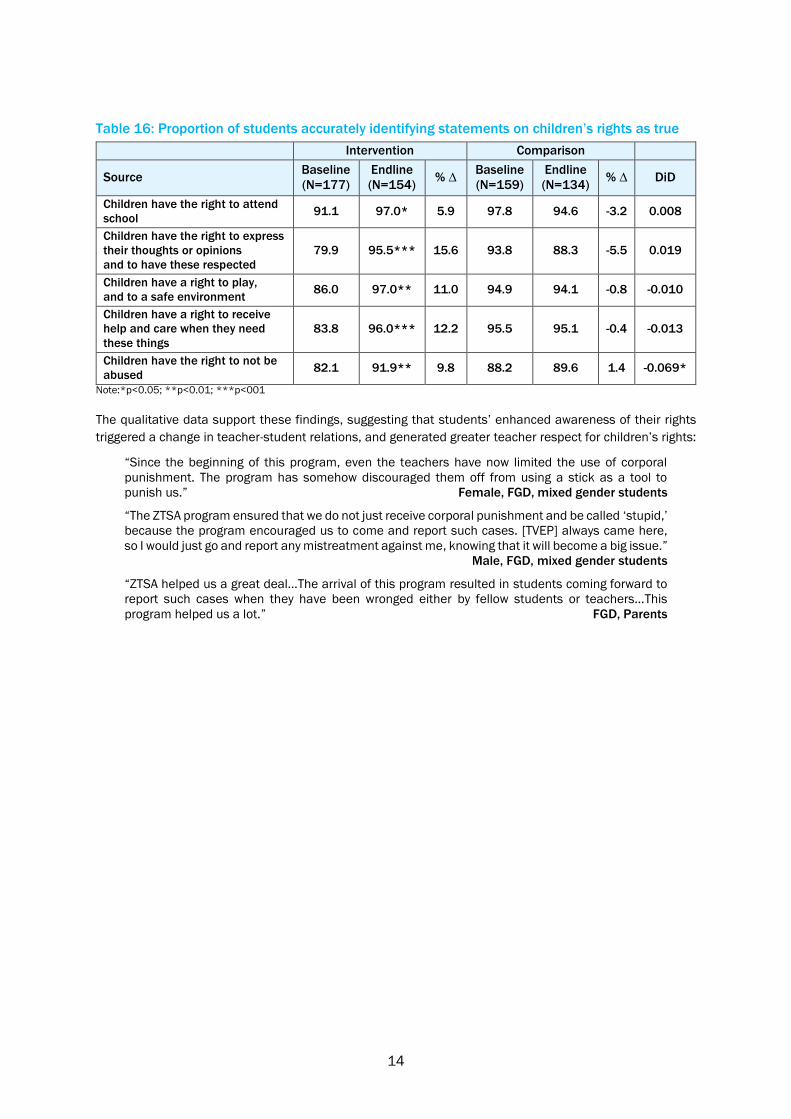
Knowledge of their rights was further established when students indicated whether certain rights-based
statements were true or false (Table 16, next page). The proportion of intervention students significantly
increased who affirmed that children have the right to: 1) attend school, 2) express their thoughts or
opinions, and have them respected, 3) play, and occupy a safe environment, 4) receive help and care, when
needed, and 5) not be abused. DiD estimates show, however, that the increase at the intervention school
was only significantly greater than the comparison school for the statement “Children have the right not to
be abused,” indicating that the interventions had greatest impact in improving awareness among students
of their right to not be subjected to violence.
14
Table 16: Proportion of students accurately identifying statements on children’s rights as true
Intervention Comparison
Source Baseline
(N=177)
Endline
(N=154) % ∆
Baseline
(N=159)
Endline
(N=134) % ∆ DiD
Children have the right to attend
school 91.1 97.0* 5.9 97.8 94.6 -3.2 0.008
Children have the right to express
their thoughts or opinions
and to have these respected
79.9 95.5*** 15.6 93.8 88.3 -5.5 0.019
Children have a right to play,
and to a safe environment 86.0 97.0** 11.0 94.9 94.1 -0.8 -0.010
Children have a right to receive
help and care when they need
these things
83.8 96.0*** 12.2 95.5 95.1 -0.4 -0.013
Children have the right to not be
abused 82.1 91.9** 9.8 88.2 89.6 1.4 -0.069*
Note:*p<0.05; **p<0.01; ***p<001
The qualitative data support these findings, suggesting that students’ enhanced awareness of their rights
triggered a change in teacher-student relations, and generated greater teacher respect for children’s rights:
“Since the beginning of this program, even the teachers have now limited the use of corporal
punishment. The program has somehow discouraged them off from using a stick as a tool to
punish us.” Female, FGD, mixed gender students
“The ZTSA program ensured that we do not just receive corporal punishment and be called ‘stupid,’
because the program encouraged us to come and report such cases. [TVEP] always came here,
so I would just go and report any mistreatment against me, knowing that it will become a big issue.”
Male, FGD, mixed gender students
“ZTSA helped us a great deal…The arrival of this program resulted in students coming forward to
report such cases when they have been wronged either by fellow students or teachers…This
program helped us a lot.” FGD, Parents

15
KEY MESSAGES
The Zero Tolerance School Alliance (ZTSA) model reduces female students’ witnessing of violence
en route to school.
The intervention significantly contributed to a reduction (12%) in the proportion of intervention school girls
who witnessed violence en route to school, compared to an increase (24%) among their comparison site
peers.
The ZTSA model reduces students’ experiences of certain kinds of SGBV en route to school.
The intervention significantly contributed to reductions in intervention students’ experiences of being teased
or kidnapped en route to school—a six percent and two percent reduction, respectively—versus eight percent
increases for both indicators at the intervention school.
The ZTSA model is effective in reducing bullying of girls in school.
The proportion of girls reporting bullying at school in the last year declined significantly at the intervention
school (14% reduction).
ZTSA enhances students’ knowledge of whom to report SRGBV.
At the intervention school, among students who reported bullying in the last year, there was a significant
(31%) decrease in the proportion of those not knowing whom to report it to; among comparison school
counterparts, there was no significant change in this indicator.
ZTSA promotes support for bullied students.
Among intervention school students who reported being bullied in the last year, there was a significant
increase (17%) in the proportion of those receiving help. Conversely, comparison school peers experienced
a 23 percent decline in the proportion of those receiving help for bullying.
The ZTSA intervention broadens students’ sources of information on SRGBV rights.
Intervention school students drew upon a wider range of sources for knowledge of children’s rights, in
contrast to their comparison school peers. The ZTSA model was effective in reaching students through
friends, the intervention school, and community leaders. These changes in the intervention site were
statistically significant.
The ZTSA model increases students’ knowledge of their right to not be subjected to violence.
Among the various aspects of children’s rights, the intervention had the greatest impact in improving
students’ awareness of their rights not to be abused (from 82% to 92% in the intervention school). There
was no significant change in the same indicator in the comparison site.
Some aspects of the ZTSA model require strengthening to more fully address SRGBV consequences.
ZTSA, in its current form, does not yet show an effect on several indicators, which the model will need to
address to address SRGBV more comprehensively:
Students’ perceptions of safety in and around school
The proportion of students (boys and girls) from both schools who indicated fear of walking to school
significantly increased at endline. Students’ fears remained similar in both groups between baseline and
endline, with no statistically significant changes in the proportion of students who felt ‘very or somewhat
safe’ at school.
Students’ experience of SRGBV in and around school
While the intervention significantly contributed to reductions in experiences of certain aspects of violence
(such as being teased or kidnapped), it did not lead to reductions in other forms of violence, such as being
attacked, bullied, or unwanted intimate touching. ZTSA did not lead to a reduction in the proportion of
intervention school boys (as opposed to girls) who experienced bullying in school, nor in the proportion of
intervention school boys and girls experiencing unwanted intimate touching at school.

16
CONCLUSION
The Zero Tolerance School Alliance is a promising intervention engendering prevention of certain aspects of
SRGBV in as little as a year. Along with several encouraging findings, this study has shed light on remaining
gaps and areas requiring reinforcement if SRGBV is to be more comprehensively and effectively addressed.
The study results suggest that a more balanced focus on both boys and girls (rather than on girls alone) will
helps produce equally positive results for boys. Study findings also indicate gender differences in the
experience and reporting of violence. These differences should be taken into account for targeted
approaches.
The gaps revealed by the study also point to a need for integrating new, targeted components within the
overall intervention model to address areas in which the intervention produced no change.
Findings from this study are currently being used by the Thohoyandou Victim Empowerment Programme for
further refinement of ZTSA.

17
APPENDIX
ZERO TOLERANCE SCHOOL ALLIANCE
ORIGINAL CRITERIA FOR ACCEPTANCE INTO THE ALLIANCE7
Note:
All the following criteria have to be met in order for a school to be accepted into the
Alliance.
A copy must be attached the MoA, and signed by the Chairperson of their Stakeholder
Forum.
TVEP’s M&E Department will determine whether-or-not the criteria have been met; when
approved by them, the school will be admitted into the Alliance
1. A School Stakeholder Forum (SSHF) has been elected by democratic process, and consists of
a. Two educators
b. HoD Life Skills/Orientation
c. Two SGB representatives (parents of students at the school)
d. Two of the 4 school activists (see #2) from the Girls Club who are students aged 14+.
e. A civic representative
f. A Community Policing Forum representative
g. A faith-based representative
h. A representative from the local traditional authority
i. A representative from the clinic that serves the school
j. A representative from the SAPS station or satellite that serves the school
k. A social worker that serves the school community
l. Rep from VE committee
2. A Girls Club (GC) has been established; it is open to all girls above a specified age.
Ten of them, elected by the others, have been trained as School Activists (SAs), and have
empowered the rest of the group on their rights and responsibilities pertaining to sexual
assault, domestic violence, child abuse and HIV/AIDS, Accountability Monitoring and
Leadership Skills. They are articulate, courageous and not shy to speak out;
Two of these SAs represent the GC on the SSH
All GC Members have signed and are adhering to a mutually agreed Code of Conduct
The GC have implemented at least two projects that they determined for themselves
3. All students in specified grades received and completed the TVEP Work Books, facilitated by
the Life Orientation Educators;
4. A module on Teen Pregnancy has been developed and all students in the specified age
groups have been work-shopped on it. This module emphasises the costs and
consequences of raising a child, and the responsibilities of the father.
7 Currently being modified by TVEP in response to the evaluation findings.

18
5. The TTBC “Short Talk” has been presented to the entire school EXPANDED TO MORE THAN
ONE, ON SPECIFIC SUBJECTS
6. Girls are no longer missing school due to lack of access to sanitary products.
7. All members of the SSHF and the SAs have been capacitated on how to hold government
service providers accountable to their respective departmental mandates, the Bill of Rights
and relevant legislation.
8. A dialogue between the SSHF, SAs and Government service providers in the vicinity of the
school has been held to ensure the latter are aware of their respective delivery mandates and
appropriate means of recourse when such are not delivered (based on the TVEP “Exercise
your Rights” manual). These deliverables include but are not limited to:
Clinics
o Providing HCT
o Providing food parcels to Child-Headed Households
o PMTCT strategy functional
o Reliable and adequate supply of male & female condoms
o Screening for DV
o Referral strategies in place (e.g. form 22’s for child abuse)
o All staff informed on rape protocols (no washing, immediate access to PEP etc)
Police Stations & Satellites
o VEP Committee functional and appropriately trained
o DV register in place
o Victim-friendly room
o 24-hr vehicle availability
o Victim’s Charter displayed
o Referral list available
9. The school is implementing the DoE Safety in Schools programme, and all students and
educators are familiar with the programme
The school has a policy of non-discrimination, based on the Bill of Rights, which is being
actively implemented.
A policy to deter bullying has been developed and is being implemented
The school has a Sexual Harassment Policy, and all students and educators are familiar
with the policy
10. All students have been provided with two copies of IEC rights-based materials covering sexual
assault, domestic violence, child abuse, HIV/AIDS, Teen Pregnancy and Accountability
Monitoring (“Exercise Your Rights” the information leaflets GC Activists, SSHF Members and
relevant Ward Counsellors and Community Development Workers have been empowered on
TVEP’s 4 thematic areas, are meeting their mandates, are easily accessible to the community
and are referring appropriately
11. Reporting and referral strategies are in place and popularised with educators, students and
stakeholders
12. All school Educators have been workshopped on Positive Discipline and Recognising and
Responding to Child Abuse
19
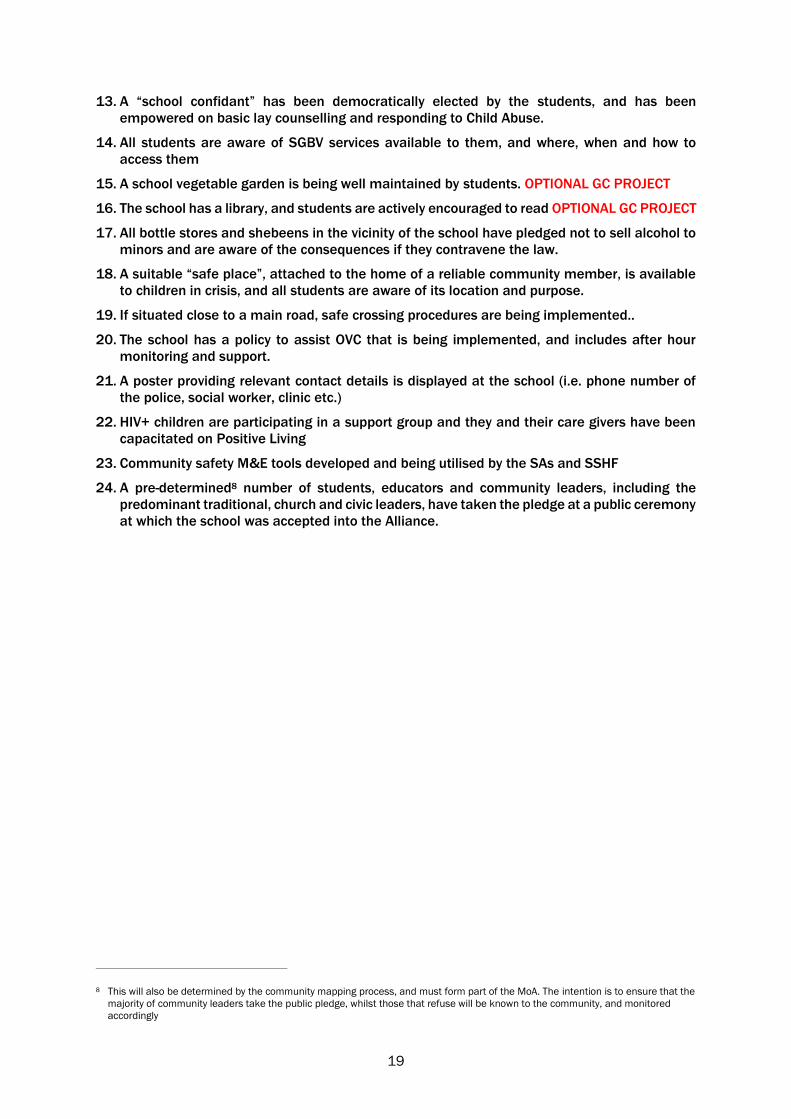
13. A “school confidant” has been democratically elected by the students, and has been
empowered on basic lay counselling and responding to Child Abuse.
14. All students are aware of SGBV services available to them, and where, when and how to
access them
15. A school vegetable garden is being well maintained by students. OPTIONAL GC PROJECT
16. The school has a library, and students are actively encouraged to read OPTIONAL GC PROJECT
17. All bottle stores and shebeens in the vicinity of the school have pledged not to sell alcohol to
minors and are aware of the consequences if they contravene the law.
18. A suitable “safe place”, attached to the home of a reliable community member, is available
to children in crisis, and all students are aware of its location and purpose.
19. If situated close to a main road, safe crossing procedures are being implemented..
20. The school has a policy to assist OVC that is being implemented, and includes after hour
monitoring and support.
21. A poster providing relevant contact details is displayed at the school (i.e. phone number of
the police, social worker, clinic etc.)
22. HIV+ children are participating in a support group and they and their care givers have been
capacitated on Positive Living
23. Community safety M&E tools developed and being utilised by the SAs and SSHF
24. A pre-determined8 number of students, educators and community leaders, including the
predominant traditional, church and civic leaders, have taken the pledge at a public ceremony
at which the school was accepted into the Alliance.
8 This will also be determined by the community mapping process, and must form part of the MoA. The intention is to ensure that the
majority of community leaders take the public pledge, whilst those that refuse will be known to the community, and monitored
accordingly


