The effectiveness of MRP II to integrate enterprise systems Effektiviteten av MRP II för att integrera företagssystem Växjö Maj 2006 Examensarbete nr: TD 028/2006 Ricardo Ortigoza Monroy Benjamín Meza De los Cobos Avdelningen för Systemekonomi Institutionen för teknik och design, TD
Transcript
The effectiveness of MRP II to integrate enterprise systems
Effektiviteten av MRP II för att integrera företagssystem
Växjö Maj 2006 Examensarbete nr: TD 028/2006
Ricardo Ortigoza Monroy Benjamín Meza De los Cobos
Avdelningen för Systemekonomi
Institutionen för teknik och design, TD
i
Organisation/ Organization Författare/Author(s) VÄXJÖ UNIVERSITET Ricardo Ortigoza Monroy Institutionen för teknik och design Benjamín Meza De los Cobos Växjö University School of Technology and Design
The effectiveness of MRP II to integrate enterprise systems
Sammanfattning (på svenska) Små och Mellan- stora företag är många nationers byggstenar. Den vanligaste definitionen av SME´s utgör 99,8% av de uppskattningsvis 19 miljoner företag inom Europeiska Unionen (ISO, 2002) och Sverige är inget undantag. Det är anledningen till att SME´s möter den strategiska utmaningen att uppnå ihållande och vinstgivande tillväxt. För att ta sig an denna utmaningen måste SME´s utveckla förmågor att integrera sina system. Eftersom ICT ger så många fördelar att stödja utbudskedjan, och eftersom MRP II mjukvaror har kommit att bli ett populärt verktyg de senaste trettio åren, kommer vårt syfte bli att svara på följande fråga:
Hur kan datasystem av typen MRP II användas för att på ett effektivt sätt underlätta integrering av tillverkning och organisation?
Undersökningen startade med observationer samt intervjuer på plats, men utförandet av en statistisk undersökning och en modell var nödvändig efter det att vi redan hade kopplat ihop arbetet med en redan accepterad modell. Reasultaten visar hur viktig den mänskliga faktorn samt exaktheten är i användandet av en MRP II. Den visar också att MRP II filosofin måste vara accepterad innan man kan använda MRP II mjukvaran på ett fördelaktigt sätt. Likväl har vi illustrerat den onda cirkeln som vårt företag måste försöka ta sig ur, försökt hitta den underliggande orsaken och slutligen att ge rekommendationer för att bryta den. Abstract (in English) The Small and Medium-size Enterprises are the key bone of the economy of many nations. The usual definition of SME’s, make up 99.8% of the approximately 19 million enterprises of the European Union (ISO, 2002) and Sweden is not an exception. That is why SME’s faces the strategic challenge of achieving sustained profitable growth. To meet this challenge, SME’s must develop capabilities to integrate their systems. Since ICT gives so many advantages to support the Supply Chain, and MRPII software’s have become a very popular tool in the last thirty years; Our purpose is to answer the following research question:
How can MRP II-type computer systems be used effect ively to support the manufacturing and organizational integration?
The research started with on-site observations and interviews but the development of a model and a survey was needed. After, we linked the research with an already accepted model. The results show how important the human aspect and the accuracy are in the effective usage of an MRP II. It also demonstrates that the MRP II philosophy must be accepted to use the MRP II software profitably. Nevertheless, we modeled the vicious cycle that our case company might deal with, tried to find the root cause and give recommendations to break it. Key Words Manufacturing resource planning (MRP II), Small and Medium-size Enterprises (SME), Supply Chain Management (SCM), Enterprise/Manufacturing Integration, Information and Communication Technology (ICT), Evaluation, Effectiveness.
Utgivningsår/Year of issue Språk/Language Antal sido r/Number of pages 2006 English 84 Internet/WWW http://www.vxu.se/td
ii
Acknowledgements
Our first thoughts go to our beloved families who with their support, love, and understanding let us come here to Sweden to prepare us in the best way possible. We dedicate this thesis study especially to our mothers who miss us and love us so much; to our fathers who know the future challenges that are waiting for us in our future professional development and to our brothers and sisters who have been waiting for us to come back to spend some time and continue living our story. In addition, this thesis study belongs to our home country: Mexico. Our country needs more people well prepared to stand the challenges that the business world is facing at this moment: globalization. The idea of coming abroad to get a foreign degree will give us a competitive advantage when we come back to Mexico and make it a better and a more developed place to live. According to this, the experience of making a thesis abroad in an international environment gave us the experience of achieving something that is not so usual in our home country: to get a bachelor degree in a country far away. Also we would like to thank our contact, the Production Manager of Davidsons Tryckeri AB, Mr. Andreas Wijk who let us enter in his enterprise and gave us his entire support in the development of this thesis study by answering our interviews and our survey. Without him this thesis study would not be developed. We would like thank so much our tutor, Mr. Jaime Campos, and the responsible of the course SEC 930 Degree Project, Mr. Om Prakash. Their availability, ideas, ability to correct them, understanding and guidance were a big help. Moreover, they always made sure that we were on track and on time. They also offered us the necessary knowledge for the construction and writing of this thesis. Finally, we would like to thank our college colleagues for their oppositions, constructive comments and the time spent together during the seminars. The mix of cultures, education and background brought us all one step further in our academic as well as our personal life. May 2006. Växjö, Sweden.
Ricardo Ortigoza Monroy Benjamín Meza De los Cobos
iii
Table of contents
Chapter 1. Introduction
1.1 Background 1 1.2 Problem discussion 2 1.3 Presentation of the problem 3 1.4 Problem formulation 4 1.4 Purpose 4 1.5 Relevance 5 1.5.1 Theoretical Relevance 5 1.5.2 Practical Relevance 5 1.6 Limitations 6 1.7 Time frame 6
Chapter 2. Methodology
2.1 Preunderstanding 7 2.2 Inductive versus Deductive Approach 8 2.3 Positivistic Paradigm versus Hermeneutic Paradigm 9 2.4 Research journey 10 2.5 Research strategy 11 2.6 Data collection 12 2.6.1 Theoretical Data Collection 12 2.6.2 Empirical Data Collection 12 2.7 Value of study 12
Chapter 3. Theory
3.1 Small and Medium Enterprises (SME) 14 3.1.1 What is a Small and Medium Enterprise? 14 3.1.2 SME’s Challenges 15 3.2 Information and Communication Technology (ICT) 16 3.2.1 What is Information and Communication Technology? 16 3.2.2 Computer systems development 17 3.2.3 What’s a Manufacturing Resource Planning (MRP II)? 17 3.2.4 Field Benefits of the MRP II system 21 3.2.5 Limitations of MRP II systems 23 3.2.6 Without MRP II 24 3.2.7 Why MRP II for SME’s instead of ERP? 24 3.3 Systems Integration 25 3.3.1 The myth of integration 25 3.3.2 Enterprise integration 26 3.3.3 Manufacturing integration 28 3.3.4 Impact of manufacturing integration in the enterprise integration 31 3.3.5 Integration by Information Communication Technology (ICT) 32
iv
Chapter 4. Evaluation Models
4.1 Brief Strategy 34 4.2 MRP II Functions Model 35 4.3 Competing Values Model (CMV) 36 4.4 Data gathering methods 38
Chapter 5. Empirical Data
5.1 Davidson’s Tryckeri AB 39 5.2 MRP II type computer system used in Davidsons Tryckeri AB 40 5.3 Davidsons Tryckeri AB Survey data 46 5.3.1 Survey data. Part II: Usage Of the MRP-type System 48
Chapter 6. Analysis
6.1 Davidson’s Tryckeri AB 51
Chapter 7. Results and Conclusions
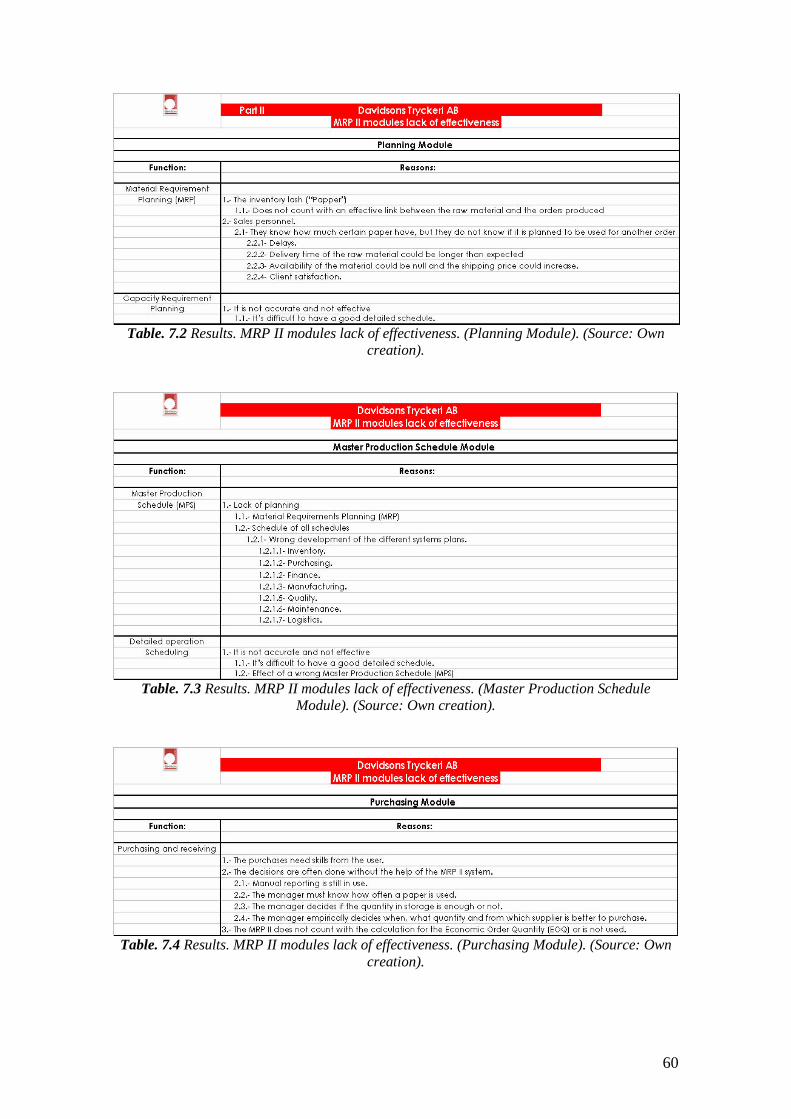
7.1 Results 58 7.1.1 MRP II functions 58 7.1.2 Achievement of field Benefits and Data accuracy 61 7.1.3 Integration of systems 62 7.2 Conclusions 63
Chapter 8. Recommendations
66 List of references Articles and journals 69
Books 73 E-books 75 Internet sources 75 Other sources 75
Appendix 1. Survey of Computer Systems Usage in Manufacturing 76
v
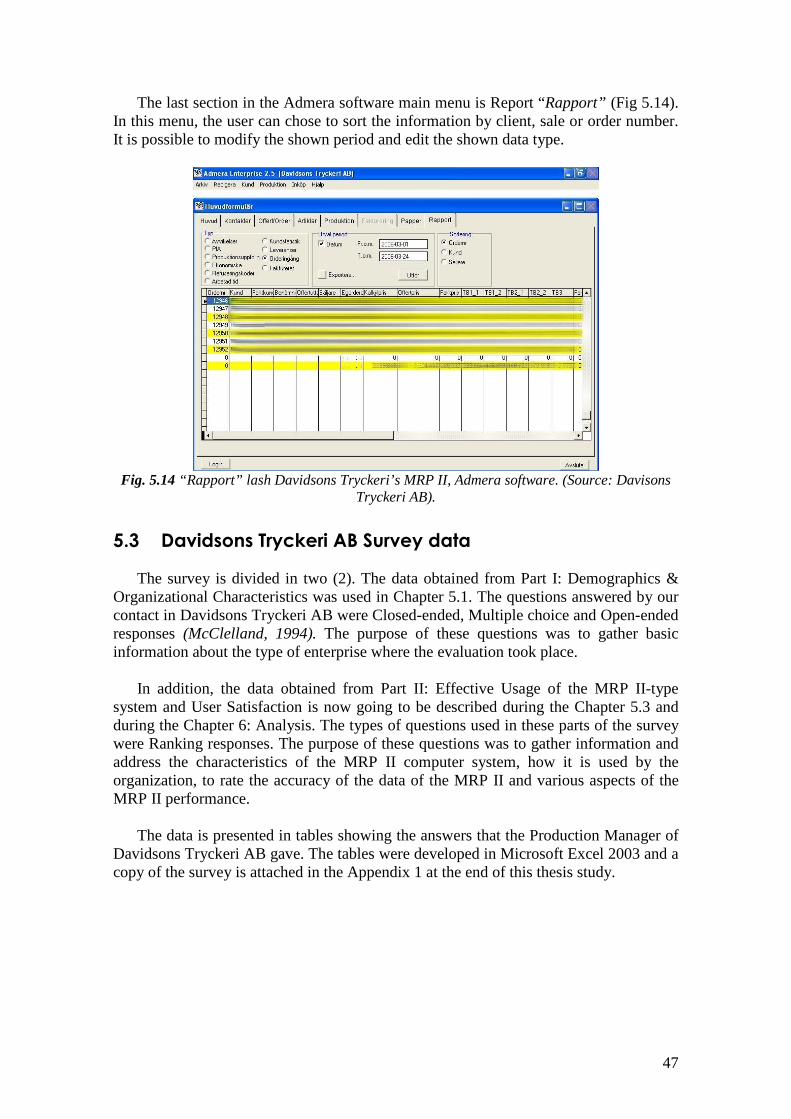
List of figures Figure 1.1 Time-frame of the thesis study. (Source: own creation.). Figure 2.1 Sources for preunderstanding. (Source: Gummesson, 2000). Figure 2.2 Sources for Understanding. (Source: Gummesson, 2000). Figure 2.3 Hermeneutic Spiral. (Source: Own creation). Figure 2.4 Deductive, Inductive and Abductive approaches. (Source: Alvesson & Skökleberg, 2000). Fig. 3.1 Relationship between a MRP II system and SME long term success. (Source: own creation). Fig 3.2 Skeleton framework of a MRP II concept. (Source: Plenert, 1996.) Fig.3.3 Impact of manufacturing in the enterprise integration. (Source: Bragaza, 2002.) Fig. 4.1 Graphic Strategy. Relationship between Competing Values Model and MRP II Function Model (Source: own creation). Fig. 4.2 Manufacturing Resource Planning Model (MRP II type system). (Source: own creation). Fig. 4.3. Competing Values Model (CVM) (Source: Quinn & Rohrbaugh, 1981; 1983) Fig. 5.1 “Huvud” lash of Davidsons Tryckeri’s MRP II, Admera software. (Source: Davidsons Tryckeri AB). Fig. 5.2 “Kontakter” lash of Davidsons Tryckeri’s MRP II, Admera software. (Source: Davidsons Tryckeri AB). Fig. 5.3 “Offer and Order” lash of Davidsons Tryckeri’s MRP II, Admera software. (Source: Davisons Tryckeri AB). Fig. 5.4 “Offer” Front Page screen of Davidsons Tryckeri’s MRP II, Admera software. (Source: Davisons Tryckeri AB). Fig. 5.5 “Trick” lash of Davidsons Tryckeri’s MRP II, Admera software. (Source: Davisons Tryckeri AB). Fig. 5.6 “Artiklar” lash of Davidsons Tryckeri’s MRP II, Admera software. (Source: Davisons Tryckeri AB). Fig. 5.7 “Produktion” lash of Davidsons Tryckeri’s MRP II, Admera software. (Source: Davisons Tryckeri AB). Fig. 5.8 “Produktion” details of Davidsons Tryckeri’s MRP II, Admera software. (Source: Davisons Tryckeri AB). Fig. 5.9 Decision making and time planning lash of Davidsons Tryckeri’s MRP II, Admera software. (Source: Davisons Tryckeri AB). Fig. 5.10 Work reports lash of Davidsons Tryckeri’s MRP II, Admera software. (Source: Davisons Tryckeri AB) Fig. 5.11 Current reports lash of Davidsons Tryckeri’s MRP II, Admera software. (Source: Davisons Tryckeri AB). Fig. 5.12 “Papper” lash of Davidsons Tryckeri’s MRP II, Admera software. (Source: Davisons Tryckeri AB). Fig. 5.13 Historical data lash of Davidsons Tryckeri’s MRP II, Admera software. (Source: Davisons Tryckeri AB). Fig. 5.14 “Rapport” lash Davidsons Tryckeri’s MRP II, Admera software. (Source: Davisons Tryckeri AB). Fig. 7.1 Results Classification of MRP II functions. (Source: Own creation). Fig. 7.2 Vicious or self-destructive cycle.(Source: Own creation).
vi
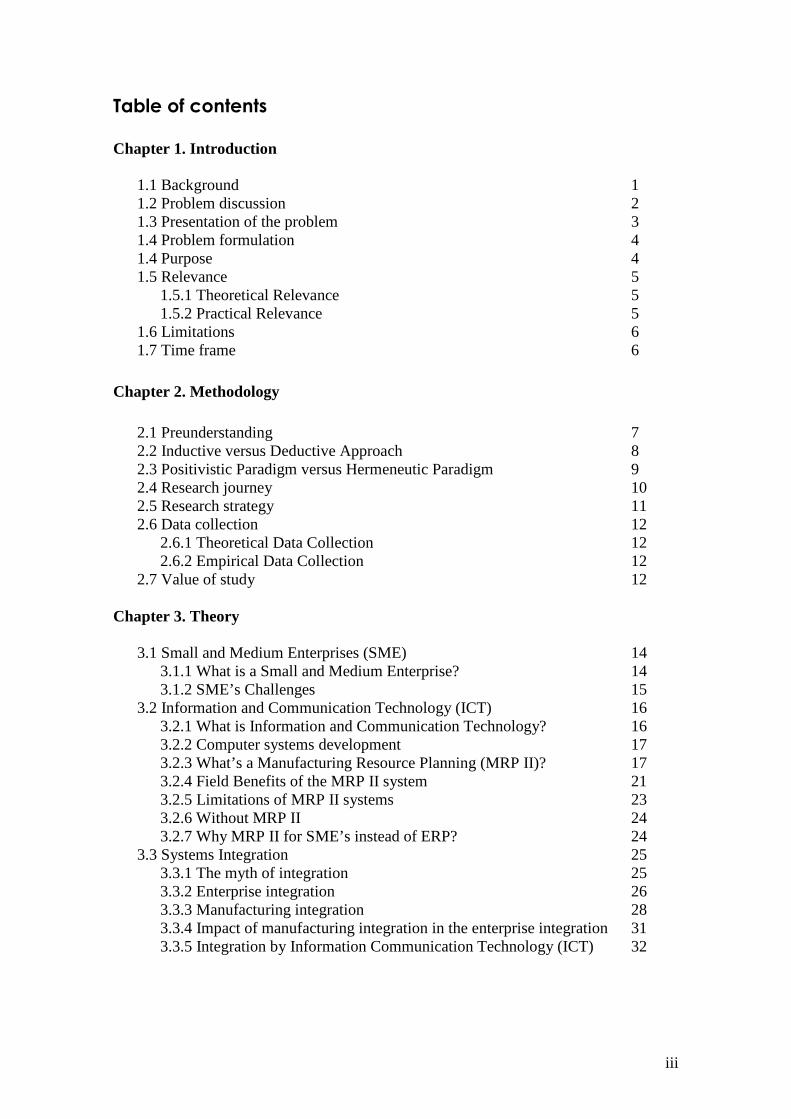
List of tables Table 2.1 Positivistic Paradigm versus Hermeneutic Paradigm. (Source: Gummesson, 2000.) Table 2.2 Relevant Situations for Different Research Strategies. (Source: Yin, 2003.) Table. 5.1 Survey data. Part II: Usage of the MRP-type system (Section A). (Source: Own creation). Table. 5.2 Survey data. Part II: Usage of the MRP-type system (Section B). (Source: Own creation). Table. 5.3 Survey data. Part II: Usage of the MRP-type system (Section C). (Source: Own creation). Table. 5.4 Survey data. Part II: Usage of the MRP-type system (Section D). (Source: Own creation). Table. 7.1 Results. Classification of MRP II functions. (Source: Own creation). Table. 7.2 Results. MRP II modules lack of effectiveness. (Planning Module). (Source: Own creation). Table. 7.3 Results. MRP II modules lack of effectiveness. (Master Production Schedule Module). (Source: Own creation). Table. 7.4 Results. MRP II modules lack of effectiveness. (Purchasing Module). (Source: Own creation). Table. 7.5 Results. MRP II fields of benefits. (Source: Own creation).
List of graphs Graph 6.1 Survey data. Part II: Usage of the MRP-type system (Section A). (Source: Own creation). Graph 6.2 Survey data. Part II: Usage of the MRP-type system (Section B). (Source: Own creation).
vii
List of abbreviations MRP II: Manufacturing Resource Planning. IS: Information Systems. SCM: Supply Chain Management. MRP: Material Requirement Planning. MIS: Manufacturing Information Systems. IT: Information Technology. ERP: Enterprise Resource Planning. SME: Small and Medium size Enterprises. ICT: Information and Communication Technology. CIM: Computer Integrated Manufacturing. RRP: Resources Requirements Planning. MPS: Master Production Schedule. RCCP: Rough-cut Capacity Planning. CRP: Capacity Requirements Planning. ROI: Return On Investment. SBU: System Business Unit. QFD: Quality Function Deployment. MFD: Maintenance Function Deployment. TQM: Total Quality Management. TQMain: Total Quality Maintenance. TPM: Total Productive Maintenance. OEE: Overall Equipment Effectiveness. CAD/CAM: Computer Aided Design/Manufacturing. JIT: Just in Time. CVM: Competing Values Model.
IP: Internal Process model. RG: Rational Goal model. OS: Open Systems model. HR: Human Relations model.
EOQ: Economic Order Quantity. CEO: Chief Executive Officer. R&D: Research and Development. et al: et alii (and others).
1
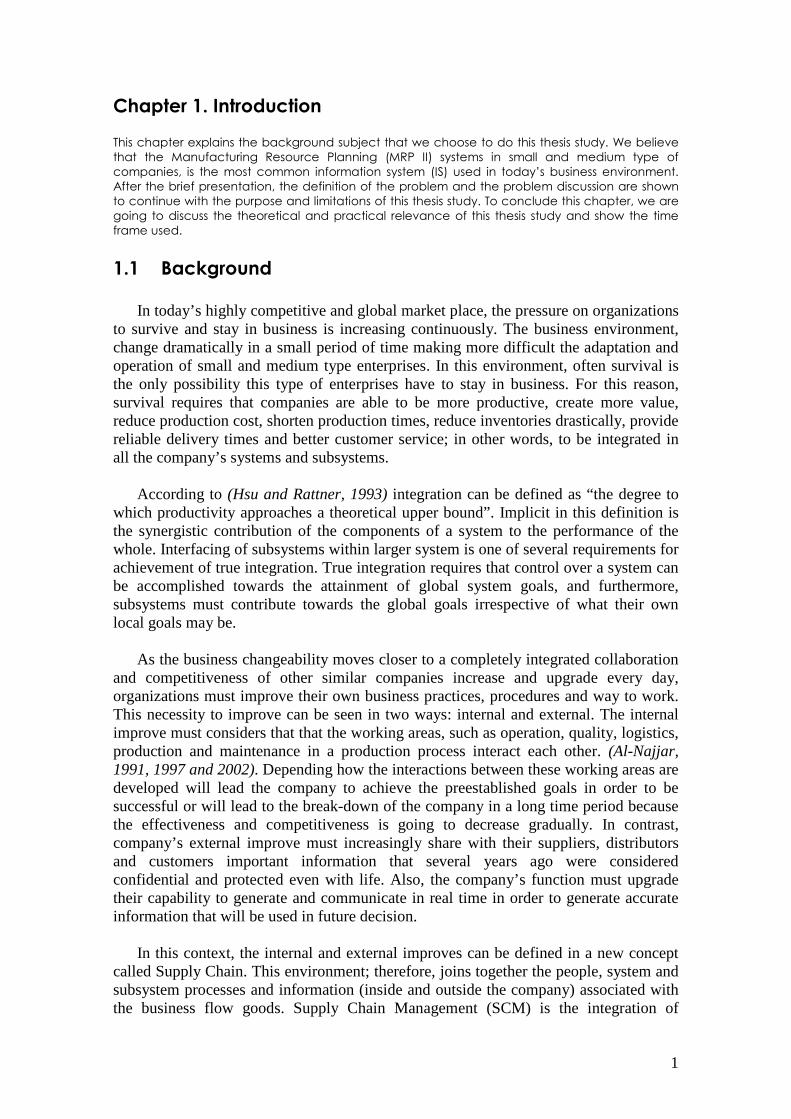
Chapter 1. Introduction This chapter explains the background subject that we choose to do this thesis study. We believe that the Manufacturing Resource Planning (MRP II) systems in small and medium type of companies, is the most common information system (IS) used in today’s business environment. After the brief presentation, the definition of the problem and the problem discussion are shown to continue with the purpose and limitations of this thesis study. To conclude this chapter, we are going to discuss the theoretical and practical relevance of this thesis study and show the time frame used.
1.1 Background
In today’s highly competitive and global market place, the pressure on organizations
to survive and stay in business is increasing continuously. The business environment, change dramatically in a small period of time making more difficult the adaptation and operation of small and medium type enterprises. In this environment, often survival is the only possibility this type of enterprises have to stay in business. For this reason, survival requires that companies are able to be more productive, create more value, reduce production cost, shorten production times, reduce inventories drastically, provide reliable delivery times and better customer service; in other words, to be integrated in all the company’s systems and subsystems.
According to (Hsu and Rattner, 1993) integration can be defined as “the degree to which productivity approaches a theoretical upper bound”. Implicit in this definition is the synergistic contribution of the components of a system to the performance of the whole. Interfacing of subsystems within larger system is one of several requirements for achievement of true integration. True integration requires that control over a system can be accomplished towards the attainment of global system goals, and furthermore, subsystems must contribute towards the global goals irrespective of what their own local goals may be.
As the business changeability moves closer to a completely integrated collaboration and competitiveness of other similar companies increase and upgrade every day, organizations must improve their own business practices, procedures and way to work. This necessity to improve can be seen in two ways: internal and external. The internal improve must considers that that the working areas, such as operation, quality, logistics, production and maintenance in a production process interact each other. (Al-Najjar, 1991, 1997 and 2002). Depending how the interactions between these working areas are developed will lead the company to achieve the preestablished goals in order to be successful or will lead to the break-down of the company in a long time period because the effectiveness and competitiveness is going to decrease gradually. In contrast, company’s external improve must increasingly share with their suppliers, distributors and customers important information that several years ago were considered confidential and protected even with life. Also, the company’s function must upgrade their capability to generate and communicate in real time in order to generate accurate information that will be used in future decision.
In this context, the internal and external improves can be defined in a new concept called Supply Chain. This environment; therefore, joins together the people, system and subsystem processes and information (inside and outside the company) associated with the business flow goods. Supply Chain Management (SCM) is the integration of
2
business processes from the beginning to the end; in other words, from the original suppliers that provides raw material, services, information and product to the end customer who will the define the quality of the product and the quality of the service. (Karavidas, K., and T. Wienholtz, 2004). The ones who can manage better the Supply Chain will success; in contrast, the ones who cannot manage it will for sure disappear in a few years. For this reason, the integration of the different systems and subsystems in the Supply Chain is one of the biggest problems that the companies are facing today.
According to the last paragraph, computer systems gave a huge set of tools that can give advantages to support the manufacturing Supply Chain part in business processes of the small and medium enterprises. These computer systems have become widespread throughout manufacturing industries over the last thirty years. During this time, the computer systems to support manufacturing have quickly evolved from basic material requirement planning (MRP) software to today’s sophisticated extended enterprise integration packages that reside on client/server computer architecture.
The popularity of MRP-type systems is demonstrated by the many small and medium companies that have acquired manufacturing resource planning or “MRP II” systems (Anderson, Schroeder, Tupy, and White, 1982; Chase and Aquilano, 1995). In 1996, the Institute of Industrial Engineers in USA published a list of 94 MRP software vendors (MRP II Software, 1996). Also the use of the MRP II provides minimization of the time and effort required to process business data and maximizes the application of that information. By facilitating data exchange throughout an organization, a MRP II system enables coordination of such crucial activities as production planning, material planning, capacity planning and shop floor control. (Tremblay, 1991).
Yet despite the rapid development of MRP software, very little work has been done to evaluate the effectiveness of how small and medium type companies are actually using MRP II (Sum & Yang, 1992).
1.2 Problem discussion
Event though the value of the MRP II can bring to companies is clear, and a few
will refuse its potential, numerous organizations have failed or are failing to apply effectively the advantages that this system can give. The using of a MRP II system requires major managerial innovations and organizational changes in addition to the installation of computer hardware and software. It is estimated that that at least 60 to 80% of MRP II computer systems installed in small and medium enterprises are not well used at its whole capacity. (Sheldon, 1991). In addition, this lack of effectiveness in the use of the MRP II system gives a result of a poor development of the master production schedule which is the key tool in the production planning. In fact, it is the schedule of all the schedules, it identifies the objectives so that others systems such material inventory, finance, manufacturing, quality, logistics, maintenance and purchasing can develop valid plans to support this schedule and meet the desired objectives.
Again, these schedules are critical. Master scheduling accuracy directly correlates to
on-time shipping performance. If the company that uses the MRP II computer system cannot maintain the discipline to work to accomplish these operating plans, for sure they are going to operate inefficiently. The company will not understand how the cause
3
and effect relationship evolves; and consequently will need inventory, expediting, and longer lead times to the customer to make up for this inefficiency. These costs are tremendous! as there is no value added to the customer in inventory, materiel handling or work-in-process. Producing the majority of output in the last week of the month to meet monthly plans or customer orders is not necessary profitable, and will not happen if the company plan and execute its manufacturing business in a logical, common sense way that a MRP II can offer and give for sure.
Moreover, there are additional problems that may occur during the using of a MRP II computer system. Apart from the substantial waste of time and money consumption caused by the raise of costs, MRP II systems change the company’s culture, create extensive training requirements and even lead in the beginning to overlapping activities caused to the lack of responsibility of who is the one who should perform a specific task. In addition, the internal frictions will appear diminishing the confidence and trust in the business activities.
1.3 Presentation of the problem
The widespread use of computers in industry today presents a need for developing
increased knowledge of how to effectively apply manufacturing resource planning, client/server systems, and computer applications in general. Quite often, computer applications change the way work is performed. (Hodson, 1992).
As we can see, the effectiveness of the MRP II doesn’t depend only in the software
and hardware system. For this reason, this thesis study centers around the existing Manufacturing Resource Planning (MRP II) computer technology, but it also includes the operators, those who provide the input data, the users, the organizational structure and management system within which it operates, and any other elements that influence the effectiveness of the Manufacturing Resource Planning (MRP II).
MRP II computer systems are developed by nearly a hundred vendors (MRP II Software, 1996) and quite possibly may not be identified within a company as a “MRP II” system. For example, Manufacturing Information Systems (MIS) managers in many electronic manufacturing plants consider “ERP” or enterprise resource planning the new trend for manufacturing computer support systems for the integration of the system and subsystem in small and medium enterprises.
In addition, there is a wrong view about how a MRP II should be operated in an effective way facilitating the integration of the different systems and subsystems inside of a company. Some MIS have the narrow idea that the MRP II will do everything by itself; in other words, the organization’s MRP II operators are absorbed in the technical aspect of the MRP II that they forget about the “soft” aspects that also influence the effectiveness of the use of the computer system. In this context, to make an effective use of the MRP II the people must be involved in gaining support from future users of the system, training them how to use the technical aspects of the systems, and familiarizing them with how jobs and processes will change. (Jacobi, 1994).
The effective use of a MRP II decreases for a number of different reasons; in addition, there are many elements that provide potential risks for a satisfactory use of a MRP II computer system. The skills of a company to handle these risk areas decide
4
whether the use is going to be effective and to achieve the strategically goals if it is properly used or a failure to achieve that goals, the increase of the company’s costs and the lost of competitiveness.
1.4 Problem formulation
Several questions are intended to be solved with this thesis study:
How are MRP II systems currently being used in small and medium enterprises?
What issues and problems have small and medium companies encountered in the
use of MRP II systems?
What are the reasons behind the lack of effectiveness in the use of MRP II computer systems?
Does the effective use of MRP II system help the enterprise to integrate the
different manufacturing systems and subsystems?
Is MRP II software an enough integration tool for small and medium companies?
Although this study can not fully answer these questions, this thesis study will
provide valuable information concerning the technological and management systems used to support integration in manufacturing organizations. Effectiveness and problem issues evaluation will serve to further manufacturing integration that will support the management decision making.
Taking all the above into consideration, we decided to come up with the following research question:
“How can MRP II-type computer systems be used effectively to support the manufacturing and organizational integration?”
It is important for us before continuing, to define the effective concept. We define
effective as “producing or capable of producing a desired effect” (American Heritage, 2000).
1.5 Purpose
The main purpose of this thesis study is to answer the research question. Regardless
of whether the MRP II software is developed in-house or leased from a vendor, for the purpose of this study a computer system qualifies as the type of MRP II computer system to be addressed if it at least performs the following functions:
Inventory management, product data management, location/lot management capacity requirements, materiel requirement planning, master production planning and, to some degree, accounts receivable, accounts payable, and sales analysis.
5
The computer system in this study is defined by the application in which it is used. While a wide range of software and hardware is available to support manufacturing systems and subsystems, this thesis study focuses on the integration of computer technology within the organizational system. Inevitably, part of the purpose of this thesis study must include the operators, the users, the management structure and any other elements that influence the effectiveness of the MRP II computer system that support the integration of the organization.
1.6 Relevance
1.6.1 Theoretical Relevance
After reading many books, articles and journals in the area of MRP II and ERP systems and their effectiveness benefits, we agree that there are already a lot of theories and relevant information about the subject of study. Even though, it appears that there is no such research when it comes to the common factor that determine the effective use of MRP II-type computer systems to support the manufacturing and organizational integration.
In addition, we can say that our aim in this thesis study is two-folded. Not only to
test the theories in practice and draw conclusions about their practical value but also to give well based suggestions that brings into discussion the effective use of the MRP II system in small and medium enterprises. Finally, we want to increase the understanding of the theories for us and for the Swedish company involved.
1.6.2 Practical Relevance
As it was said before, we want to test some of the available theories in the real business life. Obviously, we can’t apply all the available theories that have already been published; for this reason, we selected the most appropriate parts of each theory to be applied as a fundamental basis of our thesis study. By doing this, we would like to mix as much as possible all the different points of view to create our own conclusions and recommendations in a practical use.
In fact, the practical relevance of this thesis study can be found in the
recommendations that we are going to give to the Swedish company involved in order to increase the value gained by the effective use of a MRP II computer system. In addition, we believe that the results of this thesis study can be also used for other companies that are having also problems with the effectiveness of their different MRP II or ERP systems. By bringing the theoretical information into action, we hope to find the best way to identify the basic factors that determine the effective use of MRP II-type computer system that support manufacturing and organizational integration in small and medium companies.
6
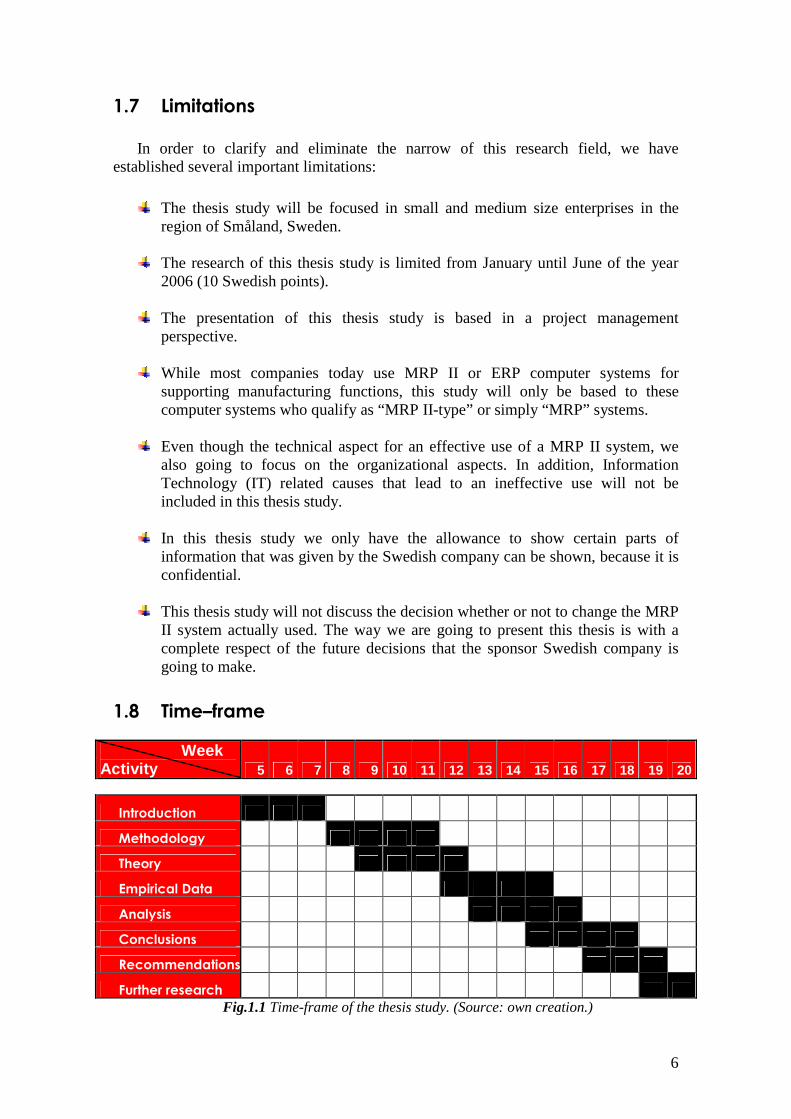
1.7 Limitations
In order to clarify and eliminate the narrow of this research field, we have
established several important limitations:
The thesis study will be focused in small and medium size enterprises in the
region of Småland, Sweden.
The research of this thesis study is limited from January until June of the year 2006 (10 Swedish points).
The presentation of this thesis study is based in a project management
perspective.
While most companies today use MRP II or ERP computer systems for supporting manufacturing functions, this study will only be based to these computer systems who qualify as “MRP II-type” or simply “MRP” systems.
Even though the technical aspect for an effective use of a MRP II system, we
also going to focus on the organizational aspects. In addition, Information Technology (IT) related causes that lead to an ineffective use will not be included in this thesis study.
In this thesis study we only have the allowance to show certain parts of
information that was given by the Swedish company can be shown, because it is confidential.
This thesis study will not discuss the decision whether or not to change the MRP
II system actually used. The way we are going to present this thesis is with a complete respect of the future decisions that the sponsor Swedish company is going to make.
Further research Fig.1.1 Time-frame of the thesis study. (Source: own creation.)
7
Chapter 2. Methodology
The next chapter explains the different methodologies that can be used in order to complete a research project. After analyzing the different options, we explain why we chose certain paradigm, the methods we used to reach validation, reliability, etc. The reader can also find the research journey strategy and the methods for the data collection.
2.1 Preunderstanding
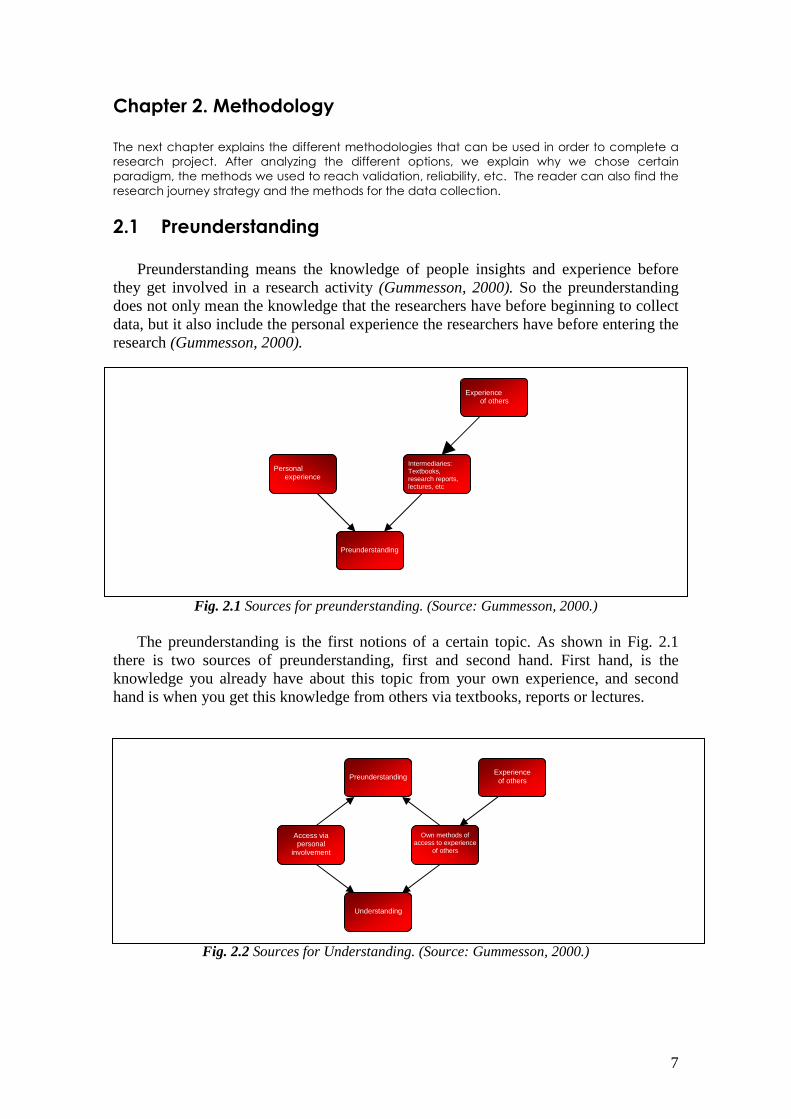
Preunderstanding means the knowledge of people insights and experience before
they get involved in a research activity (Gummesson, 2000). So the preunderstanding does not only mean the knowledge that the researchers have before beginning to collect data, but it also include the personal experience the researchers have before entering the research (Gummesson, 2000).
Fig. 2.1 Sources for preunderstanding. (Source: Gummesson, 2000.)
The preunderstanding is the first notions of a certain topic. As shown in Fig. 2.1 there is two sources of preunderstanding, first and second hand. First hand, is the knowledge you already have about this topic from your own experience, and second hand is when you get this knowledge from others via textbooks, reports or lectures.
Fig. 2.2 Sources for Understanding. (Source: Gummesson, 2000.)
Understanding
Preunderstanding
Access via personal
involvement
Own methods of access to experience
of others
Experience of others
Preunderstanding
Intermediaries: Textbooks, research reports, lectures, etc
Experience of others
Personal experience
8
During the researching, there are different methods to assimilate this preunderstanding and turn it in “understanding” the Fig. 2.2 illustrate better the development of understanding from certain preunderstanding .
Fig. 2.3 Hermeneutic Spiral. (Source: Own creation.) By involving ourselves with the case company and using research methods we will
assimilate our preunderstanding and turning it into understanding, and this will lead us to understand better the situation as a whole, just like the hermeneutical cycle explains (Fig. 2.3). This Hermeneutic circle or spiral takes sense with this two simple sentences “no understanding without preunderstanding” and “an understanding of the parts assumes an understanding of the whole” (Gummesson, 2000) Therefore, as many times that you repeat this circle as higher lever of understanding of the whole you will have.
According to Gummesson, it is crucial that researchers have a basic
preunderstanding before starting the project; otherwise, they would spend considerable time on information gathering (Gummesson, 2000). We have the same background, eight and seven semesters of Industrial and Systems Engineering in Tecnológico de Estudios Superiores de Monterrey (Monterrey Tech) with one semester in the school of Terothecnology and Design at Växjö University. Therefore, our preunderstanding comes from courses like “Information Systems”, “Participate Methods for Modeling”, “Manufacturing Processes”, among others and such also conferences, books, reports, academic service and working jobs in México.
2.2 Inductive versus Deductive Approach
Deductive research starts with existing theories and concepts and formulates hypotheses that are consequently tested. The inductive research starts with real-world data, after the categories, concepts, patterns, models, and eventually, theories emerge from this input (Gummesson, 2000). Our task is first to generalize concepts in order to create a model and a survey, after we will test the effectiveness and relate it with an accepted model in a small or medium company; therefore, we will use both deductive and inductive approach. This combination is called Abductive approach.
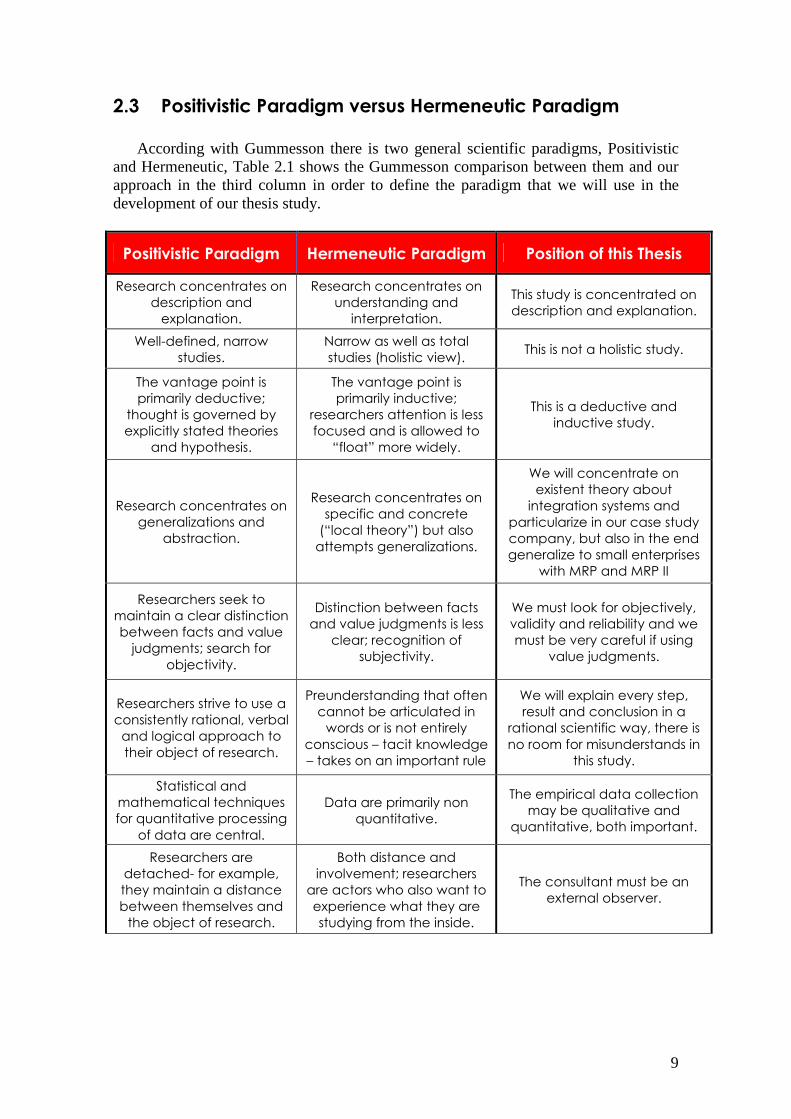
2.3 Positivistic Paradigm versus Hermeneutic Paradigm
According with Gummesson there is two general scientific paradigms, Positivistic
and Hermeneutic, Table 2.1 shows the Gummesson comparison between them and our approach in the third column in order to define the paradigm that we will use in the development of our thesis study.
Positivistic Paradigm Hermeneutic Paradigm Position of this Thesis
Research concentrates on description and explanation.
Research concentrates on understanding and interpretation.
This study is concentrated on description and explanation.
Well-defined, narrow studies.
Narrow as well as total studies (holistic view).
This is not a holistic study.
The vantage point is primarily deductive; thought is governed by explicitly stated theories
and hypothesis.
The vantage point is primarily inductive;
researchers attention is less focused and is allowed to “float” more widely.
This is a deductive and inductive study.
Research concentrates on generalizations and
abstraction.
Research concentrates on specific and concrete (“local theory”) but also attempts generalizations.
We will concentrate on existent theory about integration systems and
particularize in our case study company, but also in the end generalize to small enterprises
with MRP and MRP II
Researchers seek to maintain a clear distinction between facts and value judgments; search for
objectivity.
Distinction between facts and value judgments is less clear; recognition of
subjectivity.
We must look for objectively, validity and reliability and we must be very careful if using
value judgments.
Researchers strive to use a consistently rational, verbal and logical approach to their object of research.
Preunderstanding that often cannot be articulated in words or is not entirely
conscious – tacit knowledge – takes on an important rule
We will explain every step, result and conclusion in a
rational scientific way, there is no room for misunderstands in
this study.
Statistical and mathematical techniques for quantitative processing
of data are central.
Data are primarily non quantitative.
The empirical data collection may be qualitative and
quantitative, both important.
Researchers are detached- for example, they maintain a distance between themselves and the object of research.
Both distance and involvement; researchers are actors who also want to experience what they are studying from the inside.
The consultant must be an external observer.
10
Distinction between science and personal
experience.
Researchers accept influence from both science and personal experience; they use their personality as
an instrument.
Since both science and personal experience are used in this study but with a different relevance, we will make a distinction between them.
Researchers try to be emotionally neutral and make a clear distinction between reason and
feeling.
Researchers allow both feelings and reason to govern their actions.
Emotional influence is not relevant for this project. We must make difference between the reason and
feeling.
Researchers discover an object of research external to themselves rather than “creating” the actual object of study.
Researchers partially create what they study, for
example, the meaning of a process or a document.
The study field is already existent. Our work is to test it and give a frame of solution for the case company
problem.
Table 2.1 Positivistic Paradigm versus Hermeneutic Paradigm. (Source: Gummesson, 2000.)
After filling in this table with the project position, we can conclude that this study will follow the positivist paradigm since suit better for our objectives and the study purpose.
2.4 Research journey
Based in our preunderstanding, the first step in the research journey was to decide in which field we wanted to work. Through our readings, we noticed that here in Sweden most of all the companies are small and medium size enterprises (SME) and is growing concern about how these kinds of enterprises can be able to work in a more effective way by the integration of the different manufacturing systems and subsystems. This approach is also supported by the different courses we have been taking in our major (Industrial and Systems Engineering) here in Växjö University and in our home university Tecnológico de Estudios Superiores de Monterrey (Monterrey Tech).
In addition, the Information and Communication Technology (ICT) advantages nowadays bring a competitive advantage in the business environment. This led us to the first real focus; we wanted to help a company to operate in a more effective way with applying the ICT concepts to support the manufacturing integration. We had to go back to our computers and to the Växjö University’s library and found some insights on what kind of ICT systems has been applied to facilitate the manufacturing integration. The Enterprise Resource Planning (ERP) appeared as an interesting are to work on. This led us to our initial research question: “What is the role and impact of ERP in the manufacturing systems and subsystems
integration?”
After further research we realized that this Research question was not up to date. During the research we also found out that here in Sweden, especially in Växjö region called Småland, there are few companies that we can be able to reach to do our thesis study. For this reason, the SME’s are the most common type of enterprises that operate and work in this region, so the ERP is not suitable for this kind of enterprises because is to big to implement and use it. Due to this limitation, we continued with the research
11
and we found out the existence of the MRP II system that has been applied for a long time and is the precursor of the ERP. According to this, we got to our second Research Question:
“What is the role and impact of MRP II in the manufacturing systems and subsystems integration?”
We found that there are some investigations and lots of papers about the MRP II,
but there is none that relates the use of the MRP II with the effectiveness integration of the manufacturing systems and subsystems. Furthermore, we realized that the literature about the MRP II and manufacturing integration is a lot but there is no practical way to ensure this; in fact, many of factors minimize the integration of the manufacturing integration with the use MRP II system. This lead to an ineffective way to work in SME’s companies taking out the great possibility to use the MRP II system as a strategic plan. With this information also combined with the ICT systems, we came out with the possibility of applying the MRP II system in a computer database system in real time that enables the effectiveness. Finally, we discovered that the MRP II-type computer system has also been applied for a long time in different SME’s here in Sweden. At this point, we arrived to our final Research Question:
“How can MRP II-type computer systems be used effectively to support the manufacturing and organizational integration?”
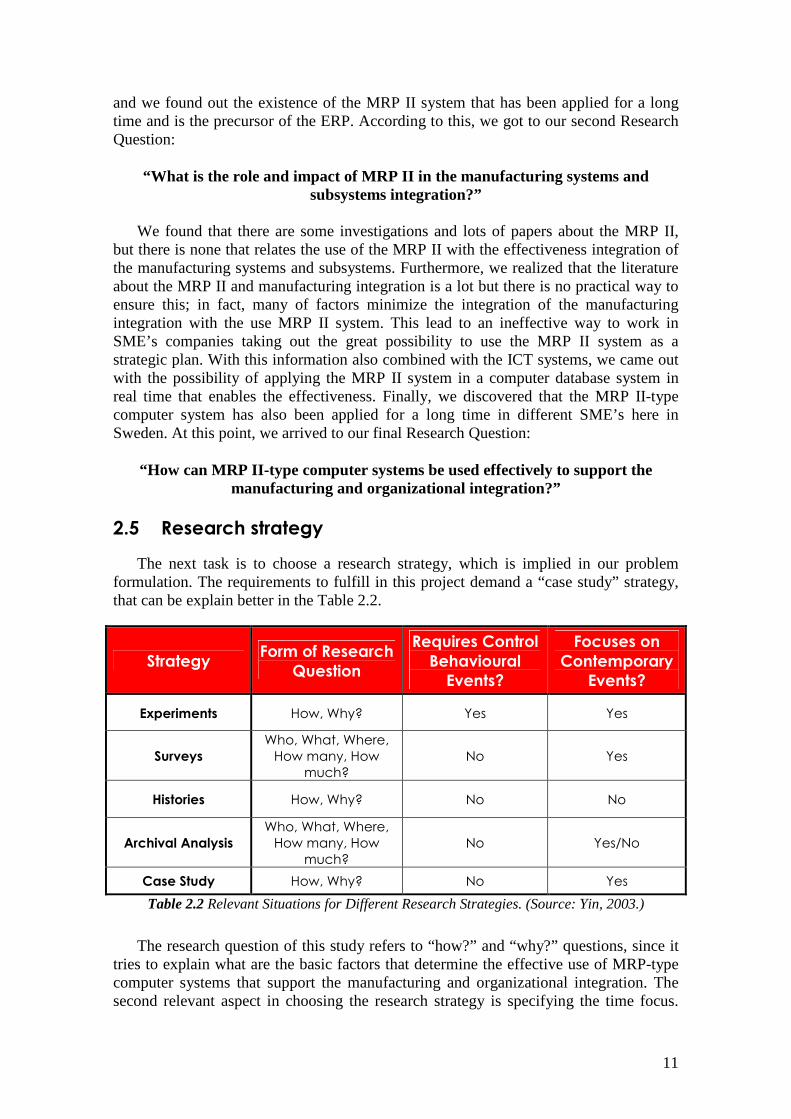
2.5 Research strategy
The next task is to choose a research strategy, which is implied in our problem formulation. The requirements to fulfill in this project demand a “case study” strategy, that can be explain better in the Table 2.2.
Strategy Form of Research
Question
Requires Control
Behavioural
Events?
Focuses on
Contemporary
Events?
Experiments How, Why? Yes Yes
Surveys
Who, What, Where, How many, How
much? No Yes
Histories How, Why? No No
Archival Analysis
Who, What, Where, How many, How
much? No Yes/No
Case Study How, Why? No Yes
Table 2.2 Relevant Situations for Different Research Strategies. (Source: Yin, 2003.)
The research question of this study refers to “how?” and “why?” questions, since it tries to explain what are the basic factors that determine the effective use of MRP-type computer systems that support the manufacturing and organizational integration. The second relevant aspect in choosing the research strategy is specifying the time focus.
12
Since this study includes interviews and direct observation of the events, it has then a contemporary events focus. This leads to the case study research strategy.
2.6 Data Collection
2.6.1 Theoretical Data Collection
The first source of theoretical information was the library at Växjö University. We were surprised to realize that there were not so many books about MRP II-type systems so we faced some difficulties. For this reason, we decided to look on internet sources of information; specially, the e-books resources that Växjö University gladly offered us. In addition, several specialized magazines and journals were read like: Production and Inventory Management Journal, Computerworld, Manufacturing Management and Distribution, etc.
Definitely, the Internet was a great source of information of theoretical material. Using search engines like Biblioteca Digital (Digital Library Monterrey Tech), Scientific Direct, Emerald, ProQuest, Lexis and Google, we tried to find articles that could give us some reliable and important information. The used key words were “MRP II systems”, “Manufacturing Resource Planning” and “Manufacturing Integration”.
2.6.2 Empirical Data Collection
The empirical data was collected by different sources of evidence. There are six
important sources to gather empirical data: Documentation, archival records, interviews, direct observation, participant-observation and physical artifacts. (Yin, 2003).
In this study, we visited physically a case company in order to get direct observation
of the different kind of problems that they are facing. As a complement of this approach, we will make interviews for the different personnel involucrated. We had all the support of the case company to access the different kind of documentation and information such as agendas, files and administrative papers required for this thesis study. We are aware that certain parts of the information of our case company might be confidential; for this reason, we will be careful of showing this information to respect this policy.
2.7 Value of the Study
In order to establish the quality of an empirical research, Yin identifies four tests: construct validity, internal validity, external validity and reliability. (Yin, 2003).
Construct Validity
To construct validity it is necessary to deal with multiple sources of evidence, establish a chain of evidence and have the case study report reviewed by the informants. The two first steps should occur during the data collection activity and the third while writing the composition. (Yin, 2003).
13
Internal Validity
According to Yin, internal validity is the establishment of a causal relationship, whereby certain conditions are shown to lead to other conditions. (Yin, 2003). Then the investigator tries to understand whether event X leads to event Y. (Yin, 2003). External Validity In this test it is necessary to establish the domain to which a study’s findings can be generalized. (Yin, 2003). Reliability
Reliability is the final test to be done, and the major objective is to make sure that if two or more independent investigators follow the same procedures and the same research method is conducted, they will reach the same conclusions. (Yin, 2003).
14
Chapter 3. Theory This chapter introduces the theoretical background of this study. Initially, we are going to show the definition of the Small and Medium Enterprises (SME) and their role in the Swedish Industry including the most important challenges that the SME’s companies have to face nowadays. We are going to present the Information and Communication Technology (ICT) development showing the important role of the MRP II systems in this context. Finally, the integration definition will be approached by the enterprise and manufacturing views showing the impact and doing a close relationship with the ICT.
3.1 Small and Medium size Enterprises (SME)
3.1.1 What is a Small and Medium Enterprise?
An enterprise is considered to be any entity engaged in an economic activity,
irrespective of its legal form. This includes, in particular, self- employed persons and family businesses engaged in craft or other activities, and partnerships or associations regularly engaged in an economic activity.
Small-Medium Enterprises (SME’s) in general have always played a key role in the
economies of all major industrial societies both in terms of turnover and in level of employment. Small and Medium-sized Enterprises (SME’s) are the seeds for a vital entrepreneurial economy.
SME’s constitute the vast majority of enterprises in Europe. The SME’s are companies of up to 250 employees and which have an annual turnover not exceeding 50 million euro, and/or an annual balance sheet total not exceeding EUR 43 million. The usual definition of SME’s in Europe, make up 99.8% of the approximately 19 million enterprises of the European Union. What is more important, 93% of companies are micro-enterprises having less than 10 employees. Micro-enterprises provide 35% of the total employment in the European Union (EU), ahead of large companies that employ 34% of the total. Even more significantly, micro-enterprises have added employment during the last 10 years up to 2000, while all other segments of enterprises have shed employees. Significant numbers of micro-enterprises have also grown into small enterprises (10 to 49 employees) between 1993 and 2000. (ISO, 2002).
Thus, SME’s dominate the European Union economy in terms of number of enterprises, employment, and added value, while they fall behind large companies in direct exports. Micro-enterprises dominate in employment and employment creation. If indirect exports; for example, supplying domestically the direct exporting firms, are taken into account, the SME’s also play a significant role in international trade. (ISO, 2002).
In Sweden during the past ten years there has been a tendency for small and medium-sized firms to slowly increase their percentage of "own risk-bearing capital." Further, small and medium-sized companies in Sweden have been defined as companies with 10-249 employees and whose annual turnover and/or annual balance sheet total does not exceed EUR 10 million. (ISO, 2002).
15
One explanation for this trend is that the return on total capital has increased very quickly; for example, firms generate more money and therefore can use some of this capital to increase the equity portion of their total capitalization. Another explanation is that only small net investments are required; for example, the need for external capital has decreased. Thirdly, firms with a low share of own risk-bearing capital have been forced to improve their financial strength. (Abouzeedan, 2003).
For this reasons, Swedish SME’s need to demonstrate competence, effectiveness
and competitiveness in nowadays changeable businesses. They need to exhibit appropriate knowledge of technology and integration of manufacturing processes to develop new enhanced products that will meet their customers’ demands.
3.1.2 SME’s Challenges
Small and medium-sized enterprises (SME’s) are characterized by low levels of
technological capabilities, arising from inadequate capital investment. As a consequence, there is an inability to ensure product quality and hence meet market requirements. Typically, SME’s hardly have invested in research and development and are oriented towards the domestic market. This description of SME’s, lifted from the 2003 SME Performance Report (prepared by the Small and Medium Industries Development Corporation, or Smidec) is somewhat depressing. (Wei Lian, 2005).
As of 2003, the report reveals, only 10% used ERP software and just 10.1% used
customer relationship software. The numbers are a bit better for manufacturing software though, 13% use computer-aided manufacturing and 24.8% use computer-aided design. But nothing was said about MRP II computer software systems. (Wei Lian, 2005).
The reluctance of most SME’s in manufacturing to use MRP II more aggressively
has long mystified government development bodies and Information Communication Technology (ICT) vendors alike. The many campaigns conducted in the past to boost ICT capabilities in SME’s have yielded insipid results at best, as shown by the report. (Wei Lian, 2005).
Particularly small organizations greatest challenge it’s to survive or to fail as a
function of their adaptability to the marketplace and whose systems and subsystems are integrated; specially, the ones related to the customer and manufacturing. Those organizations who can interpret these patterns in the environment, adapt their structure and their strategy to suit those changing patterns will survive and succeed. Governments around the world are placing increasing importance upon the success of small business entrepreneurs and providing increased resources to support this emphasis. It has been widely recognized that small firms' survival and success is crucial to any nation's economic stability and Sweden is not the exception.
In order to success in the hard challenges that SME’s have to face, these kinds of
enterprises have to create a long-term profitability. In order to do that, the MRP II computer system is one of the most important solutions available to integrate the manufacturing system and increase the effectiveness of the organization. The next figure shows how the MRP II contributes to the long term profitability of a company.
16
Fig. 3.1 Relationship between a MRP II system and SME long term success. (Source: own
creation)
3.2 Information and Communication Technology (ICT)
3.2.1 What is Information and Communication Technology?
Information technology (IT) or Information and Communication Technology (ICT) is a broad subject concerned with technology and other aspects of managing and processing information, especially in large organizations. (wikipedia.org, 2006).
In particular, IT deals with the use of electronic computers and computer software to convert, store, protect, process, transmit and retrieve information. For that reason, computer professionals are often called IT specialists, and the division of a company or university that deals with software technology is often called the IT department. Other names for the latter are information services (IS) or management information services (MIS). (ICT, 2002).
The availability of adequate Information and Communication Technology (ICT) skills is an important condition for the competitiveness of enterprises. There is a growing demand for skilled people as a result of the fast developments in ICT. The demand for people with ICT and e-business related skills are increasing around the world and the shortage is creating barriers to economic growth and job creation. The digital economy is not confined to a single business sector but is a new economic model where digital technologies and the Internet are ubiquitous across all areas of industry. New technologies are being used by a growing number of companies of all sizes and sectors, as well as public administrations and individuals, and electronic commerce is increasingly becoming part of the regular business practices of European enterprises. (ICT, 2002).
SME long term profitability
Potential success factors
MRP II adoption challenges
MRP II adoption benefits
Competitive advantage
Industry Structure
Organizational context
Industry nature
17
3.2.2 Computer systems development
As organizations continue to seek ways to improve their overall performance, and
new computer technology pressures industry to update and overhaul information systems, computer applications to support manufacturing have developed rapidly in recent years. Relatively simple materials requirement planning systems were first introduced in the 1960’s. (Nah, 2002).
As the capabilities of computer technology continued to increase, more modules were added to integrate other organizational/business functions into manufacturing-support computer systems. Following this route new software systems appeared, these computer systems are more commonly known as Manufacturing Resources Planning (MRP II) and were introduced in the 1980s with an emphasis on optimizing manufacturing processes by synchronizing the materials with production requirements. MRP II included areas such as Shop Floor and Distribution Management, Project management, Finance, Human Resource and Engineering, among others. (Nah, 2002). Today, some companies are upgrading and maintaining their current MRP II systems while others are installing new client/server networks within their organization. The most common of the new MRP II-type software is generally known as ERP, or Enterprise Resource Planning. These computer systems require a large financial investment as well as organizational commitment in training, changing processes, and adapting to the new technology. Of all these restrictions, the most important of why small and medium companies can’t implement an ERP is the large financial investment as it will be explained. (See section 3.2.6).
The widespread use of computers in industry today presents a need for developing increased knowledge of how to effectively apply manufacturing resource planning, client/server systems, Computer Integrated Manufacturing (CIM) and computer applications in general.
Quite often, computer applications change the way work is performed. Industrial engineers have been traditionally involved in “the design, improvement, and installation of integrated systems” which link people, materials, information, equipment and energy (Hodson, 1992). Within the field of industrial engineering, computers have long been used as decision making tools, but the overwhelming influence and potential of computer applications and computer support systems present a broad area in which knowledge of productivity and performance factors need to be developed. (Hodson, 1992).
3.2.3 What is a Manufacturing Resource Planning (MRP II)? The firs thing you need to learn about “MRP” is that there are actually two of them.
Usually referred to as MRP and MRP II- or Little MRP and Big MRP as some would say- These common manufacturing acronyms stand for material requirement planning and manufacturing resource planning, respectively. (Turbide, 1990)
MRP is a well-defined process or set of calculations that is used to develop plans for the acquisition of the materials needed for production. MRP II in the other hand is an
18
information control philosophy that is often translated into software products containing, among other capabilities the MRP calculation function. (Turbide, 1990)
MRP II integrates production operations-inventory production control, purchasing with production planning such as MRP, Capacity Planning and Master Scheduling. It may also include costumer service- order entry, sales analysis, forecasting- with financial applications. The total is a single information control system that shares data among the various applications for the mutual benefit. (Turbide, 1990)
Manufacturing Resource Planning (MRP II) is a structured approach to optimize a
company’s internal Supply Chain. The MRP II is a method for the effective planning of all resources of the manufacturing company. Ideally it addresses operational planning in units; financial planning in money terms, and has simulation capability to answer “what-if” questions. It is made up of a variety of functions, each linked together: business planning, production planning, master production scheduling, material requirements planning, capacity requirements planning and the execution systems for capacity and priority. Outputs from these systems would be integrated with financial reports, such as the business plan, purchase commitment report, chipping budget, inventory production in money terms, etc. Manufacturing Resource Planning is a direct outgrowth and extension of a Material Resource Planning (MRP). (Higgins et al, 1998).
The software, if implemented fully across an entire enterprise, connects the various
components of the enterprise through a logical transmission and sharing of data. When customers and suppliers (internal or external) request information that have been fully integrated throughout the Supply Chain or when executives require integrated strategies and tactics in areas such as manufacturing, inventory, procurement and accounting, MRP II systems collate the data for analysis and transform the data into useful information that companies can use to support business decision-making. MRP II systems, if implemented successfully, enhance and redesign business processes to eliminate non-value-added activities and allow companies to focus on core and truly value-added activities. (Broatch, 2001).
Another definition according to (Tremblay, 1991), a MRP II is a system designed
for managing all the resources of a manufacturing company. It consists of a comprehensive set of planning tools and techniques which integrate all functional areas of an organization. To maximize this integration, powerful software systems provide the capability to collect, analyze and share critical data within all manufacturing business functions. These business areas include finance, production planning, plant operations, purchasing, engineering, shipping, marketing and sales.
An automated factory is driven by the computerized database and, as a result, inaccurate data has a direct and immediate effect on the manufacturing operation. (Douglas, 1988). In this context, the focus of MRP II computer systems is on the efficiency and effectiveness of the internal processes. It offers a way to streamline and align business processes, increase operational and manufacturing efficiencies and bring order out of chaos. (Nah, 2002).
In a traditional business process, after a customer order is received, the order information flows from department to department through order entry, manufacturing, warehousing, distribution and finance until the product is delivered to the customer and
19
the payment is received. The key elements of the Supply Chain have been controlled by separate and disparate information systems that could not communicate with one another. Not only did the companies not take an integrated view of their own business processes, but they also had an equally vague understanding of how their systems relate to the systems of their suppliers, competitors, business partners, distributors and customers. Hence, these transactions are typically carried out with minimal or no shared business processes. (Nah, 2002). MRP II computer systems change the visualization of how the business must be done; it totally incorporates the internal Supply Chain to help the integration of the core business processes of an entire company into a single software and hardware system. Customers, suppliers and business partners are consciously included in the business process, systems manufacturing operation and systems manufacturing development. This visualization is illustrated in the next figure (Figure 3.2):
20
Fig 3.2 Skeleton framework of a MRP II concept. (Source: Plenert, 1996).
Business Planning
Aggregate Sales
Planning
Resources Requirements
Planning (RRP) feasible
?
Aggregate Production Planning
Yes
Master Production Scheduling (MPS)
Rough-cut Capacity Planning (RCCP)
feasible?
Yes
No
No
Material Requirements Planning (MRP)
Capacity Requirements Planning (CRP)
feasible?
Yes
No
Order Scheduling
Order Release e.g. Input-Output-Control
Order and Capacity Control
feasible?
Yes
No
Aggregation of products
Planning process Feedback
Product groups
and items
Part subassemblies
Operations
Operation products
21
MRP II systems minimize the time and effort required to process business data and maximizes the application of that information. By facilitating data exchange throughout your organization, a MRP II system enables you to coordinate such crucial activities as production planning, material planning, capacity planning and shop floor control.
The functions of an MRP II system can be divided into three groups. These represent the three levels of management planning and execution, which are:
1. Top management planning: high-level strategic plans. 2. Operations management planning: detailed and specific plans. 3. Operations management execution: executing the detailed and specific plans.
(Source: Plenert, 1996). .
To summarize, MRP II systems can support an organization in six main ways:
First, they support organizations by integrating manufacturing information flows (such as operation information, inventory information, production planning, materials planning and internal supply chain information) and making it available to the entire organization (Davenport, 1998).
Second, they integrate diverse primary business activities, functions, processes,
tasks, and workflows as well as secondary activities with primary activities. (Davenport, 1998).
Third, they serve as a common data repository (master data) for organizations
(Scheer, 1998). A data repository for an organization is that it may define the format of the data, which makes communication and interpretation of easier.
Fourth, they specify how organizations should conduct their business based on a
best manufacturing practice reference model (Kumar & Hillegersberg, 2000).
Fifth, they reduce the number of logical computer based information systems (Joseph & Swanson, 1998) and replace old legacy systems (Markus & Tanis, 2000).
The last and maybe the most obvious support is that they deliver functionality
and effectiveness per se.
3.2.4 Field Benefits of the MRP II system
Predictable Financial and Operating Performance: Variability in business
performance is inefficient and costly. Planning and executing the plans, using information to support the business objective, means that the resulting day-to-day business operations occur by plan, not circumstance, and happen predictably. Predictable performance results in improved customer service and customer satisfaction, with time spent improving, rather than maintaining, the business at the current level. The need to expedite or excess inventory to cover inefficiency can be a past business practice. Providing firm, visible schedules can reduce premium shipping costs, extra set up time and overtime for your
22
suppliers; improved schedules help eliminate overproduction of parts thereby reducing scrap, obsolescence, rescheduling, and manual reporting. (Jacobi, 1994). In this context, the Predictable Financial and Operating Performance is the most important and essential field benefit of the effective use of the MRP II system because it leads to the effective total integration of the enterprise systems and subsystems. In addition, the Predictable Financial and Operating Performance field benefit provide an better understanding and an easier achievement of the mission and vision of the company in the day-to-day business operations; also, provides the necessary communication skills to have an accurate flow of predictable and operating information needed to the integration of the enterprise systems.
Better allocation of limited resources: If the company knows where they stand,
and know the cause and effect of the different elements of the business, they can allocate limited resources to root causes, not end effects. For example, high inventory is not an element existing alone, but caused by planning, scheduling, and other higher level problems like reductions in raw materials, work-in-process and finished goods inventories. Reductions in expediting rework and overtime can enable reallocation of resources to value added activities. (Jacobi, 1994). To be more precise, the word allocation is close in meaning to the word assign; in addition, assign means to use the right raw material, the right personnel and the right machine in the right moment and in the right time. In the MRP II, the assign function is totally done due to the planning and scheduling modules.
Agreement of problems: If each functional area of a company understands the
step-by-step process from plan to execution, and its effect on other elements, there will be better problem identification and prioritization. Problem solving will also focus on supporting business objectives versus departmental excellence. Facts take less time to manage and don't leave room for lengthy discussion. People will be expected to create, not criticize. (Jacobi, 1994).
Management Efficiency: commonly, 75% of management's time is spent
identifying what the problem is and who is responsible, and 25% is spent on long-term solutions. This is very inefficient. With day-to-day operations monitored and executed as planned, due to understanding, planning, and communication, this ratio reverses. (Jacobi, 1994).
Common Management Objectives: in most companies, departmental excellence
does not equate to company excellence. Departments propose solutions based upon areas, not the total company needs. With MRP II, people's eyes are opened to supporting company goals, not department goals, and understanding the role each of us plays in the company's success. (Jacobi, 1994).
Better and more beneficial communication (fact based communication): the
MRP II management process ties people together and allows them to communicate and work jointly. This is a result of a better understanding of the business process and its objectives. When you operate in an informal system, people are trying to discover what to do, not do it. (Jacobi, 1994).
23
Financial: companies that are successful in MRP II term the installation of the MRP II management process the most significant event in the company's history, more important than any new product or new machine or new management. Continuous examples show over a 250 percent return on investment. If you do not believe this can occur in your business, think of the effect on your business if your main competitor was able to achieve a 95 percent level of performance in each of the areas that MRP II addresses, such as customer service, inventory accuracy, and master schedule performance. (Jacobi, 1994).
3.2.5 Limitations of MRP II systems
Expertise needed to implement and use effective MRP II systems: a basic
assumption is that the expertise exists within companies to understand and work with advanced MRP II systems and that training can be easily found. (Higgins et al, 1998).
Lead times: they can be specified and (for optimal use) the overall product
delivery time will be longer than the composite lead times of components. MRP II uses inflated lead times in the explosion process and indicate that orders should be executed sometime between the planned start and due sates. That is, the actual time intervals are shorter than the planned time intervals. These times are estimates, and unfortunately MRP II users often treat these lead times as being very precise. In the current manufacturing environment, lead times are continuously decreasing and the customer interaction with companies requires that very accurate planning and leads time calculations need to be in place for the successful customer satisfaction levels to be achieved. (Higgins et al, 1998).
Design of the production environment, routeing and quality information: the
areas of production environment design, the routeing information and attention to some quality issues are not addressed in the MRP II framework. MRP II type systems tend to assume that the environment exists as is and is not subject to change. This gives rise to the need for a production environment design element in the factory coordination layer of the manufacturing planning and control hierarchy. (Higgins et al, 1998).
Infinite capacity availability: MRP II assumes that infinite capacity is available.
The MRP II approach has simplified the problems associated with the planning of capacity, and can be considered as a materials-oriented planning framework. However, this framework is still suitable for many companies that have mainly a materials planning problem. (Higgins et al, 1998).
Batch and lot sizing: many implemented MRP II systems tend to use the ideas of
economic batch quantities after calculating the planned order quantities. Batches are larger than is necessary in order to offset the supposed cost of set-up and inventory. (Higgins et al, 1998).
24
3.2.6 Without MRP II
Orders, promised customers on certain dates, are often not fulfilled, and the first the sales staff is aware of this is when the customer calls to ask where is the order. (Higgins et al, 1998).
Some data is deliberately entered to the system as due two (2) weeks before really needed, because everyone knows the factory has a serious backlog. (Higgins et al, 1998).
People heavily rely on hot lists and shortage lists. (Higgins et al, 1998).
People place heavy reliance on paperwork that does not go through the computer system. (Higgins et al, 1998).
Inaccuracies in inventory cause production problems. (Higgins et al, 1998).
Money gets tied up in unwanted inventory, reordered because of engineering inaccuracies. (Higgins et al, 1998).
Expensive rush orders are placed to replenish inventory the computer did not know was needed, because engineering changes were not processed correctly, data was not kept current. (Higgins et al, 1998).
When management locates inaccuracies in inventory, past due, deviations, wrong prices ... it can be almost impossible to figure out how come they got that way, and how long they have been that way. (Higgins et al, 1998).
Profit picture is wrecked by inaccuracies in bill of materials and transaction reporting. (Higgins et al, 1998).
Setup of machinery to change to a different product is time consuming, but production runs get interrupted for higher priority needs, that were not known to the work force at time of earlier change in setup. (Higgins et al, 1998).
At end of month, there is a huge workload for people to clean up the system. (Higgins et al, 1998).
Overtime is usually unplanned. (Higgins et al, 1998).
3.2.7 Why MRP II for SME’s instead of ERP?
Systems and technologies, implemented in recent years, are mainly focused on
facilitating the needs of larger enterprises. For instance, although current EDI technology provides such enterprises with solutions for operational and supply chain integration, it has been found to be rather inflexible and expensive for SME’s.
The reason why the small and medium enterprises use an MRP II computer system
instead of using an ERP computer system is because implementing an ERP system is
25
very expensive and time consuming. It can cost, according to Fortune 500 companies, US$30 million in license fees and US$200 million in consulting fees, not to mention additional millions in computers and networks and can take three (3) years or more before the system yields its maximum benefit (Abdinour-Heml and Legnick-Hall, 2003). It was estimated that the spending on ERP systems in 1998 was about US$ 17 billion. (Nah, 2002).
Although it has been estimated that the payback period for an ERP system typically ranges from one (1) to three (3) years, the evidence is mixed. Meta Group recently surveyed 63 companies, ranging in size from $12 million to $43 billion in corporate revenue, to quantify the payback firms realized from their ERP investment. The data indicated that the average implementation cost was $10.6 million and took twenty three (23) months to compete. In addition, an average of $2.1 million was spent on maintenance over a two (2) year period. Ultimately, their research indicated that companies showed an average Return On Investment (ROI) loss of $1.5 million over a six (6) year period. (Umble and Haft & Umble, 2003).
As we can see, it is impossible for the small and medium enterprises to afford the acquisition and implementation of an ERP computer system. The ERP computer system for the small and medium enterprises is so big for the business to be managed that it will be a waste of investment to implement it; in fact, it will be a huge mistake. For example, a typical ERP contains 8000 to 10,000 configuration tables and 800 to 1000 business processes. (Nah, 2002).
For this reason, the only way for the small and medium enterprises to facilitate the integration of the different systems and subsystem which operates in the manufacturing and organizational aspects is the implementation of a MRP II computer system.
3.3 Systems Integration
3.3.1 The myth of integration
For the most part, integration is used in organizational theory to define the level of
collaboration between specialized units or individuals. Firms develop functional specialists that tend to have patterns of behavior and thought that are in tune with the specifics of their job and training. The different specialists may have conflicting thoughts and patterns about getting the job done. Integration, then, involves achieving the coordination and collaboration of these specialists through mechanisms such as communication and conflict resolution. (Lawrence & Lorsch, 1969; Walker & Lorsch, 1996).
The ability to determine the impact of the integration of MRP II and ERP systems on organizational effectiveness would be of great importance from both theoretical and practical perspectives. In the publication of (Hedman J. & A. Borrell, A., 2002), this determination is difficult for several reasons:
It is not possible to draw explicit conclusion from the IS benefit research on the impact of MRP II and ERP systems.
26
The inconsistent and contradictory findings from research on information technology and organizations.
The lack of research on the field of effectiveness of the MRP II and ERP
systems makes it difficult or even impossible to draw conclusions with regards to a specific organization.
The complexity and comprehensiveness of MRP II and ERP systems as such.
The measurement of the effectiveness of an organization is an elusive, complex
and socially constructed concept.
3.3.2 Enterprise integration
All organizations face the strategic challenge of achieving sustained profitable growth. To meet this challenge, organizations must develop capabilities that enable them to integrate completely and be able to compete in their market space. Although much has been written by academics and practitioners on enterprise integration, the actual integration of systems and subsystems in practice is less frequent and less deep than one might expect.
There is widespread agreement that for MRP II and ERP effective use to succeed, organizations need to be integrated. (Willcocks and Sykes, 2000). For this reason, three key attributes emerge from the subset of the literature that focuses on enterprise integration. The first is the characteristics that define enterprise integration. The second is the scope of enterprise integration. The third theme is the range of organizational elements that would need to be coordinated, and hence changed in some way, as an integral part of an organization’s integration plans. Each attribute is examined below.
1. Characteristics.
Enterprise integration is linkages between parts of an organization (Fuchs et al., 2000). The parts that are to be aligned include strategic direction, market focus, resources, skills and culture (Porter, 1980). Senior managers establish a clear strategy in terms of its competitive position (Mintzberg, 1987), understand its resources (Hamel and Prahalad, 1994) and identify its processes (Braganza, 2001; Ghoshal and Bartlett, 1995a, b). They ensure that physical and intellectual resources, skills and internal culture necessary to execute the strategy are aligned (Fuchs et al., 2000). Enterprise integration is characterized as cooperation, communication, processes and knowledge between internal teams and functions (Millson and Wilemon, 2002).
Cooperation involves people in different functions creating common goals, acting cohesively and avoiding creating problems for each other (Millson and Wilemon, 2002; Pinto and Pinto, 1991). Enterprise integration is characterized as coordinating cross-functional processes that fulfill stakeholders' expectations (Braganza and Lambert, 2000; Hammer and Champy, 1993). The notion of cross-functional coordination goes beyond setting up multidisciplinary project teams (Malone et al., 1999). It impacts on the structure of the organization (Davenport and Nohria, 1994), roles and responsibilities (Brynjolfsson et al., 1997), power structures (Buchanan, 1997),
27
workflows (Hammer and Stanton, 1999) and information technology (Guha et al., 1993).
Communication refers to the two-way flow of information, horizontally between
teams and across functions, and vertically between senior managers, departmental heads and people on the shop floor (Robinson and Weldon, 1993; Teigland and Wasko, 2001). Communication between people is often mediated with technology; however, this can have adverse effects on communication where; for example, organizations have evolved internal islands of information (Sarker and Lee, 1999). While the need for effective communication is recognized as vital (Newell et al., 1998) evidence that it is inadequately managed in organizations (Andersson and Bateman, 1997).
Enterprise integration is considered the synchronization of knowledge across functional boundaries (D'Adderio, 2001). Sources of knowledge can be external or internal to the organization (Leonard, 1998) and can reside at several levels: individuals, group, functions, process, organization and the industry. Both explicit knowledge, which is structured, codified and encased in databases, manuals and tacit knowledge; namely, behaviors, routines and people's innate skills and abilities need to be aligned. Enterprise integration from a knowledge perspective must recognize the inherent tensions that exist and arise when new knowledge is being created. The creation of knowledge requires people in different parts of the organization to accept that their existing knowledge may no longer be relevant. New knowledge impacts on practices, locally at team, department or functional levels within a strategic business unit, or globally across business units (D'Adderio, 2001). The need for change is implicit in the knowledge perspective of enterprise integration. The changes can affect the strategy, structure and behaviors across the organization (Earl, 2001).
Enterprise integration, from the process perspective, can be radical and incremental (Jarvenpaa and Stoddard, 1998). This perspective of enterprise integration is associated with technology developments or enhancements that enable cross-functional interaction and communications. Many of these IT implementations have been shown to fail; consequently, many organizations have outsourced not only the IT function (Lee, 2001), but also other functions such as human resource management, administrative services and call centers (Marshall, 2001). Outsourcing functions involves senior managers taking a decision to contract out or sell the functions, assets, people, information, IT and activities, to a third-party supplier who, in return, manages the people and assets and provides a service for a financial return (Loh and Venkatraman, 1992). Outsourcing a function that forms part of a business process without understanding the relationship between the two makes integration problematic.
2. Scope.
Studies of the scope of functions to be integrated have been undertaken from the perspective of one function in relation to either one or more other functions. This is exemplified by two studies. The first examines the integration between manufacturing and marketing from the manufacturing function's vantage point (Weir et al., 2000). The other is a study of the research and development function's relationships with marketing and manufacturing (Sherman et al., 2000). Researchers have contributed by studying functional dyads such as the marketing function's collaboration with the R& D function and vice versa (Kahn and Mentzer, 1998). Product development has been studied, as it
28
requires cross-functional involvement (Sherman et al., 2000). These studies have attempted to show the relative importance of integrating combinations of functions. The studies demonstrate that significant benefits can be gained from cross-functional integration, in terms of reductions in product development times (Sherman et al., 2000), higher profits (Weir et al., 2000), successful marketing programmes (Millson and Wilemon, 2002), better relationships with customers and suppliers (Narasimhan and Das, 2002) and being better able to respond to industry changes. The integration of strategic business units involves the coordination of separate elements of each business unit so that efficiencies or market prominence can be achieved (Fuchs et al., 2000).
Strategically, SBU (System Business Unit) integration combines competencies and resources from different units to exploit emergent opportunities, develop innovative products and services or extend current strategies (Burgelman and Doz, 2001). Operationally, SBU integration aligns and coordinates initiatives in each unit (Herman, 2001). The lack of SBU integration is noticeable through their Web sites: A manufacturer discovered there were 175 different Web pages on its Web site presenting information about an important industry trend. The pages, which had been developed by various business units from around the world, presented contradictory claims and projections (Herman, 2001). Senior managers face obstacles when implementing SBU integration. A business unit might need to alter its strategic trajectory, which the leaders of that business unit might not be willing to do. There is also the need to share or release resources to pursue integration aims. Consequently, achieving SBU targets becomes difficult for people left behind. Internal control systems such as budgets, targets and incentive schemes prevent SBU integration (Eisenhardt and Brown, 1999). Hence, control systems need to change to ensure boards prioritize SBU integration (Burgelman and Doz, 2001).
3. Elements.
Researchers have identified organizational elements that would need to be integrated. The organization’s strategy is a key element and other elements such as culture, resources and products should be aligned to it (Fuchs et al., 2000). Others suggest that each function's strategy should be aligned into a single coherent document (Kahn and Mentzer, 1998). Other studies show that senior managers might have to create structures that align scarce resources such as finance, people, skills, capital equipment and management time (Burgelman and Doz, 2001; Van Grembergen and Van Belle, 1999). There is a need to integrate day-to-day routines with control mechanisms, incentive and reward systems to ensure effective cross functional coordination between people (D'Adderio, 2001). Another set of elements that need to be aligned is intangible resources. They include the organization’s reputation, intellectual capital, brand and patents (Burgelman and Doz, 2001; Fuchs et al., 2000).
3.3.3 Manufacturing integration
The manufacturing integration involves several models and tools that have been
developed through the years. These kinds of models are for example: QFD (Quality Function Deployment), MFD (Maintenance Function Deployment), TQM (Total Quality Management), TQMain (Total Quality Maintenance), TPM (Total Productive Maintenance) and OEE (Overall Equipment Effectiveness). The development of these models have been creating a great source of accurate data for the manufacturing
29
processes in order to take reliable fact-based decisions but without understanding the interactions between the systems and subsystems involved in the manufacturing processes, these models won’t be so useful. For this reason, it is more important to understand the relationships between the systems and subsystems involved in the manufacturing process to be able to recognize the potential integration of the same to assure and reach the strategic goals of the enterprise.
There are several systems and subsystems in the manufacturing processes, but the three most important that the small and medium enterprises must understand and take into account are: Maintenance, Production-Logistics and Quality. These relationships and interactions are well explained in the next paragraphs.
1. Maintenance and Production-Logistics.
Due to the tough competition in the markets, the demand for higher quality product, fast delivery and more competitive prices has increased. Therefore, manufacturing plants became more automated, integrated, and flexible. This can be seen clearly form the increasing trends of using concepts such as CIM (Computer Integrated Manufacturing), CAD/CAM (Computer Aided Design/Manufacturing), JIT (Just in Time), etc.
Actually the disturbances and breakdowns occurring in the production system form
the basis for an analysis of the factors governing the design of the interface between production/operation and maintenance. From the breakdown and disturbances all possible cost factors can be identified. Implementing an efficient maintenance approach will result theoretically in minimum failures, this means that product can then be produced, when they are needed; there will no need for additional storage (inventory) nor redundant machines. One of the most serious problems that face the production department is how to keep the stability of their production schedules that could be affected by disturbances due to unplanned stoppages. Maintenance planning needs to be an integral part of the overall business strategy, in order to be coordinated and scheduled with the manufacturing activities. Historically, production management usually looks at maintenance as lost production time; on the other hand, maintenance management tries to place constraints on production to maximize equipment reliability.
In contrast, maintenance may affect the supply chain management activities as long
as it influences delivery schedules. The production lead-time is highly affected by the maintenance function effectiveness through its impact on the availability of the manufacturing equipment and material handling equipment. Because of this impact in the lead-time, the production-logistics inside of a company is affected by the maintenance in the inventory management and control, spare parts inventory, capacity management and production scheduling.
Finally, maintenance activities will affect the production-logistics function and
product quality, which in their turn affect the profitability. Also, using the most cost effective maintenance policy, planned and unplanned stoppages in the production system can be reduced to a minimum level, this means that the product can then be produced, when they are needed; there will no need for additional storage (inventory) nor redundant machines. As a result, these will result in a great saving for the company.
(Al-Najjar, B. 2002a).
30
2. Maintenance and Quality.
Quality is being recognized as one of the most important factors in competitiveness
and long-term profitability. The role of maintenance in this context can’t be neglected. Equipment, which are not well maintained, experience speed losses or lack of precision or both, hence, can’t produce according to the stated technical specifications that fulfill customer expectations. In fact, several studies have shown that maintenance is classified as one of the main groups of causes of quality defects. Quality and condition of the production equipment are closely related; a machine can be declared in failure status if it is not able to produce quality products although it runs.
The former means that a maintenance action will be performed when the amount of
deviation in the product characteristics used to measure quality reaches a given threshold value. This will enhance production quality by reducing the deviation from the target. Machine in poor condition leads to a high production variance, and this leads to diminished quality. The product quality variation represents one source of data, among others, about potential failure in the machine itself, which can be utilized as a form of quality monitoring, especially when the deviations are associated directly with specific failure mode.
(Al-Najjar, B. 2002a).
3. Quality and Production-Logistics. An effective and efficient production process can be achieved assuring the quality of
the process and in that way the product quality will achieve the customer needs. The clearest relationship between production and quality is in the model QFD. Resuming, QFD is a model that was developed to transform the spoken and unspoken customer needs into manufacturing processes to achieve the quality needed. QFD empowers organizations to exceed normal expectations and provide a level of unanticipated excitement that generates value. That means that a good design and development of a production manufacturing process will lead to achieve the final quality required to stay competitive in the market.
The logistics play an important role in the scheduling production part, if the production schedule is not well developed, the production process probably will have to increase or decrease the speed of the machines to achieve the demand forecasted. According to this, poor quality will be produced for sure and as we know poor quality products necessitates additional production work, higher scrap and rework which increases production costs, decreases the time available for maintenance, and worsens the condition of the machinery. This means that even with the new technological equipment, if the production-logistics system is not well designed with an effective maintenance policy, then the equipment will not keep producing with accepted quality.
(Al-Najjar, B. 2002a).
31
3.3.4 Impact of manufacturing integration in the enterprise
integration
Obviously, the manufacturing systems and subsystems will affect and have an
impact in the enterprise integration. This impact can be observed in four different dimensions: dynamic, local, inimitable and opportunistic.
These dimensions are constructed to bring into focus the contribution a system or a subsystem makes to future competitiveness (Barney, 1991) and whether the impact of the system or subsystem will be felt at a strategic or operational level (Hamel and Prahalad, 1994). Hence, an enterprise integration strategic purpose can be understood along two perspectives: its contribution to improving future competitiveness and its consequences on the organization. According to this, the next figure (Fig. 3.3) will illustrate how the four different dimensions impact the two strategic perspectives.
Fig.3.3 Impact of manufacturing in the enterprise integration. (Source: Bragaza, 2002).
Inimitable dimension: These develop capabilities that definitely enhance the
organization’s competitive position. These capabilities are very difficult to mimic and are sustainable over time. The effects of these capabilities are to reshape the organization’s future strategic direction, aims and objectives. The impact of inimitable enterprise integration initiatives will be felt across the organization and its industry, as the basis of competition is changed. (Bragaza, 2002).
Inimitable integration dimension require clarity of future strategic direction. This involves setting a new strategic direction and changing the very basis of competition in the organization’s sector or industry. This includes defining new customer segments, value propositions and service offerings. Internet technologies can be particularly effective in enabling a significant degree of knowledge coordination across functions, where tacit knowledge is shared and developed to create new knowledge. This type of initiative calls for ICT’s-based systems that are properly integrated across the organization and are aligned to the processes.
Local
Inimitable Dynamic
Opportunistic
Contribution to Future Competitiveness
Uncertain/ Low
Certain/ High
Operational Strategic
Consequences for the organization
32
Local dimension: These lead to capabilities that make a minor contribution to
the organization’s competitive position. These capabilities are easily replicable and replaceable. They can be sourced from the organization or externally. The consequences of local dimension lead to operational efficiencies and cost reductions. The impact of local initiatives will be felt by a team, department or specific function (Bragaza, 2002). For example, the absence of one person, the acquisition of a new machines, the implementation of a new policy, etc.
Dynamic dimension: These deliver capabilities that are specifically identified as
being necessary to maintain the organization’s current competitive position. The consequences of these enterprise integration initiatives are to ensure capabilities are aligned with and maintained to the same levels as key competitors. This continuous alignment and re-alignment is in terms of the quality of the capability and the ways in which the capabilities are combined to avoid losing competitive advantage. The impact of these enterprise integration initiatives will be felt across the organization (Bragaza, 2002). For example; the change of a product-push production to a customer-pull-oriented production.
Opportunistic dimension: These create capabilities that have a high degree of
uncertainty in terms of their contribution to the organization’s future competitive position. The capabilities developed by these initiatives may be vital to future success but then again may not be. The consequences of opportunistic enterprise integration initiatives are whether capability is proven to be critical to future strategic success; its effects can be far reaching. On the other hand, where these initiatives develop capabilities that do not contribute to maintaining the organization’s current or future competitive position, they should be stopped (Bragaza, 2002). For example, the customer behavior, market preferences or social trends.
3.3.5 Integration by Information Communication Technology
(ICT)
The increasing importance of innovative information communication technology
(ICT) for economies and societies has been attracting considerable attention both from academia and practitioners. In the last has extensive teaching and number of decades ICT’s have deeply affected the way business is performed and the way that organizations compete. In particular, the advance of the Internet, with its vast range of potential services and applications, has led to a transformation of corporate strategy the middle of the 1990s, as reflected in the increasingly common use of terms such as industry convergence, virtual corporations and electronic commerce. (McIvor, 2002).
The rise of the Internet and electronic commerce has created one of the most challenging environments for innovative behavior. The connectivity associated with the Internet has the potential to bring together an industry's customers and suppliers in a unified and economically perfect marketplace. The significant difference between the Internet and other forms of computer networks is that the open standard allows seamless integration between many incompatible computer applications and legacy systems. Organizations that want to exploit Internet technology opportunities are advised to
33
develop strategies to progress beyond brochure-ware and electronic catalogues and offer complete services such as order fulfillment. (McIvor, 2002).
With the advent of Internet-enabled communications, it is now possible for an organization to establish links with other organizations at significantly lower costs than with previous technologies. For example, an organization offering a range of products and services can now create an electronic catalogue on its Web site in order to achieve global reach. Innovations in Internet technologies such as intranets and extranets are critical in co-coordinating the activities of cross-functional teams across organizational boundaries. Electronic commerce can reduce the costs associated with closely integrating buyers and suppliers and through electronic networks organizations can achieve greater integration at the buyer-supplier interface. Electronic commerce can reduce an organization’s costs in a number of ways. It reduces procurement costs, both by making it easier to find the lowest priced supplier and through efficiency gains. It is much less costly to place an order on-line, and there are likely to be fewer errors in orders and invoicing. Also these benefits are not confined to large organizations; Internet technologies and electronic commerce provide a vehicle for enabling small and medium enterprises (SME’s) to behave in a more creative and innovative way. (McIvor, 2002).
The exploitation of Internet technologies provides an enormous opportunity for SME’s to access the global supply networks of larger firms. Although the potential of the Internet to provide greater levels of integration (manufacturing and organizational) is widely recognized, in practice it can be quite difficult to achieve.
On the other hand, many organizations have invested significant sums of money into MRP II and ERP systems. These are off-the-shelf packages that can be configured to match the needs of organizations (Markus et al., 2000). At the heart of ERP packages is a database that enables organizations to structure data so that these can be shared across several applications. The database and its accompanying modeling and mining tools provide the opportunity for information to flow through the organization.
Technological advances have created new opportunities in integration and management of all aspects of supply chains, including; for example, procurement, manufacturing, inventory management, integrated product development and logistics. In fact, organizations have begun to embrace the notion that competitive advantage is a function of supply chain efficiency and effectiveness. Suppliers are a significant source of innovation and provide scope for differentiation. It is possible for organizations to integrate their suppliers in unique ways across organizational boundaries to obtain an advantage over their competitors. The exploitation of Internet technologies provides a vehicle to achieve this greater integration and create unique sources of leverage in the value chain. (McIvor, 2002).
34
Chapter 4. Evaluation models This chapter gives the opportunity to the reader to understand the general idea about the evaluation models that we used to measure the effectiveness of the MRP II system and the enterprise systems integration.
4.1 Brief Strategy
We will handle two different things in the next chapters. We will use a model of our own creation to evaluate the effectiveness of the MRP II computer system that Davidsons Trickery AB is using. Furthermore, with the analysis of the MRP II effectiveness we will evaluate and justify the system integration with a model called CVM (Competing Values Model) that gives a holistic view of the company in order to give leverage points for the manufacturing and organizational integration. In other words, this process could divide the research question in two, from:
“How can MRP II-type computer systems be used effectively to support the manufacturing and organizational integration?”
To: Is the MRP II-type computer system being used effectively?
How does this affect (or support) the manufacturing and organizational integration?
We will test the usages effectiveness of the MRP II in the case company in order to answer the first question. Then the CVM (Competing Values Model) will state a degree of enterprise and manufacturing integration, this model will point the weaknesses or the strengths, and give easier solution frames if allocate problems.
Fig. 4.1 Graphic Strategy. Relationship between Competing Values Model and MRP II
Function Model (Source: own creation).
35
4.2 MRP II Functions Model
After searching through many information sources we realized that there is not
universal parameters to evaluate a MRP II software. However, the definitions stated in the theory chapter are clear and all of them point to the same direction. Therefore, we defined what it stands for an MRP II computer system for the purpose of this case study (See Section 1.5) and we decided to evaluate the effectiveness of the most essential functions.
According to our theory chapter, the MRP II integrates manufacturing/production operations with inventory, production control, purchasing with production planning such as Material Requirement Planning (MRP) and it may also include customer service, order entry, sales analysis, forecasting, accounts payable and receivable, payroll, among others (Turbide, 1990). We take the main functions from MRP II definitions like this one and we develop the next model.
Fig. 4.2 MRP II Functions Model (MRP II type system). (Source: own creation).
We believe that this graphic definition of what an MRP II essentially does will
provide an easier understanding to the reader and it will improve the order and the understanding of the next chapters.
The development of the model does not necessarily means that extra modules in the MRP II software of the case company wont be described or taken on account for further recommendations, however for those modules (if existent) we will provide only qualitative data.
Customer Order Management
Planning
Forecasting
Inventory
Purchasing
Production
Finance Accounting
Costing
Master Production Schedule
Product Data
• Items • Bills • Facilities • Routings • Etc.
36
4.3 Competing Values Model (CVM)
An evaluation of the effectiveness of MRP II systems on manufacturing and
organization integration is difficult. For example, some of the problems which arise, are the complexity and comprehensiveness of MRP II systems, the lack of empirical research on the impact of MRP II systems on organizational effectiveness, and the shortcomings of traditional multivariate methods (such as factor analysis) for solving problems related to organizational effectiveness (Campbell, 1977).
Traditionally, organizational effectiveness was defined as meeting or surpassing organizational goals (Bedeian, 1987). The goal approach has dominated organizational effectiveness studies; despite criticisms (Hall, 1980) that organizations have multiple goals (Cameron, 1981) and that criteria for measuring effectiveness are ambiguous (Meyer, 1985). Alternative approaches to organizational effectiveness studies have emerged to deal with both these problems and others; for example, the resource approach (Cunningham, 1978), the internal process approach (Ostroff & Schmitt, 1993), the stakeholder approach (Tusi, 1990), and the Competing Values Model (Quinn & Rohrbaugh, 1981; 1983). Despite these efforts, it is still difficult and potentially controversial to quantify (Cameron & Whetten, 1983). Effectiveness criteria can be described in very general and broad terms; for example, survival or profit, or in more narrow terms based on functions, hierarchical levels, roles, or processes in organizations based on the participants and constituents.
(Mende et. al, 1994) emphasizes that the evaluation of an existing system should not
be limited to the system itself but must include the business context and the way it is used within the organization. Users and business managers are assumed to have an insight to the business context and; therefore, they should take an active role in the assessment process. In this context, the Competing Values Model is the best option to evaluate a MRP II computer system currently in use.
Initial attempts at evaluation of information systems have been made in the form of
return on investment (ROI), cost-benefit analysis and utility analysis. (Raghunathan and King, 1983) argue that studies based on ROI have been inconclusive and have been criticized because it is unlikely that any single organizational activity is so much a determinant of ROI variations. Available literature shows that there are no reliable methods of making a quantitative-cost benefit evaluation of IT systems. (Weill and Olson, 1989; Remenyi et al., 1991). While IT costs are quite easily determined, it is the benefits which are difficult to quantify due to the scope of the impact of IT. Many researches have tried to link IT effectiveness to user satisfaction but without the planning side it is not enough. In fact, the nature the planning of the IT determines the IS effectiveness. This leads us to conclude that the measurement of the IS systems like the MRP II effectiveness is an issue of high degree of complexity and prior researches appeared to attempt to associate IS effectiveness with all the organizational variables; in other words, the integration of the different systems and subsystems. There is a little understanding of how the actual MRP II systems are evaluated and the impacts that are deployed in all the organization; for this reason, we decided to apply the next evaluation model who warranties the evaluation of the MRP II system effectiveness in the integration of the enterprise and manufacturing systems.
The Competing Values Model (CVM) is based on the hypothesis that there is a
tension between underlying value dimensions (Quinn & Rohrbaugh, 1981; 1983). The first value dimension is focus: internal focus puts emphasis on the well-being of the organization itself while external focus is placed on the organization within of its environment. Structure is the second value dimension: stability refers to the need for top management control and flexibility refers to the need for adaptation and change in organizational structure (Quinn & Rohrbaugh, 1981; 1983). The measures that underlie the value dimensions reflect one of four organizational models: human relations model (HR), open systems model (OS), internal process model (IP), and rational goal model (RG) (See Fig. 4.3). A critical point to note is that while different organizational models reflect different effectiveness criteria, they are not dichotomy. Effectiveness may require that organizations are both flexible and stable, as well as have a synchronous internal and external focus (Quinn & Cameron, 1988). The models reflect opposing views of organizational effectiveness simultaneously.
The HR model focuses on internal flexibility to develop employee cohesion and morale. It stresses human resource development, participation, empowerment, teambuilding, trust building, conflict management, supporting, internally communication, developing individual plans, feedback to individuals and groups, and developing management skills (Quinn, 1989).
The OS model focuses on external flexibility and suggests readiness and flexibility
as the reason by which growth may be gained. Important issues are the acquisition of scarce resources, the support of interaction with the external environment, the identification of major trends, the development of business intelligence, the creation mental models, facilitation of changes, dedication to research and development, the identification of problems, influence the environment, and the maintain ace of external legitimacy through a network of external contacts (Quinn, 1989).
The IP model focuses on internal stability and uses information management, information processing, and communication to develop stability and control. This is
• Cohesion and morale • Human resource
development
Internal focus
Flexible structure
• Innovation and Adaptation • Growth
External focus
Stable structure
• Planning, goal setting, and evaluation
• Productivity
• Information management and coordination
• Control and stability
HRmodel OSmodel
IPmodel RGmodel
Flexible structure
38
done by collecting data (mainly internal quantitative information used to check organizational performance) enhancing the understanding of activities, ensuring that standards, goals, and rules are met, maintaining organizational structure and workflow, coordinating activities, and collecting and distributing information internally (Quinn, 1989).
The RG model is characterized by a focus on external control and relies on planning and goal setting to gain productivity. This includes clarification of expectations, goals and purposes through planning and goal setting, definition of problems, generation and evaluation of alternatives, generation of rules and polices, evaluation of performance, decision support, and quality control, production planning, logistics planning, maintenance policy and motivation of organizational members to enhance productivity, sales support, effectiveness, reduction of cost and maximization of profit (Quinn, 1989).
According to this, our work will be to apply the Competing Values Model (CVM) especially in the IP model phase by using our MRP II Functions Model and show how this model phase supports the manufacturing systems integration and the factors that influence most in the enterprise integration. (See Fig. 4.1 Graphic Strategy. Relationship between Competing Values Model and MRP II Function Model).
4.4 Data gathering methods
Knowing the evaluation model that is going to be applied is not enough to know the
effectiveness of the MRP II systems. Therefore, the question at this point is how we should gather data to measure the effectiveness of the MRP II system.
The individual interviews and on-site observations are effective and appropriate methods to collect data in our research, pointed out in the Section 2.6.2 Empirical Data Collection (See Chapter 2. Methodology). However, certain parts of information should be collected in a different way and survey questionnaires are one of the best approaches.
Therefore, by individual interviews and on-site observations we will gather
demographic and qualitative data of the MRP II software of the case company that will help in the understanding of the analysis and results chapters. In addition, based on our evaluation model we will develop a survey to evaluate the effectiveness of the essential modules of the MRP II software.
39
Chapter 5. Empirical Data In the fifth chapter, we will present the empirical data of our thesis. We collected empirical data through a survey called “MRP II Usage Survey” that is attached at the end of this thesis as an appendix. In addition, we did interviews with our main contact, Mr. Andreas Wijk, Production Manager in Davidsons Tryckeri AB. Also, we will present Davidsons Tryckeri AB, its business and we will explain its MRP II type computer system with all the details of the different modules.
5.1 Davidsons Tryckeri AB
Davidsons Tryckeri AB is a small company, part of a group called Taberg Media Group; small and medium size printing companies distributed around Sweden form this group. The company’s offices and warehouse are located in Smedjegatan 39, Växjö. In addition to Davidsons Tryckeri AB, the Taberg Media Group is composed of Dataform AB (Kumla), 08 Tryck AB (Bromma), Handelstryckeriet AB (Göteborg), Häftdesign AB (Kumla), June-Lito AB (Taberg), Nya Ljungföretagen fsg AB (Örebro), Ruter Media Group (Laholm), Rydheims Tryckeri AB (Jönköping), Tabergs Tryckeri AB (Taberg),
TMG Affärsutveckling AB (Taberg) and TMG Kuvert AB. (http://www.tabergmediagroup.com/?id=432, 2006).
Davidsons Tryckeri AB has nowadays established itself as one of the Smålands’
printing leaders. The company is dedicated to produce brochures of the highest quality with the cheapest cost as possible for magazines, newspapers, advertisements, logos, books and specialized publications depending about the requirements or needs of the customers. Davidsons Tryckeri AB has a turnover under of 20 million SEK per year and 29 employees in Växjö, Sweden.
For Davidsons Tryckeri AB is very important to have high quality in each print they make because the customer has different choices and the competition is hard; in fact, there are 4 more companies in Växjö dedicated to the printing business. In addition, Davidsons Tryckeri AB is aware that the effective use of its MRP II type computer system must give an advantage in the market in order to get more customers, to be more effective, more productive and to raise the quality to be the leader in Småland.
In order to perform the empirical data collection, we contacted Mr. Andreas Wijk, the Production Manager of the company. We found out that the company uses a MRP II type computer system developed in Sweden by Admera Software AB; in addition, this software company is specialized in the development of MRP, MRP II and databases for printing type of companies; in this particular case, the vender supplied the MRP II with some modifications and, according to Mr. Andreas Wijk, is quite accepted. The contact person also stated that the relationship between the vendor Admera Software AB and Davidsons Tryckeri AB is quite good.
40
The Production Manager of Davidsons Tryckeri AB defined the term “MRP II type system” as a primarily computerized materials/production planning and control system integrated with other business areas to achieve a total business system. In this context, the first MRP II type computer system installed in Davidsons Tryckeri AB was between the years of 1975 and 1980 and the initiation for the MRP II installation and development in this company, was done by the top management and production/inventory control management. During all these years of using a MRP II, Mr. Andreas Wijk mentioned that the upper management is highly involved in the knowledge and the implementation of the MRP II giving their entirely support in the use of this powerful system. The investment done in this MRP II was less than $50,000 dollars (375, 000 SEK) and the future investment in MRP II hardware, software and external technical service in the next three (3) years is going to be between $50,000 dollars and $200,000 dollars (between 375,000 SEK and 1.5 million SEK). Finally, he commented that there is no formal training program in the MRP II issues and the training is done on-job with experienced employees.
5.2 MRP II type computer system used in Davidsons Tryckeri
AB
During the collection of the empirical data, visits to the case company took place in
order to get along the MRP II type computer system Davidsons Tryckeri is using. The name of the software is Admera Enterprise V2.5 (Fig. 5.1), the software was developed in Sweden and the Admera offices are located in Växjö. This software was designed specially for printer companies and Davidsons Tryckeri AB has been using it since 2002.
This MRP II runs in a Windows platform environment and allows the user to execute other programs at the same time. Admera looks and behaves just like another Windows menu; it has a head line with the name of the software, a tool bar and the principal window, where the information is divided in lashes. Depending on the operation you are doing, new windows could appear or the use of the toolbar would be needed. The first lash is the front page, “Huvud” (Fig 5.1); there you find the software producer’s name “Admera Software AB” and the login option.
Fig. 5.1 “Huvud” lash of Davidsons Tryckeri’s MRP II, Admera software. (Source: Davidsons
Tryckeri AB).
41
“Kontakter” is the second lash (Fig 5.2) where the contacts information is located and organized by three (3) principal types; employee, client and supplier (anställda, kunder and leverantörer) and there are options to show, sort or create new contacts. Depending if the contact is external or internal the communication options might change.
Fig. 5.2 “Kontakter” lash of Davidsons Tryckeri’s MRP II, Admera software. (Source:
Davidsons Tryckeri AB).
Fig. 5.3 “Offer and Order” lash of Davidsons Tryckeri’s MRP II, Admera software. (Source:
Davisons Tryckeri AB).
“Offer and Order” is the third lash and it is where the economical cycle starts. In type “typ” you can choose to see the calculation in inquiry “förfrågan”, the offers or the orders. The Inquiry screen is used by the sales personal when they are making an offer, which depending on the client may become an order later on. If “Order” is chosen then the screen would show the list sorted by order number (Fig 5.3) with complete data, like name of the costumer “kund” , name of the current job “benämning”, extension “Omfattning”, and the status. The order status is defined by 1=in process or
42
2=completed and divided in thirteen (13) tasks; for example, A=material, C=digital work, I=print, K=print, press, L= after treatment, M= delivery etc. An example of the “Offer” FrontPage screen in detail is given with Fig. 5.4; the only difference with the “Order” FrontPage screen is that the delivery date is not set yet. If the offer becomes an order then this item will go out of the offer and appear in the order list.
Fig. 5.4 “Offer” Front Page screen of Davidsons Tryckeri’s MRP II, Admera software.
(Source: Davisons Tryckeri AB).
In the “Offer” FrontPage screen the user can select between eight new different lashes, for example printing “Trick” (Fig 5.5). In this screen is possible to see estimated times for a certain job in every printer; in this example, the job has a cover, which is printed in GTO 6/f and the other pages in 70x100 Davidsons. Depending on the printer, the hour cost may vary.
Fig. 5.5 “Trick” lash of Davidsons Tryckeri’s MRP II, Admera software. (Source: Davisons
Tryckeri AB).
43
The next screen from the main menu is “Artiklar”, which is in blank since they don’t use it. (Fig 5.6) Fig. 5.6 “Artiklar” lash of Davidsons Tryckeri’s MRP II, Admera software. (Source: Davisons
Tryckeri AB).
Production “Produktion” (Fig 5.7) just like offer/order lash, shows all the orders sorted by order number but it also gives the function “types” so the user can edit the visible items, and all the possible ways to sort the information; by order number, by costumer, etc. In this lash its useful again the 1, 2 system (See “Offer and Order” lash description) used in other screens with the same letters code from A to M (See “Offer and Order” lash description).
Fig. 5.7 “Produktion” lash of Davidsons Tryckeri’s MRP II, Admera software. (Source:
Davisons Tryckeri AB).
44
The user can choose one of the orders shown in the production list (Fig 5.7) and see
details of the order production (Fig. 5.8) Once the order is set the new menu appears where its possible to see all detail of the order production, the way the paper is split, the time needed for printing and such others.
Fig. 5.8 “Produktion” details of Davidsons Tryckeri’s MRP II, Admera software. (Source:
Davisons Tryckeri AB).
Admera software seem to have tools for the decision making and time planning added in the Production menu but they are not used, the actual graphics doesn’t reflect the current situation and are not accurate for the decision making (Fig 5.9).
Fig. 5.9 Decision making and time planning lash of Davidsons Tryckeri’s MRP II, Admera
software. (Source: Davisons Tryckeri AB).
45
Within the production menu, there are also work reports (Fig 5.10). Here the employees update information of the work they have been doing, so it is easy to know who is developing a specific work; in which phase are the jobs at a specific moment; how long is the printing production taking; what are the operators doing and how much actual work a specific job has taken among others. These reports also measure the efficiency of the employees.
Fig. 5.10 Work reports lash of Davidsons Tryckeri’s MRP II, Admera software. (Source:
Davisons Tryckeri AB)
Another feature of the Production menu it’s a current report (Fig 5.11) that can be generated for every job taken. In this feature, the user is able to see the cost against the price, and depending the real cost of every order; the profit can increase or decrease. In the graphic, the offered price is the red line and the expected cost is the green line; for example, if there is a waste of material, then the current cost would be superior to the expected cost of material and the profit would decrease.
Fig. 5.11 Current reports lash of Davidsons Tryckeri’s MRP II, Admera software. (Source:
Davisons Tryckeri AB).
46
The next section after production is dedicated to the raw material, the paper “Papper” (Fig 5.12) where the information and the inventory is registered. Here they count how much paper they have left and how much they need, but this section doesn’t have historical data associated with the orders produced with a specific type of paper. In addition, is not completely automatic since the inventory needs skills from the operator to decide what amount is in inventory and when to ask for it.
Fig. 5.12 “Papper” lash of Davidsons Tryckeri’s MRP II, Admera software. (Source: Davisons Tryckeri AB).
Davidson Tryckeri AB has historical data stocked in their Admera software (Fig
5.13). They have been collecting this data since the implementation of this MRP II software in 2002. In this section the user can chose to see orders or purchases sorted by client, date etc.
Fig. 5.13 Historical data lash of Davidsons Tryckeri’s MRP II, Admera software. (Source:
Davisons Tryckeri AB).
47
The last section in the Admera software main menu is Report “Rapport” (Fig 5.14). In this menu, the user can chose to sort the information by client, sale or order number. It is possible to modify the shown period and edit the shown data type.
5.3 Davidsons Tryckeri AB Survey data The survey is divided in two (2). The data obtained from Part I: Demographics &
Organizational Characteristics was used in Chapter 5.1. The questions answered by our contact in Davidsons Tryckeri AB were Closed-ended, Multiple choice and Open-ended responses (McClelland, 1994). The purpose of these questions was to gather basic information about the type of enterprise where the evaluation took place.
In addition, the data obtained from Part II: Effective Usage of the MRP II-type
system and User Satisfaction is now going to be described during the Chapter 5.3 and during the Chapter 6: Analysis. The types of questions used in these parts of the survey were Ranking responses. The purpose of these questions was to gather information and address the characteristics of the MRP II computer system, how it is used by the organization, to rate the accuracy of the data of the MRP II and various aspects of the MRP II performance.
The data is presented in tables showing the answers that the Production Manager of
Davidsons Tryckeri AB gave. The tables were developed in Microsoft Excel 2003 and a copy of the survey is attached in the Appendix 1 at the end of this thesis study.
48
5.3.1 Survey data. Part II: Effective Usage of the MRP II-type
system and User Satisfaction
Table. 5.1 Survey data. Part II: Usage of the MRP II-type system (Section A). (Source: Own
creation).
The Part II: Usage of the MRP II-type system (Section A) (Table 5.1) consist in a single question: “To what degree is your MRP II supporting these functions?” and different functions were listed in the left size of the table; for example, “Inventory Management/Inventory Stock System”, “Bill of Materials”, “Purchasing and receiving” among others. In this section our contact, the Production Manager ranked the functions listed according to the question presented. The scale used in Part II: Usage of the MRP II-type system (Section B) was; [0] = Not at all, [1] = 1-20%, [2] = 21-40%, [3] = 41-60%, [4] = 61-80% and [5] = 81-100%. The scale is shown in up left size of the table.
49
Table. 5.2 Survey data. Part II: Usage of the MRP II-type system (Section B). (Source: Own
creation).
The Part II: Usage of the MRP II-type system (Section B) (Table 5.2) statement is “From the expertise your organization has had with MRP II system, rate the following benefits of MRP” and different benefits were listed in the left size of the table; for example, “Better meeting of delivery dates”, “Better production scheduling”, “Ability to meet volume/product changes” among others. It is important to mention that the benefits listed were inferred from the general benefits mentioned in Chapter 3.2.4. In this section, our contact ranked the functions listed according to the statement presented. The scale used Part II: Usage of the MRP II-type system (Section D) was [0] = No Benefit; [1] = Low Benefit; [2] = Moderate Benefit and [3] = High Benefit.
Table. 5.3 Survey data. Part II: Usage of the MRP II-type system (Section C).
(Source: Own creation).
50
The Part II: Usage of the MRP II-type system (Section C) (Table 5.3) question is “What is the accuracy of the following types of data in your MRP II-type system?” and different functions were listed in the left size of the table; for example, “Inventory records”, , “Market Forecasts” among others. It is important to mention that the type data listed to measure the accuracy were inferred from the listed presented in Chapter 5.3.1 (Table 5.1) and from the theory chapter. In this section, our contact ranked the functions listed according to the statement presented. The scale used was [1] = Poor (0-80%); [2] = Fair (81-90%); [3] = Good (91-95%); [4] = Excellent (96-100%) and [x] = Not.
Table. 5.4 Survey data. Part II: Usage of the MRP II-type system (Section D). (Source: Own
creation).
The Part II: Usage of the MRP II-type system (Section D) (Table 5.4) question is “Within the next two years, in which of the following areas do you expect your organization to be further computerized?” and different functions were listed in the left size of the table; for example, “Inventory Management/Inventory Stock System”, “Bill of Materials”, “Purchasing and receiving” among others. The scale used in this part was [0] = No additional computerization effort expected; [1] = Additional, though minimal computerization development expected; [2] = Some computerization effort is expected and [3] = Significant computerization in this area is anticipated.
51
Chapter 6. Analysis In the sixth chapter, we will present the analysis of the empirical data of our thesis. The Analysis chapter includes also the qualitative and quantitative data that was collected in two ways: through a survey called “MRP II Usage Survey” that is attached at the end of this thesis as an appendix and by the interviews that we made with our main contact, Mr. Andreas Wijk, Production Manager in Davidsons Tryckeri AB. The Analysis Chapter will give to the reader the understanding if the MRP II established in Davidsons Tryckeri AB is effective stating if it is satisfactory or unsatisfactory its use in accordance with the Theory Chapter,
6.1 Davidsons Tryckeri AB data analysis
0
1
2
3
4
5
To what degree is your MRPII supporting these functions?
Inventory Management/Inventory Stock System.
Bill of Materials.
Purchasing and receiving.
Materials requierements planning.
Accounts payable/Accounts Receivable.
Cost Accounting.
Sales order procesing/Order entry and envoicing.
Routing/work centers.
Payroll/personnel.
Master production schedule.
Shop floor control.
Detailed operations scheduling.
Capacity requirements planning.
Forecasting end Items
Sales analysis.
Product Data Management.
MRP system degree of integration.
Graph 6.1 Survey data. Part II: Usage of the MRP II-type system (Section A).
(Source: Own creation).
The Graph 6.1 takes its data from Table 5.1 (See Chapter 5.3.1) and reflex the current situation of the usage of the MRP II system in Davidsons Tryckeri AB. As stated in the theory chapter a MRP II is made up of variety functions linked together: business planning, production planning, master production scheduling, material requirement planning and capacity requirement planning (Higgins et al, 1996). We after reading other definitions included and stated in the Theory chapter, we developed the
52
“MRP II Functions Model”. From here we took fifteen (15) functions and we asked our contact Mr. Wijk to tell how well they work in their MRP II software finally the sixteen (16) item is an overall according our contact. The inventory management according to Mr. Wijk received a [5] which falls in the satisfactory area of the evaluation (81-100%). In fact as we explained in the Section 5.2, MRP II called Admera Enterprise V2.5 counts with an inventory lash (“Papper”) and in fact is well structured. This Inventory lash qualifies in the satisfactory area. The Bill of Materials is a record of the components that make up a finished item. As explained in the section 5.2 Admera Enterprise V2.5 have certain reports in which the total cost can be divided in the different tasks. However, our contact gave a [4] to the degree of computerization. This normally would be classified as unsatisfactory, but since there are no subassemblies or many components in the printing industry, we will classify it as satisfactory. Our contact ranked with [3] Purchasing and Receiving. Even though the received material are updated every time in the MRP II the purchase decision is often made without the MRP II help and the manual reporting is still in use. As we said in the Section 5.2 the purchases need skills from the user. The manager must know how often a paper is used to decide if the quantity in storage is enough or not. In addition, the MRP II does not count with calculation for the Economic Order Quantity (EOQ) or is not used. Therefore, the manager empirically decides when, what quantity and from which supplier is better to purchase. However, the manager updates them in the MRP II afterwards. For those reasons, we classify this function as not satisfactory. Material Requirement Planning (MRP) is the next function that the MRP II must have in order to fulfill the evaluation according to the Theory chapter. Our contact gave a [3] which is unsatisfactory. As stated in Section 3.2.3, MRP II is a method for the effective planning of all resources of the manufacturing company. (Higgins et al, 1998) As the reader noticed, MRP II (Manufacturing Resource Planning) contains MRP (Materials Resource Planning). As we mentioned in the Section 5.2, the inventory lash (“Papper” ) does not count with an effective link between the raw material and the orders produced. Therefore, the sales personnel when making an offer know how much certain paper they have in inventory, but they do not know if it is planned to be used for another order. Moreover, this could cause delays; the delivery time of the raw material could be longer than expected; the availability of the material could be null or the shipping price of the raw material could increase because of the emergency or quantity required. However, these directly increase the expected costs and put in risk the client satisfaction. The next five (5) questions were ranked with [5] by our contact Mr. Wijk: Accounts Payable/Accounts Receivable, Cost Accounting, Sales order processing/Order entry and Invoicing, Routing/work centers and Payroll/personnel. This proves the effectiveness of the lashes described in Section 5.2 like “Offer/Order” and “Produktion” module. In fact, the Offer/Order is completely computerized and as seen in Section 5.2 after an offer becomes an order the invoice is automatic and without manual reporting, the prices and the costs can be compared in different ways to make the cost accounting. The efficiency and time the employees work is measured in the MRP II in “Produktion” lash for example and takes in consideration the payroll in the cost accounting. For the reasons above described, we classify these five (5)functions as satisfactory.
53
Master Production Schedule (MPS) is in fact the schedule of all the schedules, it
identifies the objectives so that others systems such material inventory, finance, manufacturing, quality, production-logistics, maintenance and purchasing can develop valid plans to support this schedule and meet the desired objectives. Without an effective MPS, the whole profitability of the company can be affected. Due to the importance of this we consider the stated rank [4] as unsatisfactory.
The Production Manager gave a [4] in the Shop floor control which means that might be a problem following the work orders progress, the schedule or the route. Since before, Mr. Andreas Wijk stated a [5] for Routing/Work centers and in the MRP II description (Section 5.2) we could see the progress of every work order; we can infer that the shop problem is the schedule. In general, the Shop floor feature is not bad but cannot be classified as satisfactory either for the lack of good work in scheduling the work orders.
Detailed operations scheduling, Capacity requirements planning and Sales analysis got a rank of [3] which we consider as unsatisfactory. We will focus in the first two: Detailed operations scheduling and Capacity requirements planning which could be seen as symptoms or consequences. If the Detailed operations scheduling is not effective they cannot expect to have an effective Master Production Schedule (MPS) and as we mentioned this affect the company in many aspects. Besides if the Capacity requirements planning module is not accurate and effective it’s difficult to have a good detailed schedule. Forecasting got a four [4]. However the software seems to have tools for the Detailed Operation Scheduling, MPS and Capacity Requirement Planning but they are not used. (See Fig 5.9)
The Product data management in this case would be how the company manages the historical data. We saw in the MRP II description (Section 5.2) that the historical data is very well structured for the product. It has a deficiency for the raw material data, but for the product is quite complete. In the database history you can find so much detail of the product data, the delivery time, the cost, and the work invested in the order etc. Again the only deficiency would be the link with the raw material. However our contact gave a [4] with we will consider as satisfactory for the reasons above.
Finally, the MRP II system degree of integration is an estimate from our contact of the whole system. Our contact Mr. Wijk ranked the last item with a [4].
54
0
1
2
3
From the experience your organization has had with MRP systems, rate the following benefits
Better meeting of delivery dates.Better production scheduling.Reduced shiping cost.Reduced over production.Reduced ScrapReduced manual report.Better Cost Estimation.Lower Inventory Costs.Shorter Delivery Lead Time.Increase Throughput.Reduced safety stocks.Allocation of limited resources.Improved productivity.Improved competitive position.Improved comunication.Other.
Graph 6.2 Survey data. Part II: Usage of the MRP II-type system (Section B).
(Source: Own creation).
Predictable Financial and Operating Performance is one of the most significant field benefits of the MRP II usage. As stated in Section 3.2.4, the variability in business performance is inefficient and costly. The results day-to-day in the business operations must occur by plan, not circumstance, and happen predictably. Another field benefit of the use of MRP II stated before is the Agreement of problems; the system will give better problem identification and prioritization. The Management efficiency, the Common Objectives, the Communication improved and the Financial aspect were also stated in our field benefits section (Chapter 3.2.4). In order to test the effectiveness of the MRP II we asked to our contact Mr. Andreas Wijk to rate some benefits that fit in these categories (See Graph 6.2). If the MRP II is used effectively then Davidsons Tryckeri AB must enjoy of all the field benefits stated in the Theory Chapter.
Better meeting of delivery dates was ranked with [3] but in contrast, the Production Scheduling has not been that beneficiated [2]. This could be contradictious. If the product scheduling fail, it is very probable that the company will not meet the ideal delivery date. The Shipping cost has not been highly beneficiated either [2], usually since the company develops better plans they know exactly when they will need materials, therefore, they don’t have to pay “emergency” or “premium” shipping costs.
55
Reduce over production, scrap and manual report, were ranked with [2], some
benefit. However, the cost estimation has been highly beneficiated ranked with [3]. Somehow, the MRP II has lowered the inventory cost but it is not highly beneficiated [2]. The usage of MRP II in Davidsons Tryckeri AB has beneficiated delivery lead-time [3], but has not increased the throughput [2], or reduced the safety stock significantly [2].
The benefits stated above are examples of benefits when the performance is predictable. Predictable performance results in improved customer service and customer satisfaction, with time spent improving, rather than maintaining, the business at the current level. The need to expedite or excess inventory to cover inefficiency can be a past business practice. Providing firm, visible schedules can reduce premium shipping costs, extra set up time and overtime for your suppliers; improved schedules help eliminate overproduction thereby reducing scrap, obsolescence, rescheduling, and manual reporting. (Jacobi, 1994) Unfortunately, Davidsons Tryckeri AB may not enjoy this field benefit yet.
Allocation of limited resources was ranked with [2].
Improved Productivity is a tricky question since has to do with many aspects; for example, is an effect of the Common management objectives, it tests the internal communication of Davidsons Tryckeri AB which has been highly beneficiated. This means that the MRP II; in fact, has been beneficiated financially and the MRP II fulfill many of the requirements we stated. The last questions were answered with a [3] and with it our contact states that the usage of the MRP II has highly beneficiated the competitive position of the company, the internal communication and the productivity. Finally, our contact ranked [0] others since he believes that there is no further benefits.
So far, we can conclude that Davidsons Tryckeri AB enjoys most of the field benefits listed in the theory, but we cannot conclude that they have predictable performance yet.
56
Table. 5.3 Survey data. Part II: Usage of the MRP II-type system (Section C).
(Source: Own creation).
We asked one question in order to give reasons why the MRP II is working the way it is. Some authors state that the accuracy expected in the input data must be more than 95% and others state that must be more than 98%. However, we consider 91% “a “good” level of accuracy in both input data and executing output data so the results offered by the MRP II would be fulfilled at the maximum.
As we can see in the Table 5.3 the accuracy in Inventory Records, Production lead times and Capacity plan were ranked by our contact ass “good”. Nevertheless, the other aspects were lower than 90% of accuracy.
The most relevant of this table is that our contact ranked [2] the Master Production Schedule (MPS) and [1] the detailed schedule, which are very important to have predictable performance and if both are not operated effectively they are going to put in risk all the plan of the company. It’s important to remember that the Master Production Schedule (MPS) is one of the two inputs for the Material Requirement Planning (See Fig. 3.2 Skeleton Framework of a MRP II concept).
As we learned in chapter 3 the Material Requirement Planning (MRP) is contained by the MRP II software, and even though should be a very good accuracy in order to improve the purchasing plan and the right times to purchase, it has a low status of accuracy.
57
Table. 5.4 Survey data. Part II: Usage of the MRP II-type system (Section D). (Source: Own
creation).
Finally in Table 5.4, the question purpose (See Table 5.4) is to know for our case company what are the things expected to improve in the next two years. After the overall results, we could use this table to evaluate if they are putting attention to the must cost effective areas and give a frame of solution for improving effectiveness of the use of their MRP II (See Table 5.4). As the readers can imply, Davidsons Tryckeri AB is aware that its MRP II needs to be improve because almost all the answers were stated in the rank of [2] = Some computerization (63%) and [3] = Significant computerization (25%).
58
Chapter 7. Results and Conclusions In the Chapter seventh, we will present the results and conclusions of this thesis study. The Results section is based in the Analysis chapter. It includes the statements about the MRP II functions, Achievement of field benefits and data accuracy, and finally the Integration of systems. The Conclusion section is done by the statements made in the Results section putting clearly how Davidsons Tryckeri AB is currently using its MRP II system and if they are using it effectively. Also, the Conclusions section establishes and gives enough evidence to support the general statements done in this part of this thesis study.
As the reader knows, we applied our model called “MRP II Functions Model” (See
Chapter 4.2) due to the development of the survey called “MRP II Usage Survey” (See Appendix 1). We obtained enough data of the MRP II system (Chapter 5) and finally we analyzed the data to find the strengths and the weaknesses of how effective Davidsons Tryckeri AB is using its MRP II system (Chapter 6). At this point, now we are able to give the results and conclusions about the effectiveness of the MRP II system used in Davidsons Tryckeri AB.
7.1 Results
7.1.1 MRP II functions
As it was stated in Chapter 6, there are several functions of the MRP II system (See
Appendix 1, Part II) that were classified as satisfactory, unsatisfactory and between satisfactory and unsatisfactory. The MRP II functions were classified as the reader can see in the next table:
Table. 7.1 Results. Classification of MRP II functions. (Source: Own creation). Looking at the Table 7.1, we can recognize that eight (8) MRP II functions are
classified satisfactory and two (2) is classified between satisfactory and unsatisfactory. (See Appendix 1, Part II: Usage of the MRP II-type system (Section A)).
These MRP II functions belong to the Product Data (Product data Management),
Customer Order Management (Sales order processing/Order entry Invoicing), Inventory (Inventory Management and Bill of Materials), Production (Routing work centers and Shop floor control), Forecasting (Forecasting end items) and Finance-Accounting-Costing (Accounts Payable/Accounts Receivable, Cost Accounting and Payroll data Management) module. In this context, we can say that these modules of our “MRP II Functions Model” have been used in an effective way. It is important to mention that the Inventory and Production module are effective by themselves but when they start
59
having the direct Cause-Effect relationship with the modules that are not used in an effective way then they become ineffective. This will be explained later. (See Chapter 4.2, Fig. 4.2 MRP II Functions Model).
In contrast, looking at the Table 7.1 we can see that six (6) MRP II functions are
classified as unsatisfactory belong to the Planning, Master Production Schedule and Purchasing modules of our “MRP II Evaluation Model” (See Chapter 4.2, Fig. 4.2 MRP II Functions Model). Therefore, we can say that the Purchasing, Planning and Master Production Schedule are classified unsatisfactory (Fig. 7.1)
Fig. 7.1 Results Classification of MRP II functions. (Source: Own creation).
There are three (3) modules of the MRP II system used in Davidsons Tryckeri AB
that are not used in effective way. These ineffective modules are: Planning, Master Production Schedule and Purchasing of our “MRP II Functions Model” (See Chapter 4.2, Fig. 4.2 MRP II Functions Model). The next tables will give the reasons why the different functions of the MRP II system used in Davidsons Tryckeri AB are not used in an effective way. (Table 7.2, 7.3, 7.4)
Customer Order Management
Planning
Forecasting
Inventory
Purchasing Production
Finance Accounting
Costing
Master Production Schedule
Product Data
Purchasing and receiving [3]
Material Requirement Planning [3] Capacity Requirement Planning [3]
Inventory management/ Inventory Stock System [5]
Product data management [4]
Bill of materials [4] Routing work centers [5] Shop floor control [4]
Master Production Schedule [4] Detailed operations schedule [3]
Forecasting [4] Sales order processing/Order entry and invoicing [5]
60
Table. 7.2 Results. MRP II modules lack of effectiveness. (Planning Module). (Source: Own creation).
Table. 7.3 Results. MRP II modules lack of effectiveness. (Master Production Schedule Module). (Source: Own creation).
Table. 7.4 Results. MRP II modules lack of effectiveness. (Purchasing Module). (Source: Own creation).
61
7.1.2 Achievement of field Benefits and Data accuracy
As it was stated in Chapter 3.2.4, there are seven (7) field benefits that the MRP II
system gives to the companies who use it in an effective way. Now if reader remembers, in the survey applied in Davidsons Tryckeri AB (See Appendix 1, Part II: Usage of the MRP-type system (Section B)) our contact rated a list of benefits (See Table. 5.2 Survey data Part II: Usage of the MRP II-type system (Section B)) according to his experience. This list of benefits belongs to the different fields stated in Chapter 3.2.4. To be clearer, the next table will relate this list of benefits to the field benefits stated in Chapter 3.2.4.
Table. 7.5 Results. MRP II Field benefits. (Source: Own creation). As a reader may remember, the Predictable Financial and Operating Performance
field benefit of the MRP II system state that the results day-to-day in the business operations must occur by plan, not circumstance, and happen predictably. Predictable performance field benefit results in improved customer service and customer satisfaction, with time spent improving, rather than maintaining, the business at the current level. The need to expedite or excess inventory to cover inefficiency can be a past business practice. Providing firm, visible schedules can reduce premium shipping costs, extra set up time and overtime for your suppliers; improved schedules help eliminate overproduction thereby reducing scrap, obsolescence, rescheduling, and manual reporting. (Jacobi, 1994). Davidsons Tryckeri AB is not enjoying this field benefit and as a consequence they are committing overestimation.
The Predictable Financial and Operating Performance field benefit of the MRP II
system is not achieved and is a consequence and/or an effect of the lack of effectiveness of the Planning, Master Production Schedule and Purchasing modules of our “MRP II Functions Model” described in Chapter 7.1.1. Now the relationship between our “MRP II Functions Model” and the Field Benefits of the MRP II system (See Chapter 3.4.2) is done.
62
At this point, it is important to remember a statement done before. Most of the
benefits listed in the survey done in Davidson’s Tryckeri AB and that also were explained in this chapter (See Table 7.5 Results. MRP II Field benefits) belong to the Predictable and Operating Performance field benefit of the MRP II system and as it was stated in Chapter 3.2.4, this is the most important and essential field benefit of the effective use of the MRP II system because it leads to the correct total integration of the enterprise systems and subsystems.
7.1.3 Integration of systems
According to the Competing Values Model (CVM) described in Chapter 4.3, the
integration of the different organizational systems is done by the effective relationship of four (4) organizational models: human relations model (HR), open systems model (OS), internal process model (IP), and rational goal model (RG) (See Fig. 4.1 and 4.3). The internal process model (IP) is based in the information management, coordination, control and stability of the Information and Communication Technology (ICT). At this point the reader can recognize the internal process model (IP) supports the rational goal model (RG) that is based in the planning, goal setting, evaluation and productivity. Finally as the reader may remember, the internal process model (IP) and the rational goal model (RG) impact in the human relations model (HR) and the open systems model (OS) to achieve the organizational integration behavior.
As it was stated in Chapter 7.1.2, the Predictable and Operating Performance field
benefit of the MRP II system used in Davidsons Tryckeri AB is the most important and essential field benefit of the effective use of the MRP II system because it leads to the effective total integration of the enterprise systems and subsystems. Davidsons Tryckeri AB is not achieving this field benefit due to the lack of effectiveness of the Planning, Master Production Schedule and Purchasing module of our “MRP II Functions Model” (See Fig. 7.1 Classification of MRP II functions).
Since Davidsons Tryckeri AB is not achieving the Predictable Financial and
Operating Performance field benefit of the MRP II system, we can state that the integration of the different systems and subsystems in Davidsons Tryckeri AB is not effective either. If some of the MRP II modules stated in our “MRP II Functions Model” (See Fig. 4.2, 7.1) are not used in an effective way then the MRP II system will not give the results expected. As it was stated before, the internal process dimension model (IP) of the CVM, base its work in the information management, coordination, control and stability of the ICT. Therefore, the MRP II system is part of the of the IP model of the CVM and an ineffective MRP II usage will result in problems in the IP model, that will bring problems located everywhere in the system. (See Fig. 4.1) Furthermore, if the IP model is ineffective consequently, the RG model that is based in the planning, goal setting, evaluation and productivity (manufacturing and production systems) will be also affected. If the IP model and the RG model are ineffective then the other models of the CVM, HR model and the OS model, might be also impacted. Finally, if the four (4) models of the CVM (See Fig. 4.1 and Fig. 4.3) are not effective then the organization might not work properly. Even though could seem like there is no problems at the moment, the system always evolutes in every cycle and if the direction is not correct, there is going to be problems sooner than expected.
63
7.2 Conclusions
The relationship of the Planning module with the Purchasing and the Master
Production Schedule is direct; that means, if the Planning module is not used in an effective way, consequently the Purchasing and the Master Production Schedule are not going to be effective either. This relationship we can call it a Cause–Effect relationship. To be more precise, if the Planning module is ineffective is due to the ineffectiveness of the Capacity requirements planning and the Material Requirement Planning (MRP) functions of the MRP II system used in Davidsons Tryckeri AB. (See Fig. 7.1). Now if the Master Production Schedule module is not used effectively, as an effect of the lack of effectiveness of the Planning module, the Production module will also be ineffective. This relationship is also a Cause-Effect relationship, if the Master Production Schedule module is ineffective the Production module is going to be ineffective. To be more precise, if the Master Production Schedule module is ineffective is due to the ineffectiveness of the Master Production Schedule and the Detailed operation scheduling functions of the MRP II system used in Davidsons Tryckeri AB. (See Fig. 7.1). With this information, we also can say if the Production module and the Purchasing Module (due to the lack of effectiveness of the Purchasing and Receiving and the Sales analysis functions of the MRP II system used in Davidsons Tryckeri AB) are ineffective so is going to affect Inventory module. Finally, the Inventory module has a direct relationship with the Planning module and as the reader can induce; if the Inventory module is ineffective then the Planning module also is going to be ineffective. (See Fig. 7.1).
Now we have achieve the beginning of the cycle in the Planning module; for this
reason, the relationship of this cycle is a vicious relationship or a self-destructive relationship where the different modules degenerates themselves in each cycle creating more and more problems causing more and more ineffectiveness of the MRP II system. (See Fig. 7.2).
Fig. 7.2 Vicious or self-destructive cycle.(Source: Own creation).
(+)
(+)
(+)
(+)
(+)
Ineffective MPS
Ineffective Purchasing
Ineffective Inventory
Ineffective Production
Ineffective Planning
(+)
64
Due to the lack of effectiveness of the Planning, Master Production Schedule and Purchasing modules of our model “MRP II Evaluation Model” (See Fig. 7.1), we can conclude that the principal field benefit stated in Chapter 3.4.2, Predictable Financial and Operating Performance can’t be achieved and it is related with the overestimation of input data, calculations and execution of schedules. Now we can state that the data is not precise and not accurate because as the reader may remember, in Chapter 6.1 (See Table 5.3 Survey data. Part II: Usage of the MRP-type system (Section C)) some authors state that the accuracy expected in the input data must be more than 95% and others state that must be more than 98%. However, we consider 91% “a “good” level of accuracy in both input data and executing output data so the results offered by the MRP II would be fulfilled at the maximum. Unfortunately, most of the data accuracy of the MRP II system stated by our contact, Mr. Andreas Wijk, in our survey range below 91%.
Overestimation in “failures” for example; an order of a thousand copies, they might overestimate to eighteen hundred (1800), therefore overestimate 80% for printing time, so they cannot plan other orders, increases the costs, etc. This is usually done to achieve the business objectives like the delivery dates. In other words, they overestimate to have a “space” if something happens wrong and in that way have the production on time. This causes lost of customer satisfaction because the price of the product will be sometimes higher than expected, excess of inventory, extra production time, increase scrap, emergency raw material orders and manual reporting.
Fig. 7.3 MRP II ineffectiveness root cause in Davidsons Tryckeri AB. (Source: Own
creation).
It is very clear looking at Fig. 7.3 to identify the root cause of why the MRP II system in Davidsons Tryckeri AB is ineffective or is not as effective as it could be. It sounds obvious to say that if the data involved in the MRP II system is not precise and accurate then the effectiveness of the MRP II system will decrease. This behavior is not limited to the MRP II system; in fact, we can say that if the data is not accurate in all the Information and Communication Technology (ICT) and manufacturing systems (doesn’t matter which one is chosen) the effectiveness will be less than expected.
Lack of accurancy in
data
Ineffective Planning, MPS and Purchasing
Strategic goals & common objectives will not be reached
Overestimation of times
Null or ineffective Enterprise
manufacturing system integration
Predictable performance not achieved
65
Finally as the reader could note in any “systems definition”, the benefits are shared by all the parts, and the synergy of the system makes it stronger than the sum of its parts, but as you could see in this last chapters, this relationship goes in the opposite way too. When having problems in the Information Management the system will be affected in other unexpected areas and a small failure could cause a catastrophic symptom. An example could be the results relationship of the CVM (See Section 7.1.3)
66
Chapter 8. Recommendations In the next chapter, we present our recommendations to the reader and to Davidsons Tryckeri AB based in the analysis, results and conclusions (Chapter 6 and Chapter 7 of this thesis study). The recommendations propose a field of solution in which Davidsons Tryckeri AB can base to develop and perform better in the effective use of its MRP II system to achieve the enterprise and manufacturing integration of systems and subsystems. In this way, Davidsons Tryckeri AB will achieve its strategic goals and common objectives stated by the top management, which is to continue being the printing leader of the Småland region in Sweden.
We recommend Davidsons Tryckeri AB to identify and to understand the reasons why the enterprise and manufacturing systems must be integrated in an effective way. Davidsons Tryckeri AB must understand that organizations like them are facing the strategic challenge of achieving sustained profitable growth. To meet this challenge, Davidsons Tryckeri AB must develop capabilities that enable them to integrate completely and be able to compete in their market space. As we have said before in this thesis study, the MRP II system is an Information and Communication Technology (ICT) philosophy that helps organizations to integrate their different systems and subsystems in an effective and proper way. Davidsons Tryckeri AB has to recognize the possible competitive advantage that the effective use of the MRP II system can bring to them.
This technological advance, the MRP II, has created new opportunities in
integration and management of all aspects of supply chain and the printing industry is not the exception. However, this technological advance will not do everything by itself. For this reason, in this thesis study we try give our best recommendations to Davidsons Tryckeri AB hoping that they recognize which are the opportunity areas to improve and to perform in a more effective way.
As we learned in the theory chapter MRP II is not only software, but a philosophy. If Davidsons Tryckeri AB wants to achieve all the field benefits that MRP II offers, they should adapt this philosophy; determine themselves to stop overestimating and stop giving for granted the failures. In that way, they will start to get benefits from the reduction of inventory and the accurate schedules; for example, more available printing time, reduction of unnecessary costs and will increase the costumer satisfaction at same time. However, they could also use forecasting tools if failures or problems instead of overestimating.
As we could see in the description of the MRP II software that Davidsons Tryckeri AB is using, Admera Software AB might not be a bad software, but it is definitely being used in an improper way. When the input data and/or the calculations are overestimated, a problem of inaccuracy and waste of money born and grow up to many directions. Therefore, Davidsons Tryckeri AB should first make accurate the current calculations; this will give benefits in the proximate future, and long term they should try to reduce the failures so when a costumer ask for a thousand copies, they only use a thousand sheets.
We recommend Davidson Tryckeri AB to spend more time planning than reacting. The responsible of the MRP II system maintenance should make a study with the historical data for example and adjust the parameters of the MRP calculations.
67
We recommend Davidson Tryckeri AB to make a better use of the MPS tools of the MRP II, or develop a simple graphic MPS, even in a board where everyone could see it. They could use Gant graphics. This would let know to the whole company what they are doing, the time where they are supposed to do it and how long it is supposed to take. This seems to be a very simple tool, but it would definitely have an impact in the execution of plans, and in the capacity planning. When this MPS is accurate, they could see if they are at full capacity and they could outsource with no risk of having idle time in the end of the day. Davidson Tryckeri AB should remember that is not about getting the best MRP II software but about using the one they have at maximum.
The establishment of a project management team between Davidsons Tryckeri AB and Admera Software AB will be an interesting strategy to analyze, to discuss, to share, to learn and to understand how the data accuracy is creating the lack of effectiveness of the MRP II system and that way they could break with the vicious cycle we analyzed.
We are sure that both enterprises, Davidsons Tryckeri AB and Admera Software
AB, will be completely benefited in the development of this project because both will interact between each other, know the needs of each other, the strategies of each other, the way both work, among others; in other words, both enterprises will create synergy. At the end of project, if this is done, we are sure that the problem will be solved and both will achieve its benefits. Davidsons Tryckeri AB will use more effectively its MRP II system reaching its strategic and common goals which one of this is to continue being the printing leader in the Småland region in Sweden. On the other hand, Admera Software AB will understand better the effectiveness need that a small printing company wants in the business nowadays using a MRP II system and also will increase its amounts of ideas to create, to implement and to add them in its future MRP II software systems.
Another interesting approach as a consequence of the development of this project
will be the creating of a specialized MRP II system to be implemented by Admera Software in Davidsons Tryckeri AB. The creation of this MRP II software will be in accordance to the specific needs that Davidsons Tryckeri AB wants at this moment making the integration of the enterprise and manufacturing system in an effective way. In addition, the creation of this new MRP II software can be done for the entire Taberg Media Group in which all the companies can be integrated using this new specialized MRP II software. This would make the production planning easier and in real time giving a competitive advantage to this group, reach more customers, more printing orders, more income and finally a better market position.
The next recommendations are based in the Table. 5.4 Survey data. Part II: Usage of
the MRP II-type system (Section D). As the reader may remember, this table was developed to know in which MRP II functions Davidsons Tryckeri AB will expect more computerization features in the next two (2) years. It is really surprising that Davidsons Tryckeri AB is expecting significant computerization features in the next MRP II functions: Accounts payable/Accounts receivable, Cost Accounting, Sales order processing/Order entry and invoicing, and Payroll/personnel.
According to this, we recommend to Davidsons Tryckeri AB to make a new and
better analysis of which MRP II functions really need a significant computerization features to operate in a more effective way. The MRP II functions that really need
68
significant computerization are: Materials requirements planning, Capacity requirements planning, Master Production Schedule, Detailed operations scheduling, Purchasing and receiving, and Sales analysis. As the reader can infer, these MRP II function are the ones which belong to our “MRP II Function Model” (See Fig. 7.1 Results Classification of MRP II Functions Model), and these modules are ineffective at this moment as it was stated in the results and conclusions chapter creating a vicious- self destructive cycle (See Fig 7.2). It is important to mention that they could invest in improving every function of the MRP II of even change MRP II computer system, but the prioritization should be definitely changed. The ineffective modules would give more advantages than the others will, since they are not giving results yet, the others could wait some time until the latecomer modules are in order.
69
List of references
Articles and journals Abouzeedan, A. 2003. “Financing Swedish Small and Medium-Sized Enterprises (SME’s): Methods, Problems and Impact”. 43rd European Congress of the Regional Science Association. Finland. Adbinour-Heml, S., Legnick-Hall, M.L. and Legnick-Hall C.A. 2003. “Pre-implementation attitudes and organizational readiness for implementing an Enterprise Resource Planning System”. European journal of Operational Research. p. 258-273. Barney, J. B. 1991. “Firm resources and sustained competitive advantage”. Journal of Management. Vol. 17. p. 99-120. Braganza, A. 2001. “Radical Process Change: A Best Practice Blueprint”. John Wiley, Chichester. Braganza, A. 2002. Enterprise integration: creating competitive capabilities. Integrated Manufacturing Systems. Vol. 13. p. 562-572. Braganza, A. and Lambert, R. 2000. “Strategic integration: developing a process-governance framework''. Knowledge and Process Management. Vol. 7. p. 86-177. Broatch, M. 2001. “Making the ERP connection”. Computer world New Zealand. Brynjolfsson, E., Renshaw, A. A. and Van Alstyne, M. 1997. “The matrix of change''. Sloan Management Review, Vol. 38. p. 37-54. Buchanan, D. A. 1997. “The limitations and opportunities of business process re-engineering in a politicized organizational climate''. Human Relations. Vol. 50. p. 51-72. Burgelman, R. A. and Doz, Y. L. 2001. “The power of strategic integration”. Sloan Management Review. p. 28-38. Cameron, K. S. 1981. “Domains of Organizational Effectiveness”. Academy of Management Journal. Vol. 24. p. 25-47. Cameron, K. S., & Whetten, D. A. 1983. “Organizational Effectiveness: A Comparison of Multiple Models”. Academic Press, San Diego, CA. D'Adderio, L. 2001. “Crafting the virtual prototype: how firms integrate knowledge and capabilities across organizational boundaries”. Research Policy. Vol. 30. Davenport, T. H. 1998. “Putting the Enterprise into the Enterprise System”. Harvard Business Review. p.121-131. Davenport, T. H. and Nohria, N. 1994. “Case management and the integration of labor'”. Sloan Management Review. Vol. 35 p. 11-23.
70
Douglas, R. 1988. “A Call for Action: Integrating CIM and MRP II”. Production and Inventory Management Journal. Second Quarter. Vol. 29. p. 32. Earl, M. 2001. “Knowledge management strategies: Toward taxonomy”. Journal of Management Information Systems. Vol. 18. Eisenhardt, K. and Brown, S. L. 1999. “Patching: rest itching business portfolios in dynamic markets”. Harvard Business Review. p. 72-85. Fuchs, P. H., Mifflin, K. E., Miller, D. and Whitney, J. O. 2000. “Strategic integration: competing in the age of capabilities''. California Management Review. Vol. 42. p. 47-118. Ghoshal, S. and Bartlett, C. 1995a. “Building the entrepreneurial corporation: new organizational processes, new managerial tasks''. European Management Journal. Vol. 13. p. 55-139. Ghoshal, S. and Bartlett, C. A. 1995b. “Changing the role of top management: beyond structure to processes''. Harvard Business Review. Vol. 73. p. 11-86. Guha, S., Kettinger, W. J. and Teng, J. T. C. 1993. “Business process reengineering: building a comprehensive methodology”. Information Systems Management, Vol. 10, p. 13-22. Hall, R. H. 1980. “Effectiveness Theory and Organizational Effectiveness”. Journal of Applied Behavioral Science. Vol.16. p. 536-545. Hammer, M. and Champy, J. 1993. “Re-engineering the Corporation: A Manifesto for Business Revolution”. Nicholas Brealey Publishing, London. Hammer, M. and Stanton, S. 1999. “How process enterprises really work''. Harvard Business Review. p. 18-108.
Jacobi, Michael A. 1994. “How to unlock the benefits of MRP II and just-in-time.” Hospital Material Management Quarterly. May 1994. p. 11-12.
Jarvenpaa, S. L. and Stoddard, D. B. 1998. “Business process redesign: radical and evolutionary change”. Journal of Business Research. Vol. 41. p. 15-27. Hamel, G. and Prahalad, C. K. 1994. “Competing for the Future”. Harvard Business School Press. Boston, MA. Herman, J. 2001. “The e-business imperative for enterprise integration”. Business Communications Review. Vol. 31. p. 2-24. Iivari, J. 1992. “The organizational fit of information systems”. Journal of Information Systems. Vol. 2, p. 329
71
ICT. 2002. “E-Business and ICT Skills in Europe”. ICT Skills Monitoring Group. eEurope: Go Digital. ISO. 2002. “A big enterprise – Standardization for SME’s (small and medium enterprises)”. ISO Bulletin. Kahn, K. B. and Mentzer, J. T. 1998. “Marketing's integration with other departments'”. Journal of Business Research. Vol. 42. p. 53-62. Kumar, K., & Van Hillegersberg, J. 2000. ”ERP Experiences and Evolution”. Communication of the ACM. Vol. 43. p. 23- 26. Lawrence, P. R. & Lorsch, J. W. 1969. “Organization and Environment”. Cambridge: Harvard University Press. Lee, J.N. 2001. “The impact of knowledge sharing, organizational capability and partnership quality on IS outsourcing success''. Information & Management, Vol. 38. Leonard, D. and Sensiper, S. 1998. “The role of tacit knowledge in group innovation'”. California Management Review. Vol. 40. Loh, L. and Venkatraman, N. 1992. “Diffusion of information technology outsourcing; influence sources and the Kodak effect'”. Information Systems Research. Vol. 4. Long, L. 1986. "Surveys from Start to Finish", in Spruell, G. (Ed.), Info-Line, American Society for Training and Development. Alexandria, VA. Malone, T. W., Crowston, K., Lee, J. and et al. 1999. “Tools for inventing organizations: toward a handbook or organizational processes'”. Management Science, Vol. 45. Marshall, J. 2001. “Shared services, shared opportunities”. Financial Executive. Vol. 17. McClelland, Samuel B. 1994. “ Training needs assessment data-gathering methods: Part 1, survey questionnaires”. Journal of European Industrial Training. Bradford. Vol.18. p. 22-27. Millson, M. R. and Wilemon, D. 2002. “The impact of organizational integration and product development proficiency on market success”. Industrial Marketing Management. Vol. 31. p. 1-23. Mintzberg, H. 1987. “Crafting strategy”. Harvard Business Review. Vol. July-August. p. 66-75. Narasimhan, R. and Das, A. 2002. “The impact of purchasing integration and practices on manufacturing performance”. Journal of Operations Management. Vol. 19. p. 593-609.
72
Newell, S., Swan, J. and Robertson, M. 1998. “A cross-national comparison of the adoption of business process reengineering: fashion setting networks?” Journal of Strategic Information Systems. Vol. 7. p. 299-317. Ostroff, C., & Schmitt, N. 1993. “Configurations of Organizational Effectiveness and Efficiency”. Academy of Management Journal. Vol. 36. p. 1345-1361. Pinto, M. B. and Pinto, J. K. 1991. “Determinants of cross-functional cooperation in the project implementation process'', Project Management Journal. Vol. 22. p. 13-20. Plenert, G. 1996. “Focusing material requirements planning (MRP) towards performance”. Institute of World Class Management. California, USA.
Porter, M. 1980. “Competitive Strategy”. Free Press, New York, NY. Preskill, H.1991. "A Comparison of Data Collection Methods for Assessing Training Needs". Human Resource Development Quarterly. Vol. 2. p. 143-55. Robinson, S. and Weldon, E. 1993. “Feedback seeking in groups: a theoretical perspective”. British Journal of Social Psychology. Vol. 32. p. 71-86. Sarker, S. and Lee, A. S. 1999. “IT-enabled organizational transformation: a case study of BPR failure at TELECO”. The Journal of Strategic Information Systems. Vol. 8. p. 83-103. Sheldon, D. 1991. “MRP II - What It Really Is” . Production and Inventory Management Journal. Vol. 32. ABI/INFORM Global. p. 12 Sherman, J. D., Souder, W. E. and Jenssen, S. A. 2000. “Differential effects of the primary forms of cross functional integration on product development cycle time”. Journal of Product Innovation Management, Vol. 17 No. 257, p. 267. Teigland, R. and Wasko, M. 2001. “Recombining knowledge through know-how trading: examining the impact of informal boundary spanning communication on individual performance”. Academy of Management Proceedings. p. 3-8. Tremblay, G. 1991. “MRP II - Quantifying the Benefits”. The Michigan CPA. Southfield. Vol. 43. p. 24 Turbide, D. 1990. “What Every Manager Needs To Know About MRP”. Manufacturing Systems. Vol. 8. ABI/INFORM Global. p. 46 Tusi, A. S. 1990. “A Multiple-Constituency Model of Effectiveness: An Empirical Examination at the Human Resource Subunit Level”. Administrative Science Quarterly. Vol. 35. p. 458-483. Umble, J. E., Haft, R. & Umble, M., 2003. “Enterprise Resource Planning: Implementation procedures and Critical Success Factors”. European Journal of Operational Research. p. 241-257.
73
Van Grembergen, W. and Van Belle, J.L. 1999. “Process integration through information technology at the Generale de Banque of Belgium”. The Journal of Strategic Information Systems. Vol. 8. p. 63-81. Wei Lian, L. 2005. “SME’s going Global: Making SME’s see the value in ICT”. The Edge Malaysia. Weill, P. and M. Olson. 1989. “Managing investments in information technology: mini case examples and implications”. MIS Quarterly. Vol. 13. p.3-17 Weir, K. A., Kochhar, A. K., LeBeau, S. A. and Edgeley, D. G. 2000. “An empirical study of the alignment between manufacturing and marketing strategies”. Long Range Planning. Vol. 33. p. 83-148. Willcocks, L. and Sykes, R. 2000. “The role of the CIO and IT function in ERP''. Communications of the ACM. Vol. 43. p. 32. Books Al-Najjar, B. 1991. “On the selection of condition based maintenance for mechanical systems”. Operational Reliability and Systematic Maintenance. Elsevier Applied Science. p. 153-157. London. Anderson, J.C., Schroeder, R.G., Tupy, S.E., and White, E.M. 1982. “Material Requirements Planning Systems: The State of the Art”. Production Inventory Management. p. 51-66. Bedeian, A. G. 1987. “Organization Theory: Current Controversies, Issues, and Directions” in C. L. Cooper & I. T. Robertson (Eds.), International Review of Industrial Organizational Psychology. p. 1-23, John Wiley, Chichester. Campbell, J. P. 1977. “On the Nature of Organizational Effectiveness” in P. S. Goodman & J. M. Pennings (Eds.), New Perspectives on Organizational Effectiveness. p. 13-55. Jossey Bass, San Francisco, CA. Chase, R. B., and Aquilano, N. J. 1995. “Production and Operations Management”. R.D. Irwin, Inc. Cunningham, J. B. (1978). “A Systems Resource Approach for Evaluating Organizational Effectiveness”. Human Relations. Hedman, J. & A. Borrell, A., 2002. “Enterprise Resource Planning: Global Opportunities and Challenges”. Edited by Liaquiat Hossain, Jon David Patrick and Mohammad A. Rashid. Higgins, P., Le Roy, P. & L. Tierney. 1998. “Manufacturing Planning and Control: Beyond MRP II”. Chapman & Hall. Dublin, Ireland. Hodson, W.K. 1992. “Maynard’s Industrial Engineering Handbook”. McGraw-Hill. 4th Edition.
74
Hsu, C., Rattner, L. 1993. “Develop a Theoretical Model of Information Requirements in Concurrent Manufacturing Systems, Part II: A Theory of Integration”. Proceedings of the 1993 NSF Design and Manufacturing Systems Conference. p. 1367. Joseph, T. & Swanson, E. B. 1996. “The Package Alternative in Systems Replacement: Evidence for Innovation Convergence” in T. J. Larsen & E. McGuire (Eds.), Information Systems Innovation and Diffusion: Issues and Directions (p. 375-389). Hershey, PA: IDEA-Group. Markus, M. L, & Tanis, C. 2000. “The Enterprise System Experience – From Adoption to Success” in R. Zmud. & M. F. Price (Eds.), Framing the Domains of IT Management: Projecting the Future through the Past. p.173-207. Cincinnati, OH: PinnaFlex. Mende, M, Brecht, L & Österle, H. 1994. “Evaluating Existing information systems from a business process perspective”. Proceedings of the 1994 computer personnel research conference on Reinventing IS: managing information technology in changing organizations: managing information technology in changing organizations. United States. Millson, M. R. and Wilemon, D. 2002. “The impact of organizational integration and product development proficiency on market success''. Industrial Marketing Management. p. 123. Meyer, M. W. 1985. “Limits to Bureaucratic Growth”. Gruyter, Berlin. MRP II Software. 1996. IIE Solutions. p. 40-44. Pennington, F. 1980. "Needs Assessment: Concepts, Models and Characteristics". New Directions for Continuing Education. Jossey-Bass, San Francisco. p. 1.14. Quinn, R. E. 1989. “Beyond Rational Management: Mastering the Paradoxes and Competing Demands of High Performance.” Jossey-Bass, San Francisco, CA. Quinn, R. E., & Cameron, K. S. 1988. “Paradox and Transformation: Toward a Theory of Change in Organization and Management.” Ballinger, Cambridge. Quinn, R. E., & Rohrbaugh, J. (1983). “A Spatial Model of Effectiveness Criteria: Towards a Competing Values Approach to Organizational Analysis”. Management Science. Vol. 29. p. 363-377. Ragnunathan , B. and B. King. 1983. “The impact of information systems planning in organizations”. Omega. Scheer, A. W. 1998. “ARIS – Business Process Frameworks.” Second Edition. Berlin: Springer. Sum, C-C., and Yang, K-K. 1993. “A Study on Manufacturing Resource Planning (MRP II)
MRP II Usage Survey The questions in this survey are designed to be answered by the MIS Manager, Materials Manager, Master Scheduler, Production and Inventory Control Manager, or another person who is most familiar with the MRP or manufacturing related computer system in your company. If you encounter questions that you cannot answer or questions which do not apply to your company, please leave them blank. Answer the remaining questions by filling in the blank, or circling or checking the most appropriate response. When you have completed the questionnaire, please return it. If you would like to receive a copy of the results of this study, please let us know with your completed survey. Thank you for your help.
Part I
Demographics & Organizational Characteristics 1. In which industry would you classify your organization? (Check all that apply) ( ) Electronic products and components ( ) Fabricated metal products ( ) Electrical machinery, apparatus, appliances, or supplies ( ) Machinery and Transport Equipment ( ) Pharmaceutical or Chemical products (including cosmetics, paints) ( ) Paper products ( ) Plastic products ( ) Food packaging ( ) Instrumentation Equipment ( ) Textile ( ) Other _____________________________________________________________________ 2. What is your job function? (Check one) ( ) Materials Management ( ) Inventory Control Management ( ) Scheduling (Master Schedule) ( ) MIS Management ( ) Production Management ( ) Other _____________________________________________________________________ 3. The facility described in the remainder of this questionnaire is: a) A single plant b) Part of a company with several plants c) Other (describe) __________________________________________________________
77
4. How many people work at your plant site? a) Less than 10 people b) Between 11 and 20 people c) Between 21 and 30 people d) Between 31 and 50 people e) More than 50 people 5. What is the average annual sales (SEK) revenue of your company? (Circle) Total Organization Under $20 $21-50 $51-100 $101-200 Over $200
million million million million million Your Facility Under $20 $21-50 $51-100 $101-200 Over $200 or Company million million million million million 6. How many different unique computer application packages are currently used to monitor, schedule, plan, and report the status of manufacturing production processes within your facility or operational division? (a) 0 (b) 1 (c) 2 (d) 3 (e) 4 (f) 5 (g) 6 (h) 7 or more 7. What type of computer hardware is used by your organization to support manufacturing? (Circle all applicable) a) Mainframes b) Minicomputers (including workstations) c) Networked personal computers d) Stand-alone personal computers. e) Other ______________________________________________________________________ 8. How do you define the term “MRP II”? (Circle one) a) A computerized materials/production planning and control system for production only. b) Primarily computerized materials/production planning and control system integrated with other business areas to achieve a total business system. c) General system for computerizing any business function d) Other _________________________________________________________________________ 9. What was the source of your MRP II system? a) Developed internally within your organization b) Vendor supplied with little or no modifications c) Vendor supplied with some modifications d) Vendor supplied with major modifications 10. In what year did your company first install a MRP II system? __________
78
11. In what year was your current MRP II system installed? _______________ If your organization is currently implementing a new system, for which year is the installation scheduled to go on-line?
12. Who initiated MRP II development in your company? a) Top management b) Production and inventory control management c) Both top management and production and inventory control management d) Information systems e) Software and hardware vendors f) Other (describe) _____________________________________________________________
13. Which of the following was used to install MRP II in your company? (If more than one system has been installed, base your answer on the most recent installation attempt.) a) A formal project was established with a project manager, budget and staff b) A less formal project planning group was organized c) An individual was assigned the responsibility d)Other (describe) ______________________________________________________________
14. To what extent is someone in upper management involved with implementing the MRP II system? a) Not at all b) Slightly involved c) Moderately involved d) Highly involved
15. To what extent is a high-level manager knowledgeable of computer systems? a) Not at all b) Slightly knowledgeable c) Moderately knowledgeable d) Highly knowledgeable
16. To what extent does top management support the implementation and project management of the MRP II computer system? a) Very little or Not at all b) Limited support c) High level of support d) Entirely support
79
17. In terms of hardware, software, and external technical service, how much has your organization invested in MRP II systems? a) Less than $500,000 b) $500,000 or more and less than $750,000 c) $750,000 or more and less than $1,000,000 d) $1 million or more and less than $2 million e) Two million dollars or more 18. Indicate the additional investment your organization plans to spend on MRP hardware, software, and external technical service in the next 3 years. a) Less than $ 50,000 b) $ 50,000 or more and less than $ 200,000 c) $ 200,000 or more and less than $ 500,000 d) $ 500,000 or more and less than $ 1,000,000 e) One million dollars or more f) Don’t know / undefined
19. In terms of the total cost of your MRP system, what percentage of the total cost would you expect to be allotted for? Hardware: ________ % Software: ________ % External Technical Services: ________ % Other _________________ ________ % Total 100% Note: Total should sum to 100%
21. Were MRP users within your company involved in the selection of the MRP software prior to implementation? a) No b) Yes, internal users provided some input for the software selection. c) Yes, internal users were heavily involved in software selection.
22. Training on the existing MRP system is conducted by a) External consultants, MRP computer systems specialists b) In-house experts, employees involved with implementation c) There is no formal training program; training is done on-the job with experienced employees d) Other (describe) ____________________________________________________
23. Does your company have funds dedicated to training employees on the use of MRP-type computer systems, post installation? a) Yes b) No
80
24. Does your company have a Quality or Productivity Improvement Program such as TQM, OEE, TQMain, Six Sigma, QFD, MFD or ISO? a) Yes. b) No c) It was attempted If your answer was yes, please write which are the programs that are currently being used:________________________________________________________________________________
25. If your company does have a Quality, Productivity Improvement or Effectiveness Program, in what year was it or is it being implemented? a) ___________ (year) b) No such program exists
81
Part II
Effective Usage of MRP II-type System and User Satisfaction.
A. Answer the following group of questions by circling the number at the
right of each question, using the scale below: 0 = Not at all
1 = 1 - 20 %
2 = 21 - 40 %
3 = 41 - 60 %
4 = 61 - 80 %
5 = 81 - 100 %
To what degree is your MRP II system currently supports these functions?
(Circle one for each function) 0 1-20% 21-40% 41-60% 61-80% 81-100%
1. Inventory management/ Inventory Stock System 0 1 2 3 4 5 2. Bill of Materials 0 1 2 3 4 5 3. Purchasing and receiving 0 1 2 3 4 5 4. Materials requirement planning 0 1 2 3 4 5 5. Accounts payable/Accounts receivable 0 1 2 3 4 5 6. Cost Accounting 0 1 2 3 4 5 7. Sales order processing/ Order entry and invoicing 0 1 2 3 4 5 8. Routing/work centers 0 1 2 3 4 5 9. Payroll/personnel 0 1 2 3 4 5 10. Master production schedule 0 1 2 3 4 5 11. Shop floor control 0 1 2 3 4 5 12. Detailed operations scheduling 0 1 2 3 4 5 13. Capacity requirements planning 0 1 2 3 4 5 14. Forecasting End Items 0 1 2 3 4 5 15. Sales analysis 0 1 2 3 4 5 16. Product Data Management 0 1 2 3 4 5 17. To what degree are the different functions of your 0 1 2 3 4 5 MRP systems integrated?
82
B. From the experience your organization has had with MRP systems, rate
the following benefits of MRP systems using the following scale: 0 = No Benefit
C. What is the accuracy of the following types of data in your MRP-type
system? (Circle one for each) Poor Fair Good Excellent Not 0-80 % 81-90 % 91-95 % 96-100 %
Applicable 1. Inventory Records 1 2 3 4 x 2. Bill of Materials Records 1 2 3 4 x 3. Market Forecasts 1 2 3 4 x 4. Master Production Schedule 1 2 3 4 x 5. Production Lead Times 1 2 3 4 x 6. Vendor Lead Times 1 2 3 4 x 7. Shop Floor Control Data 1 2 3 4 x 8 Capacity Plan 1 2 3 4 x
84
D. Within the next 2 years, in which of the following areas do you expect
your organization to be further computerized? Please provide an
estimate based on your experience and your knowledge of the
organization. 0 = No additional computerization effort expected.
1 = Additional, though minimal computerization development expected.
2 = Some computerization effort is expected.
3 = Significant computerization in this area is anticipated.
(Cheng, 1997) _____________________________________________________________________________ Thank you for your participation. Please return the questionnair