Submitted 13 July 2015 Accepted 6 November 2015 Published 26 November 2015 Corresponding author Takashi Sato, [email protected], [email protected]Academic editor Min Zhao Additional Information and Declarations can be found on page 11 DOI 10.7717/peerj.1448 Copyright 2015 Masuda et al. Distributed under Creative Commons CC-BY 4.0 OPEN ACCESS The effectiveness of sputum pH analysis in the prediction of response to therapy in patients with pulmonary tuberculosis Makoto Masuda 1,2,3 , Takashi Sato 1,2 , Kentaro Sakamaki 4 , Makoto Kudo 1,2 , Takeshi Kaneko 2 and Yoshiaki Ishigatsubo 1 1 Department of Internal Medicine and Clinical Immunology, Yokohama City University Graduate School of Medicine, Yokohama, Japan 2 Department of Pulmonology, Yokohama City University Graduate School of Medicine, Yokohama, Japan 3 Department of Respiratory Medicine, Fujisawa City Hospital, Fujisawa, Japan 4 Department of Biostatistics and Epidemiology, Yokohama City University Graduate School of Medicine, Yokohama, Japan ABSTRACT Purpose. The predictive factor of response to antituberculous therapy has not been fully elucidated. Airway acidity has been thought to be a potential indicator of the bactericidal activity. Therefore, we hypothesized that monitoring airway acidity by measuring sputum pH could predict response to therapy. Methods. A total of 47 patients having newly diagnosed, smear-positive, active pulmonary tuberculosis were enrolled between October 2011 and March 2014. Sputum samples were serially analyzed before and after treatment. Eligible patients who initiated a standard 6-month treatment were monitored for the length of time to sputum smear and culture conversion. Results. There were 39 patients who completed a 2-month intensive phase of isoniazid, rifampicin, pyrazinamide, and ethambutol therapy followed by a 4-month continuation phase of isoniazid and rifampicin. Although factors including age, cavitation, sputum grade, and use of an acid-suppressant were associated with initial low sputum pH in univariate analysis, multivariate analysis revealed that only age ≥61 years was a statistically important factor predicting low pH value (p = 0.005). Further outcome analysis showed that initial low sputum pH before treatment was the only factor significantly associated with shorter length of time to both sputum smear and culture conversion (p = 0.034 and 0.019, respectively) independent of the effects of age, sputum bacterial load, extent of lung lesion, and cavitation. Thus, initial low sputum pH indicated favorable response to anti-tuberculosis therapy. Conclusions. Measuring sputum pH is an easy and inexpensive way of predicting response to standard combination therapy in patients with pulmonary tuberculosis. Subjects Infectious Diseases, Public Health, Respiratory Medicine Keywords Antituberculous therapy, Pulmonary tuberculosis, Airway acidity, Sputum pH INTRODUCTION Pulmonary tuberculosis (PTB) remains a major cause of death worldwide, accounting for 16.6% of newly diagnosed patients with PTB (an estimated 9.0 million) (World Health Organization, 2015a: Global Tuberculosis Report 2014) Antituberculous therapy using How to cite this article Masuda et al. (2015), The effectiveness of sputum pH analysis in the prediction of response to therapy in patients with pulmonary tuberculosis. PeerJ 3:e1448; DOI 10.7717/peerj.1448
Transcript
Submitted 13 July 2015Accepted 6 November 2015Published 26 November 2015
Additional Information andDeclarations can be found onpage 11
DOI 10.7717/peerj.1448
Copyright2015 Masuda et al.
Distributed underCreative Commons CC-BY 4.0
OPEN ACCESS
The effectiveness of sputum pH analysisin the prediction of response to therapyin patients with pulmonary tuberculosisMakoto Masuda1,2,3, Takashi Sato1,2, Kentaro Sakamaki4,Makoto Kudo1,2, Takeshi Kaneko2 and Yoshiaki Ishigatsubo1
1 Department of Internal Medicine and Clinical Immunology, Yokohama City UniversityGraduate School of Medicine, Yokohama, Japan
2 Department of Pulmonology, Yokohama City University Graduate School of Medicine,Yokohama, Japan
3 Department of Respiratory Medicine, Fujisawa City Hospital, Fujisawa, Japan4 Department of Biostatistics and Epidemiology, Yokohama City University Graduate School of
Medicine, Yokohama, Japan
ABSTRACTPurpose. The predictive factor of response to antituberculous therapy has not beenfully elucidated. Airway acidity has been thought to be a potential indicator of thebactericidal activity. Therefore, we hypothesized that monitoring airway acidity bymeasuring sputum pH could predict response to therapy.Methods. A total of 47 patients having newly diagnosed, smear-positive, activepulmonary tuberculosis were enrolled between October 2011 and March 2014.Sputum samples were serially analyzed before and after treatment. Eligible patientswho initiated a standard 6-month treatment were monitored for the length of time tosputum smear and culture conversion.Results. There were 39 patients who completed a 2-month intensive phase ofisoniazid, rifampicin, pyrazinamide, and ethambutol therapy followed by a 4-monthcontinuation phase of isoniazid and rifampicin. Although factors including age,cavitation, sputum grade, and use of an acid-suppressant were associated with initiallow sputum pH in univariate analysis, multivariate analysis revealed that only age≥61 years was a statistically important factor predicting low pH value (p = 0.005).Further outcome analysis showed that initial low sputum pH before treatment wasthe only factor significantly associated with shorter length of time to both sputumsmear and culture conversion (p = 0.034 and 0.019, respectively) independent ofthe effects of age, sputum bacterial load, extent of lung lesion, and cavitation. Thus,initial low sputum pH indicated favorable response to anti-tuberculosis therapy.Conclusions. Measuring sputum pH is an easy and inexpensive way of predictingresponse to standard combination therapy in patients with pulmonary tuberculosis.
INTRODUCTIONPulmonary tuberculosis (PTB) remains a major cause of death worldwide, accounting for
16.6% of newly diagnosed patients with PTB (an estimated 9.0 million) (World Health
Organization, 2015a: Global Tuberculosis Report 2014) Antituberculous therapy using
How to cite this article Masuda et al. (2015), The effectiveness of sputum pH analysis in the prediction of response to therapy in patientswith pulmonary tuberculosis. PeerJ 3:e1448; DOI 10.7717/peerj.1448
Notes.a Acid-suppressant including histamine-2 receptor antagonist and proton pump inhibitor.b Immunocompromised; Patients having diabetes mellitus and/or corticosteroid user.c Extensive lung lesion; Radiological extent of parenchymal disease over one whole lung.d Sputum appearance classified by Miller and Jones’ classification.
treatment were calculated using the paired t-test. Univariate analyses using chi-square test
or Fisher’s exact test were used to compare across potential factors affecting sputum pH.
Multivariate logistic regression analysis (forward) was performed to identify significant
independent predictors. Independent variables were included in the model when the
p-value was <0.20 in each variable because potential confounders should be eliminated
only if p > 0.20 in order to prevent residual confounding (Horne et al., 2010; Maldonado &
Greenland, 1993). The independence of factors affecting treatment outcome was evaluated
by the Cox proportional hazards model. The time to sputum smear and culture conversion
was assessed by the log-rank test. A two-tailed p-value of <0.05 was considered statistically
significant. Continuous data were expressed as mean ± standard deviation (SD). Statistical
analyzes were performed using MedCalc version 15 (Mariakerke, Belgium).
RESULTSCharacteristicsForty-seven patients were recruited and enrolled in this study. Of these, 1 patient with
liver cancer and 1 pregnant patient were excluded. Furthermore, 2 patients who initiated
treatment with HRE due to liver cirrhosis and 4 patients who discontinued treatment
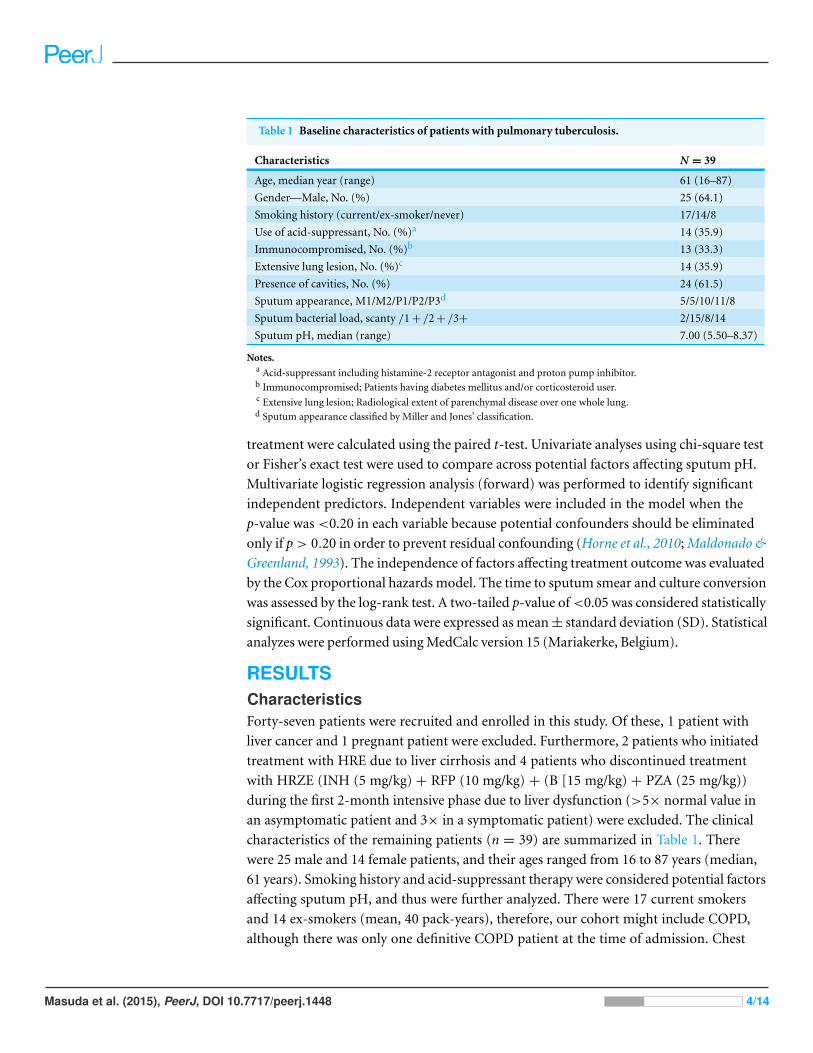
Figure 1 Distribution of initial sputum pH before treatment in pulmonary tuberculosis patients. ThepH of freshly collected sputum samples was measured according to the Methods section. In the 39 patientsincluded, the median value of initial sputum pH was 7.00.
X-ray showed that 14 patients (35.9%) had extensive pulmonary lesions over one whole
lung, and 24 patients (61.5%) had cavities. We confirmed that no patient had a history of
bronchial asthma or was co-infected with HIV. Cultures from all patients showed favorable
susceptibility to INH, RFP, EB, and PZA.
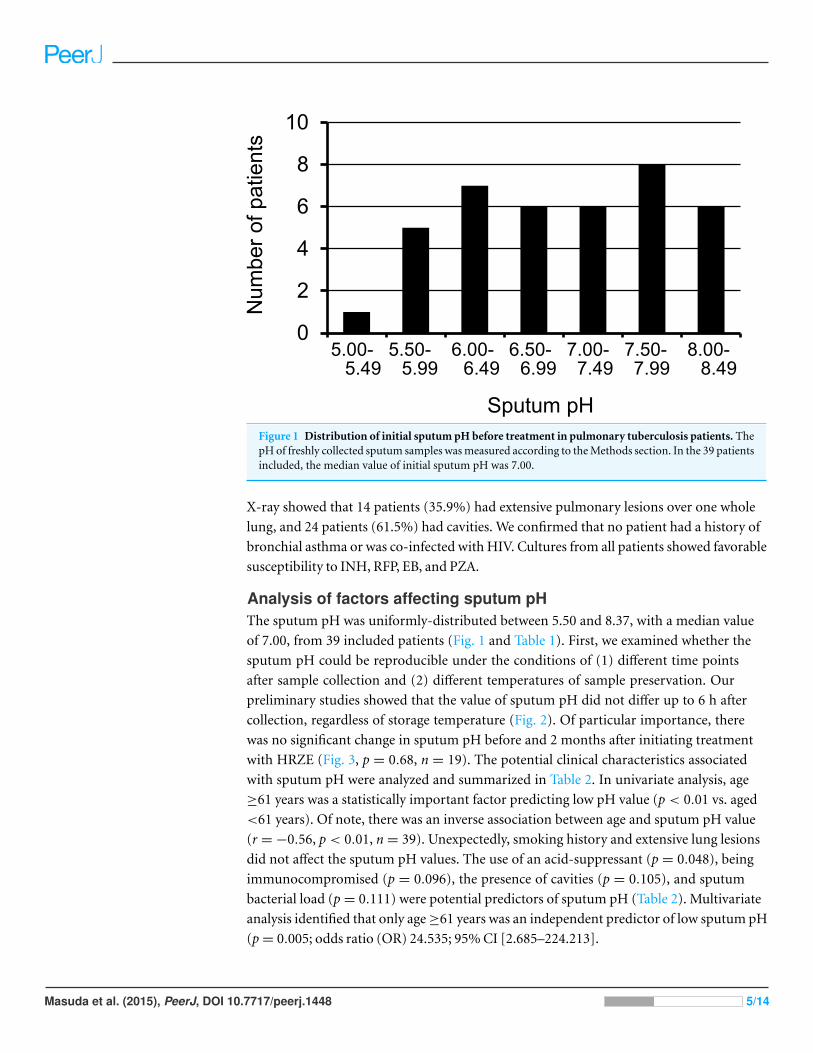
Analysis of factors affecting sputum pHThe sputum pH was uniformly-distributed between 5.50 and 8.37, with a median value
of 7.00, from 39 included patients (Fig. 1 and Table 1). First, we examined whether the
sputum pH could be reproducible under the conditions of (1) different time points
after sample collection and (2) different temperatures of sample preservation. Our
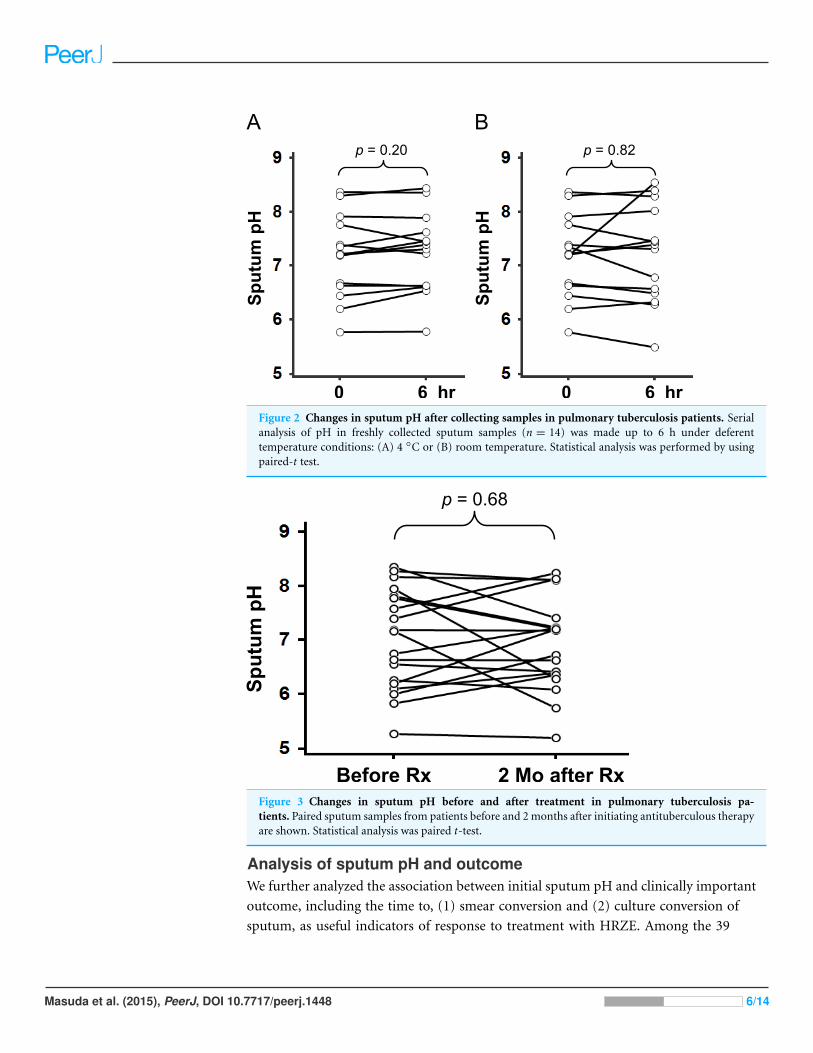
preliminary studies showed that the value of sputum pH did not differ up to 6 h after
collection, regardless of storage temperature (Fig. 2). Of particular importance, there
was no significant change in sputum pH before and 2 months after initiating treatment
with HRZE (Fig. 3, p = 0.68, n = 19). The potential clinical characteristics associated
with sputum pH were analyzed and summarized in Table 2. In univariate analysis, age
≥61 years was a statistically important factor predicting low pH value (p < 0.01 vs. aged
<61 years). Of note, there was an inverse association between age and sputum pH value
(r = −0.56, p < 0.01, n = 39). Unexpectedly, smoking history and extensive lung lesions
did not affect the sputum pH values. The use of an acid-suppressant (p = 0.048), being
immunocompromised (p = 0.096), the presence of cavities (p = 0.105), and sputum
bacterial load (p = 0.111) were potential predictors of sputum pH (Table 2). Multivariate
analysis identified that only age ≥61 years was an independent predictor of low sputum pH
(p = 0.005; odds ratio (OR) 24.535; 95% CI [2.685–224.213].
Masuda et al. (2015), PeerJ, DOI 10.7717/peerj.1448 5/14
Figure 2 Changes in sputum pH after collecting samples in pulmonary tuberculosis patients. Serialanalysis of pH in freshly collected sputum samples (n = 14) was made up to 6 h under deferenttemperature conditions: (A) 4 ◦C or (B) room temperature. Statistical analysis was performed by usingpaired-t test.
Before Rx 2 Mo after Rx
SputumpH
p = 0.68
Figure 3 Changes in sputum pH before and after treatment in pulmonary tuberculosis pa-tients. Paired sputum samples from patients before and 2 months after initiating antituberculous therapyare shown. Statistical analysis was paired t-test.
Analysis of sputum pH and outcomeWe further analyzed the association between initial sputum pH and clinically important
outcome, including the time to, (1) smear conversion and (2) culture conversion of
sputum, as useful indicators of response to treatment with HRZE. Among the 39
Masuda et al. (2015), PeerJ, DOI 10.7717/peerj.1448 6/14
Table 2 Univariate and multivariate analyses of odds ratio for an initial low sputum pH (<7.00).
Univariate analysis Multivariate analysis
Characteristics OR 95% CI Pe OR 95% CI Pf
Age ≥61 yr 8.750 2.100–36.251 0.004 24.535 2.685–224.213 0.005
Male sex 2.291 0.613–8.498 0.320
Smoking history (current/ex-smoker vs. never) 0.938 0.214–4.108 1.000
Use of acid-suppressanta 4.444 1.115–17.497 0.048
Immunocompromisedb 3.600 0.905–14.132 0.096
Extensive lung lesionc 1.697 0.466–6.165 0.514
Presence of cavities 0.300 0.080–1.130 0.105
Sputum appearanced(M vs P) 0.542 0.134–2.219 0.480 0.104 0.010–1.128 0.063
Sputum bacterial load (<2+ vs ≥2+) 3.208 0.877–11.719 0.111
Notes.CI, confidence interval; OR, odds ratio.
a Acid-suppressant including histamine-2 receptor antagonist and proton pump inhibitor.b Immunocompromised; Patients having diabetes mellitus and/or corticosteroid user.c Extensive lung lesion; Radiological extent of parenchymal disease over one whole lung.d Sputum appearance classified by Miller and Jones’ classification.e Fisher’s exact test.f Logistic regression.
patients included, 5 patients showing persistent smear-positive results fulfilled the
discharge criteria. Therefore, the remaining 34 patients were examined as evaluable
smear-conversion subjects. There was a moderate positive relationship between initial
sputum pH and time to smear conversion (r = 0.342, p = 0.048, n = 34). Similarly, initial
sputum pH was modestly correlated with time to culture conversion (r = 0.304, p = 0.060,
n = 39). Further, when patients were divided into initial sputum pH <7.00 vs. ≥7.00
(median for whole group) groups, the low pH group showed significantly shorter hospital
stay as determined by time to smear conversion (29.6 ± 31.0 vs. 61.5 ± 32.5 days [mean
± SD], p = 0.028, log-rank test) or alternatively, time to culture conversion (30.5 ± 17.9
vs. 51.4 ± 19.4 days [mean ± SD], p = 0.007, log-rank test) as shown in Fig. 4. Since age
was shown to be significantly correlated with sputum pH (Table 2), we evaluated the effect
of age on outcome analysis. Also, known factors such as sputum bacterial load, extent
of lung lesion, and cavity formation have been thought of as biomarkers to identify PTB
patients at risk of longer hospital stays and relapse (Fortun et al., 2007; Hesseling et al.,
2010; Horne et al., 2010), and thus be included in multivariate Cox regression analysis.
Interestingly, although age ≥61 years is also a factor affecting initial low sputum pH, the
lack of significance between age and response to therapy is identified (Tables 2 and 3).
This is convincing because elder PTB patients exhibit higher mortality (Feng et al., 2011).
Possible reasons of this dissociation are thought to be treatment interruption and/or
discontinuation due to multiple organ dysfunctions caused by initiating therapy in elder
patients. However, 14 (30%) of the 47 patients enrolled in the current study were aged
75 years or older, and the majority (n = 12, 86%) of these patients could continue HRZE,
and could be discharged from hospital. Thus, older age may not always associate with
higher mortality in PTB. Importantly, other potential factors such as sputum bacterial
Masuda et al. (2015), PeerJ, DOI 10.7717/peerj.1448 7/14
Figure 4 The time to sputum smear and culture conversion in pulmonary tuberculosis pa-tients. Thirty-nine included patients were divided into groups according to median initial sputum pH.Kaplan–Meier Curves of time to (A) sputum smear conversion and (B) sputum culture conversion weremade in low (pH < 7.00) and high (pH ≥ 7.00) sputum pH groups, and analyzed using the log-rank test.Ticks indicate censored data.
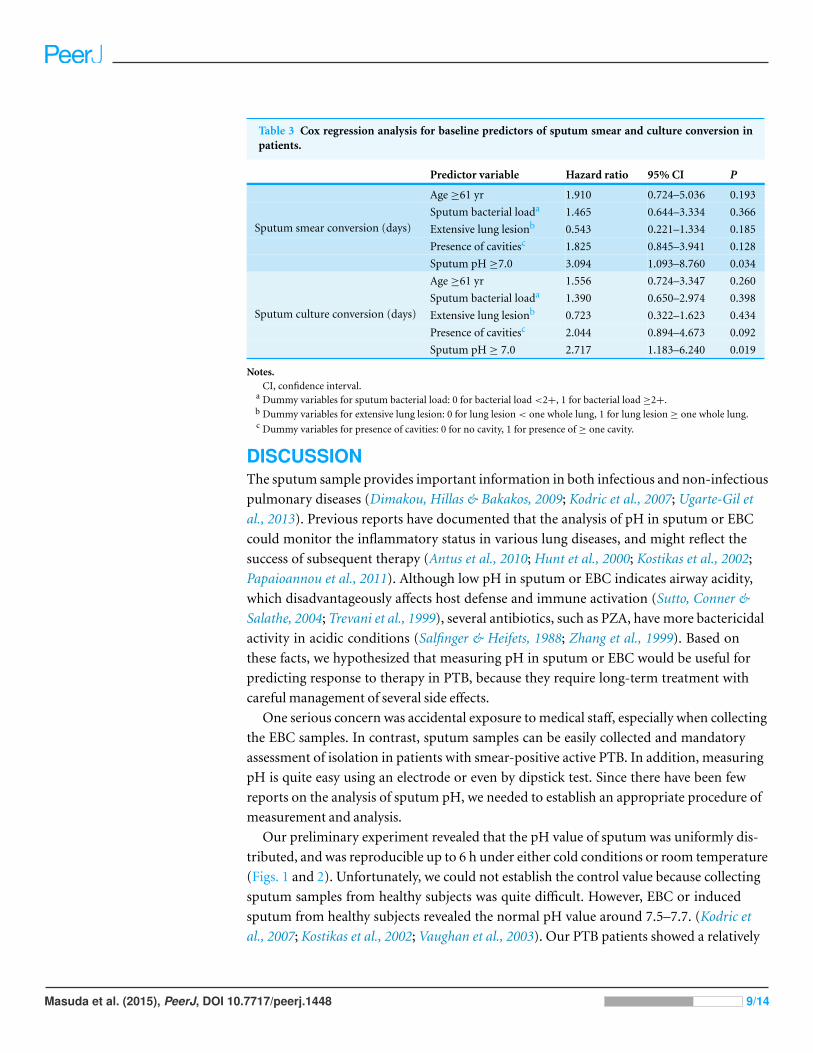
load, extensive lung involvement, and cavity formation did not affect the outcome analysis
using a multivariate Cox regression model in our cohort (Table 3). Accordingly, sputum
pH was found to be the most powerful independent predictor of the time to both sputum
smear and culture conversion in patients receiving the standard 2-month HRZE followed
by a 4-month HR therapy (Table 3, p = 0.034 and 0.019, respectively).
Masuda et al. (2015), PeerJ, DOI 10.7717/peerj.1448 8/14
Table 3 Cox regression analysis for baseline predictors of sputum smear and culture conversion inpatients.
Predictor variable Hazard ratio 95% CI P
Age ≥61 yr 1.910 0.724–5.036 0.193
Sputum bacterial loada 1.465 0.644–3.334 0.366
Extensive lung lesionb 0.543 0.221–1.334 0.185
Presence of cavitiesc 1.825 0.845–3.941 0.128
Sputum smear conversion (days)
Sputum pH ≥7.0 3.094 1.093–8.760 0.034
Age ≥61 yr 1.556 0.724–3.347 0.260
Sputum bacterial loada 1.390 0.650–2.974 0.398
Extensive lung lesionb 0.723 0.322–1.623 0.434
Presence of cavitiesc 2.044 0.894–4.673 0.092
Sputum culture conversion (days)
Sputum pH ≥ 7.0 2.717 1.183–6.240 0.019
Notes.CI, confidence interval.
a Dummy variables for sputum bacterial load: 0 for bacterial load <2+, 1 for bacterial load ≥2+.b Dummy variables for extensive lung lesion: 0 for lung lesion < one whole lung, 1 for lung lesion ≥ one whole lung.c Dummy variables for presence of cavities: 0 for no cavity, 1 for presence of ≥ one cavity.
DISCUSSIONThe sputum sample provides important information in both infectious and non-infectious
pulmonary diseases (Dimakou, Hillas & Bakakos, 2009; Kodric et al., 2007; Ugarte-Gil et
al., 2013). Previous reports have documented that the analysis of pH in sputum or EBC
could monitor the inflammatory status in various lung diseases, and might reflect the
success of subsequent therapy (Antus et al., 2010; Hunt et al., 2000; Kostikas et al., 2002;
Papaioannou et al., 2011). Although low pH in sputum or EBC indicates airway acidity,
which disadvantageously affects host defense and immune activation (Sutto, Conner &
Salathe, 2004; Trevani et al., 1999), several antibiotics, such as PZA, have more bactericidal
activity in acidic conditions (Salfinger & Heifets, 1988; Zhang et al., 1999). Based on
these facts, we hypothesized that measuring pH in sputum or EBC would be useful for
predicting response to therapy in PTB, because they require long-term treatment with
careful management of several side effects.
One serious concern was accidental exposure to medical staff, especially when collecting
the EBC samples. In contrast, sputum samples can be easily collected and mandatory
assessment of isolation in patients with smear-positive active PTB. In addition, measuring
pH is quite easy using an electrode or even by dipstick test. Since there have been few
reports on the analysis of sputum pH, we needed to establish an appropriate procedure of
measurement and analysis.
Our preliminary experiment revealed that the pH value of sputum was uniformly dis-
tributed, and was reproducible up to 6 h under either cold conditions or room temperature
(Figs. 1 and 2). Unfortunately, we could not establish the control value because collecting
sputum samples from healthy subjects was quite difficult. However, EBC or induced
sputum from healthy subjects revealed the normal pH value around 7.5–7.7. (Kodric et
al., 2007; Kostikas et al., 2002; Vaughan et al., 2003). Our PTB patients showed a relatively
Masuda et al. (2015), PeerJ, DOI 10.7717/peerj.1448 9/14
REFERENCESAntus B, Barta I, Kullmann T, Lazar Z, Valyon M, Horvath I, Csiszer E. 2010. Assessment of
exhaled breath condensate pH in exacerbations of asthma and chronic obstructive pulmonarydisease: a longitudinal study. American Journal of Respiratory and Critical Care Medicine182:1492–1497 DOI 10.1164/rccm.201003-0451OC.
Diacon AH, Dawson R, Von Groote-Bidlingmaier F, Symons G, Venter A, Donald PR, VanNiekerk C, Everitt D, Winter H, Becker P, Mendel CM, Spigelman MK. 2012. 14-daybactericidal activity of PA-824, bedaquiline, pyrazinamide, and moxifloxacin combinations:a randomised trial. Lancet 380:986–993 DOI 10.1016/S0140-6736(12)61080-0.
Dimakou K, Hillas G, Bakakos P. 2009. Adenosine deaminase activity and its isoenzymes in thesputum of patients with pulmonary tuberculosis. International Journal of Tuberculosis and LungDisease 13:744–748.
Feng JY, Su WJ, Chiu YC, Huang SF, Lin YY, Huang RM, Lin CH, Hwang JJ, Lee JJ, Yu MC,Yu KW, Lee YC. 2011. Initial presentations predict mortality in pulmonary tuberculosispatients—a prospective observational study. PLoS ONE 6:e23715DOI 10.1371/journal.pone.0023715.
Fortun J, Martin-Davila P, Molina A, Navas E, Hermida JM, Cobo J, Gomez-Mampaso E,Moreno S. 2007. Sputum conversion among patients with pulmonary tuberculosis: are thereimplications for removal of respiratory isolation? Journal of Antimicrobial Chemotherapy59:794–798 DOI 10.1093/jac/dkm025.
Gessner C, Hammerschmidt S, Kuhn H, Seyfarth HJ, Sack U, Engelmann L, Schauer J, Wirtz H.2003. Exhaled breath condensate acidification in acute lung injury. Respiratory Medicine97:1188–1194 DOI 10.1016/S0954-6111(03)00225-7.
Gillespie SH, Crook AM, McHugh TD, Mendel CM, Meredith SK, Murray SR, Pappas F,Phillips PP, Nunn AJ, Consortium RE. 2014. Four-month moxifloxacin-based regimensfor drug-sensitive tuberculosis. New England Journal of Medicine 371:1577–1587DOI 10.1056/NEJMoa1407426.
Hesseling AC, Walzl G, Enarson DA, Carroll NM, Duncan K, Lukey PT, Lombard C, Donald PR,Lawrence KA, Gie RP, van Helden PD, Beyers N. 2010. Baseline sputum time to detectionpredicts month two culture conversion and relapse in non-HIV-infected patients. InternationalJournal of Tuberculosis and Lung Disease 14:560–570.
Horita N, Miyazawa N, Yoshiyama T, Kojima R, Omori N, Inoue M, Kaneko T, Ishigatsubo Y.2012. The presence of pretreatment cavitations and the bacterial load on smears predicttuberculosis infectivity negative conversion judged on sputum smear or culture. InternalMedicine 51:3367–3372 DOI 10.2169/internalmedicine.51.8585.
Horne DJ, Johnson CO, Oren E, Spitters C, Narita M. 2010. How soon should patients withsmear-positive tuberculosis be released from inpatient isolation? Infection Control and HospitalEpidemiology 31:78–84 DOI 10.1086/649022.
Hunt JF, Fang K, Malik R, Snyder A, Malhotra N, Platts-Mills TA, Gaston B. 2000. Endogenousairway acidification. Implications for asthma pathophysiology. American Journal of Respiratoryand Critical Care Medicine 161:694–699 DOI 10.1164/ajrccm.161.3.9911005.
Jindani A, Aber VR, Edwards EA, Mitchison DA. 1980. The early bactericidal activity of drugs inpatients with pulmonary tuberculosis. American Review of Respiratory Disease 121:939–949.
Jindani A, Harrison TS, Nunn AJ, Phillips PP, Churchyard GJ, Charalambous S,Hatherill M, Geldenhuys H, McIlleron HM, Zvada SP, Mungofa S, Shah NA, Zizhou S,Magweta L, Shepherd J, Nyirenda S, van Dijk JH, Clouting HE, Coleman D, Bateson AL,
Masuda et al. (2015), PeerJ, DOI 10.7717/peerj.1448 12/14
McHugh TD, Butcher PD, Mitchison DA, Team RT. 2014. High-dose rifapentine withmoxifloxacin for pulmonary tuberculosis. New England Journal of Medicine 371:1599–1608DOI 10.1056/NEJMoa1314210.
Kodric M, Shah AN, Fabbri LM, Confalonieri M. 2007. An investigation of airway acidificationin asthma using induced sputum: a study of feasibility and correlation. American Journal ofRespiratory and Critical Care Medicine 175:905–910 DOI 10.1164/rccm.200607-940OC.
Kostikas K, Papatheodorou G, Ganas K, Psathakis K, Panagou P, Loukides S. 2002. pH inexpired breath condensate of patients with inflammatory airway diseases. American Journalof Respiratory and Critical Care Medicine 165:1364–1370 DOI 10.1164/rccm.200111-068OC.
Maldonado G, Greenland S. 1993. Simulation study of confounder-selection strategies. AmericanJournal of Epidemiology 138:923–936.
Papaioannou AI, Loukides S, Minas M, Kontogianni K, Bakakos P, Gourgoulianis KI,Alchanatis M, Papiris S, Kostikas K. 2011. Exhaled breath condensate pH as a biomarker ofCOPD severity in ex-smokers. Respiratory Research 12:Article 67.
Piddington DL, Kashkouli A, Buchmeier NA. 2000. Growth of Mycobacterium tuberculosis ina defined medium is very restricted by acid pH and Mg(2+) levels. Infection and Immunity68:4518–4522 DOI 10.1128/IAI.68.8.4518-4522.2000.
Salfinger M, Heifets LB. 1988. Determination of pyrazinamide MICs for Mycobacteriumtuberculosis at different pHs by the radiometric method. Antimicrobial Agents andChemotherapy 32:1002–1004 DOI 10.1128/AAC.32.7.1002.
Sato T, Saito Y, Inoue S, Shimosato T, Takagi S, Kaneko T, Ishigatsubo Y. 2012. Serum hemeoxygenase-1 as a marker of lung function decline in patients with chronic silicosis. Journal of Oc-cupational and Environmental Medicine 54:1461–1466 DOI 10.1097/JOM.0b013e3182636e93.
Schaberg T, Rebhan K, Lode H. 1996. Risk factors for side-effects of isoniazid, rifampin andpyrazinamide in patients hospitalized for pulmonary tuberculosis. European Respiratory Journal9:2026–2030 DOI 10.1183/09031936.96.09102026.
Sutto Z, Conner GE, Salathe M. 2004. Regulation of human airway ciliary beat frequency byintracellular pH. Journal of Physiology 560:519–532 DOI 10.1113/jphysiol.2004.068171.
Trevani AS, Andonegui G, Giordano M, Lopez DH, Gamberale R, Minucci F, Geffner JR. 1999.Extracellular acidification induces human neutrophil activation. Journal of Immunology162:4849–4857.
Tseliou E, Bessa V, Hillas G, Delimpoura V, Papadaki G, Roussos C, Papiris S, Bakakos P,Loukides S. 2010. Exhaled nitric oxide and exhaled breath condensate pH in severe refractoryasthma. Chest 138:107–113 DOI 10.1378/chest.10759.
Tuberculosis Research Committee TJ. 2015. Nationwide survey of anti-tuberculosis drugresistance in Japan. International Journal of Tuberculosis and Lung Disease 19:157–162DOI 10.5588/ijtld.13.0905.
Ugarte-Gil CA, Elkington P, Gilman RH, Coronel J, Tezera LB, Bernabe-Ortiz A, Gotuzzo E,Friedland JS, Moore DA. 2013. Induced sputum MMP-1, -3 & -8 concentrations duringtreatment of tuberculosis. PLoS ONE 8:e61333 DOI 10.1371/journal.pone.0061333.
Vaughan J, Ngamtrakulpanit L, Pajewski TN, Turner R, Nguyen TA, Smith A, Urban P, Hom S,Gaston B, Hunt J. 2003. Exhaled breath condensate pH is a robust and reproducible assay ofairway acidity. European Respiratory Journal 22:889–894 DOI 10.1183/09031936.03.00038803.
World Health Organization. 2010. Guidelines for treatment of tuberculosis. 4th edition. Geneva:World Health Organization.
Masuda et al. (2015), PeerJ, DOI 10.7717/peerj.1448 13/14
World Health Organization. 2015a. Global Tuberculosis Report 2014. Available at http://www.who.int/tb/publications/global report/en/ (accessed 18 April 2015).
World Health Organization. 2015b. Tuberculosis country profiles. Available at http://www.who.int/tb/country/data/profiles/en/ (accessed 18 April 2015).
Zhang Y, Scorpio A, Nikaido H, Sun Z. 1999. Role of acid pH and deficient efflux of pyrazinoicacid in unique susceptibility of Mycobacterium tuberculosis to pyrazinamide. Journal ofBacteriology 181:2044–2049.
Masuda et al. (2015), PeerJ, DOI 10.7717/peerj.1448 14/14