+ All Categories
Home > Documents > The effects of a combined weight training and running ...

The effects of a combined weight training and running ...

Date post: 06-Feb-2022
Category:
Upload: others
View: 1 times
Download: 0 times
Share this document with a friend
75
Portland State University Portland State University PDXScholar PDXScholar Dissertations and Theses Dissertations and Theses 1983 The effects of a combined weight training and The effects of a combined weight training and running program on body composition in college running program on body composition in college males males Robert L. Hesslink Jr. Portland State University Follow this and additional works at: https://pdxscholar.library.pdx.edu/open_access_etds Part of the Health and Physical Education Commons Let us know how access to this document benefits you. Recommended Citation Recommended Citation Hesslink, Robert L. Jr., "The effects of a combined weight training and running program on body composition in college males" (1983). Dissertations and Theses. Paper 3319. https://doi.org/10.15760/etd.3299 This Thesis is brought to you for free and open access. It has been accepted for inclusion in Dissertations and Theses by an authorized administrator of PDXScholar. Please contact us if we can make this document more accessible: [email protected].
Transcript

Portland State University Portland State University

PDXScholar PDXScholar

Dissertations and Theses Dissertations and Theses

1983

The effects of a combined weight training and The effects of a combined weight training and

running program on body composition in college running program on body composition in college

males males

Robert L. Hesslink Jr. Portland State University

Follow this and additional works at: https://pdxscholar.library.pdx.edu/open_access_etds

Part of the Health and Physical Education Commons

Let us know how access to this document benefits you.

Recommended Citation Recommended Citation Hesslink, Robert L. Jr., "The effects of a combined weight training and running program on body composition in college males" (1983). Dissertations and Theses. Paper 3319. https://doi.org/10.15760/etd.3299

This Thesis is brought to you for free and open access. It has been accepted for inclusion in Dissertations and Theses by an authorized administrator of PDXScholar. Please contact us if we can make this document more accessible: [email protected].

AN ABSTRACT OF THE THESIS of Robert L. Hesslink, Jr. for the Master of Science in Teaching in Physical Education presented October 26, 1983.

Titles The Effects of a Combined Weight Training and Running Program on Body Composition in College Males.

THESIS COMMITTEEa

The present study attempted to investigate whether

a combined weight and endurai.~ce training program can

elicit more favorable changes in body composition than

either method of training alone. Body composition para­

meters (absolute fat and fat-free weight) were evaluated

using circumference measurements, skinfolds and hydrostatic

weighing. Cardiorespiratory fitness was evaluated via a

modified Harvard step-test. All tests were administered

before and after 10 weeks of ~raining. Exercises were

performed J days/week for 40 minutes/day. Male volunteers

(n=21) were randomly assigned to one of three treatment

groups (weight training only, endurance running only,

combined weight training and endurance running). Weight

training (Group I) was designed to elicit muscle hyper­

trophy and involved 5 sets of 8-10 repetitions/set.

Intensity was set at 80% of one repetition maximum for

each lift. Subjects performed the parallel squat, bench

press and dead-lift exercises. Endurance running (Group

II) was designed to elicit cardiorespiratory improvement.

Intensity was maintained at 60% of each subject's heart

rate range. Subjects in the combined group (Group III)

used the same weight training exercises as Group I

except they performed 3 sets of 8-10 repetitions/set

2

in twenty minutes followed by twenty minutes of endurance

running. Control subjects (n=4) were selected from original

candidates who could not meet the time requirements of the

study (8:30 a.m. - 10100 a.m.,MWF) and from physical

education classes with low levels of activity (i.e. -

archery, bowling, golf). These subjects were instructed

to remain sedentary during the 10-weeks of the study.

Differences among the groups on post-test scores were

evaluated via analysis of covariance, using pre-test

scores to reduce within group (error) variance. Tukey's

HSD procedure was selected to evaluate further group

differences in pairs when a significant F-ratio was

obtained. Using the method of hydrostatic weighing, a

significant F-ratio was found when analyzing post-test

measures of fat-free weight (F=5.J, p~ .02). However,

Tukey's procedure showed that the only significant

J

pairwise \Comparison was the weight training group vs. the

endurance group {p <..05, 68.1 kg vs. 62.8 kg, respectively).

!-ratios for absolute fat (F= .02, p<.89) and total body

weight (F= 1.8, p<...22) were not significantly different.

There were no significant post-test differences for

absolute fat {F= .46, p<.71), fat-free weight (F= .48,

p ( • 70) or circumference sum (F= .48, p (. 70) using

circumference measurements. Skinfold techniques did not

show significant difference for absolute fat (F= .63,

p ~ .62), fat-free weight (F= 1.5, p (.28) or skinfold

sum (F= .48, p (.70). Analysis of the step-test data

resulted in a significant f-ratio for heart rate response

on the post-test {F= 6.5, p <.. .01). Using Tukey's procedure,

the piean heart rate of the combined group (104 bpm) was

significantly lower than that of the control group,

(139.J bpm) and that of the weight training group {1J8.8bpm).

In summary, the present study suggests that a combined

weight and endurance training program does not elicit more

favorable changes in body composition than either method of

training alone. The combined program did, however, provide

minimal improvement in cardiorespiratory fitness suggesting

that twenty minutes of running can elicity measureable

improvement.

THE EFFECTS OF A COMBINED WEIGHT TRAINING

AND RUNNING PROGRAM ON BODY COMPOSITION

IN COLLEGE MALES

by

ROBERT L. HESSLINK, JR.

A thesis submitted in partial fulfillment of the

requirements for the degree of

MASTER OF SCIENCE

in

TEACHING

in

PHYSICAL EDUCATION

Portland State University

1983

TO THE OFFICE OF GRADUATE STUDIES AND RESEARCH

The members of the Committee approve the thesis of ~

Robert,~~ Hesslink, Jr. presented October 26, 1983.

Joe KaoJ

APPROVED:

Jack School of Heal th and PhysfcaT-Education

Stanley E. Rauch, Dean -of Graduate Studies and Research

TABLE OF CONTENTS

LIST OF TABLES • • • • • • • • • • • • • • • • • • • • • vi

CHAPTER

I

II

INTRODUCTION • • • • • • • • • • • • • . • • 1

REVIEW OF LITERATURE • • • • • • • • • • • • 5

Effects of Weight Training on Body

Composition and Cardiorespiratory Fitness. • 5

Effects of Endurance Training on Body

Composition and Cardiorespiratory Fitness. • 8

Effects of Circuit Weight Training on Body

Composition and Cardiorespiratory Fitness. • 10

Effects of Combined Weight Training and

Endurance Programs on Body Composition and

Cardiorespiratory Fitness. 13

iv

III STATEMENT OF THE PROBLEM • • • • • • • • • • 18

IV RESEARCH DESIGN AND METHODOLOGY. • • • • • • 21

Subjects • • • • • • • • • • • • • • • • • • 21

Pre-conditioning • • • • • • • • • • • • • • 24

Weight Training Program for Group I. • • • • 24

Endurance Program for Group II • • • • • • • 26

Weight and Endurance Program for Group III • 29

Measurement of Cardiorespiratory Fitness • • 31

Measurement of Body Weight and Height • • • • 31

Girth and Skinfold Measurement. • ? • • • • • • 32

Measurement of Residual Volume •••••••• 33

Measurement of Body Density ••••••••• 35

Statistical Treatment • • • • • • • • • • • • 36

v

V RESULTS AND DISCUSSION •••••••••••• 37

VI IMPLICATIONS FOR FUTURE RESEARCH ••••••• 50

LIST OF REFERENCES •••••••••••••••••••• 57

APPENDICES ••••••••••••••••••••••• ~ 60

LIST OF TABLES

TABLE PAGE

I Hypothetical Changes in Body Composition 19

II Experimental Design 22

III Pre-conditioning Program 25

IV Progressive Endurance Program for Group II 27

v Progressive Endurance Program for Group III 30

VI Descriptive Statistics 38

VII Training Mileage for Groups II and III 40

VIII Strength Assessment 41

IX Cardiorespiratory Fitness 43

x Hydrostatic Weighing Data 44

XI

XII

XIII

Circumference Data

Skinfold Data

A Comparison of Net Tissue Changes Produced

Through Various Training Programs

vii

46

47

53

CHAPTER I

INTRODUCTION

The concern for cardiovascular health in the late

1960's and early 1970's brought an increased awareness of a

need for aerobic conditioning, of which jogging was the

primary activity. As the popularity of jogging increased,

the attention of the American public shifted away from total

body conditioning and emphasis was placed on the maintenance

of central core functioning (i.e., the heart). This

perspective still persists today as is evident in the low

priority given to strength training in exercise prescription

literature.

Ideally, an exercise program should be varied and yet

still specific to the needs and interests of an individual.

In business and scholastic environments, time is an element

that cannot be relinquished without loss of financial

revenue or knowledge. Therefore, another requirement of all

exercise programs is a need to be time-effective. As

Wilmore (33, p. 130) writes, "individualized prescription of

exercise is now a reality and is being used successfully

throughout the United States." If Wilrnore's observation is

true, then recommendations and knowledge about exercise

programs must be accurate and time-effective in meeting the

needs of the individual.

2

The question of how to obtain an optimal body

composition is still not entirely clear. Should one engage

only in aerobic exercise to improve body composi~ion?

Cannot weight training activities designed to increase the

amount of lean body weight also have a favorable effect on

body composition? This study was initiated from personal

observations during hydrostatic weighing of athletes who

primarily used jogging or running for conditioning purposes.

Many such athletes seemed to have a higher percent of body

fat than one would expect given their training regimes.

This was particularly noteworthy because it also appeared

that other athletes who primarily engaged in weight training

seemed to.have less body fat than those individuals training

via aerobic activities. Is .it not possible that a combined

running and weight training program can elicit more

favorable changes in body composition than either method

alone? It is to this latter question that the present study

is addressed.

Before the literature is reviewed, selected

terminology is presented so that precise interpretation of

results may be facilitated. These include':

Hypertrophy training -- A weight training program in

which_3 sets of 10 repetitions are performed

with an intensity equal to 80% of one repetition

maximum.

Strength training -- A weight training program in

which 3 sets of 3-4 repetitions are performed

with an intensity equal to 90-95% of one

repetition maximum.

Circuit training -- A training method in which an

individual moves from one exercise station to

another performing specified exercises.

Cardiorespiratory fitness -- The ability of the

circulatory and respiratory system to

efficiently meet imposed demands during all

levels of exercise.

Residual volume -- The amount of air that remains in

the lungs and respiratory passages after a

maximal exhalation.

3

Absolute fat -- The total amount of body fat found in

the human body.

Fat-free weight -- Weight of the body that does not

include absolute fat, but consists of bones,

muscle, skin, fluids, etc.

Relative fat -- Ratio of absolute fat to total body

weight expressed as a percentage.

Combined training program -- A program in which

endurance and weight training activities are

performed in series within a specified workout

during one day. This type of combined program

4

differs from an alternating combined program in

which weight training and endurance activities

are performed on an alternate day basis (i.e. -­

weight training-MWF; endurance training-TTHS).

CHAPTER II

REVIEW OF LITERATURE

The review of literature will cover research on

standard categories of training programs as they affect body

composition and cardiorespiratory fitness. The categories

include: weight training, endurance training, circuit

weight training and combined training.

Effects of Weight Training on Body Composition and Cardio­

Respiratory Fitness

An original study by Nagle and Irwin (23} investigated

the effects of weight training on cardiorespiratory

fitness. In the study, two groups performed a series of

weight training exercises for one hour, 3 days per week for

8 weeks. The exercises included arm curls, military press,

pull-overs, bench press, pull-up row, dead-lift, sit-up,

squat, toe raises, straddle lift, snatch and triceps

extension. The low-repetition high-resistance (LH} group

performed 2 sets of 5 repetitions for each exercise and the

high-repetition low-resistance (HL) group performed 1 set of

15 repetitions and then 1 set of 12 repetitions for each

exercise. The investigators found that F-ratios obtained

for maximum carbon dioxide production (F = .20}, maximum

6

oxygen consumption (F = .08) and respiratory exchange ratio

(F = .15) were not significantly changed after training.

Katch and Katch (21) investigated muscular development

in body builders, power lifters and olympic weight lifters.

The investigators determined body composition via girth

measurements (neck, shoulder, chest abdomen, thigh) and

hydrostatic weighing. Residual volume was measured using

the oxygen dilution method and relative fat was determined

from Siri's (28) equation. This study showed that men who

had experienced prior weight training had extreme muscle

hypertrophy. Relative fat values of 9.3 to 9.7% were

reported which are lean when compared to average values for

men which are normally reported to be in the range of

14-15% (33, p 60).

Wilmore (32) looked at ~lterations in body composition

after a 10-week weight training program on both male and

female volunteers. Two groups performed two 40-minute

sessions per week. The exercises included half-squat or

dead-lift, leg press, toe raises, two-arm underhand curl,

standing press, bench press, pull-overs, bent rowing and

side bends. Each exercise was performed for 2 sets of 7-9

repetitions and intensity was increased when the subjects

could achieve 14-16 repetitions. Body composition was

assessed via hydrostatic weighing with residual volume

measured through the oxygen dilution method. Relative fat

7

was determined using Siri's (28) equation. Skinfold

measurements were taken at various sites: chest,

mid-axillary, triceps, subscapula, abdominal, suprailiac and

thigh. A substantial increase in fat-free weight was

reported for men (1.19 kg) and women (1.06 kg). Absolute

fat values decreased significantly for both men and women

(.93 kg and 1.08 kg) respectively.

Misner (22) reported similar findings using a series

of 10 progressive resistance exercises covering the major

muscle groups: bicep curl, leg press, bench press, sit-ups,

leg extension, leg flexion and one exercise of the subject's

choice. The intensity was set so that only 3 repetitions

could be performed and exercise intensity was increased by

10 pounds per lift when 8 repetitions could be achieved.

Body composition was assessed using total body potassium and

skinfold techniques (cheek, triceps, subscapula,

mid-axillary, suprailiac, abdomen, knee, calf and thigh).

The results of this study showed that fat-free weight (FFW)

increased by 3.1 kg and absolute fat decreased by 2.2 kg.

The studies reviewed suggest that weight training can

provide a substantial alteration of body composition in an 8

to 10 week period. Nagle and Irwin (23) reported that

traditional weight training did not enhance cardio­

respiratory function.

Effects of Endurance Training on Body Composition and

Cardiorespiratory Fitness

The benefits of endurance training on the human body

have been documented in many research articles

8

(2,3,5,11,16,18,26,31). The outgrowth of these studies is a

greater knowledge and understanding of the physiological

mechanisms associated with an improvement in

cardiorespiratory fitness. These include increased

oxidative enzyme activity, increased maximal oxygen

consumption, increased mitochondrial content of skeletal and

cardiac muscle, an increase in cardiac output and cardiac

hypertrophy (5, 16, 26). Another major benefit associated

with endurance training is the alteration of body

composition through losses in absolute fat weight with

minimal or no change in fat-free weight (3,11,18,31).

Misner (22) investigated the effects of a walk/jog

protocol for 30 minutes/day for 8 weeks on body composition.

The results showed that fat-free weight increased by 1.3 kg

and absolute fat decreased by 2.3 kg. As reported earlier,

Misner also investigated the effects of 8 weeks of weight

training on body composition and showed that fat-free weight

increased by 3.1 kg and absolute fat decreased by 2.2 kg.

Thus, the endurance program produced a loss in absolute fat

with minimal development of fat-free weight while the weight

training program produced an increase in fat-free weight and

9

a loss in absolute fat. This difference in fat-free weight

change was significant at the 0.05 level of confidence.

Wilmore (31) found that there was no increase in

fat-free weight using a walk/jog/run protocol administered 3

times a week for 10 weeks. The subjects were instructed to

increase the distance traveled and/or time to complete a

given distance during each workout period. Body composition

was determined using hydrostatic weighing with residual

volume measured via the oxygen dilution method. Siri's (28)

equation was used for relative fat determination. The

results of this study showed that fat-free weight increased

by .14 kg and that absolute fat decreased by 1.06 kg.

A recent study by Johnson (18) investigated the

effects of a 16 week marathon running program on college

males. The subjects were instructed in various methods and

physiological aspects of marathon running and were

encouraged to run six days per week. At the end of the

tenth week the subjects were running approximately 50-75

miles per week. Each subject was hydrostatically weighed

with residual volume estimated from vital capacity.

Brozek's (4) equation was used for relative fat

determination. Skinfold sites were taken at the triceps,

scapula, mid-axillary, suprailiac, abdomen and thigh. No

prediction of body density was made from the skinfold data

although all sites showed significant decreases from initial

values. The results showed that fat-free weight increased

by .11 kg and that absolute fat decreased by 3.2 kg. The

!-ratio for change in absolute fat was significant at the

.OS level of confidence, while fat-free weight did not

change significantly.

10

The studies reviewed all suggest varying degrees of

absolute fat weight loss due to endurance training.

However, there is not a consensus of opinion on alteration

in fat-free weight. Some studies reported no change in

fat-free weight while one reported a small increase.

Effects of Circuit Weight Training on Body Composition and

Cardiorespiratory Fitness

An early study by Allen (1) investigated the effects

of circuit weight training (CWT) on cardiorespiratory

fitness. Subjects exercised for 30 minutes per day, 3 days

per week for 12 weeks. The exercises used were military

press, leg curls, overhead chins, lat pull-downs, leg press,

bench press and sit-ups. All exercises were performed on a

Universal multi-station machine. Each subject performed 3

sets per station (2 sets at 8 repetitions and the last set

to exhaustion) and worked at a rate which was set at 60

beats per minute to control work time (30 seconds) and

recovery time (60 seconds). A maximal endurance test was

performed by each subject using a bicycle ergometer to

11

assess cardiorespiratory fitness. Results showed no

significant change for maximal oxygen consumption (F = .94),

maximal heart rate (F =.OS), maximal cardiac output (F =

.02), maximal stroke volume (F = .04) or maximal

arterial-venous oxygen difference (F = .21). Allen

concluded that CWT did not adequately stress the

cardiorespiratory system to elicit improvement.

Gettman (10) investigated the effects of CWT on

cardiorespiratory fiiness and body composition. Subjects

exercised 3 days/week for 20 weeks. The CWT program was

designed such that 2 sets of .15 repetitions were performed

for each exercise. Intensity was set at 50% of one

repetition maximum for each exercise. The exercises used

were bench press, knee extension, knee flexion, biceps curl,

leg press, sit-ups, shoulder press, lat pull down and

upright rowing. Body composition was assessed via

hydrostatic weighing with residual volume determ1ned by the

oxygen dilution method. The subjects performed a treadmill

test to ascertain maximum oxygen consumption following

procedures outlined by Pollock, et al. (25). Results showed

that fat-free weight increased by 1.8 kg and absolute fat

decreased by 1.3 kg. Maximum oxygen consumption increased

by 2.6 ml/kg/min which was significant at the .05 level of

confidence.

12

In a more recent study, Gettman (11) investigated

isokinetic circuit weight training on body composition and

cardiorespiratory fitness. Each subject performed 2

circuits of 10-15 repetitions with 30-second rest intervals

for 8 weeks. The exercises used were bench press, lat pull

down, knee extension, knee flexion, bicep curl, leg pre?S 1

sit-up, shoulder press and cycling at 900 kgrn/min. Body

composition was assessed via hydrostatic weighing with

residual volume determined by the oxygen dilution method.

Cardiorespiratory fitness was assessed using a treadmill

protocol. Results showed that fat-free weight increased by

l~O kg and absolute fat decreased by 0.7 kg; neither change

was significantly different. Gettman (11) reported a

significant increase (3%) in aerobic capacity for these

subjects.

Girandola, et al~ (14) investigated the effects of 9

weeks of circuit training on body composition and

cardiorespiratory fitness. Subjects performed 3 circuits of

calisthenics, running and weight training exercises done 2

days per week. Maximum oxygen consumption was assessed

using a cycle ergometer. Body composition was determi~ed

from hydrostatic weighing with residual volume measured by

the oxygen dilution method. Results showed that fat-free

weight increased by .67 kg and absolute fat decreased by .84

kg, each change being significant. Maximum oxygen

consumption i-ncreased significantly by 4.2 ml/kg/min.

The articles reviewed suggest that CWT can be an

alternative to either traditional weight training or

endurance training for alterations in body composition.

Allen (1) reported that CWT produced no improvement in

cardio-respiratory fitness. However, as Gettman concludes

in a recent review (12), more recent studies (10,11,14)

suggest that there is minimal improvement in

cardiorespiratory fitness with circuit weight training.

13

Effects of a Combined Training Program on Body Composition

and Cardiorespiratory Fitness

Training programs which combine weight training and

endurance training together have received minimal research

interest to date (13,15). Gettman, et al (13) investigated

the effects of a supercircuit program on physiological

parameters. A supercircuit program (SC), as defined by

Gettman, consisted of multiple weight stations with a short

running phase between each station. The running period

lasted for 30-seconds and provided stimulus to the heart and

circulo-respiratory system. Exercises consisted of the

squat, shoulder press, knee flexion, bench press, leg press,

elbow flexion, back hyperextension, elbow extension, sit-ups

and vertical flies. Each exercise was performed on a

Universal multi-station machine. Intensity was set at 40%

14

of each individual's one repetition maximum for each lift

and 12-15 repetitions were performed during the 30-second

weight phase. Running intensity was adjusted to elicit and

maintain a heart rate within the individual's training heart

rate range. Body composition was determined through

hydrostatic weighing with residual volume measured from the

nitrogen washout procedure. Brozek's (4) equation was used

to convert body density units into relative fat. Results

showed that there were no significant differences in the

changes in body composition when comparing regular CWT and

SC programs. In the regular CWT program, fat-free weight

increased by 1.21 kg and absolute fat decreased by 2.31 kg.

The SC program produced an increase in fat-free weight of

1.97 kg and a decrease in absolute fat of 1.87 kg.

The results showed that the regular CWT program

elicited an improvement in maximal oxygen consumption of 4.0

ml/kg/min. In comparison, the supercircuit program with

added running interval elicited an improvement of 5.5

ml/kg/min. The difference between the regular CWT and SC

programs was not significant, but both were significantly

greater than the control group which experienced a change of

only 1.0 ml/kg/min.

In another study, Hickson (15) investigated the

effects of a combined strength and endurance program (SE)

compared with each method of training performed separately.

15

The strength only (S) group consisted of weight training 5

days per week for 10 weeks and was designed to increase leg

strength. The exercises included parallel squats, knee

flexion, leg press and calf raises. Intensity was set at

80% of the subject's one repetition maximum as determined

prior to the study. Additional weight was added to maintain

maximal resistance at a specified number of repetitions.

The endurance only (E) group exercised 6 days per week for

10 weeks. Experimental protocol was designed such that 3

days per week the subjects did interval training (six

5-minute sessions) on a bicycle ergometer with a 2-minute

rest between training sessions. On alternate days subjects

performed continuous running with as fast a pace as

possible. Running time was initially set at 30 min/day for

the first week, 35 min/day the second week and 40

minutes/day thereafter. The SE group performed both

activities with a 2 hour rest period between each activity.

Skinfolds were taken at the triceps, subscapula, superiliac,

pectoral and thigh sites using procedures described by

Yuhasz (35) to determine relative fat. The results showed

that all three groups experienced a significant increase in

fat-free weight: S group (+1.2 kg), E group (+0.9 kg), SE

group (+1.2 kg). Also, all three groups experienced a

significant decrease in absolute fat: S group (-0.3 kg), E

group (-3.l kg), SE group (-2.0 kg). Both the SE and E

Groups experienced significant improvements in maximal

oxygen consumption (7.4 and 8.6 ml/kg/min; respectively).

The S group (0.7 ml/kg/min) had minimal improvement.

16

The two studies which investigated combined training

programs yielded conflicting results regarding changes in

body composition. This conflict may be a direct result of

different training methodologies and/or differences in

experimental design. Neither of these studies equated the

total exercise time required for either weight or endurance

training with that of the combined approach (i.e. -- 40

minutes of running or 40 minutes of weight training vs. 20

minutes of running and 20 minutes of weight training). Of

the two combined studies reviewed, Gettman's (13) study

utilized two methods (regular CWT and SC) which are

reasonably similar in their exercise requirements and both

require less than 30 minutes of time. In Hickson's (15)

study, the amount of exercise time performed by the SE group

(close to 3 1/2 hours) is not practical for the average

person.

In summary, the review of literature indicates that

weight training, either through use of traditional

free-weights or circuit weight training, produces an

increase in fat-free weight and a decrease in relative body

fat. Also noted is that endurance training produces an

increase in cardiorespiratory fitness along with decreased

17

amounts of absolute fat. Circuit weight training has been

shown to produce moderate increases in cardiorespiratory

fitness whereas traditional weight training does not. The

two studies investigating the combined effects of weight and

endurance training reported conflicting results with regard

to changes in body composition.

Given the fact that there is a limited amount of

research data concerning the effects of a combined training

program on body composition leads to support for continued

investigation in this area. The present study is designed

to address some major questions regarding combined training

programs.

CHAPTER III

STATEMENT OF THE PROBLEM

The standard method for determining the success of an

exercise program with regard to alterations in body

composition has been to evaluate changes in relative fat.

While altered relative fat values do reflect the overall

changes in body composition which may occur, the nature of

such changes are not clearly apparent. It is quite possible

that a reduction in relative fat can be produced entirely by

losses in absolute fat, by gains in fat-free weight or by

changes in both. Table I provides a descriptive account of

how such hypothetical body t)ssue changes can affect

relative fat.

Although it is well documented that a loss of absolute

fat has a significant effect on relative fat there is reason

to speculate that a combined loss of absolute fat and gain

of fat-free weight may be more beneficial to the health and

well-being of the individual. From Table I, the net effect

of the combined changes on relative fat is nearly as great

as through a loss of absolute fat alone (13.6% vs. 12.5%).

Yet, one could argue that the development of fat-free weight

is more beneficial to the individual due to the many factors

associated with increased fat-free weight (i.e., increased

19

TABLE I

HYPOTHETICAL CHANGES IN BODY COMPOSITION

Parameter Initial

Body

weight 70 kg

Relative

fat 15.0%

Absolute

fat(kg) 10.5

FFW (kg) 59.5

Loss of

AF 1

68 kg

12.5%

8.5

59.5

Gain of

FFW2

72 kg

14.6%

10.5

61. 5

1 - Loss of 2 kg of absolute fat only

2 - Gain of 2 kg of fat-free weight only

Combined 3 change

70 kg

13.6%

9.5

60.5

3 - Loss of 1 kg of absolute fat and a gain of 1 kg of fat-free weight

20

strength, increased caloric expenditure, greater ability to

survive emergencies and enhanced appearance).

The review of literature has reported that endurance

activities elicit primarily a loss of absolute fat, thereby

causing a reduction in relative fat. Weight training

activities produce gains in fat-free weight which also can

cause a reduction in relative fat on the basis of the logic

in Table I. This leads to the question to which this study

is addressed:

Can a combined training program elicit more

favorable changes in body composition than either

method of training alone?

Restated for statistical purposes it is hypothesized

that:

H0 : When experimental and control group scores are

compared, there will be no significant

difference between the group means for body

weight (kg) , absolute fat (kg) and fat-free

weight (kg) •

CHAPTER IV

RESEARCH DESIGN AND METHODOLOGY

RESEARCH DESIGN

The experimental design is presented in Table II and

involved four separate groups: 3 treatment groups which

trained and 1 control group which remained sedentary. The

study was designed such that total training time for all

groups is limited to 40-minutes per day, three days per

week.

SUBJECTS

Subjects were 21 male volunteers from the Portland

metropolitan community. The recruitment of the volunteers

was initiated from bulletin board flyers that had been

posted throughout the Portland State University campus. To

be accepted into the study each subject had to be available

from 8:30 a.m. until 10:00 a.m. Monday-Wednesday-Friday for

10-weeks, be within the ages of 18-30 years and not be

actively involved in physical activity. All subjects were

screened to assure a history of a sedentary lifestyle during

the prior 3 months as determined from responses to an

initial questionnaire and interview (See Appendix A for a

copy of questionnaire) •

Group

I

II

III

IV

TABLE II

EXPERIMENTAL DESIGN

Treatment

Weight training

Endurance training

Combined:

Endurance and

Weight training

Control

Training Time

40 minutes

40 minutes

40 minutes

22

23

Subjects were randomly assigned to one of three

groups~ The selection procedure required each subject to

pick a slip of paper from a box of 21 slips, seven each with

the numbers I, II or III written on them. Subjects were

assigned to the particular group that corresponded with

their number. Each of three training groups began with

seven subjects per group. A control group was selected from

students who had been interested in the research study but

could not meet the daily time requirement. Others were

recruited from physical education classes at Portland State

University which provided minimal or no vigorous activity

(i.e., archery, bowling, golf, etc.). Control subjects

agreed not to participate in any training or physical

activity during the course of the 10-week study.

Treatment subjects were not placed in their respective

groups until after a 3-week pre-conditioning program (see

Pre-conditioning below). Diet was not controlled due to the

variability of schedules, economic factors and time

involvement. Subjects were encouraged not to alter

knowingly caloric intake but to use a perceived need of food

as the criterion for extra caloric intake if extra food

seemed appropriate. All subjects (treatment and control)

were instructed as to the benefits and risks of

participating in the study and informed consent was received

prior to subject involvement (See Appendix B for a copy of

informed consent form) • Procedures used in the study were

approved by the Portland State University Human Subjects

Research Committee.

PRE-CONDITIONING

24

Treatment groups were administered a pre-conditioning

program (See Table III) in order to strengthen the knee

stabilizers (i.e., quadriceps and hamstrings) and low-back

region to prevent injury during the experimental period.

Subjects were also instructed on the correct technique for

performing the three major lifts in the study. Subjects

were given at least two sessions in which to familiarize

themselves with each technique.

WEIGHT TRAINING PROGRAM FOR GROUP I

The weight exercise program consisted of a 40-minute

training session, 3 days per week for 10-weeks. The program

was designed to produce maximum muscle hypertrophy.

Exercises included parallel squat, bench press and

dead-lift. Each lift was attempted for 5 sets of 8-10

repetitions. Initial intensity was set at 80% of the

Exercise

Leg

Extension

Leg

Flex ion

Abdominal

Curl

Low-back

raises

25

TABLE III

PRE-CONDITIONING PROGRAM

Intensity Frequency Duration

30 :pounds M-W-F 3 sets of 10 repetitions

10 pounds M-W-F 3 sets of 10 repetitions

M-W-F 3 sets of 25 repetitions

M-W-F 3 sets of 10 repetitions

subject's one repetition maximum for each lift. Weight was

increased by 5-pounds on the bench press and 10-pounds for

both the squat and dead-lift when a subject was able to

achieve two full training sessions with 50 repetitions per

exercise. The sets were separated by one-minute recovery

periods. -_·All lifts were performed using Olympic-style free

weights in the weight room at Portland State University. All

training sessions were supervised and weight lifting belts

were available for use by the subjects.

ENDURANCE PROGRAM FOR GROUP II

The endurance exercise program consisted of 40-minute

sessions, J days per week for 10-weeks following the

walk/run progression presented in Table IV. The program

consisted of continuous movement in a gymnasium ( circum·­

ference = 276 feet) for 5 weeks. For the remaining 5

weeks subjects ran on a running track (1 lap = 1/8th of a

mile) located on top of the physical education building at

Portland State University.

The indoor facility was utilized initially because of

environmental factors during the winter months. Subjects

were instructed in measuring heart rate via radial or

26

27

TABLE IV

PROGRESSIVE ENDURANCE PROGRAM FOR GROUP II*

Week Walk time (min.) Slow run time (min.)

1 5 5

2 4 6

3 3 7

4 2 8

5 1 9

6 0 10·

Slow run time (min.) Fast run time (min.)

7 5 5

8 3 7

9 1 9

10 0 10

*Each day of exercise, the 40 minute session was divided into

blocks of 10 minutes each and repeated four times. These

10-minute blocks are outlined in this table.

carotid pulse and educated in physiological principles of

cardiovascular conditioning. Each subject recorded a

resting heart rate prior to sleep for 5 consecutive days.

The average was used to determine a training heart rate

(THR) by the method of Karvonen (19):

THR = resting HR + (maximum HR - rest HR) (.6)

where, HR = heart rate

maximum HR = 220 - age

28

Subjects were instructed to obtain a 15-second pulse count

during the first walk phase of a training session for the

initial six sessions. This procedure was implemented so

subjects could determine a walking pace that would elicit

their THR. In addition, at the end of every third training

session subjects obtained a 15-second pulse count for

comparison with their THR. Subjects adjusted their training

pace according to this final heart rate, thereby insuring

that a heart rate which approximated each subject's

individual THR was achieved during each daily session. Each

subject was given a grocery hand counter to be used for

monitoring the number of laps performed each day.

Subjects were given a demonstration on the difference

between walking and running. Walking was defined as having

the center of mass evenly placed above the base of support

and using large arm and leg movements. Running was

described subjectively as occurring when the subject felt it

29

more efficient and comfortable to run (with slight forward

lean) than to walk at a given pace. During the last four

weeks of the study subjects were asked to increase their

running speed. Intensity of this new running component was

to be approximately 25% faster than their slower running

pace. The additional component was implemented so the

subjects would maintain an adequate training stimulus during

the last four weeks of the study. Subjects used their

training heart rate to determine their given pace for all

phases of endurance training.

WEIGHT AND ENDURANCE PROGRAM FOR GROUP III

Subjects in this group performed the same weight

exercises (parallel squat, bench p~ess, dead-lift) as the

subjects in group I except they attempted 3 sets of 8-10

repetitions in twenty minutes. Intensity was determined and

maintained as explained in the Weight section for group I.

Subjects performed the endurance phase for twenty minutes

immediately following the weight training phase. A

one-minute rest period was allowed while changing from

weight training to endurance training. Subjects followed

all procedures as explained in the Endurance section for

group II and used the walk/run progression presented in

Table v.

Week

1

2

3

4

5

6

7

8

9

10

TABLE V

PROGRESSIVE ENDURANCE PROGRAM FOR GROUP III*

Walk time (min.)

2.5

2.0

1.5

1.0

0.5

o.o

Slow run time (min.)

2.5

1.5

0.5

o.o

Slow run time (min.)

2.5

3.0

3.5

4.0

4.5

5.0

Fast run time (min.)

2.5

3.5

4.5

s.o

30

*Each day of exercise, the 20 minute session was divided into

blocks of 5 minutes each and repeated four times. These 5

minute blocks are outlined in this table.

31

MEASUREMENT OF CARDIORESPIRATORY FITNESS

Maximal oxygen consumption was estimated from

heart rate response to the Harvard step test as modified by

Sharkey (27). The subjects were familiarized with the bench •·'

height (15.75 inches) and metronome count (90 bpm) during

the pre-conditioning phase. Subjects were instructed to

sit-down for 5-minutes prior to administration of the test.

Heart rates were obtained by using a stethoscope placed

medially to the left nipple. The subject was then told to

begin and continue the test for 5 minutes. At completion he

was instructed to sit down. The investigator waited

15-seconds after completion of the stepping and then

obtained a 15-second pulse count. Heart rate response was

used to predict the individual's maximum oxygen consumption

from a table prepared by Sharkey (27).

MEASUREMENT OF BODY WEIGHT AND HEIGHT

Body weight was assessed in kilograms on a Homs

Balance Beam scale with an accuracy to 10 grams. Height was

measured in inches from the apparatus located on a standard

Continental scale and then converted to meters.

32

GIRTH AND SKINFOLD MEASUREMENTS

Several girth measurements were taken using a

Lufkin steel tape. Measurements included upper arm,

forearm and abdomen. All were taken from the largest

circumference as determined by the investigator through

visual identification. Relative fat was determined using

the methods of Katch and McArdle {20} with inches converted

into constants for use in the equation below:

Relative fat = Constant A + Constant B - Constant C

- Age Constant

where, Constant A = Upper Arm Circumference

Constant B = Abdominal Circumference

Constant C = Forearm Circumference

Age Constant = 10.2

Skinfolds were measured using Lange calipers at the

following sites:

Chest - A diagonal fold halfway between the axillary

fold and the right nipple.

Abdominal - A vertical fold taken one-inch to the

right of the umbilicus.

Thigh - A vertical fold taken at the proximal anterior

one-third region of the thigh at the mid-section

of the leg.

33

All sites were estimated by the investgator following

the anatomical descriptions explained above. Body density

(Db) was determined by the methods of Jackson and Pollock

( 17) :

2 Db= 1.1093800 - .0008276(Xl) + .0000016(X1 )

- .0002572(X2 )

where, x1 = sum of the thigh, abdomen and chest

skinfolds

x2 = age of the subject

Relative fat was determined using Siri's (28) equation:

Relative fat = (4.95/Db - 4.5) x 100.

MEASUREMENT OF RESIDUAL VOLUME

The equation for determination of residual volume was

the oxygen dilution method as modified by Wilmore (34).

Each subject was required to exhale to residual volume

through forced expiration with a standard 3-way mouthpiece

in his mouth. When the subject had reached residual volume,

the mouthpiece was switched so the subject began breathing

from a 5-liter anesthesia bag filled wtih 100% oxygen

(accuracy = .03%). After seven full inspirations and

expirations the subject was required to exhale to residual

volume and the mouthpiece closed. Gas in the bag was then

34

analyzed for oxygen and carbon dioxide concentrations with a

calibrated Beckman Model E-2 Oxygen Analyzer and Beckman

LB-1 Carbon Dioxide Analyzer. Calibration of each

instrument was performed using standard gases which had been

analyzed by an external lab. Two residual volume

determinations were obtained at the time of each subject's

hydrostatic weighing with the average of the two measures

being used as the subject's score. All values were

corrected to and reported under standard conditions. The

formula used to compute residual volume was:

RV = vo2 x b

79.8 - b

where, RV = residual volume

vo2 = volume of oxygen in the bag at beginning of the

procedure

b = percent nitrogen in the mixed air in the bag at

point of equilibrium (100% - (%0 2 + %C0 2 ))

35

MEASUREMENT OF BODY DENSITY

The hydrostatic weighing procedure was performed in a

stationary tank (58" x 37" x 54") with water temperature

maintained between 28 and 32 degrees Celsius. Water density

was obtained from standard density/temperature tables

located in the Handbook of Chemistry and Physics (6). The

tank was checked for purity and chlorination on a daily

basis. Subjects were instructed on the procedure of

expelling air from the lungs while submerging themselves

underwater. Each subject sat on a submerged metal chair

which was supported by a standard Chatillion autopsy scale.

All values were reported in kilograms to the nearest 10

grams. To eliminate learning errors associated with the . underwater procedure, each subject was weighed 10 times.

The average of the last three trials was used in a

modification of Brozek's (4) equation to determine body

density:

D = b Weightair

(Weightair - Weightwater> - (RV + .1 liter)

water density

Relative fat was determined from Siri's (28) equation listed

previously.

STATISTICAL TREATMENT

Post-test scores were analyzed using analysis of

covariance (ANCOVA) to remove the influence of pre-test

scores (24). This particular treatment was chosen for

reasons listed below (8):

1. To control for randomized groups of unequal N's.

2. To reduce within group (error) variance,

increasing the power of the statistical test to

account for a small sample size.

In cases where a significant F-ratio was found,

Tukey's Honestly Significant Different procedure (30) was

chosen for all pairwise mean comparisons as this treatment

is applicable to unequal sample sizes.

36

CHAPTER V

RESULTS AND DISCUSSION

Descriptive characteristics of the subjects are

presented in Table VI. The number of subjects in each group

diminished through the course of the study and the final

total for each group was: Group I, n=3; Group II, n=4;

Group III, n=3; Group IV, n=4. The loss of subjects was due

to a variety of factors as explained below:

1) Two subjects dropped out during the first

3-weeks of the study. The response given by

these subjects was that the structure of the

class setting was too rigid and the experimental

group which each had been assigned to did not

fit their wishes.

2) Two subjects dropped out due to stress fractures

of the foot. In each case the subject had

developed the condition prior to the study and

aggravated the condition while running in the

study.

3) Two subjects dropped out due to heavy academic

class loads and felt that the time devoted to

the study interfered with academic study time.

4) One subject participated in eight weeks of the

study and then never reported back.

38

TABLE VI

DESCRIPTIVE STATISTICS

* Group N

I 3

II 4

III 3

IV 4

*

Age

(~ears)

Mean SD

22.7 4.2

26.5 5.7

24.7 3.2

22.5 3.4

Weight Height

(kilo~rams) (meters)

Mean SD Mean SD

80.3 27.4 1.92 .093

75.3 13.3 1.78 .100

68.9 a.a 1.79 .013

82.0 10.8 1.85 .049

Group I - Weight Training Only

Group II - Running Only

Group III - Combined

Group IV - Control

39

Mean age of each group was similar with the endurance group

having the highest value. Body weights obtained showed that

the control subjects had the highest average of all four

groups. Heights for all groups were very similar.

Table VII presents data of training mileage in groups

II and III. Both groups progressively increased in training

mileage through the course of the experiment. The average

mileage/session of the endurance group (4.25 miles) was

almost twice that of the combined group (2.25 miles). This

suggests that both groups maintained similar running speeds.

Data regarding strength assessment is presented in

Table VIII. Using ANCOVA procedures described previously, a

significant [-ratio was found on the parallel squat (F =

149.S, p < .02). The mean for the weight training group was

significantly greater than that of the endurance group (q =

-5.8 with aiq = ±4.41 needed at the .OS level of confidence)

using Tukey's procedure. However, it was not significantly

different from the mean of the combined group (q = -2.4).

The F-ratio for the bench press was significant (F = 8.4, p

<.02) but none of the group means were significantly

different from each other using Tukey's procedure. The

F-ratio (F = .16, p < .89) for the deadlift was not

significant.

Subjects were reticent about pushing themselves on the

dead-lift despite motivation provided by the investigator.

40

TABLE VII

TRAINING MILEAGE FOR ENDURANCE TRAINING GROUPS

Week Group III (miles/session) Group II (miles/session)

Mean SD Mean SD

2 1.93 .07 3.63 .13

4 2.02 .OS 3.90 .17

• 6 2.42 .04 4.40 .23

8 2.41 .17 4.63 .20

10 2.47 .10 4.71 .28

10-week

average 2.25 4.25

Average mile

time (min.) 9: 28 9:41

Parameter

Squat (lbs)

Bench Press (lbs)

Dead-lift (lbs)

TABLE VIII

STRENGTH ASSESSMENT

Group

I*

II

III

I*

II

III

I*

II

III

Pre

Mean

155.0

195.0

183.3

107.5

150.0

152.0

258.0

302.5

290.0

SD

14.1

24.1

29.3

10.6

32.4

56.7

24.0

42.1

27.8

Post

Mean

235.0

215.0

246.7

152.5

145.0

181.7

280.0

310.0

290.0

SD

28.3

34.6

40.7

10.1

35.6

55.1

49.5

47.2

43.9

41

Adjusted

Post #

Mean

274.2

196.6

245.1

184.7

136.4

171.5

306.4

297.8

288.9

i Post-test scores adjusted for differences in pre-test

scores

* Data for the weight training group (I) is based on N=2

because collection of the data for one subject at the

beginning of the study was incomplete

42

This hesitance can possibly be a direct result of the

experience associated with the dead-lift on the pre-test and

the subject's resulting fear of injury. Therefore, results

probably do not reflect true strength improvements. It

should be noted that in the squat and bench press, the

weight training group was not significantly greater than the

combined group. This suggests that 20-minutes of weight

training may be significant to cause a substantial

improvement in strength in at least two regions of the body.

Data regarding cardiorespiratory fitness is presented

in Table IX. A significant F-ratio was found for heart rate

response (F = 6.5, p < .01). When analyzed using Tukey's

test, the combined group mean was significantly lower than

those of both the control group (q = 5.2 with a q = :4.6

needed at the .OS level of confidence) and the weight

training group (q = 4.8), but it was not significantly

different from the mean of the endurance group (q = -2.5).

Surprisingly, the mean of the endurance group was not

significantly different from that of the control group (q =

2.9), which is difficult to explain. (

Data regarding body composition assessment as measured

via hydrostatic weighing is presented in Table x. A

significant F-ratio was found for fat-free weight (F=S.3, p I

< .02). When analyzed using Tukey's procedure the only

pairwise comparison which achieved significance was the

43

TABLE IX

CARDIORESPIRATORY FITNESS

Parameter Group* PRE POST ADJUSTED

POST t Mean SD Mean SD Mean

Heai:t rate

response I 30.0 7.8 32.7 7.1 34.7

(lSs count) II 35.7 7.5 32.3 3.8 30.2

III 31.4 3.3 26.0 1.7 26.0

IV 32.l 5.4 34.3 6.1 34.8

Estimated maximal

vo2 (ml/kg/min) I 51.0 11.2 47.0 7.9 43.7

II 41 .. 7 7 •. 3 45.7 5.7 48.6

III 47.7 4.1 56.3 3.8 56.3

IV 46.5 6.8 44.S 6.8 44.2

i Post-test scores adjusted for pre-test scores.

* See Table VI,, page JS for Group identification.

44

TABLE X

HYDROSTATIC WEIGHING DATA

Parameter Group PRE POST ADJUSTED

POST #

Mean SD Mean SD Mean

Body Weight (kg) I 80.3 27.4 82.8 26.0 79.6

II 75.3 13.3 73.9 12.5 75.5

III 68.9 8.8 71.9 6.2 79.5

IV 82.1 10.8 80.9 12.0 76.1

Density I 1.0616 .029 1.0638 .031

(gm/cc) II 1.0716 .017 1.0686 .015

III 1.0716 .005 1.0693 .005

IV 1.061 .013 1.0604 .015

Relative Fat I 16.7 13.2 15.3 13.4

(%) II 11.9 7.5 13.2 5.9

III 11.9 2.4 12.9 2.2

IV 16.5 5.7 16.8 6.9

Absolute Fat (kg) I 15.8 16.5 14.9 15.7 11.1

II 9.3 6.5 10.l 5.9 12.5

III 8.4 1.9 9.2 1.2 12.7

IV 13.9 6.7 14.2 8.2 12.2

Fat-free Weight I 64.5 11.4 67.8 10.6 68.l

(kg) II 65.9 10.1 63.8 8.0 62.8

III 60.3 4.2 62.7 6.8 67.5

IV 68.2 6. "8 66.7 4.9 63.9

# Post-test scores adjusted for differences in pre-test.

weight training group versus the endurance group (q = -4.6

with q = t4.6 needed at the .OS level of confidence).

F-ratios for absolute fat (F = .02, p < .89), total body

weight (F = 1.8, p < .22) and body density (F = .35, p <

.78) were not significantly different. Since the weight

45

training group did experience an increase in fat-free weight

it is possible that this had a residual effect on metabolic

costs over-and-above those associated with the caloric cost

of the exercise sessions. An increased fat-free weight

could result in a greater caloric expenditure over a 24-hour

period as it is related to basal metabolic rate (29).

Data regarding body composition parameters as measured

via circumferences (Katch and McArdle method) are presented

in Table XI. There were no significant differences found

for either absolute fat (F = .46, p < 71), fat-free weight

(F = .48, p < .70) or circumference sum (F = .48, p < .70).

The changes noted earlier in fat-free weight using

hydrostatic weighing were not visible using the

circumference method. This discrepancy might suggest that

the circumference method is less sensitive to subtle changes

in body composition.

Data regarding body composition parameters as measured

via skinfold measurements are presented in Table XII. No

significant differences between groups were found for

absolute fat (F = .63, p < .62), fat-free weight (F = 1.5,

46

TABLE XI

CIRCUMFERENCE DATA

Parameter Group* PRE POST ADJUSTED

POST i

Mean SD Mean SD Mean

Relative Fat (%) I 18.3 11.6 18.3 10.9

II 17.4 5.7 17.0 5.7

III 15.4 2.5 16.8 1.5

IV 19.5 4.8 20.l 5.4

Absolute Fat (kg) I 16.6 15.8 16.9 14.9 14.7

II 13.5 6.8 13.1 6.7 13.9

III 10.7 2.9 12.1 2.1 15.6

IV 16.2 5.4 16.7 7.0 14.9

Fat-free

Weight (kg) I 63.7 13.4 65.8 12.7 65.3

II 61.8 7.5 60.9 6.5 60.5

III 58.2 5.9 59.8 4.1 59.8

IV 51.8 25.3 64.2 6.0 65.0

Circumference Sum

(cm) I 237.3 41.4 241.3 42.9 240.7

II 235.6 16.1 232.4 20.7 233.6

III 229.2 20.2 227.3 10.9 234.9

IV 243.3 13.4 245.5 20.l 238.9

i Post-test scores adjusted for differences in pre-test.

* See Table VI, page J8 for Group identification.

47

TABLE XII

SKINFOLD DATA

Parameter Group PRE POST ADJUSTED

POST #

Mean SD Mean SD

Relative Fat I 13.3 6.3 13.S 11.8

{%) II 13.6 6.3 14.4 S.3

III 9.Sl 2.3 10.6 2.9

IV 18.0 6.1 16.9 4.9

Density {gm/cc) I 1.0684 .02 1.0679 .01

II 1.0677 .03 l.06S8 .07

III 1.0772 .OS 1.0746 .OS

IV l.OS76 .07 1.0601 .03

Absolute Fat I 12.9 14.9 13.2 14.4 11.9

{kg) II 10.7 6.6 11.0 S.8 11.8

III 6.6 1.9 7.7 2.4 12.3

IV lS.l 6.7 14.6 S.9 11.3

Fat-free I 67.4 13.2 69.6 12.9 67.8

Weight (kg) II 64.6 8.2 62.9 7.8 63.6

III 62.3 7.6 64.3 4.9 67.0

IV 66.9 6.6 66.3 6.7 64.9 7

Skinfold Sum I 96.8 79.6 93.9 73.2 84.6

(mm) II 80.7 30.6 86.1 26.9 91.9

III 61.1 13.0 63.3 12.3 92.S

IV 109.1 40.8 112.3 43.7 91.6

i Post-test scores adjusted for differences in pre-test

scores.

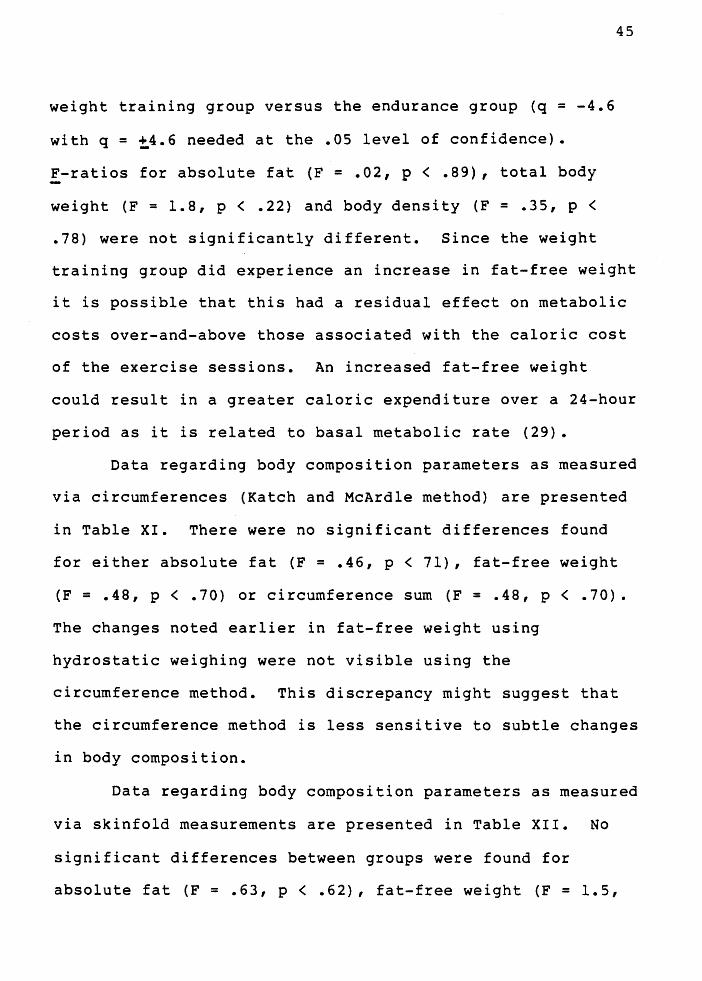
p < .28) or skinfold sum (F = .48, p < .70). The skinfold

method also yielded results which did not agree with the

results obtained from the hydrostatic weighing procedure.

48

In conclusion, the results of the present study do not

support the investigator's hypothesis that a combined

training program will elicit more favorable changes in body

composition than either method of training alone.

A number of factors could have contributed to the

results which were obtained. These include:

1) The subject population size for each group was

too small to reach statistical significance

given the changes that could occur in 10-weeks.

2) Diet was not controlled during the 10-weeks of

the study. Thus, an indication of each

subject's average caloric intake was not known

to allow comparison with his caloric

expenditure. Outside physical activity was not

controlled or monitored during the 10-week

period.

3) After beginning, the study, a limitation

encountered was use of the dead-lift exercise in

the weight training protocol. This exercise

proved to be unpopular with the subjects as some

experienced low-back strain or soreness during

the pre-test and the initial two weeks of the

study. A better exercise could have been either

sit-ups, bicep curls or tricep extension. These

exercises could have provided some muscle mass

development and probably would have been met

with much more acceptance by the subjects.

49

CHAPTER VI

IMPLICATIONS FOR FUTURE RESEARCH

The present study attempted to answer the question of

how to elicit changes in body composition through various

training methods. The main focus of the study looked at

effects of a combined training program on body composition

parameters as compared to either method of training alone.

Although the results were not as expected, several points

seem worthy of consideration for future research:

1. The concept of a combined training program for

developing and/or maintaining fitness is still

sensible for a number of physiological reasons.

The use of weight training for increasing fat-free

weight warrants further exploration as it can have

an effect on metabolism and daily caloric

expenditure. Also, the development of strength

and muscle endurance can be facilitated.

Endurance activities can produce alterations in

cardiorespiratory fitness and absolute fat.

Further, in terms of time-effectiveness a combined

approach is best suited for meeting the time

constraints of the average working individual.

The present study used a traditional weight

51

.training program as part of the combined method

and it proved difficult in meeting the time

constraints of the study. Also, the traditional

weight training program is limited in the number

of muscle groups that can be exercised during a

20-minute period. It is recommended that a

circuit weight training program be implemented in

place of traditional weight training. Circuit

weight training can utilize a greater number of

muscle groups in a given period of time.

2. Future research should be directed at investi­

gating a combined CWT program with an equal amount

of endurance training. Gettman (13) investigated

the effects of a supercircuit program on body

composition but the endurance component was placed

between each weight station. Repeated anaerobic

intervals consi$ting of thirty 30-second running

stations (15 mi~utes total time) were used in

place of a continuous 15-minute endurance

activity.

3. If an individual desires to develop l~rge amounts

of strength and muscle hypertrophy then it is

recommended that the weight training session be

separate from the endurance session. Hickson (15)

concluded in his study that individuals wishing to

52

improve overall strength might find it detrimental

to perform an endurance activity at the same time

as weight training. In other words, by performing

a combined weight training and endurance program

at the same time, improvement in strength might be

less than what could have been achieved if weight

training had been performed alone.

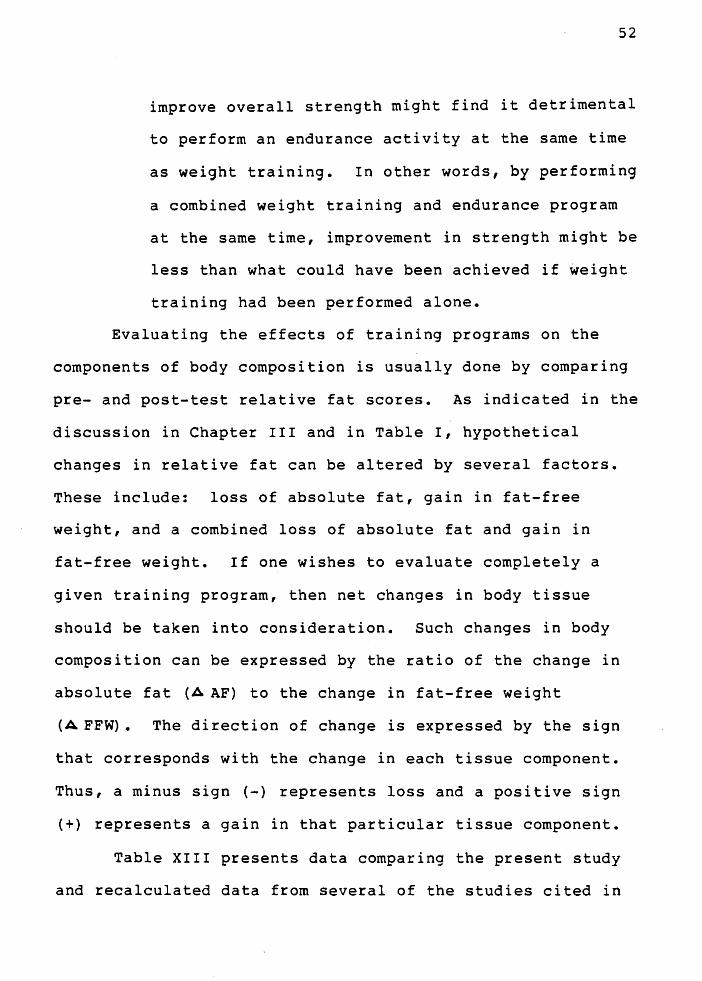
Evaluating the effects of training programs on the

components of body composition is usually done by comparing

pre- and post-test relative fat scores. As indicated in the

discussion in Chapter III and in Table I, hypothetical

changes in relative fat can be altered by several factors.

These include: loss of absolute fat, gain in fat-free

weight, and a combined loss of absolute fat and gain in

fat-free weight. If one wishes to evaluate completely a

given training program, then net changes in body tissue

should be taken into consideration. Such changes in body

composition can be expressed by the ratio of the change in

absolute fat (A AF) to the change in fat-free weight

(AFFW). The direction of change is expressed by the sign

that corresponds with the change in each tissue component.

Thus, a minus sign (-) represents loss and a positive sign

(+) represents a gain in that particular tissue component.

Table XIII presents data comparing the present study

and recalculated data from several of the studies cited in

TABL

E X

III

A C

OM

PARI

SON

OF

NET

TIS

SUE

CH

AN

GES

1 PR

ODUC

ED

THRO

UGH

VA

RIO

US

TRA

ININ

G

PROG

RAM

S

Pre

sen

t P

aram

eter

S

tud

y

Mis

ner

(22

) W

ilm

ore(

32)

Wil

mo

re(J

l)

Hic

kson

(1

5)

Get

tman

(1

3)

Ab

solu

te f

at2

En

du

ran

ce

Str

en

gth

C

ombi

ned

+0

.84

-0

.85

+

1.1

Fat-

free w

eig

ht3

End

uran

ce

Str

en

gth

C

ombi

ned

Rat

io4

-2.2

+

3.3

+

3.5

-2.3

-2

.2

+1

.3

+3

.1

-1.1

-0

.9

+0

.1

+1

.2

End

uran

ce

+0

.38

:+1

.0

-1.8

:+1

.0

---7

.6:+

1.0

S

tren

gth

-2

.6:+

1.0

-0

.7:+

1.0

-0

.7:+

1.0

C

ombi

ned

+

0.3

1:+

1.0

-3.1

-0

.3

-2.0

0

+0

.9

+2

.2

+1

.2

-3.5

:+1

.0

-0.1

5:+

1.0

-1

.7:+

1.0

-2.8

-3

.2

+1

.9

+l.

O

-1.5

:+1

.0

-3.2

:+1

.0

1 S

ign

den

ote

s d

irecti

on

of

chan

ge

(i.e

. -

min

us

(-)

mea

ns

loss

of

tiss

ue,

plu

s (+

) m

eans

gain

of

tiss

ue.

2 D

eno

tes

chan

ge

in a

bso

lute

fat.

3

Den

ote

s ch

ang

e in

fa

t-fr

ee w

eig

ht.

4

Den

ote

s th

e r

ati

o o

f ch

ang

e in

ab

solu

te f

at

and

the

chan

ge

in f

at-

free w

eig

ht

U1 w

54

the review of literature. For purposes of comparison, all

ratios are reported such that the changes in fat weight are

expressed per unit change in fat-free weight. Data from the

present study shows a ratio of (+0.38 : +1.0) for the

endurance group, (-2.6 : +1.0) for the strength group and

(+0.31 : +1.0) for the combined group. For reasons

discussed earlier the ratios for both the endurance group

and combined groups do not reflect changes that are

consistent with previous data concerning alterations

produced through endurance activities

(2,3,5,ll,12,16,l8,26,31). The studies of Misner (22),

Wilmore (31,32), Gettman (13) and Hickson (15) will be used

to provide support for the hypothesis that the tissue change

ratio (AAF:AFFW) provides a useful method for evaluating

changes in body composition.

Misner's (22) results produced ratios of (-1.8

for jogging and (-0.7 : +1.0) for weight training.

+1.0)

Wilmore's data (32) on weight training produced a ratio of

(-0.7 : +1.0) which coincides with Misner's data. In a

separate study, Wilmore (31) investigated endurance training

and the results produced a ratio of (-7.6 : +1.0).

Hickson's data (15) shows that a combined program (-1.7 :

+1.0) produced a more balanced tissue ratio than did either

the strength training only (-.15 : +1.0) or endurance

training only (-3.5 : +1.0) groups. Gettman's (13) data

...

produced ratios for the combined supercircuit. program of

(-3.2 : +1.0) and for the regular CWT program of (-1.5 :

+1.0).

55

As the above data suggest, there is great variability

in net tissue change produced by various types of training

and by various experimental designs. The tissue change

ratio could be very useful in indicating the effectiveness

of a given training program in producing changes in body

composition. Some possible examples of variations in

exercise prescription are examined below:

1. Endurance programs in most cases found a greater

loss in absolute fat for every kilogram of

fat-free weight gained (15,22,31). This type of

program would be recommended for individuals who

have large amounts of absolute fat (i.e. -

moderate to severe obesity) and who need to reduce

their relative fat levels to acceptable and

manageable levels prior to any other treatment.

The endurance program would in most cases consist

of a walking protocol instead of jogging.

2. A weight lifting program might be suggested for an

individual who already possessed a low to average

level of absolute fat but who needed to increase

strength and muscle mass (i.e. - wrestler,

football player, shotputter, etc.). The need for

56

developing strength would far outweigh the benefit

of losing absolute fat as it probably would not be

of concern to such an individual.

3. The data on combined programs is limited at

present. It seems possible that a combined

program might be recommended as a way to maintain

a given level of body composition and fitness.

In summary, methods for developing and maintaining a

desirable body composition need further research. There is

reason to believe that a combined training program can

provide adequate training to develop and/or maintain stength

and cardiorespiratory fitness in a time-efficient manner.

Also, the concept of net tissue change should be further

explored as a;method for evaluating the effectiveness of

weight reduction programs on body composition. There still

is great variability concerning actual changes produced

through various training programs. If a reliable index of

changes in body tissues could be developed and refined, then

exercise prescription could become much more effective in

meeting the needs of the general public and the competitive

athlete.

LIST OF REFERENCES

1. Allen, J. 19?6 ... Hemodynamic Consequences of Circuit Weight Training" Res. Quarterly 47:299-306.

2. American College of Sports Medicine, 1978. "The Recommended Quantity and Quality of Exercise for Developing and Maintaining Fitness in Healthy Adults" Med. Sci. Sports 10(J}: vii-x.

J. Boileau, R.A. 1971. "Body Composition Changes in Obese and Lean Men during Physical Conditioning" Med. Sci, Sports 3(4): 183-189.

4. Brozek, J. and A. Keys. 1963. "Densitometric Analysis of Body Composition: Revision of Some Quantitative Assumptions" Annals of N.Y. Acad. Sci. 110:11)-140.

5. Clausen, Jan 1977. "Effects of Physical Training on Cardiovascular Adjustments to Exercise in Man" Phys. Reviews 57(4): 779-812.

6. CRC, 1983. Handbook of Chemistry and Physics, CRC Press, Inc., Boca Raton, Florida.

7. Durnin, J.V.C.A. and R. Passmore 1967. Energy, Work and Leisure, London: Heineman Educational Books, Ltd.

8. Gay, L.R. 1981. Educational Research: Competencies for Analysis and Application, Charles E. Merrill Publishing Co., Columbus, Ohio.

9. Gettman, Larry 1976. "Physiological Responses _of Men to 1,3 and 5 days per week of Training Programs" Res. Quarterly 47: 6)8-646.

10. Gettman, Larry 1978. "The Effects of Circuit Weight Lifting on Strength, Cardiorespiratory Function and Body Composition" Med. Sci. Sports 10(3): 171-176.

11. Gettman, Larry 1979. "Physiological Effects on Adult Men on Circuit Strength Training and Jogging" Arch. Phy. Rehab. Med. 60: 115-120.

12. Gettman, Larry 1981. "Circuit Weight Training: A Critical Review of Its Physiological Benefits" Phys. Sptmed. 9:44-60.

58

1J. Gettman, Larry , Paul Ward and R. Hagan. 1982. "A Comparison of Combined Running and Weight Training with Circuit Weight Training" Med. Sci. Sports 14(3): 229-234.

14. Girandola, R., and V. Katch. 1973. "Effects of 9-weeks of Physical Training on Aerobic Capacity and Body Composition in College Males" Arch. Phy. Med. Rehab. 54, 521-24.

15. Hickson, R.C. 1980. "Interference of Strength Development by Simultaneously Training for Strength and Endurance Training" Eur. J. Appl. Phys. 451 255-263.

16. Holloszy, J.O., R. Hickson and J. Hagberg. 1980. "Physiological Consequences on the Biochemical Adaptations to Endurance Exercise" Annals of N.Y. Acad. Sci. )01:440-450.

17. Jackson, A. and M. Pollock. 19?8. "Generalized Equations for Predicting Body Density for Men "Br. J. Nutr. 40:497-504.

18. Johnson, Glen. 1982. "Effects of a 16-week Marathon Training Program on Normal College Males" J. Sp. Med. Phy. Fit. 22(2): 224-229.

19. Karvonen, M.J., E. Kentala and O. Mustala: 1957. "The Effects of Training on Heart Rate" Annals Medic. Exper. et Biol. Fenniae 35:307-315.

20. Katch, F. and W. McArdle. 1977. Nutrition, Weight Control and Exercise, Houghton Mifflin Co., Boston.

21. Katch, F. and V. Katch. 1980. "Muscular Development and Lean Body Weight in Body Builders and Weight Lifters" Med. Sci. Sports 12(5): 340-344.

22. Misner, J.E. 1974. "Alterations in Body Composition with Selected Physical Training Programs" J. AM. Geriat. Society 22:1JJ-1J8.

23. Nagle, F. and L. Irwin. 1960. "Effects of Two Systems of Weight Training on Cardiorespiratory Endurance and Related Physiological Factors" Res. Quart. J1(4): 607-614.

59

24. Nie, N., C. Hull and D. Burt. 1975. Statistical Package for the Social Sciences, McGraw-Hill, Inc. New York.

25. Pollock, M., R. Bohannon, and K. Cooper. 1976. "A Comparative Analysis of Four Protocols for Maximal Treadmill Stress Testing" Am. Heart J. 92:39-46.

26. Saltin, B. and L. Rowell. 1980. "Functional Adaptations to Physical Activity and Inactivity., Fed. Proc. J9s 1506-1513.

27. Sharkey, Bria.n. 1979. Physiology of Fitness, Human Kinetic Publishers, Champaign, Illinois.

28. Siri, W.E. 1961. "Body Composition from Fluid Spaces and Dene:i ty: Analysis of Methods." IN: Techniques for Measuring Body Composition, Nat. ~c~d. Sci.­Nat. Research Council, Washington, D.C., pp. 223-24.

29. Thompson, J., G. Jarvie and B. Lahey. 1982. "Exercise and Obesity: Etiology, Physiology and Intervention" Psy. Bulletin 91(1): 55-79.

30. Wildt, A. and O. Ahtola. 1978. Analysis of Covariance, Sage Publications, Beverly Hills.

31. Wilmore, J. , R. Girandola and F. Ka tch. 1970. "Body Composition Changes with a 10-week Program of Jogging" Med. Sci. Sports 2(3): 113-117.

32. Wilmore, Jack. 1974. "Alterations in Strength, Body Composition and Anthropometric Measurements Consequent to a 10-week Weight Training Program" Med. Sci. Sports 6: 133-138.

33. Wilmore, J. 1977. Athletic Training and Physical Fitness, Allyn and Bacon, Inc., Boston.

34. Wilmore, J. , P. Vodak and R. Parr. 1980. "Further Simplification of a Method for Determination of Residual Volume" Med. Sci. Sports 12(3): 216-218.

35. Yuhasz, M.S. 1965. "Physical Fitness and Sports Appraisal Laboratory Manual" University of Western Ontario.

S3~H GN3:ddV.

APPENDIX A

INTERVIEW QUESTIONNAIRE

Are you presently involved in a weight lifting or running

class? Y N Program? y N

Are you available during MWF from 8:30 to 10:00 a.m.? Y N

This study is planned to overlap into the spring term by 5

weeks and requires participation during the spring

break, do you see any conflict regarding this matter?

y N

Is there a possible class involvement during the spring

quarter that you might need to take? Y N

Do you have any medical problems that might prevent 100%

participation on your part? Y N

Are you presently on doctor prescribed medication? Y N

If yes, what kind?

Have you had surgery of any kind in the past 6 months?

Y N If yes, what kind?

Have you been in the hospital in the past 6 months? Y N

If yes, why?

*Are you aware that you may be in the control group and be

assigned to a no participation role in this study?

y N

Are you presently enrolled in an activity class? y N

If yes, what?

62

* Subsequent to recruiting subjects, it was decided in

view of the small number of volunteers that a separate

control group would be recruited and tested rather

than randomly assigning some of the original

volunteers into the control.

APPENDIX B

INFORMED CONSENT

I, , hereby agree to serve as a subject in

the research project titled "The Effects of a Combined

Weight Training and Running Program on Body Composition in

College Males" conducted by Robert L. Hesslink Jr. under the

supervision of Dr. Milan Svoboda.

I understand that the study involves participation in

body composition assessment, physical conditioning through

weight training and/or running and there is a possibility

that I may fall into the control group which will remain

inactive during the course of the study. I understand that

possible risks to me associated with this study are muscular

fatigue, muscle soreness, and muscle strain. I also

understand that participation in this study requires my

involvement for 16 weeks on Monday-Wednesday-Friday from

8:30 to 10:00 a.m. including spring break.

It has been explained to me that the purpose of the

study is to learn possible alternative methods for the

64

maintenance and/or development of body composition. I may

not receive any direct benefit from participation in this

study but my participation may help to increase knowledge

which may benefit others in the future. Robert L. Hesslink

Jr. has offered to answer any questions I may have about the

study and any related material. I have been assured that

all information I give will be kept confidential and that

the identity of all subjects will remain anonymous.

I understand that I am free to withdraw from

participation in this study at any time without jeopardizing

my relationship with Portland State University.

I have read and understand the foregoing information.

Date Signature ~~~~~~~~~~~-

If you experience problems that are the result of your

participation in this study, please contact Dr. John

Lorentz, Office of Graduate Studies and Research, 105

Neuberger Hall, Portland State University, 229-3423.


Recommended