The effects of age and dietary restriction on thetissue-specific metabolome of DrosophilaMatthew J Laye, Buck Institute for Research on AgingViLinh Tran, Emory UniversityDean Jones, Emory UniversityPankaj Kapahi, Buck Institute for Research on AgingDaniel E L Promislow, University of Washington
Journal Title: Aging CellVolume: Volume 14, Number 5Publisher: Wiley Open Access | 2015-10-01, Pages 797-808Type of Work: Article | Final Publisher PDFPublisher DOI: 10.1111/acel.12358Permanent URL: https://pid.emory.edu/ark:/25593/q8g0q
Final published version: http://dx.doi.org/10.1111/acel.12358
Daniel Promislow, Department of Pathology and Department of Biology, University
of Washington, Seattle, WA, USA. Tel.: 206 616 6994; e-mail: [email protected]
Accepted for publication 28 April 2015
ª 2015 The Authors. Aging Cell published by the Anatomical Society and John Wiley & Sons Ltd.This is an open access article under the terms of the Creative Commons Attribution License, which permits use,distribution and reproduction in any medium, provided the original work is properly cited.
correlation with other metabolites; and (iv) DR significantly alters the
correlation structure of the metabolome network and slows or reverses
age-related changes in network structure. Our results show that high-
resolution metabolomic and network analyses serve as novel, powerful
models which provide insights into the mechanisms that underlie the
protective effects of DR on healthspan and lifespan in diverse organisms.
Results
Changes in the metabolome upon DR
As seen in many previous studies, we found that DR in w1118 female
mated flies extended mean and median lifespan (Fig. 1A). High-
resolution nontargeted metabolomic analyses were carried out in 10-
day-old w1118 flies in head, abdomen, and thorax separately. We found
928 metabolites that were significantly affected by DR at this age, of
which 646 were unique to the abdomen, 115 unique to the head, and
42 unique to the thorax (Fig. 1B).
Thorax and whole fly samples were collected at three ages, 10 days
of age when neither AL nor DR fed flies have begun to die, 20 days of
age when AL fed flies have just begun to die, and 40 days of age when
DR fed flies start to die and AL fed flies are close to their median lifespan
(Fig. 1A). In thorax and whole fly samples, the number and overlap of
metabolites that changed at the different ages is shown in a Venn
diagram (Fig. 1C,D). We found that between 10% (thorax) and 23%
(whole fly) of all metabolites were affected by DR at one or more of the
three sample ages (10, 20, and 40 days). Principal component analysis
(PCA) clearly distinguished flies on different diets for both thorax
(Fig. 1E) and whole fly (Fig. 1F) samples, in both young (10 days) and old
(40 days) flies.
For each tissue- and age-specific list of metabolites affected by DR,
we carried out metabolite set enrichment analysis (MSEA) using the
mummichog program, which identifies and maps metabolites to
pathways (Tables 1 and 2) (Li et al., 2013). These samples included
the four tissue types (head, abdomen, thorax, and whole body) from day
10 and two types (thorax and whole) from days 20 and 40 for a total of
(A) (B)
(C) (D)
(E) (F)
Fig. 1 Multivariate and tissue-specific
changes in the metabolome. (A) Lifespan
curve of wild-type w1118 nonvirgin female
flies fed a 0.5% yeast (DR) or 5% (AL) diet.
Vertical dotted lines indicate ages at which
samples were collected (biological
replicates n = 6). Whole flies and thorax
were collected at all three ages. Heads and
abdomen were collected at 10 days of age
only. (B–D) Venn diagram of numbers of
metabolites altered by DR (simple linear
model testing at P < 0.01, which is less
than FDR = 0.1 in all cases) in head,
abdomen, and thorax at 10 days of age (B)
in the thorax (C) and whole fly (D) at 10,
20, and 40 days of age. (E–F) Principalcomponent analysis of thorax (E) and whole
fly (F) samples from young (10 days) and
old (20 and 40 days combined) flies.
Ellipses indicate 75% confidence interval.
Aging and DR alter Drosophila metabolome, M. J. Laye et al.798
ª 2015 The Authors. Aging Cell published by the Anatomical Society and John Wiley & Sons Ltd.
eight conditions. This comparison enabled us to identify metabolite
pathways whose response to DR changed in a tissue- and/or age-specific
manner.
The metabolite set for amino acids was most robustly altered,
showing a decline in response to DR in every tissue and at every age.
No other metabolic set was enriched in all eight conditions. However,
in thorax and whole fly at 20 and 40 days of age, three metabolic
sets, beta-alanine biosynthesis, S-adenosyl-L-methionine cycle, and
methionine degradation I (to homocysteine) were downregulated
upon DR. The abdomen had the greatest number of metabolites
significantly affected by DR, and some metabolic sets were uniquely
enriched in the abdomen. For example, TCA cycle variation and
uridine-50phosphate biosynthesis pathways were downregulated, while
the pentose phosphate pathway, gluconate degradation, trehalose
degradation, and UDP-galactose biosynthesis metabolic sets were
increased uniquely in the abdomen (Tables 1 and 2). Together, these
data suggest that DR affects some metabolic pathways consistently
across conditions, while other metabolic pathways are only altered in
a single tissue or with age.
Validation of putative metabolites in an independent sample
To validate the changes in metabolites in our dataset, we conducted a
metabolomic screen using the metabolomic services at Metabolon,
which utilizes internal standards to validate metabolites. We then
compared the Metabolon-generated list of validated metabolites with
our putative metabolites (identified with themummichog program) from
10-day-old flies fed either a DR or AL diet (Table S5). The diet effect on
29 metabolites that were matched by m/z with mummichog and
independently by Metabolon was highly significantly correlated
(F1,27 = 28.9, P = 1.1 9 10�5, Fig. S4). Among the metabolites that
increased under DR in both experiments were carnitine, acetylcarnitine,
and adenine, while those that decreased in both experiments included
kynurenine, leucine, tryptophan, betaine, and pantothenate.
DR attenuates age-dependent changes in metabolites in old flies
We hypothesized that DR would reverse the effect of age on the
metabolome as early as 10 days of age. In particular, we asked whether
the effect of diet on each metabolite would reverse the effects of age on
that metabolite. For example, if metabolite i increases with age, would
Table 1 Metabolic sets decreased on DR
Metabolic Sets Decreased Head Abdomen Thorax10 Thorax20 Thorax40 Whole10 Whole20 Whole40 Frequency
Amino acids X X X X X X X X 8
Beta-alanine betaine biosynthesis X X X X X X 6
S-adenosyl-L-methionine cycle X X X X X 5
Choline biosynthesis III X X X X 4
Isoleucine biosynthesis from threonine X X X X 4
Methionine degradation I (to homocysteine) X X X X 4
Phenylethanol biosynthesis X X X 3
Phosphatidylcholine biosynthesis X X X 3
Serotonin and melatonin biosynthesis X X X 3
Asparagine biosynthesis III X X 2
Citrulline-nitric oxide cycle X X 2
NAD Biosynthesis from 2-amino-3-carboxymuconate
semialdehyde
X X 2
Phenylalanine degradation I X X 2
Purine deoxyribonucleosides degradation X X 2
Tryptophan degradation to 2-amino-3-carboxymuconate
semialdehyde
X X 2
Valine degradation X X 2
2-methylbutyrate biosynthesis X 1
4-hydroxyproline degradation I X 1
5-aminoimidazole ribonucleotide biosynthesis I X 1
Aspartate degradation II X 1
Catecholamine biosynthesis X 1
Dopamine degradation X 1
Folate transformations X 1
FormylTHF biosynthesis X 1
Glutathione redox reactions I X 1
Glutathione redox reactions II X 1
Isoleucine degradation I X 1
Proline degradation I X 1
Spermidine biosynthesis X 1
Spermine biosynthesis X 1
TCA cycle variation III (eukaryotic) X 1
Urate biosynthesis X 1
Urate biosynthesis X 1
Uridine-50-phosphate biosynthesis X 1
Uridine-50-phosphate biosynthesis X 1
Aging and DR alter Drosophila metabolome, M. J. Laye et al. 799
ª 2015 The Authors. Aging Cell published by the Anatomical Society and John Wiley & Sons Ltd.
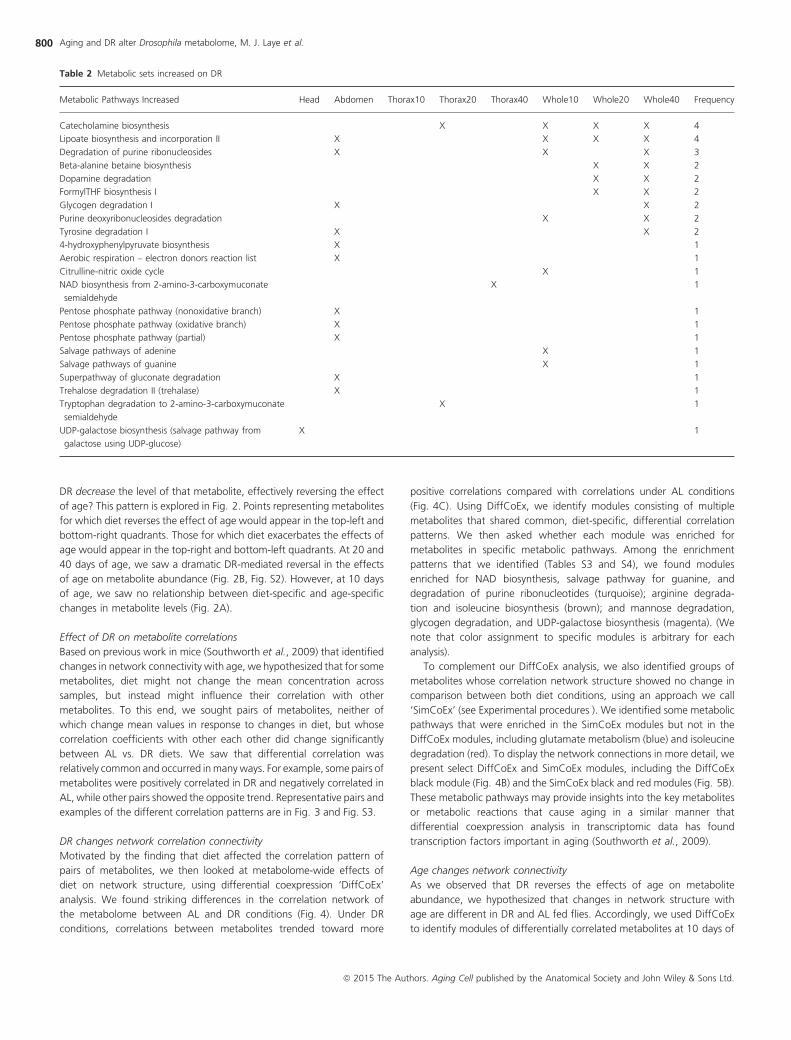
DR decrease the level of that metabolite, effectively reversing the effect
of age? This pattern is explored in Fig. 2. Points representing metabolites
for which diet reverses the effect of age would appear in the top-left and
bottom-right quadrants. Those for which diet exacerbates the effects of
age would appear in the top-right and bottom-left quadrants. At 20 and
40 days of age, we saw a dramatic DR-mediated reversal in the effects
of age on metabolite abundance (Fig. 2B, Fig. S2). However, at 10 days
of age, we saw no relationship between diet-specific and age-specific
changes in metabolite levels (Fig. 2A).
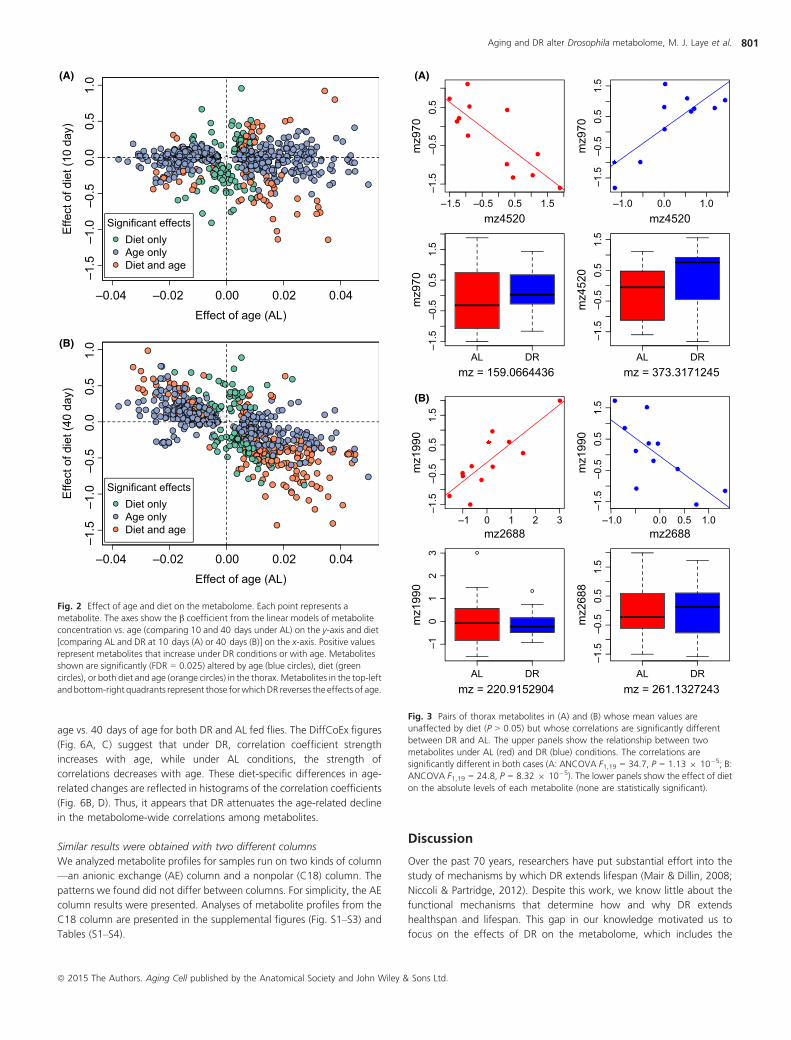
Effect of DR on metabolite correlations
Based on previous work in mice (Southworth et al., 2009) that identified
changes in network connectivity with age, we hypothesized that for some
metabolites, diet might not change the mean concentration across
samples, but instead might influence their correlation with other
metabolites. To this end, we sought pairs of metabolites, neither of
which change mean values in response to changes in diet, but whose
correlation coefficients with other each other did change significantly
between AL vs. DR diets. We saw that differential correlation was
relatively common and occurred inmanyways. For example, some pairs of
metabolites were positively correlated in DR and negatively correlated in
AL, while other pairs showed the opposite trend. Representative pairs and
examples of the different correlation patterns are in Fig. 3 and Fig. S3.
DR changes network correlation connectivity
Motivated by the finding that diet affected the correlation pattern of
pairs of metabolites, we then looked at metabolome-wide effects of
diet on network structure, using differential coexpression ‘DiffCoEx’
analysis. We found striking differences in the correlation network of
the metabolome between AL and DR conditions (Fig. 4). Under DR
conditions, correlations between metabolites trended toward more
positive correlations compared with correlations under AL conditions
(Fig. 4C). Using DiffCoEx, we identify modules consisting of multiple
metabolites that shared common, diet-specific, differential correlation
patterns. We then asked whether each module was enriched for
metabolites in specific metabolic pathways. Among the enrichment
patterns that we identified (Tables S3 and S4), we found modules
enriched for NAD biosynthesis, salvage pathway for guanine, and
degradation of purine ribonucleotides (turquoise); arginine degrada-
tion and isoleucine biosynthesis (brown); and mannose degradation,
glycogen degradation, and UDP-galactose biosynthesis (magenta). (We
note that color assignment to specific modules is arbitrary for each
analysis).
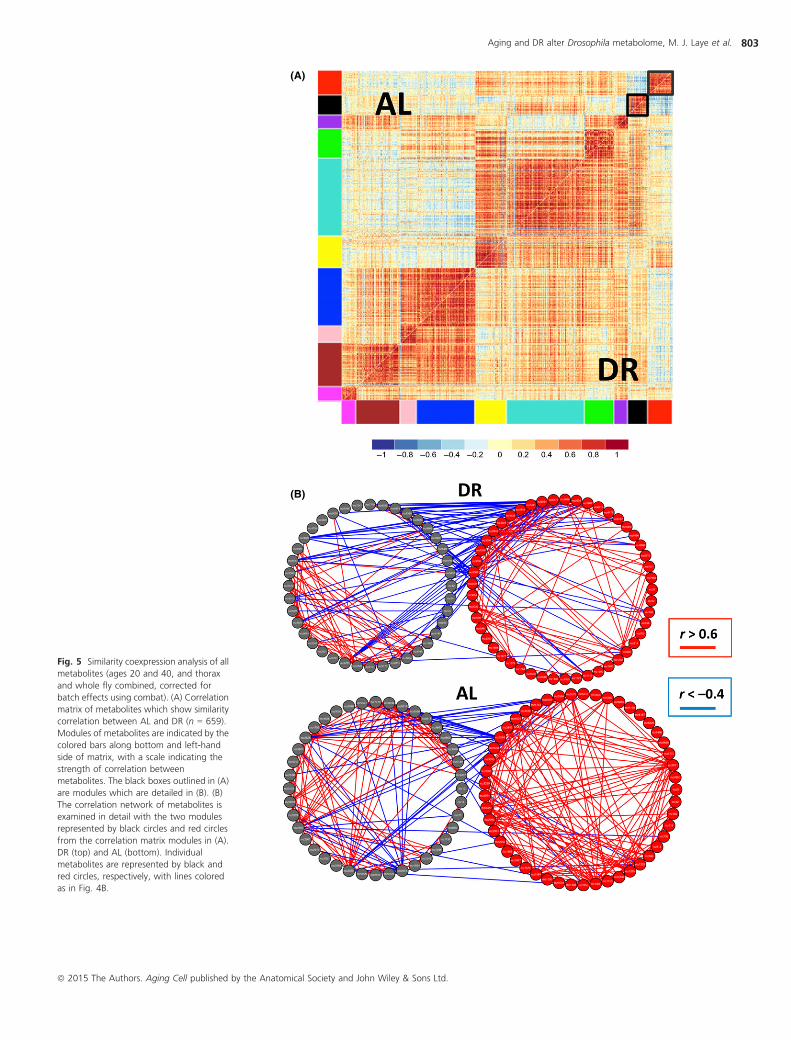
To complement our DiffCoEx analysis, we also identified groups of
metabolites whose correlation network structure showed no change in
comparison between both diet conditions, using an approach we call
‘SimCoEx’ (see Experimental procedures ). We identified some metabolic
pathways that were enriched in the SimCoEx modules but not in the
DiffCoEx modules, including glutamate metabolism (blue) and isoleucine
degradation (red). To display the network connections in more detail, we
present select DiffCoEx and SimCoEx modules, including the DiffCoEx
black module (Fig. 4B) and the SimCoEx black and red modules (Fig. 5B).
These metabolic pathways may provide insights into the key metabolites
or metabolic reactions that cause aging in a similar manner that
differential coexpression analysis in transcriptomic data has found
transcription factors important in aging (Southworth et al., 2009).
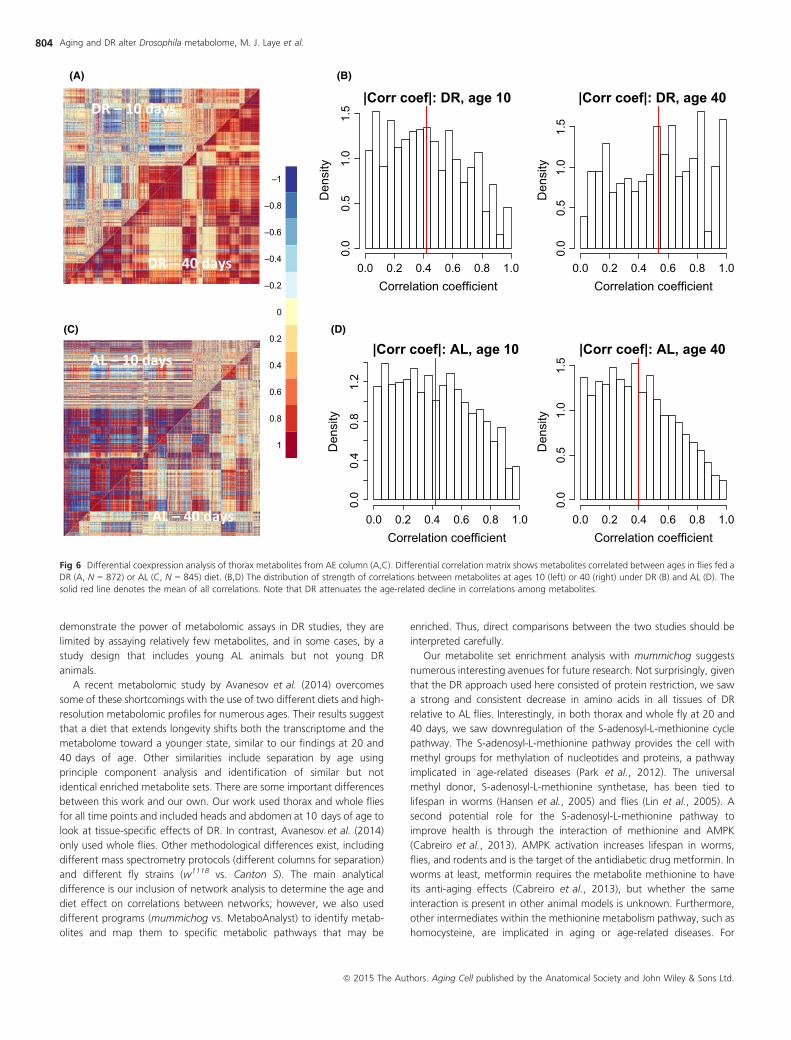
Age changes network connectivity
As we observed that DR reverses the effects of age on metabolite
abundance, we hypothesized that changes in network structure with
age are different in DR and AL fed flies. Accordingly, we used DiffCoEx
to identify modules of differentially correlated metabolites at 10 days of
Table 2 Metabolic sets increased on DR
Metabolic Pathways Increased Head Abdomen Thorax10 Thorax20 Thorax40 Whole10 Whole20 Whole40 Frequency
Catecholamine biosynthesis X X X X 4
Lipoate biosynthesis and incorporation II X X X X 4
Degradation of purine ribonucleosides X X X 3
Beta-alanine betaine biosynthesis X X 2
Dopamine degradation X X 2
FormylTHF biosynthesis I X X 2
Glycogen degradation I X X 2
Purine deoxyribonucleosides degradation X X 2
Tyrosine degradation I X X 2
4-hydroxyphenylpyruvate biosynthesis X 1
Aerobic respiration – electron donors reaction list X 1
Citrulline-nitric oxide cycle X 1
NAD biosynthesis from 2-amino-3-carboxymuconate
semialdehyde
X 1
Pentose phosphate pathway (nonoxidative branch) X 1
Pentose phosphate pathway (oxidative branch) X 1
Pentose phosphate pathway (partial) X 1
Salvage pathways of adenine X 1
Salvage pathways of guanine X 1
Superpathway of gluconate degradation X 1
Trehalose degradation II (trehalase) X 1
Tryptophan degradation to 2-amino-3-carboxymuconate
semialdehyde
X 1
UDP-galactose biosynthesis (salvage pathway from
galactose using UDP-glucose)
X 1
Aging and DR alter Drosophila metabolome, M. J. Laye et al.800
ª 2015 The Authors. Aging Cell published by the Anatomical Society and John Wiley & Sons Ltd.
age vs. 40 days of age for both DR and AL fed flies. The DiffCoEx figures
(Fig. 6A, C) suggest that under DR, correlation coefficient strength
increases with age, while under AL conditions, the strength of
correlations decreases with age. These diet-specific differences in age-
related changes are reflected in histograms of the correlation coefficients
(Fig. 6B, D). Thus, it appears that DR attenuates the age-related decline
in the metabolome-wide correlations among metabolites.
Similar results were obtained with two different columns
We analyzed metabolite profiles for samples run on two kinds of column
—an anionic exchange (AE) column and a nonpolar (C18) column. The
patterns we found did not differ between columns. For simplicity, the AE
column results were presented. Analyses of metabolite profiles from the
C18 column are presented in the supplemental figures (Fig. S1–S3) and
Tables (S1–S4).
Discussion
Over the past 70 years, researchers have put substantial effort into the
study of mechanisms by which DR extends lifespan (Mair & Dillin, 2008;
Niccoli & Partridge, 2012). Despite this work, we know little about the
functional mechanisms that determine how and why DR extends
healthspan and lifespan. This gap in our knowledge motivated us to
focus on the effects of DR on the metabolome, which includes the
(A)
(B)
–0.04 –0.02 0.00 0.02 0.04
–1.5
–1.0
–0.5
0.0
0.5
1.0
Effect of age (AL)
Effe
ct o
f die
t (40
day
)
Significant effectsDiet onlyAge onlyDiet and age
–0.04 –0.02 0.00 0.02 0.04
–1.5
–1.0
–0.5
0.0
0.5
1.0
Effect of age (AL)
Effe
ct o
f die
t (10
day
)
Significant effectsDiet onlyAge onlyDiet and age
Fig. 2 Effect of age and diet on the metabolome. Each point represents a
metabolite. The axes show the b coefficient from the linear models of metabolite
concentration vs. age (comparing 10 and 40 days under AL) on the y-axis and diet
[comparing AL and DR at 10 days (A) or 40 days (B)] on the x-axis. Positive values
represent metabolites that increase under DR conditions or with age. Metabolites
shown are significantly (FDR = 0.025) altered by age (blue circles), diet (green
circles), or both diet and age (orange circles) in the thorax. Metabolites in the top-left
andbottom-right quadrants represent those forwhichDR reverses the effects of age.
(A)
(B)
–1.5 –0.5 0.5 1.5
–1.5
–0.5
0.5
mz4520
mz9
70
–1.0 0.0 1.0
–1.5
–0.5
0.5
1.5
mz4520
mz9
70
AL DR
–1.5
–0.5
0.5
1.5
mz = 159.0664436
mz9
70
AL DR
–1.5
–0.5
0.5
1.5
mz = 373.3171245
mz4
520
–1 0 1 2 3
–1.5
–0.5
0.5
1.5
mz2688
mz1
990
–1.0 0.0 0.5 1.0
–1.5
–0.5
0.5
1.5
mz2688
mz1
990
AL DR
–10
12
3
mz = 220.9152904
mz1
990
AL DR
–1.5
–0.5
0.5
1.5
mz = 261.1327243
mz2
688
Fig. 3 Pairs of thorax metabolites in (A) and (B) whose mean values are
unaffected by diet (P > 0.05) but whose correlations are significantly different
between DR and AL. The upper panels show the relationship between two
metabolites under AL (red) and DR (blue) conditions. The correlations are
significantly different in both cases (A: ANCOVA F1,19 = 34.7, P = 1.13 9 10�5; B:
ANCOVA F1,19 = 24.8, P = 8.32 9 10�5). The lower panels show the effect of diet
on the absolute levels of each metabolite (none are statistically significant).
Aging and DR alter Drosophila metabolome, M. J. Laye et al. 801
ª 2015 The Authors. Aging Cell published by the Anatomical Society and John Wiley & Sons Ltd.
building blocks of so many functional pathways in an organism. Previous
studies have found that DR alters not just physiological traits, such as
starvation resistance (Katewa et al., 2012), mitochondrial activity (Zid
et al., 2009; Katewa et al., 2012), and spontaneous activity (Parashar &
Rogina, 2009), but also the transcriptome (Pletcher et al., 2002;
Whitaker et al., 2014). The work presented here brings needed
attention to the metabolome.
In mice and other vertebrate species, studies hint at the possibility
that DR might influence lifespan or healthspan in part through
preventing age-related changes in the metabolome. For example, De
Guzman et al. (2013) found 77 of 7000 serum features that differed
between young and old AL mice, 15 of which were attenuated by DR.
In dogs, Richards et al. (2013) found the plasma metabolome differ
with age in both DR and AL fed animals, but it was not clear from their
study whether DR attenuated the age-related change in the metab-
olome. Finally, a study in Rhesus macaques found that age and DR
alter the plasma metabolome and may prevent age-related changes in
the metabolome (see Table 3 in Rezzi et al., 2009). While these studies
(A)
(B)
(C)
Fig. 4 Differential coexpression analysis of
all metabolites (ages 20 and 40, and thorax
and whole fly combined, correcting for
batch effects using combat). (A) Correlation
matrix of metabolites significantly
correlated (n = 550) in DR or AL, but not
both diets. Modules of metabolites are
indicated by the colored bars. The black box
highlights the module of metabolites
shown in detail in (B). (B) Detailed
examination of the correlation network of
metabolites in the black module from (A) in
DR (left panel) and AL (right panel).
Individual metabolites are represented by
yellow circles, with positive correlations
(r > 0.5) shown in red and negative
correlations (r < �0.5) shown in blue. (C)
Distribution of correlations between
metabolites in DR (left panel) and AL (right
panel) for thorax. The solid red line
indicates the mean of all correlations.
Across all metabolites in (A), correlations
are significantly higher for DR than AL
(P < 1e-16).
Aging and DR alter Drosophila metabolome, M. J. Laye et al.802
ª 2015 The Authors. Aging Cell published by the Anatomical Society and John Wiley & Sons Ltd.
(A)
(B)
Fig. 5 Similarity coexpression analysis of all
metabolites (ages 20 and 40, and thorax
and whole fly combined, corrected for
batch effects using combat). (A) Correlation
matrix of metabolites which show similarity
correlation between AL and DR (n = 659).
Modules of metabolites are indicated by the
colored bars along bottom and left-hand
side of matrix, with a scale indicating the
strength of correlation between
metabolites. The black boxes outlined in (A)
are modules which are detailed in (B). (B)
The correlation network of metabolites is
examined in detail with the two modules
represented by black circles and red circles
from the correlation matrix modules in (A).
DR (top) and AL (bottom). Individual
metabolites are represented by black and
red circles, respectively, with lines colored
as in Fig. 4B.
Aging and DR alter Drosophila metabolome, M. J. Laye et al. 803
ª 2015 The Authors. Aging Cell published by the Anatomical Society and John Wiley & Sons Ltd.
demonstrate the power of metabolomic assays in DR studies, they are
limited by assaying relatively few metabolites, and in some cases, by a
study design that includes young AL animals but not young DR
animals.
A recent metabolomic study by Avanesov et al. (2014) overcomes
some of these shortcomings with the use of two different diets and high-
resolution metabolomic profiles for numerous ages. Their results suggest
that a diet that extends longevity shifts both the transcriptome and the
metabolome toward a younger state, similar to our findings at 20 and
40 days of age. Other similarities include separation by age using
principle component analysis and identification of similar but not
identical enriched metabolite sets. There are some important differences
between this work and our own. Our work used thorax and whole flies
for all time points and included heads and abdomen at 10 days of age to
look at tissue-specific effects of DR. In contrast, Avanesov et al. (2014)
only used whole flies. Other methodological differences exist, including
different mass spectrometry protocols (different columns for separation)
and different fly strains (w1118 vs. Canton S). The main analytical
difference is our inclusion of network analysis to determine the age and
diet effect on correlations between networks; however, we also used
different programs (mummichog vs. MetaboAnalyst) to identify metab-
olites and map them to specific metabolic pathways that may be
enriched. Thus, direct comparisons between the two studies should be
interpreted carefully.
Our metabolite set enrichment analysis with mummichog suggests
numerous interesting avenues for future research. Not surprisingly, given
that the DR approach used here consisted of protein restriction, we saw
a strong and consistent decrease in amino acids in all tissues of DR
relative to AL flies. Interestingly, in both thorax and whole fly at 20 and
40 days, we saw downregulation of the S-adenosyl-L-methionine cycle
pathway. The S-adenosyl-L-methionine pathway provides the cell with
methyl groups for methylation of nucleotides and proteins, a pathway
implicated in age-related diseases (Park et al., 2012). The universal
methyl donor, S-adenosyl-L-methionine synthetase, has been tied to
lifespan in worms (Hansen et al., 2005) and flies (Lin et al., 2005). A
second potential role for the S-adenosyl-L-methionine pathway to
improve health is through the interaction of methionine and AMPK
(Cabreiro et al., 2013). AMPK activation increases lifespan in worms,
flies, and rodents and is the target of the antidiabetic drug metformin. In
worms at least, metformin requires the metabolite methionine to have
its anti-aging effects (Cabreiro et al., 2013), but whether the same
interaction is present in other animal models is unknown. Furthermore,
other intermediates within the methionine metabolism pathway, such as
homocysteine, are implicated in aging or age-related diseases. For
DR – 10 days
DR – 40 days
AL – 10 days
AL – 40 days
(A) (B)
(C) (D)
–1
–0.8
–0.6
–0.4
–0.2
0
0.2
0.4
0.6
0.8
1
|Corr coef|: DR, age 10
Correlation coefficient
Den
sity
0.0 0.2 0.4 0.6 0.8 1.0
0.0
0.5
1.0
1.5
|Corr coef|: DR, age 40
Correlation coefficient
Den
sity
0.0 0.2 0.4 0.6 0.8 1.0
0.0
0.5
1.0
1.5
|Corr coef|: AL, age 10
Correlation coefficient
Den
sity
0.0 0.2 0.4 0.6 0.8 1.0
0.0
0.4
0.8
1.2
|Corr coef|: AL, age 40
Correlation coefficientD
ensi
ty
0.0 0.2 0.4 0.6 0.8 1.0
0.0
0.5
1.0
1.5
Fig 6 Differential coexpression analysis of thorax metabolites from AE column (A,C). Differential correlation matrix shows metabolites correlated between ages in flies fed a
DR (A, N = 872) or AL (C, N = 845) diet. (B,D) The distribution of strength of correlations between metabolites at ages 10 (left) or 40 (right) under DR (B) and AL (D). The
solid red line denotes the mean of all correlations. Note that DR attenuates the age-related decline in correlations among metabolites.
Aging and DR alter Drosophila metabolome, M. J. Laye et al.804
ª 2015 The Authors. Aging Cell published by the Anatomical Society and John Wiley & Sons Ltd.
instance, homocysteine accelerates senescence of primary endothelial
cells with increasing passage number (Zhang et al., 2015) and high levels
of homocysteine are associated with cognitive decline and Alzheimer’s
disease (reviewed Kronenberg et al., 2009). One possible reason for this
downregulation will be reduced amino acids in the diet and thus a
reduced need for amino acid degradation pathways.
Our tissue-specific analysis suggests that DR may regulate different
metabolic processes in different tissues. For example, only in the
abdomen did we see evidence of a DR-mediated increase in the pentose
phosphate pathway and aerobic transport pathways. One important role
of the pentose phosphate pathway is to generate NADPH for reductive
biosynthesis of metabolites such as fatty acids. The Drosophila abdomen
is both a site for de novo lipogenesis (Palm et al., 2012) and lipid export
as the abdomen contains lipid-carrying carnitine moieties (Chintapalli
et al., 2013). We have shown that the turnover of lipid in muscle is
critical for beneficial effects of DR on lifespan and metabolism (Katewa
et al., 2012). While it was beyond the scope of the current study to look
at the effects of DR on all tissues, Chintapalli et al. (2013) performed
metabolomics and lipidomics on ten different fly tissues under a single
diet and show each tissue has a specific metabolite profile. A more
complete analysis of tissue-specific responses to DR and age should
greatly increase our understanding of the underlying mechanisms by
which DR alters the metabolome and ultimately increases healthspan
and lifespan.
While additional tissue-specific data will prove insightful, so will new
analytical and computational approaches to existing data. For example,
rather than focus just on changes in mean values, recent systems biology
studies highlight the value of looking at correlations between variables.
This has most commonly taken the form of transcriptome data,
associating changes in network structure with a variety of diseases
(Amar et al., 2013). Perhaps most relevant to the work we have
presented here, Southworth et al. (2009) found that correlation coef-
ficients among transcripts measured in 13 different mouse tissues
declined with age.
While rare in metabolomic studies, those that have used this
approach do provide novel information into biochemical and metabolic
regulation. For example, Muller-Linow et al. (2007) found that the
structure of the metabolite correlation network in Arabidopsis thaliana
varied with time of day and that networks that were further apart in time
were further apart in structure. Until now, differential metabolome
network analyses have been limited to studies in plants (e.g., DiLeo
et al., 2011; Fukushima et al., 2011). To our knowledge, ours is the first
study to use differential coexpression analysis to look at diet- and age-
related changes in the metabolome captured with high-resolution
metabolomics.
Differential coexpression analysis identified numerous modules of
metabolites whose correlation patterns changed in tandem between AL
and DR conditions. These observations, combined with the well-known
result that DR reduces age-related mortality rate and slows age-related
declines in function, led us to ask how diet influenced age-related
changes in network correlation. As anticipated, we found a loss of
network correlation under ad lib conditions (consistent with Southworth
et al., 2009), but if anything, DR flies showed greater network
correlation at older ages (Fig. 6). In both DR and AL conditions, the
changes in network connectivity occurred in a modular, nonlinear
fashion, suggesting a biologically coordinated mechanism. However,
unlike Southworth et al.’s (2009) result, it is unlikely that transcription
factors can account for changes in correlations between metabolites. We
hypothesize that these changes reflect alterations in flux through specific
metabolic pathways, but the underlying details are likely quite complex.
We would also note that our network is based on relatively few samples.
Increased sample size in future studies will be critical to develop a more
robust portrait of the effects of diet and age on network structure.
As Muller-Linow et al. (2007) point out, one can often observe pairs
of metabolites that are correlated across samples, but which are
apparently unrelated in a map of known metabolic reactions. Future
studies with targeted metabolomic approaches should allow us to
measure the degree of overlap (or lack thereof) for metabolites that
show diet- and age-specific changes in correlation structure. Testing
hypotheses related to these differential correlations is not straightfor-
ward. If we observe levels in a single metabolite that are associated with
a trait of interest, we can try to increase or decrease levels of that
metabolite through genetic (Eisenberg et al., 2014) or pharmacological
(Wang et al., 2014) means. More challenging still, it remains to be seen
whether we can alter age-related changes in metabolite correlations by
feeding two or more metabolites to flies simultaneously, or altering
expression patterns of multiple enzymes associated with metabolites
whose correlations change with age.
We would stress here that we do not yet know the significance of
these correlations, but they may be a reflection of organismal homeo-
stasis. Using the mummichug program (Li et al., 2013), we were able to
identify enriched metabolic pathways in groups of metabolites not only
whose mean values changed with diet, but also whose correlation
network changed with diet (Fig. 3). For example, within turquoise
module in Fig. 3, we identified enrichment for many metabolic
pathways. Some of these pathways are important for amino acid
metabolism including glutamate biosynthesis, glutamine degradation,
arginine degradation, proline biosynthesis, and serine biosynthesis, while
other pathways are important for energy metabolism, including oxida-
Nucleocytosolic depletion of the energy metabolite acetyl-coenzyme a stimulates
autophagy and prolongs lifespan. Cell Metab. 19, 431–444.Fontana L, Partridge L, Longo VD (2010) Extending healthy life span–from yeast to
humans. Science 328, 321–326.Forster MJ, Morris P, Sohal RS (2003) Genotype and age influence the effect of
caloric intake on mortality in mice. FASEB J. 17, 690–692.Fuchs S, Bundy JG, Davies SK, Viney JM, Swire JS, Leroi AM (2010) A metabolic
signature of long life in Caenorhabditis elegans. BMC Biol. 8, 14.Fukushima A, Kusano M, Redestig H, Arita M, Saito K (2011) Metabolomic
correlation-network modules in Arabidopsis based on a graph-clustering
approach. BMC Syst. Biol. 5, 1.Hansen M, Hsu AL, Dillin A, Kenyon C (2005) New genes tied to endocrine,
metabolic, and dietary regulation of lifespan from a Caenorhabditis elegans
genomic Rnai screen. PLoS Genet. 1, 119–128.
Aging and DR alter Drosophila metabolome, M. J. Laye et al. 807
ª 2015 The Authors. Aging Cell published by the Anatomical Society and John Wiley & Sons Ltd.
Hoffman JM, Soltow QA, Li S, Sidik A, Jones DP, Promislow DEL (2014) Effects of
age, sex, and genotype on high-sensitivity metabolomic profiles in the fruit fly,
Drosophila melanogaster. Aging Cell 13, 596–604.Horrillo D, Sierra J, Arribas C, Garcia-San Frutos M, Carrascosa JM, Lauzurica N,
Fernandez-Agullo T, Ros M (2011) Age-associated development of inflammation
in Wistar rats: effects of caloric restriction. Arch. Physiol. Biochem. 117, 140–150.Jones DP, Park Y, Ziegler TR (2012) Nutritional metabolomics: progress in
addressing complexity in diet and health. Annu. Rev. Nutr. 32, 183–202.Kapahi P, Zid BM, Harper T, Koslover D, Sapin V, Benzer S (2004) Regulation of
lifespan in Drosophila by modulation of genes in the TOR signaling pathway.
Curr. Biol. 14, 885–890.Kapahi P, Chen D, Rogers AN, Katewa SD, Li PW, Thomas EL, Kockel L (2010) With
tor, less is more: a key role for the conserved nutrient-sensing TOR pathway in
aging. Cell Metab. 11, 453–465.Katewa SD, Demontis F, Kolipinski M, Hubbard A, Gill MS, Perrimon N, Melov S,
Kapahi P (2012) Intramyocellular fatty-acid metabolism plays a critical role in
mediating responses to dietary restriction in Drosophila melanogaster. Cell
Stevens RD, Wenner BR, Kraus VB, Newgard CB, et al. (2011) Effect of Caloric
Restriction with and without Exercise on Metabolic Intermediates in Nonobese
Men and Women. The Journal of clinical endocrinology and metabolism 96,
E312–321.
R Core Team (2013). R: A Language and Environment for Statistical Computing.
Vienna, Austria: R Foundation for Statistical Computing.
Rezzi S, Martin FP, Shanmuganayagam D, Colman RJ, Nicholson JK, Weindruch R
(2009) Metabolic shifts due to long-term caloric restriction revealed in
nonhuman primates. Exp. Gerontol. 44, 356–362.Richards SE, Wang Y, Claus SP, Lawler D, Kochhar S, Holmes E, Nicholson JK
(2013) Metabolic phenotype modulation by caloric restriction in a lifelong dog
study. J. Proteome Res. 12, 3117–3127.Sarup P, Pedersen SM, Nielsen NC, Malmendal A, Loeschcke V (2012) The
metabolic profile of long-lived Drosophila melanogaster. PLoS ONE 7, e47461.Soltow QA, Jones DP, Promislow DE (2010) A network perspective on metabolism
and aging. Integr. Comp. Biol. 50, 844–854.Southworth LK, Owen AB, Kim SK (2009) Aging mice show a decreasing
correlation of gene expression within genetic modules. PLoS Genet. 5,e1000776.
Tesson BM, Breitling R, Jansen RC (2010) DiffCoEx: a simple and sensitive
method to find differentially coexpressed gene modules. BMC Bioinformatics
11, 497.Tomas-Loba A, Bernardes de Jesus B, Mato JM, Blasco MA (2013) A metabolic
signature predicts biological age in mice. Aging Cell 12, 93–101.Wang X, Wang LP, Tang H, Shan WY, Wang X, Liu D, Wu YY, Tian Q, Wang JZ,
by restoring insulin-like growth factor II via decreasing p53 oxidation. Neuro-
pharmacology 76(Pt A), 80–87.Whitaker R, Gil MP, Ding F, Tatar M, Helfand SL, Neretti N (2014) Dietary switch
reveals fast coordinated gene expression changes in Drosophila melanogaster.
Aging (Albany NY) 6, 355–368.Williams CM, Watanabe M, Guarracino MR, Ferraro MB, Edison AS, Morgan TJ,
Boroujerdi AF, Hahn DA (2014) Cold adaptation shapes the robustness of
metabolic networks in Drosophila melanogaster. Evolution 68, 3505–3523.Young A (1997) Ageing and physiological functions. Philos. Trans. R. Soc. Lond. B
Biol. Sci. 352, 1837–1843.Zhang D, Sun X, Liu J, Xie X, Cui W, Zhu Y (2015) Homocysteine accelerates
senescence of endothelial cells via DNA hypomethylation of human telomerase
reverse transcriptase. Arterioscler. Thromb. Vasc. Biol. 35, 71–78.Zid BM, Rogers AN, Katewa SD, Vargas MA, Kolipinski MC, Lu TA, Benzer S,
Kapahi P (2009) 4E-BP extends lifespan upon dietary restriction by enhancing
mitochondrial activity in Drosophila. Cell 139, 149–160.
Supporting Information
Additional Supporting Information may be found in the online version of this
article at the publisher’s web-site.
Fig. S1 Data from C18 column.
Fig. S2 Effect of age and diet on the metabolome in C18 column separated
metabolites.
Fig. S3 Pairs of thorax metabolites whose mean values are unaffected by diet
(P > 0.05) but whose correlations are significantly different between DR and
AL.
Fig. S4 (A) Correlation between overlapping metabolites from the targeted
Metbolon approach and putatively matched metabolites by mummichog in
the non-targeted high resolution approach (referred to as ‘Jones’) for the diet
effect in 29 metabolites.
Data S1 Metabolon Data Analysis.
Table S1 Metabolic Sets Decreased on DR from Metabolites Run on the C18
column.
Table S2 Metabolic Sets Enriched on DR from C18 Column.
Table S3 Metabolic Path Enrichment for Modules in DiffCoEx.
Table S4 Metabolic Sets Enriched from SimCoEx Analysis.
Table S5 Normalized Metabolite Levels from Metabolon Data Set.
Aging and DR alter Drosophila metabolome, M. J. Laye et al.808
ª 2015 The Authors. Aging Cell published by the Anatomical Society and John Wiley & Sons Ltd.