Louisiana State University LSU Digital Commons LSU Historical Dissertations and eses Graduate School 1995 e Effects of Creatine Supplementation on Total Work Output and Metabolism During High- Intensity Intermient Exercise. Michael Cory Prevost Louisiana State University and Agricultural & Mechanical College Follow this and additional works at: hps://digitalcommons.lsu.edu/gradschool_disstheses is Dissertation is brought to you for free and open access by the Graduate School at LSU Digital Commons. It has been accepted for inclusion in LSU Historical Dissertations and eses by an authorized administrator of LSU Digital Commons. For more information, please contact [email protected]. Recommended Citation Prevost, Michael Cory, "e Effects of Creatine Supplementation on Total Work Output and Metabolism During High-Intensity Intermient Exercise." (1995). LSU Historical Dissertations and eses. 6129. hps://digitalcommons.lsu.edu/gradschool_disstheses/6129
Transcript
Louisiana State UniversityLSU Digital Commons
LSU Historical Dissertations and Theses Graduate School
1995
The Effects of Creatine Supplementation on TotalWork Output and Metabolism During High-Intensity Intermittent Exercise.Michael Cory PrevostLouisiana State University and Agricultural & Mechanical College
Follow this and additional works at: https://digitalcommons.lsu.edu/gradschool_disstheses
This Dissertation is brought to you for free and open access by the Graduate School at LSU Digital Commons. It has been accepted for inclusion inLSU Historical Dissertations and Theses by an authorized administrator of LSU Digital Commons. For more information, please [email protected].
Recommended CitationPrevost, Michael Cory, "The Effects of Creatine Supplementation on Total Work Output and Metabolism During High-IntensityIntermittent Exercise." (1995). LSU Historical Dissertations and Theses. 6129.https://digitalcommons.lsu.edu/gradschool_disstheses/6129
This manuscript has been reproduced from the microfilm master. UMI films the text directly from the original or copy submitted. Thus, some thesis and dissertation copies are in typewriter face, while others may be from any type of computer printer.
The quality of this reproduction is dependent upon the quality of the copy submitted. Broken or indistinct print, colored or poor quality illustrations and photographs, print bleedthrough, substandard margins, and improper alignment can adversely affect reproduction.
In the unlikely, event that the author did not send UMI a complete manuscript and there are missing pages, these will be noted. Also, if unauthorized copyright material had to be removed, a note wiD indicate the deletion.
Oversize materials (e.g., maps, drawings, charts) are reproduced by sectioning the original, beginning at the upper left-hand comer and continuing from left to right in equal sections with small overlaps. Each original is also photographed in one exposure and is included in reduced form at the back of the book.
Photographs included in the original manuscript have been reproduced xerographically in this copy. Higher quality 6" x 9" black and white photographic prints are available for any photographs or illustrations appearing in this copy for an additional charge. Contact UMI directly to order.
A Beil & Howell Information Company 300 North Zeeb Road. Ann Arbor. Ml 48106-1346 USA
313/761-4700 800/521-0600
THE EFFECTS OF CREATINE SUPPLEMENTATION ON TOTAL WORK OUTPUT AND METABOLISM DURING
HIGH INTENSITY INTERM ITTENT EXERCISE
A Dissertation
Submitted to the Graduate Faculty of the Louisiana State University and
Agricultural and Mechanical College in partial fulfillment of the
requirements of the degree of Doctor of Philosophy
in
The Department of Kinesiology
byMichael Cory Prevost
B.A., University of Southwestern Louisiana, 1990 December 1995
UMI Number: 9618319
UMI Microform 9618319 Copyright 1996, by UMI Company. All rights reserved.
This microform edition is protected against unauthorized copying under Title 17, United States Code.
UMI300 North Zeeb Road Ann Arbor, MI 48103
TABLE OF CONTENTS
list of Tables
list of Figures... .....____ ....____*.__ ____.....____ ...._______ ..vi
2. literature Review.................. 82.1 Intermittent Exercise ......................................... 82.2 Creatine and Control of the Creatine Pool 162.3 Creatine Supplementation Studies...................19
3. Materials and Methods.................................................243.1 Basic Design____________ 243.2 Subjects_______________________________253.3 Supplementation_______............. 273.4 V02 Peak.__________________________ 273.5 Standardized Exercise Bouts.....________ 283.6 Blood Draws and Analysis................................. 293.7 Oxygen Consumption.................................................303.8 Urinary Creatinine..........................._______ ........303.9 Statistical Analysis............................................. 31
4. Results ______ 324.1 Time to Exhaustion.............................................324.2 Oxygen Consumption.........................................344.3 Plasma Lactic Add_______________________394.4 Urinary Creatinine_______ ............... 394.5 Regression of Body Weight and Fitness on
Improvement in Total Work Output................44
5. Discussion 45
6. Summary and Condusions_______ .............. ......__ ....65
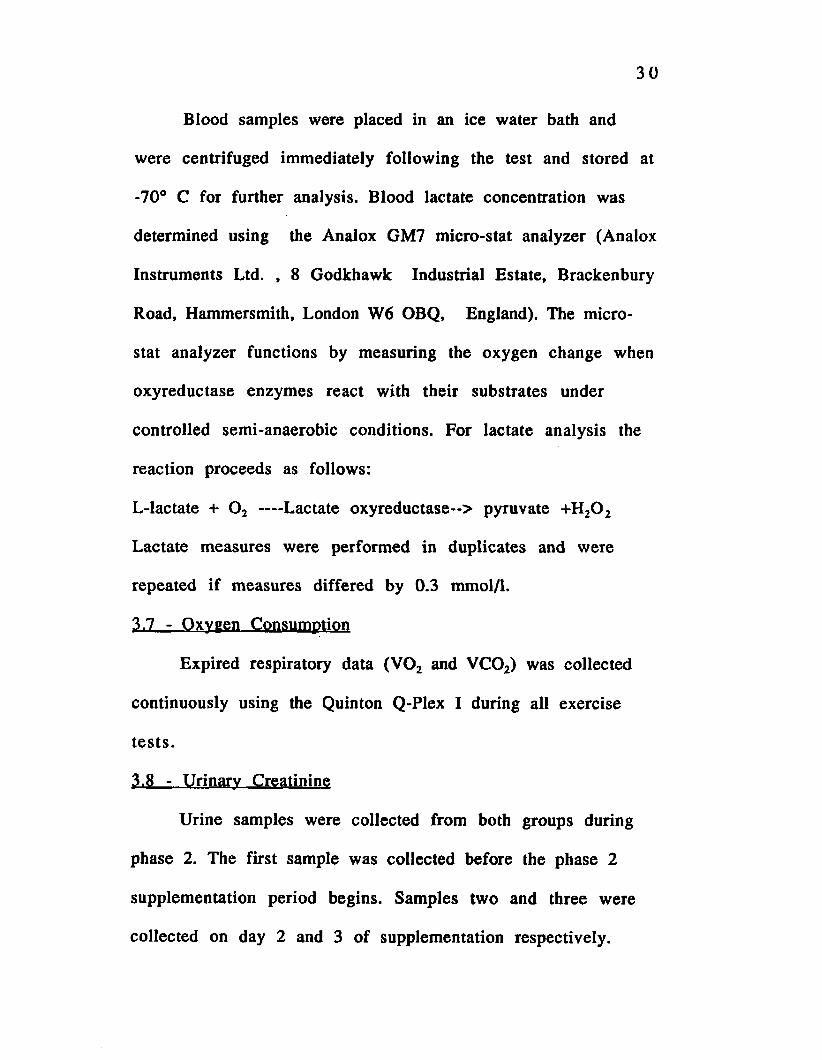
Lactate measures were performed in duplicates and were
repeated if measures differed by 0.3 mmol/1.
3.7 - Oxveen Consumption
Expired respiratory data (V 02 and VC02) was collected
continuously using the Quinton Q-Plex I during all exercise
tests.
3.8 - Urinary Creatinine
Urine samples were collected from both groups during
phase 2. The first sample was collected before the phase 2
supplementation period begins. Samples two and three were
collected on day 2 and 3 of supplementation respectively.
3 1
Urinary creatinine was determined by the use of Sigma kit
#555-A .
3.9 - Statistical Analysis
Time to exhaustion for each group was analyzed using
ANOVA with repeated measures (1 within=phase, 1
between=time). Post-ANOVA analysis involved, where
appropriate, the use of Tukey’s range test. The
experimentwise error rate was set at p<=0.05 and was
maintained throughout all post-ANOVA tests. Each bout was
analyzed independently for each group for differences in
lactate and respiratory data at specific time intervals using
ANOVA with repeated measures (1 within=phase, 1
between=time). Differences due to the supplementation
regime were determined by comparing Phase 1 (with all time
periods pooled) with phase 2 (with all time periods pooled).
Differences within groups in urinary creatinine concentration
were determined by using ANOVA with repeated measures.
Post ANOVA analysis involved the use of Tukey’s range test.
The relationship of fitness level and body weight with
increases in total work output was examined utilizing multiple
linear regression.
CHAPTER 4 - RESULTS
4.1 Time to Exhaustion
Creatine supplementation had a significant impact on
time to exhaustion (and thus total work output). The creatine
supplementation group showed a greater than 100% increase
in time to exhaustion on bout D, phase 2 (p<0.01) (see fig.4.1),
while the placebo group showed no significant change (see fig.
4.2). Bout D was impacted significantly more than the other
bouts with a greater than twofold increase in time to
exhaustion. Note that for all subjects on creatine, phase 2 bout
D was truncated at twice the performance time of phase 1. At
this time point all subjects on creatine reported feeling very
little fatigue and the ability to continue indefinitely. The bout
was truncated due to factors related to subject compliance and
because a twofold increase in time to exhaustion was
sufficient to show a significant impact of creatine
supplementation. Bout C was also significantly impacted by
creatine supplementation with a 61.9% increase in time to
exhaustion (PcO.Ol), while the placebo group showed no
significant change from phase 1 to phase 2 (see fig.4.1 and
4.2). The creatine group showed a 61.0% increase in time to
exhaustion (p<0.01) on bout B, Phase 2, while the placebo
32
group, again, showed no significant change. Finally, bout A
was also significantly impacted by creatine supplementation
(p<0.01) with a 23.5% increase in time to exhaustion, while
again, there was no significant change for the placebo group
(see fig.4.1 and 4.2). The gain in time to exhaustion was
significantly different for each bout (P<0.05) with the
magnitude of the increase being greater as the length of the
work period becomes shorter (ie. D>C>B>A).
450 -
400 ■
£ 350 ■C
g 300 ' wWg 250 ■P n5 200 --C £O 150 ■«£ 100 -h-
o -------A
Figure 4.1. Time to Exhaustion - Phase x Bout, C rea tine G roup. (Data are presented as means + standard deviations. ^Significantly different from phase1, p<0.01)
u iilit
- c
Bout
Phase 1
Phase 2
34
ooO)
225
2 DO -
175 -
150 ■
125 -
100 -
75 -
50 -
25 -
0
IESijipi
Bout
l~l Phase 1 EH Phase 2
Figure 4.2. Time to Exhaustion - Phase x Bout, P lacebo G roup. (Data are presented as means + standard deviations)
4,2 Oxygen Consumption
Oxygen consumption increased with time, as expected
for all exercise bouts. The creatine supplementation group,
however, showed a significantly lower oxygen consumption
rate (p<0.01) during bouts D (fig. 4.3) and C (fig. 4.5) for
phase 2. The placebo group showed no significant change in
oxygen consumption rate during these bouts (fig. 4.4 and 4.6).
Both groups showed a significantly lower rate of oxygen
consumption (p<0.01) during bout B, phase 2 (tig. 4.7 and
4.8). For bout A neither group showed a significantly lower
rate of oxygen consumption during phase 2. (fig. 4.9 and 4.10).
V02
(ml/k
gjni
n-1)
35
50
40 -
30 -
20 -
10 -
Phase 1
Phase 2
Time (Seconds)
Figure 4.3. V 02 For Phase 1 and 2, Bout D, Creatine Group
ic£
20 -
CMO>10 -
Phase 1
Phase 2
Time (Seconds)
Figure 4.4. V02 For Phase 1 and 2, Bout D,Placebo Group
V02
(ml/k
gjni
n-1)
V02
(ml/k
g.m
in-1
)
36
40
30 -
20 -
1 0 -
O 8 §
Phase 1
O Phase 2
Time (Seconds)
Figure 4.5. V 02 For Phase 1 and 2, Bout C, C re a tin e G roup
3 0 -
20 -
10 -
8 §
Phase 1
- O - — Phase 2
Time (Seconds)
Figure 4.6. V02 For Phase 1 and 2, Bout C,Placebo Group
V02
(ml/k
g.m
in-1
) V0
2 (m
l/kg.
min
-1)
37
25 -
20 -
1 5 -
10 -
8
Phase 1
O Phase 2
Time (Seconds)
Figure 4.7. V 02 For Phase 1 and 2, Bout B, C rea tin e G r o u p
30
2 5 -
20 -
15 -
8
“ O"
Phase 1
Phase 2
Time (Seconds)
Figure 4.8. V02 For Phase 1 and 2, Bout B,Placebo Group
V02
(ml/k
g.m
in-1
) V0
2 O
nl/k
gjni
n-1)
38
30
25 -
20 -
15 -
10 -
a 9
Phase 1
Phase 2
Time (Seconds)
Figure 4.9. V 02 For Phase 1 and 2, Bout A, Creatine Group
30
25 -
20 -
15 -
1 0 -
9 9 9 9
Phase 1
Phase 2
Time (Seconds)
Figure 4.10. V02 For Phase 1 and 2, Bout A,Placebo Group
39
4.3 Plasma Lactic Acid
Plasm a lactic acid concentration increased with
exercise a s expected. Lactate concentration was significantly
lower (P<0.01) for the creatine group on bout D, phase 2 (fig.
4.11) while the placebo group showed no significant change
from phase 1 to 2 (fig. 4.12). Bout C also showed a significant
decrease (p<0.01) from phase 1 to phase 2 for the creatine
group only (fig. 4.13), while the placebo group showed no
significant change (fig. 4.14). Also for bout B there was a
significant decrease in lactate concentration from phase 1 to
phase 2 (p<0.01) for the creatine group (fig. 4.15), while the
placebo group showed no change (fig.4.16). There was no
change by either group for bout A from phase 1 to 2 (fig.
4.17and 4.18).
4.4 Urinary Creatinine
Urinary creatinine concentration w as significantly
(p<0.01) elevated on day 2 and 3 of supplementation for the
creatine group (see fig. 4.19), while the placebo
supplementation group showed no change (see fig. 4.20). This
increased creatinine excretion suggests that subjects
complied with the supplementation regime.
Lact
ate
(mm
ol/1
)
40
12.5 -
1 0 -
I7.5 -
5 -
2.5 -
9 £S 2: 3 S3
Phase 1
Phase 2
Time (Minutes)
Figure 4.11. Lactate For Phase 1 and 2, Bout D, Creatine Group
10 -
o 9
•Phase 1
O-— Phase 2
Time (minutes)
Figure 4.12. Lactate For Phase 1 and 2, Bout D,Placebo Group
(I/IOU
JUJ)
41
o££
10 -
4̂++o—I 5 -
o 9 in
Phase 1
Phase 2
Time (minutes)
Figure 4.13. Lactate For Phase 1 and 2, Bout C, Creatine Group
1 0 -
Phase 1
•0...... Phase 2
Time (Minutes)
Figure 4.14. Lactate For Phase 1 and 2, Bout C,Placebo Group
42
1 5 -
V .oEEw*4̂
1 0 -
o
Phase 1
. — Phase 2
Time (Minutes)
Figure 4.15. Lactate For P hase 1 and 2, Bout B, C rea tin e G roup
20
15 -
1 0 -
5 -
y>
Phase 1
•O— Phase 2
Time (Minutes)
Figure 4.16. Lactate For Bout B Phase 1 and 2,Placebo Group
43
12.5 -
10 -
7 .6 -
5 -
2 .5 -
8 8 a
Phase I
Phase 2
Time (Seconds)
Figure 4 .17 . Lactate For Phase 1 and 2, Bout A, C rea tin e Group
12.5 -
10 -
7 .5 -
5 -
2.6
8 § 8
-O — Phase 1
Phase 2
Time (Seconds)
Figure 4.18. Lactate For Phase 1 and 2t Bout A,Placebo Group
44
2000 -
1800 -
? 1 6 0 ) - I1400
.c 1200
1 1000
£ 800 c
1~~1 Creatine (HI Placebo
3 600 "
400 -
200 -
0Pre SI S2
Figure 4.19. Urinary C reatin ine For C reatine And Placebo G roups (Data are presented as means + standard deviations. ‘Significantly different from p r e supplementation values, p<0.01)
4.5 Regression of Body Weight and Fitness on Improvement in Total Work Output
Neither body weight (r=0.074) nor fitness level
(maximum VOz during the VOz peak test)(r—0.038) or the
combination (r=0.076) were a good predictor of the magnitude
of improvement in total work output due to creatine
supplementation on bouts C, B and A (note that bout D was not
included because this bout was truncated a t twice the
performance time of phase 1.
CHAPTER 5 - DISCUSSION
Creatine supplementation (5g of creatine monohydrate
four to six times a day for 2 or more days) has been shown to
significantly increase the total creatine content of the
quadriceps femoris muscle in man (Harris et al. 1992). The
increase in the total creatine pool was in excess of 20%, with
20% or more of the increase being present as creatine
phosphate. Greenhaff et al. (1994) have also found a 25%
increase in total creatine content of the vastus lateralis after
creatine supplementation. Although skeletal muscle contains
95% of the body’s creatine pool (Greenhaff, 1994), creatine is
not synthesized in muscle. Therefore the size of the creatine
pool in skeletal muscle is regulated in part by blood creatine
concentrations (Crim et al., 1976). In the present study, all
subjects on creatine showed a significantly elevated urinary
creatinine concentration on day 2 and 3 of the
supplementation period. Subjects in the placebo group showed
no significant change. Assuming a daily urine output of .6 to
accumulation (indicating a reduced reliance on glycolysis to
produce ATP) and thus may have better preserved the ability
of glycolysis to generate ATP. The reduction in lactate
accumulation was greatest during bout D. This may explain
the relatively large impact of creatine supplementation on
61
bout D. Therefore because of a higher concentration of stored
phosphagens prior to each subsequent exercise period during
the bouts, the metabolic impact (decreased ATP and PCr
concentrations and increased lactate) of the exercise bouts
was reduced, thus delaying the onset of fatigue.
In addition to reducing lactate accumulation and
increasing total work output, oxygen consumption was also
impacted by creatine supplementation. The rate of oxygen
consumption was decreased during bout D and C following
creatine supplementation while the placebo group showed no
change during these bouts. Since oxygen consumption was
measured at the same time points on creatine versus placebo,
the same amount of work was done at a lower net oxygen
cost. This suggests that exercise efficiency (cost/work) was
affected by creatine supplementation.
Creatine may have delayed the increase in oxygen
consumption upon the initiation of exercise. A decrease in ATP
and an increase in ADP upon the initiation of exercise serves
as a stimulator of mitochondrial respiration (Scott, 1995). An
increase in PCr levels due to creatine supplementation might
have delayed the decrease in the ATP/ADP ratio that is
responsible for stimulating mitochondrial respiration. In
62
support of this argument it has been found that competition
between aerobic and anaerobic systems for ADP can inhibit
mitochondrial respiration (Gatt, S., and Racker, E., 1959). CPK
would be poised to have such an influence on mitochondrial
respiration. An increase in PCr might allow for a more rapid
rephosphorylation of ADP by CPK and thus reduce the ADP
concentration that might stimulate respiration.
Alternatively, a reduction in fatigue due to creatine
supplementation may have delayed changes in neuromuscular
coordination that may have occurred due to fatigue. It was
noted (although not actually measured) that subjects showed
an increased body movement as they approached exhaustion
(i:e. swaying side to side and leaning forward). This may have
represented a shift in muscle recruitment (due to fatigue)
from the primary muscles used during cycling to secondary
muscles that are in a less favorable position to produce force
(i.e. gluteus maximus, hamstrings). Utilizing these secondary
muscles would result in a need to generate greater force to
produce the same amount of external work, since these
muscles are in a less favorable position to produce force. As a
result oxygen consumption would be increased. If creatine
supplementation delayed the fatigue of the primary muscles
involved in cycling there would be a delay in this shift in
whole muscle recruitment patterns and thus a lower rate of
oxygen consumption. Note that although muscle recruitment
patterns were not measured, changes in recruitment patterns
cannot be ruled out as a plausible explanation for the decrease
in oxygen consumption and may present a plausible
explanation since both aerobic (decreased V 02) and anaerobic
(decreased lactate) metabolism were reduced following
supplem entation.
It was proposed that fitness levels might affect response
to creatine supplementation since Harris et al. (1992) have
shown that creatine uptake due to creatine feeding was
greatest in subjects that had a lower initial level of creatine.
Because exercise training has been shown to increase PCr
stores (Macdougall et al., 1977) the relationship between
fitness level (highest V 02 during V 02 peak test) and
magnitude of response to creatine supplementation was
investigated. No significant relationship between these two
variables was found. Perhaps the index of fitness chosen has
little relationship to muscle creatine levels. Alternatively,
creatine may have impacted performance regardless of initial
creatine levels. Also, the relationship of body weight to
magnitude of response to creatine supplementation was
investigated. The subjects encompassed a broad range in body
weights from 115 to 290 pounds. Therefore the lightest
subject in the study would have received nearly three times
the relative dose (dose/body wt.) of the heaviest subject.
However, no relationship between body weight and response
to creatine supplementation was observed. This might suggest
that the dose administered to the lighter subjects might have
been in excess of what was necessary to produce a response
since nearly 1/3 of that relative dose led to a similar response
in the largest subject.
CHAPTER 6 - SUMMARY AND CONCLUSIONS
The purpose of the present study was to determine if
creatine supplementation could increase total work output
during high intensity continuous and intermittent exercise.
The results indicate that creatine does enhance the
performance of high intensity intermittent exercise with a
lower accumulation of lactate and a lower rate of oxygen
consumption. Creatine supplementation may have enhanced
performance by affecting the management of adenine
nucleotides and high energy phosphates during the bouts. The
effects of creatine supplementation on intermittent exercise
are greatest when the length of the work bout is short. This
may be due to a greater relative reduction in the contribution
from glycolysis during the shorter work periods.
Although the ergogenic benefit of creatine
supplementation is likely to result from the impact on cellular
metabolism of an increase in creatine and PCr stores, other
possibilities may exist. In addition to metabolic perturbations,
other nonmetabolic mechanisms of fatigue have been
proposed. For example Bigland-Ritchie et al. (1979) have
proposed that fatigue could result from an impairment of the
central nervous system resulting in a less than optimal
65
frequency of motor nerve firing. Also, with fatigue a 10 to 20
mV reduction in membrane polarization has been observed
and this decreased membrane polarization has been
associated with a reduced Ca++ transient amplitude (Hanson
and Peterson, 1971). Both the reduced frequency of motor
nerve firing and a reduced Ca++ transient amplitude would
result in reduced force production. It is not known if creatine
supplementation can affect these fatigue mechanisms as well.
Also, alterations in blood flow and cardiac output would be
expected to affect the performance of intermittent exercise.
These cardiovascular parameters were not investigated in the
present study. In conclusion, though an increase in creatine
and PCr stores seems to be the most likely explanation of the
observed ergogenic effect, these alternative explanations
remain to be investigated.
Due to the observed ergogenic impact, creatine
supplementation might be recommended for athletes
participating in sports involving repeated, short bursts of
activity followed by rest or periods of reduced activity (i.e.
football, soccer, tennis, hockey etc...) Creatine supplementation
has been associated with no known side effects as creatine is
rapidly converted to creatinine in the blood stream in a
67
nonenzymatic-nonsaturable process. The resulting creatinine
is easily excreted by the kidney. Also, since creatine is a
naturally occurring component of a meat containing diet it is
unlikely to become a banned substance. In light of these
findings, creatine is likely to find use in many sport and
recreational activities.
Three important, yet unanswered questions with regard
to creatine supplementation are: What is the dose-response
relationship? What is the washout period (How long after the
cessation of supplementation does it take for muscle creatine
levels to return to normal baseline levels)? What are the long
term effects of creatine supplementation? Creatine
supplementation studies generally employ a dose of 20g a day
during the loading phase, apparently because this dose was
shown by Harris et al. (1992) to increase skeletal muscle
creatine concentration. However, this dose may be more than
is necessary. Due to the relatively high cost of creatine
supplementation, especially during the loading phase, it would
be beneficial to investigate further the dose-response
relationship of oral creatine supplementation. Also, Greenhaff
(1994) has mentioned that skeletal muscle creatine
concentration does not return to baseline levels for weeks
after the cessation of supplementation. Therefore the washout
period for creatine supplementation may be from weeks to
months. With regards to research, this may rule out
implementing cross over designs and reversal of treatment
designs. Finally, the long term effects of supplementing with
creatine while training are unknown. It is interesting to note
that creatine depletion upregulates glucose transporter and
oxidative enzyme expression in skeletal muscle (Shields et al.
(1975). It would be interesting to determine if long term
creatine supplementation affects any of these parameters.
Also, since creatine reduces the metabolic stress of exercise
(reduced lactate, reduced VOz and reduced fatigue) it would
b6 interesting to determine if creatine alters the conditioning
response due to exercise. Finally, if creatine allows for more
intense or longer training periods, due to delaying fatigue, we
might expect training volume or long term performance to be
affected by supplementation.
BIBLIOGRAPHY
Astrand, P., (1970) Physical performance, in Textbook o f Work P h ysio logy , pg. 295-353, McGraw-Hill.
Astrand, I., Astrand, P-O., Christensen, E.H., and Hedmanb, R., (1960) Myohemaglobin as an oxygen store in man, Acta physiol. Scand., 48,448-453.
Balsom, P.D., Ekblom, B., Soderlund, K., Sjodin, B., and Hultman,E., (1993) Creatine supplementation and dynamic high- intensity intermittent exercise, Scand. J. Med. Sci. Sports, 3, 143-149.
Balsom, P.D., Harridge, S.D., Soderlund, K„ Sjodin, B., and Ekblom, B., (1993) Creatine supplementation per se does not enhance endurance exercise performance, Acta Physiol.Scand., 149, 521-523.
Berden, J.A., Haan, A.de, Doom, J.E. van, Hartog, A.F. and Westra, H.G. (1986) Has IMP a regulatory role during fatiguing contraction? IMP-binding sites on the myosin complex of rat muscle, J. Physiol (Lod.), 381, 85P.
Bergmeyer, H.U. (1965) M ethods o f Enzymatic Analysis. 2nd ed. London, Academic Press.
Bessman, S.P., and Geiger, P.J. (1981) Transport of energy in muscle: The phosphorylcreatine shuttle. Scien ce , 211:448- 452.
Bigland-Ritchie, B., Jones, D.A., Woods, J.J. (1979) Excitation frequency and muscle fatigue: electrical responses during human voluntary and stimulated contractions. Exp. N eurol.,64, 414.
Bogdanis, G.C., Nevill, M.E., Lakomy, H.K.A., and Boobis, L.H., (1993) Human muscle metabolism during repeated maximal sprint cycling, Journal o f Physiology , 467, 77P.
Brooks, G.A. and Fahey, T.A. (1985) Exercise Physiology:Human Bioenergetics and Its Im plications, MacMillan Publishing company, New York, New York.
69
70
Crim, M.C., Calloway, D.H. and Margen, S. (1976) Creatine metabolism in men: Creatine pool size and turnover in relation to creatine intake. J. Nut. 106: 371-381.
Danforth, W.H. (1965) Activation of glycolytic pathway in muscle. In Control o f Energy Metabolism . Eds. B. Chance, R.W. Estrabrook and J.R. Williamson. Academic Press, New York. P. 287.
Dobson, G.P., Parkhouse, W.S. and Hochachka, P.W. (1987) regulation of anaerobic ATP-generating pathways in trout fast-twitch skeletal muscle, Am. J. Physiol. 253(22), R186- R194.
Dudley, G.A., Staron, R.S., Murray, T.F., Hagerman, F.C., and Luginbuhl, A.A., (1993) Muscle fiber composition and blood ammonia levels after intense exercise in humans, J. Appl. P h y s io l., 54(2): 582-586.
Earnest, C.P., Snell, P.G., Mitchell, T.L., Rodriquez, R.,Almada, A, (1993) Effect of creatine monohydrate ingestion on peak anaerobic power, capacity, and fatigue index, Med. and Sci. in Spts. and Ex.
Essen, B., (1978) Studies on the regulation of metabolism in human skeletal muscle using intermittent exercise as an experimental model. Acta Physiol. Scand. Suppl. 454, 1-32.
Fitch, C.D.,Shields, R.P., Payne, W.F., and Dacus, J.M. (1968) Creatine metabolism in skeletal muscle. III. Specificity of the creatine entry process. J . Biol. Chem . 243, 2024-2027.
Fitch, C.D. and Shields, R.P. (1966) Creatine metabolism in skeletal muscle. I. Creatine movement across muscle membranes. J. Biol. Chem. 241, 3611-3614.
Gaitanos, G.C., Williams, C., Boobis, L., and Brooks, S., (1993) Human muscle metabolism during intermittent maximal exercise of brief duration, Journal o f Physiology , 467, 76P.
7 1
Gaitanos, G. C., Williams, c., Boobis, L., and Brooks, S., (1993) Human muscle metabolism during intermittent maximal exercise, J. Appl. Physiol. 75(2), 712-719.
Gatt, S., and Racker, E. (1959) Regulatory mechanisms in carbohydrate metabolism. I. Crabtree effect in reconstructed systems. J. Biol. Chem. 234, 1015-1023.
Greenhaff, P.L. (1994) Symposium: Creatine and its application as an ergogenic aid, Nutritional Ergogenic Aids, November 11- 12, Gatorade Sports Science Institute.
Greenhaff, P. L., Bodin, K., Harris, R.C., Hultman, E., Jones, D.A., McIntyre, D.B., Soderlund, K., and Turner, D.L., (1993) The influence of oral creatine supplementation on muscle phosphocreatine resynthesis following interaction in man, Journal o f Physiology , 467, 75P.
Greenhaff, P.L., Bodin, K., Soderlund, K., and Hultman, (1994) Effect of oral creatine supplementation on skeletal muscle phosphocreatine resynthesis, Am. J. Physiol. 266, E725-E730.
Greenhaff, P.L., Casey, A., Short, A.H., Harris, R.,Soderlund, K., and Hultman, E., (1993) Influence of oral creatine supplementation on muscle torque during repeated bouts of maximal voluntary exercise in man, Clinical science , 84,565- 571.
Greenhaff, P. L., Nevill, M.E., Soderlund, K., Boobis, L., Williams, C., and Hultman, E., (1992) Energy metabolism in single muscle fibers during maximal sprint exercise in man, J. Physiol. , 446, 528P.
Guimbal, C., and Kilimann, M.W. (1993) A Na+ -dependent creatine transorter in rabbit brain, muscle, heart and kidney,J. B io l Chem. , 268(12), 8418-8421.
Hanson, J., and Persson, A. (1971) Changes in the action potential and contraction of isolated frog muscle after repetitive stimulation. Acta Physiol. Scand., 81, 340.
Harris, R.C., Marlia, D.J., Show, D.H. (1991) Muscle ATP loss and lactate accumulation at different work intensities in the
72
exercising thoroughbred horse. Eur. J. Appl. Physiol., 62, 235- 44.
Harris, R.C., Soderlund, K., and Hultman, E., (1992) Elevation of creatine in resting and exercised muscle of normal subjects by creatine supplementation, C linical Science, 83, 367-374.
Koszalka, T.R. and Andrew, C.L. (1972) Effect of insulin on the uptake of creatine-l-Cu by skeletal muscle and X-irradiated rats. Proc. Soc. Exp. Biol. Med. 139: 1265-1271.
Loike, J.D., Zalutsky, D.L., Kaback, E., Miranda, A.F. and Silverstein, S.C. (1987) Extracellular creatine regulates creatine transport in rat and human muscle cells, Proc. Natl. Acad. Sci, USA, 85: 807-811.
MacDougall, J.D, Ward, G.R, Sale, D.G., and Sutton, J.R. (1977) Biochemical adaptation of human skeletal muscle to heavy resistance training and immobilization, J. Appl. Physiol., 43(4), 700-703 .
McGilvery, R.W. (1975) The use of fuels for muscular work. In M etabolic Adaptation to Prolonged Physical Exercise, ed. H. Howald and J.R. Poortmans, 12-30. Basel: Birkhauser Verlag.
Miller, W.G. (1992) Regulation of energy production during exercise, In Biochemistry o f Exercise and M etabolic Adaption, Brown and Benchmark, Duburke, IA.
Mansour, T.E., (1963) Studies on heart phosphofructokinase: Purification, inhibition, and activation. J. Biol. Chem., 238, 2285-2292 .
Morgan, H.E. and Parmeggiani, A., (1964) Regulation of glycogenolysis in muscle. III. Control of glycogen phosphorylase activity, J. Biol. Chem., 239, 2440-2445.
Nagesser, A.S., Van Der Laarse and Elzinga, W. J. (1992) Metabolic changes with fatigue in different types of single muscle fibers of Xeopus laevis. Journal o f Physiology, 448, 5 1 1 -5 2 3 .
73
Passonneau, J.V. and Lowry, O.H. (1963) Phosphofructokinase and the control of the citric acid cycle, Bio chem. Biophys. Res. Commun.y 13, 372-379.
Saltin, B„ Essen, B., and Pendersen, P.K., (1976) Intermittent exercisers physiology and some practical applications, in E. Jokl, R.L. Anand, and H. Stoboy (eds.), Advances in Exercise P hysio logy, p. 23, S. Karger, Basel.
Scott, C.B. (1995) Anaerobic metabolic influences on oxygen uptake behavior, Journal o f Strength and Conditioning R esearch , 9(1), 59-62.
Shields, R.P., Whitehair, C.K., Carrow, R.E, Heusner, W.W., and Van Huss, W.D. (1975) Skeletal muscle function and structure after depletion of creatine, L abratory Investigation , 33(2), 151-158.
Soderlund, K., Greenhaff, P.L., and Hultman, E., (1992) energy metabolism in type I and type II human muscle fibers during short term electrical stimulation at different frequencies, A c ta Physio Scand., 144, 15-22.
Walker, J.B. (1973) Metabolic control of creatine biosynthesis, II. Restoration of transamidinase activity following creatine repression. J. Biol. Chem. 236, 493-498.
Westra, H.G. De Haan, A., Van Doom, J.E. and De Haan, E J. (1986) IMP production and energy metabolism during exercise in rats in relation to age. Biochem ical Journal 239, 751-755 .
APPENDIX A: CONSENT FORM
The Effects of Creatine Supplementation on Total Work Output and Metabolism During High Intensity Intermittent Exercise.
For most people, physical activity should not pose any problem or hazard. PAR-Q has been designed to identify the small number of adults for whom physical activity might be inappropriate or those who should have medical advice concerning the type of activity most suitable.
1. Has your doctor ever said you have heart trouble?2. Do you frequently suffer from pains in yuour chest?3. Do you often feel faint or have spells of severe dizziness?4. Has a doctor ever said yhour blood pressure was too high?5. Has a doctor ever told yo that you have a bone or joint problem shch as arthritis that has been aggravated by exercise, or might be made worse with exercise?6. Is there a good physical reason not mentioned here why yuou should not follow an activity program even if yo wanted to ?7. Are you over the age of 65 and not accustomed to vigorous exerc ise?
Can you answer yes to any of the aboveq u es tio n s?____________If so which one?_________
Signature _____________________________D a te_____________________ .
77
APPENDIX C: ANOVA TABLES
Table C .l. A Lactate C reatine
DF Sum of Squares Mean Square F-Value P-VaTueTime 2 1009.371 504.686 231.734 <.0001Subject(Group) 24 52.269 2.178Phase 1 .359 .359 2.824 .1058Phase * Time 2 .205 .102 .807 .4581Phase * Subject 24 3.047 .127
Table C.2. B L actate C reatine
DF Sum of Squares Mean Square F-Value P-ValueTime 3 1752.674 584.225 340.766 <.0001Subjeot(Group) 32 54.862 1.714Phase 1 10.580 10.580 57.426 <.0001Phase * Time 3 6.614 2.205 11.967 <.0001Phase * Subject 32 5.896 .184
Table C.3. B Lactate Placebo
DF Sum of Squares Mean Square F-Value P-ValueTime 3 1926.326 642.109 230.614 <.0001Subject(Group) 32 89.099 2.784Phase 1 .045 .045 .271 .6060Phase * Time 3 .509 .170 1.024 .3949Phase * Subject 32 5.306 .166
Table C.4. C L actate C reatine
DF Sum of Squares Mean Square F-Value P-ValueTime 3 1426.420 475.473 330.564 <.0001Subject(Group) 32 46.028 1.438Phase 1 7.094 7.094 57.020 <.0001Phase * Time 3 3.455 1.152 9.257 .0001Phase * Subject 32 3.981 .124
78
79
Table C.S. C Lactate Placebo
DF Sum of Squares Mean Square F-Value P-ValueTime 3 1618.292 539.431 194.857 <.0001Subjeot(Group) 32 88.587 2.768Phase 1 .073 .073 .416 .5236Phase * Time 3 .458 .153 .865 .4695Phase * Subject(Group) 32 5.653 .177
Table C.6. D Lactate C reatine
DF Sum of Squares Mean Square F-Value P-ValueTime 3 735.875 245.292 177.013 <.0001Subjeei(Group) 32 44.343 1.386Phase 1 65.551 65.551 177.016 <.0001Phase * Time 3 36.264 12.088 32.642 <.0001Phase * Subject(Group) 32 11.850 .370
DF Sum of Squares Mean Square F-Value P-ValueTIME 2 3208.676 1604.338 105.136 <.0001Subject(Group) 24 366.232 15.260Phase 1 .007 .007 .003 .9544Phase * TIME 2 .923 .462 .231 .7952Phase * Subject(Group) 24 47.890 1.995
80
Table C.9. A V02 Placebo
DF Sum of Squares Mean Square F-Value P-ValueTIME 2 3706.475 1853.237 111.867 <.0001Subjeot(Group) 24 397.595 16.566Phase 1 4.553 4.553 2.547 .1236Phase * TIME 2 1.078 .539 .301 .7425Phase * Subjeot(Group) 24 42.902 1.788
Table C.10. B V 02 creatine
DF Sum of Squares Mean Square F-Value P-ValueTIME 2 6430.809 3215.405 174.725 <.0001Subject(Group) 51 938.535 18.403Category for V02 1 31.558 31.558 4.699 .0349Category for V02 * TIME 2 9.140 4.570 .680 .5109Category for V02 * Subject.. 51 342.511 6.716
Table C .l l . B V 02 Placebo
DF Sum of Squares Mean Square F-Value P-ValueTIME 4 8946.018 2236.505 43.062 <.0001Subjeot(Oroup) 40 2077.498 51.937Phase I 46.512 46.512 49.382 <.0001Phase * TIME 4 6.867 1.717 1.823 .1434Phase * Subjeot(Group) 40 37.676 .942
’a b le d C.12. C V 02 Creatine
DF Sum of Squares Mean Square F-Value P-ValueTIME 4 8840.940 2210.235 113.336 <.0001Subject(Group) 40 780.063 19.502Phase 1 5.575 5.575 3.043 .0888Phase * TIME 4 7.518 1.880 1.026 .4057Phase * Subjeot(Oroup) 40 73.277 1.832
Table C.13. C V02 Placebo
DF Sum of Squares Mean Square F-Value P-ValueTIME 2 3543.328 1771.664 75.492 <■0001Subject(Group) 24 563.234 23.468Phase 1 22.401 22.401 4.383 .0471Phase * TIME 2 7.317 3.659 .716 .4989Phase * Subjeot(Group) 24 122.670 5.111
Table C.14. D V 02 Creatine
DF Sum of Squares Mean Square F-Value P-ValueTIME 11 22097.393 2008.854 20.794 <.0001Subject(Group) 96 9274.090 96.605Phase 1 114.990 114.990 53.744 <.0001Phase * TIME 11 19.239 1.749 .817 .6227Phase * Subjeot(Group) 96 205.401 2.140
Table C.15. D V 02 Placebo
DF Sum of Squares Mean Square F-Value P-ValueTIME 11 14420.758 1310.978 69.644 <.0001Subject(Group) 96 1807.111 18.824Phase 1 9.209 9.209 1.450 .2315Phase * TIME 11 24.543 2.231 .351 .9710Phase * Subject(Group) 96 609.638 6.350
Table C.16. C reatine Time to Exhaustion
DF Sum of Squares Mean Square F-Value P-ValueTEST 3 388083.819 129361.273 54.906 <.0001Subjeot(Group) 32 75393.556 2356.049Phase 1 114321.681 114321.681 203.578 <.0001Phase * TEST 3 61580.819 20526.940 36.553 <.0001Phase * Subject(Group) 32 17970.000 561.563
82
Table C.17. Placebo Time to Exhaustion
DF Sum of Squares Mean Square F-Value P-ValueTEST 3 160108.556 53369.519 35.570 <.0001Subjeot(Group) 32 48012.889 1500.403Phase 1 272.222 272.222 2.353 .1348Phase * TEST 3 215.222 71.741 .620 .6071Phase * Subjeot(Group) 32 3701.556 115.674
Table C.18. C reatine Time to Exhaustion Gain
DF Sum of Squares Mean Square F-Value P-ValueTEST 3 123161.639 41053.880 36.553 <.0001Residual 32 35940.000 1123.125
APPENDIX D: RAW DATATable D.1. Time To Exhaustion DataNUMBER GROUP PHASE TEST GBOER TIME1 C 1 A F 6 51 c 1 B F 1161 c 1 C F 1201 c 1 D F 1401 c 2 A F 1031 c 2 B F 2201 c 2 C F 2401 c 2 D F 2802 p 1 A M 352 p 1 B M 902 p 1 C M 1002 p 1 D M 1502 p 2 A M 412 p 2 B M 902 p 2 C M 802 p 2 D M 1603 p 1 A F 603 p 1 B F 1203 p 1 C F 2073 p 1 D F 1703 p 2 A F 523 p 2 B F 1003 p 2 C F 1603 p 2 D F 1604 c 1 A M 424 c 1 B M 604 c 1 C M 1404 c 1 D M 1504 c 2 A M 504 c 2 B M 1504 c 2 C M 2004 c 2 D M 3005 c 1 A M 52Is c 1 B M 73
(table con’d)
83
555555666666 ^
667777_7_7_7_7_8_
8_8 .8_
8_
8_
8_8_9_9_9_9_9_9_9_9.
84
M 160M 260M 45
B M 120M 182M 520M 56
B M 90M 131M 190M 52
B M 90M 140M 180M 68
B M 115M 143M 200M 61
B M 160M 300M 400
31B 90
10015047
B 14016030059
B 9014516476131180328(table con’d)
10 C 1 A M 6210 C 1 B M 8910 C 1 C M 12010 C 1 D M 14210 C 2 A M 5910 C 2 B M 10910 C 2 C M 16810 C 2 D M 29011 P 1 A M 4511 P 1 B M 11011 P 1 C M 18011 P 1 D M 25011 P 2 A M 4611 P 2 B M 9011 P 2 C M 19211 P 2 D M 24012 P 1 A 5812 P 1 B 15712 P 1 C 2001 2 P 1 D 1671 2 P 2 A 3112 P 2 B 16012 P 2 C 16012 P 2 D 18013 C 1 A M 4313 c 1 B M 10013 c 1 C M 12613 c 1 D M 1651 3 c 2 A M 6013 c 2 B M 14513 c 2 C M 25813 c 2 D M 33014 3 1 A • 4114 3 1 B • 7014 3 1 C 12014 3 1 D - 13614 3 2 A B 5214 3 2 B 85
(table con’d)
14 P 2 C F 10014 P 2 D F 13115 P 1 A F 6615 P 1 B F 12315 P 1 C F 14115 P 1 D F 16015 P 2 A F 6015 P 2 B F 13015 P 2 C F 1501 5 P 2 D F 15016 P 1 A M 3516 P 1 B M 9016 P 1 C M 1301 6 P 1 D M 2001 6 P 2 A M 3816 P 2 B M 901 6 P 2 C M 12016 P 2 D M 21017 C 1 A 3017 C 1 B 901 7 c 1 C 1001 7 c 1 D 17017 c 2 A 5717 c 2 B 15017 c 2 C F 18017 c 2 D F 3401 8 p 1 A M 4518 p 1 B M 11518 p 1 C M 12018 p 1 D M 15018 3 2 A M 3818 3 2 B M 12018 3 2 C M 1401 8 3 2 D M 150
Table D.2. V02 Data Bout A
NUMBER GROUP TIME VOa 1 VO* 2 R 1 R21 C 0 4.2 4.7 0.81 1
(table con’d)
87
1 C 30 22.4 21.1 0.76 0.921 C 45 27 26 0.92 11 C 60 29.6 33.5 1.03 1.232 P 0 5 6.1 1.05 12 P 15 15.4 18.32 1.14 1.052 P 30 25.9 22.5 1.12 1.12 P 45 34.2 1.232 P 60 43.8 1.33 P 0 7.2 7.7 0.74 0.83 P 15 21.2 22 0.84 0.893 P 30 29.1 32.1 0.9 1.013 P 45 36.7 38.1 1.04 1.233 P 60 38.2 1.244 C 0 7.7 6.4 0.874 c 15 12 13.5 0.994 c 30 19 23.2 0.984 c 45 26.1 27.4 1.125 c 0 4.5 4.2 0.8 0.915 c 1 5 1 5 16.1 0.9 15 c 30 25.7 26 1.09 1.135 c 45 29.5 30.1 1.25 1.26 p 0 7 5 0.82 0.86 p 15 25 23 0.97 16 p 30 33 32.5 1.09 1.16 p 4 5 43 45.1 1.2 1.217 c 0 6.7 9.5 0.77 0.877 c 15 17.2 16.6 0.83 0.797 c 30 21.6 23.7 0.91 0.87 c 45 33.4 33.4 1.09 0.967 c 60 38.4 38 1.22 1.38 c 0 4.6 4.2 0.86 0.958 c 15 20.1 15.2 1.07 0.98 c 30 28 21.5 1.2 1.28 c 45 29.9 1.29 c 0 8.2 7.5 0.87 19 c 15 18.6 14.6 0.9 0.99 c 30 26.2 18.4 1.09 0.969 c 45 25.7 23.5 1.3 1.1
(table con’d)
9 C 60 26.2 1.3510 C 0 11.1 8.8 0.85 0.910 C 15 21.7 13.4 0.99 0.9210 C 30 29.6 21.3 1.02 0.910 C 45 35.3 27.3 1.16 1.0610 C 60 35.8 28.1 1.3 1.2311 P 0 8.8 7 0.8 0.8211 P 15 27.6 25.4 0.9 0.9411 P 30 30.8 29.7 1.2 1.1811 P 45 44.9 46.2 1.31 1.2512 P 0 7.5 7.7 0.75 0.8512 P 15 19.2 15.5 0.87 0.8612 P 30 24.1 23.8 0.97 1.312 P 45 29 1.1313 c 0 7 7.7 0.93 0.9513 c 15 10.1 19 0.87 0.9813 c 30 24.1 31 0.94 1.0113 c 45 37.9 38.4 1.03 1.1813 c 60 43.5 1.4114 p 0 6.7 9.8 0.93 0.914 p 15 17.8 18.1 1 0.8714 p 30 26.5 24.9 1.04 0.9514 p 45 30.4 1.1615 p 0 9.1 5.3 0.97 115 p 15 17.4 6.4 1.02 1.0315 p 30 25.3 16.3 1.02 1.0715 p 45 30.8 20.5 1.16 0.8815 p 60 33.8 28.2 1.37 0.9816 p 0 7.1 6.4 0.95 0.9816 p 15 18.2 17.3 1.05 1.116 p 30 23.4 24 1.15 1.217 c 0 7.5 6.1 0.7 0.9217 c 15 20 19.3 0.7 0.9917 c 30 31.8 29.5 0.95 1.117 c 45 39 1.1618 p 0 5.6 6.7 0.8 0.818 p 15 18.4 16.9 0.86 0.8818 p 30 29.4 26.5 1.02 0.9518 p 45 32.9 1.05
Table D.3. VO 2 Data Bout B
NUMBER GROUP TIME V02 1 V02 2 R 1 R21 C 0 6.3 4.7 0.86 11 C 30 20.4 16 1.04 0.981 C 120 29.6 21.1 1.18 0.921 C 210 32.5 26 1.11 11 C 286 29.6 33.5 1.2 1.231 C 390 30.1 11 C 480 30.1 0.991 C 570 30.1 0.982 P 0 7.9 6.7 1.03 1.012 P 30 33.1 34 1.07 1.042 P 120 42.5 42.9 1.06 1.072 P 210 42.2 45 1 1.083 P 0 8 8 0.71 0.783 P 30 27.6 28 0.93 0.913 P 120 30.7 31.2 1.1 1.173 P 210 36.6 37.5 1.02 1.053 P 300 37.8 38.2 0.99 1.14 c 0 6.5 6.6 0.74 0.754 c 30 25 18.5 1.08 0.884 c 120 25.3 23.8 1.09 1.014 c 210 28.4 1.074 c 300 29.7 1.054 c 390 29.8 1.085 c 0 5.6 9.8 1.18 1.045 c 30 40.2 36.5 1.19 1.035 c 120 45.5 42.3 1.22 1.075 c 195 54.2 48.3 1.24 1.155 c 300 52.1 1.216 p 0 6.5 5.2 0.88 0.986 p 30 25.9 26.2 1.01 1.036 p 120 33.3 34 1.05 1.056 p 210 35.3 37 0.99 1.067 c 0 5.2 7.2 0.88 0.89
7 c 30 30.6 27.9 1.06 0.86(table con’d)
7 C 120 36.5 34.9 1.2 1.087 C 210 41.2 40.8 1.17 1.117 C 295 42.3 42.6 1.22 1.27 C 390 45.9 1.187 C 480 35.7 1.218 C 0 6.9 6.7 0.94 0.78 C 30 25.8 25 1.02 0.978 C 120 33 32.1 1.15 1.048 C 210 35.6 34 1.08 1.028 C 300 39.3 1.048 C 390 34.6 1.089 C 0 9.1 7 0.7 0.759 C 30 21.4 15.3 1 0.929 C 120 26.3 25.5 1.17 1.19 C 210 27.6 26 1.19 1.129 C 300 28 1.29 C 390 31 1.210 C 0 4.6 6.3 0.9 0.8910 C 30 22.6 19.6 1.07 1.0310 C 120 31.4 30 1.1 1.0310 C 210 37.4 36.9 1.09 1.0710 C 300 30.1 1.2511 P 0 9.3 6.4 0.97 11 1 P 30 30 28 1.13 1.121 1 P 120 38.2 37.9 1.15 1.1411 Ip 210 38.5 41 1.25 1.211 p 290 41 1.2312 p 0 7.1 6.5 0.78 0.8312 p 30 28 22.7 1.05 1.0612 p 120 29 29.5 1.16 1.0412 p 210 34 33.9 1.03 0.9212 p 300 36.3 36.3 0.98 0.9512 3 390 38 37.6 1.1 112 P 457 30 31 1.1 1.0313 c 0 7.8 4.7 0.91 1.1813 c 30 28.6 27.3 0.99 0.9313 c 120 38.9 37.1 1.22 1.113 c 210 44.4 42.9 1.18 1.07
(table con’d)
13 C 280 34 45.6 1.0113 C 390 46.2 1.114 P 0 5.1 6 0.93 0.914 P 30 22.1 22.4 1.02 0.9114 P 120 28.9 29.5 1.2 1.0214 P 190 27.5 30.4 1.23 1.1615 P 0 5.1 5.4 0.93 0.8615 P 30 22.1 25.5 1.02 1.0615 P 120 28.9 30.9 1.2 1.0115 P 210 26.3 34.1 1.18 115 P 300 31 35.5 1.2 0.9615 P 363 28 38.7 1.23 1.0616 P 0 7.5 5.3 1.04 0.916 P 30 22.9 25 0.88 1.116 P 120 30.7 32 0.96 1.216 P 210 34.9 38.4 0.91 1.1817 C 0 6.4 7.2 0.88 0.8517 c 30 31 30 1.14 1.0817 c 120 38.2 36.2 1.14 1.1717 c 210 39.4 38 1.2 1.21 7 c 300 43 1.231 7 c 390 42.8 1.2818 p 0 5.6 6.5 0.8 0.918 p 30 18.4 17.5 0.86 0.841 8 p 120 29.4 27.8 1.02 1.0418 p 210 32.9 27.5 1.05 1.0818 p 295 3 6 35 1.2 1.12
Table D.4. V02 Data Bout C
NUMBER GROUP TIME V02 1 V02 2 R2 R 11 C 0 5.9 6.5 0.88 0.91 c 20 17.9 14.7 0.91 0.981 c 80 23.6 21.3 0.89 1.151 c 140 24.6 23.1 0.92 1.181 c 200 27.8 25.6 0.98 1.181 c 260 27.5 27.5 1.05 1.151 c 320 29 28 1.1 1.2
(table con’d)
1 C 380 27.8 1.151 C 440 28.1 1.21 C 500 29.2 1.181 C 560 28.7 1.241 C 620 28.3 1.171 C 680 29 1.22 P 0 6 5.5 1 1.12 P 20 25.7 26 1.07 1.062 P 80 34.2 33.2 1.1 0.982 P 140 36.9 37 1.09 1.112 P 200 37.4 39.2 1.1 0.992 P 260 41.2 1.143 P 0 5.5 5.1 0.95 0.793 P 20 22.7 24.1 0.98 0.983 P 80 30.4 29.5 1.19 1.083 P 140 31.9 31.2 1.16 1.123 P 200 33.2 31.2 1.15 1.043 P 260 33.5 34.2 12 1.13 P 320 34.6 34 1.18 1.153 P 380 38.1 38 1.23 1.23 P 440 39.1 41.2 1.3 1.143 P 500 39.3 1.233 P 560 40 1.23 P 620 35.6 1.314 C 0 5.7 7.4 0.9 0.944 c 20 19.4 19 0.96 0.964 c 80 24.3 23 0.95 1.14 c 140 26.9 25.2 1.05 1.094 c 200 30.8 28.8 1.02 1.034 c 260 32.1 31.7 1.03 1.034 c 320 34.7 33 1.08 1.124 c 380 36 35 1.1 1.184 c 440 34 1.185 c 0 4.7 5.2 0.93 0.915 c 20 33.5 32 1.1 1.125 c 80 37.8 35 1.04 1.165 c 140 40.8 39 1.08 1.125 c 200 42.8 40.2 1.1 1.08
9 C 0 7.3 6.5 0.9 0.869 C 20 18.8 16.4 0.94 0.849 C 80 23.5 25.4 1.17 1.219 C 140 24.1 24.2 1.11 1.229 C 200 25.1 25 1.08 1.169 C 260 25.3 26.1 1.08 1.19 C 320 28 27.5 1.04 1.19 C 380 29.1 28.7 1.06 1.29 C 440 28.4 1.049 C 500 29.4 1.041 0 C 0 7 6.2 0.92 0.8610 C 20 15.9 13.6 0.95 0.8610 C 80 26.5 24.3 1 1.0710 c 140 31 29.1 1.2 1.1710 c 200 34 30.7 1.1 1.1410 c 260 35.3 32.1 1.14 1.1210 c 320 30.7 33 1.17 1.310 c 380 34.3 1.1510 c 440 31.3 1.1711 p 0 5.7 6.4 0.9 0.8711 p 20 23.9 24.3 1.12 1.131 1 p 80 33.8 34 1.14 1.161 1 p 140 34.6 34.8 1.2 1.151 1 p 200 34 36.3 1.07 1.0811 p 260 40.1 40 1.06 1.0711 p 320 40.2 39.9 1.05 1.051 1 p 380 42.7 43.1 1.04 1.0211 p 440 43.3 43.2 1.02 1.011 1 p 500 42.1 43.7 1.03 0.9612 p 0 6.7 5.2 0.83 0.8212 p 20 19.2 21.6 0.86 0.9312 p 80 26.5 28.1 1.04 1.1612 p 140 27.9 29.3 1 1.161 2 p 200 26.8 29.7 0.93 1.0712 p 260 29.5 32.7 0.94 1.021 2 p 320 31.1 32.4 0.91 1.0412 p 380 30.6 33.1 0.95 1.031 2 p 440 33.2 33.6 0.93 1
(table con’d)
12 P 500 32.9 0.9912 P 560 33.3 0.9813 C 0 7.6 7.7 0.82 1.0313 C 20 24.7 18 0.84 1.0513 c 80 34.8 32.4 1.06 1.1713 c 140 37.1 35.3 1.08 1.2513 c 200 40.2 38.3 1.07 1.1813 c 260 43 39.6 1.05 1.1213 c 320 42.8 43.8 0.98 1.0813 c 380 44.8 1.0213 c 440 46.7 0.9813 c 500 46.8 0.9713 c 560 48.1 0.9813 c 620 49.2 0.9713 c 680 49 0.9614 p 0 6.2 6.2 0.8 0.8314 p 20 19.6 12.2 0.85 0.9114 p 80 26.8 25.5 0.96 1.2814 p 140 30.1 33.1 1.17 1.2914 p 200 31.6 35.1 1.15 1.2614 p 260 32.6 36.6 1.14 1.1914 p 320 33 1.1315 p 0 5.4 5.4 0.86 0.9415 p 20 21.1 22 0.96 115 p 80 25.3 24.5 1.1 1.1315 p 140 26.9 27 1.2 1.1515 p 200 27.1 26.8 1.12 1.0415 .... p. 260 27.8 28 1.04 115 p 320 28.5 28.9 1 0.9715 p 380 29 30 1.1 1.1616 p 0 5.5 6.7 0.9 116 p 20 21 22 0.99 1.0216 p 80 27.8 27.9 1.02 1.1216 p 140 29.2 30.2 1.1 1.216 p 200 32.2 32.5 1.05 1.0116 p 260 33.9 34 1.04 0.9816 p 320 37 36.3 1.12 1.0817 c 0 7.6 6.7 0.82 0.78
(table con’d)
1 7 C 20 1 1 12.1 1.05 1.0417 C 80 29.5 26.7 1 0.9517 C 140 34.5 32.4 1.09 1.317 C 200 39.4 38.1 1.1 1.241 7 C 260 39 39 1.13 1.151 7 C 320 40.1 0.9817 C 380 41 1.217 C 440 41.1 1.1817 C 500 40.2 1.1318 P 0 6.8 6.5 0.86 0.7818 P 20 16.2 15.9 1 0.7618 P 80 26.6 27.4 1.07 1.0318 P 140 31.2 29.9 1.1 1.1518 P 200 34.6 35.6 1.2 1.2318 P 260 36 37 1.12 1.1418 P 320 37.2 37.9 1.08 1.09
Table D.5. VO 2 Data Bout DNUMBER GROUP TIME V02 1 V02 2 R 1 R21 C 0 6.1 6.5 0.81 0.861 c 1 5 13.2 14.7 0.86 0.981 c 45 20.2 19.3 0.9 0.971 c 75 24.1 22.1 0.99 0.961 c 105 26 25.5 1.05 0.981 c 135 26.5 26 1.12 0.931 c 165 27.1 27 1.07 0.941 c 195 28.1 27.8 1.08 0.971 c 225 29.8 28.5 1.12 0.921 c 255 28.7 29.2 1.12 0.941 c 285 30.4 29 1.13 0.981 c 315 30.6 30 1.09 0.971 c 345 31.7 31 1.05 0.861 c 375 33.4 32.8 1.07 0.931 c 405 34 33.7 1.05 0.991 c 435 34.5 0.921 c 465 35.7 0.981 c 495 35.3 I0.97
(table con'd)
97
1 C 525 35.1 0.941 C 555 35.4 0.921 C 585 34.6 0.982 P 0 6.5 12.2 1.17 0.732 P 15 11 26.5 0.89 0.912 P 45 25.6 29.2 1 0.912 P 75 31.4 31.9 1.08 1.012 P 105 34.3 30.5 1.12 0.982 P 135 35.6 33.4 1.08 0.942 P 165 37.1 32 1.04 0.982 P 195 36.4 34.5 1.08 12 P 225 38.9 31.2 1.06 0.952 P 255 38.4 30.7 0.96 0.972 P 285 39.8 29.4 0.93 0.992 P 315 38.9 33.1 0.99 0.942 P 345 43.5 36.9 0.94 0.922 P 375 40.8 39.1 0.96 0.962 P 405 40.7 37.4 0.99 0.922 P 435 43.8 41.7 0.99 1.013 P 0 14.1 16.9 0.67 0.843 P 15 27 23.1 0.82 0.83 P 45 29.7 27.2 0.96 0.793 P 75 30.7 29.6 1.01 0.823 P 105 32.7 31 1.04 1.043 P 135 33.4 32.4 1.05 1.043 P 165 34.2 32 1.03 1.053 P 195 35 34.2 1.04 1.043 P 225 35.4 29.4 1 0.983 P 255 37.3 34.7 1 1.053 P 285 36.5 34.7 1.02 1.013 P 315 38.6 37.8 1.02 0.953 P 345 38.6 39.9 1 1.063 P 375 38.5 38.7 1.01 0.953 P 405 39.1 38.9 1 13 P 435 38.8 39.7 1 1.023 P 465 37.4 37.8 1 13 P 495 38 14 C 0 8.5 7.5 0.92 0.9
(table con’d)
4 C 15 14.5 13.5 0.98 0.964 C 45 18.5 19.2 1.06 0.994 C 75 23.6 24.3 1.09 14 C 105 28.6 27.9 1.08 14 C 135 29.4 31 1.06 0.984 C 165 32.4 33.1 1.109 1.024 C 195 32 34 1.06 14 C 225 33.8 33.9 1.06 14 C 255 33.6 34 1.09 0.994 C 285 35 34.7 1.06 1.054 C 315 34.8 35 1.08 14 C 345 34.4 34.9 1.06 0.994 C 375 35 35 1.1 1.044 C 405 34.5 35 1.04 14 C 435 37 37 1.04 0.984 C 465 37 14 C 495 36.9 1.014 C 525 35 14 C 555 37.2 14 C 585 36.8 1.074 C 680 37.2 1.025 C 0 5.6 5.1 0.97 0.915 C 15 25 20.4 1.11 0.935 C 45 31.3 36.9 1.21 0.995 C 75 39.7 37.9 1.23 1.25 c 105 45 44 1.25 1.125 c 135 46.4 46.1 1.27 1.085 c 165 46.3 42 1.26 1.165 c 195 51.6 49.7 1.17 1.155 c 225 53 52.2 1.22 1.185 c 255 53.6 51.3 1.19 1.075 c 285 56.3 56 1.17 1.035 c 315 53.1 53 1.19 0.975 c 345 56.3 55.5 1.15 1.195 c 375 55.6 55 1.14 0.915 c 405 60.9 60.7 1.1 1.085 c 435 57 56.9 1.13 1.045 c 465 57.7 50.3 1.09 1.02
(table con’d)
99
5 C 495 61.4 58.3 1.08 15 C 525 64.2 60.7 1.06 0.985 c 555 62.7 62 1.02 15 c 585 67.5 64 1.02 0.936 p 0 6.8 10.4 0.86 1.076 p 15 13.7 17.2 0.78 0.766 p 45 26.1 23.3 0.85 0.816 p 75 30.6 34.8 0.97 0.816 p 105 35.3 37.8 1.01 0.96 p 135 34.9 36.8 1.08 16 p 165 37.7 38 1.08 1.046 p 195 35.9 37 1.12 1.046 p 225 35.1 39.1 1.08 1.036 p 255 35.9 39.3 1.03 1.016 p 285 37.5 38.2 1 1.026 p 315 38.4 39 1 16 p 345 37.3 38.2 1.04 1.036 p 375 39.1 38.23 0.98 1.056 p 405 39.2 39 0.98 1.026 p 435 37.4 40 0.97 16 p 465 34.1 38.9 0.95 0.976 p 495 34.7 39.2 0.96 0.946 p 525 35.9 38.9 0.95 0.926 p 555 38 0.967 c 0 8.5 6.8 0.89 0.887 c 15 19.7 21.1 0.9 0.787 c 45 31.6 26.1 1.02 0.847 c 75 36.3 30.6 1.09 0.927 c 105 38 33.5 1.21 0.977 c 135 40.1 33.8 1.29 0.997 c 165 39.1 35.5 1.29 1.037 c 195 38.8 34.7 1.31 1.047 c 225 40.3 37.4 1.27 1.037 c 255 41.9 41.9 1.23 1.057 c 285 42.2 42 1.19 1.067 c 315 45.3 43 1.16 1.067 c 345 44.8 43.8 1.12 1.057 c 375 44.9 42.5 1.11 1.04
(table con’d)
100
7 C 405 46.3 43.1 1.06 1.047 C 435 46.2 43.1 1.08 1.027 C 465 46.5 42.1 1.02 0.977 C 495 47.5 41.7 1.03 0.987 C 525 45.5 43.5 1.03 17 C 555 45 40.6 1.01 0.977 C 585 48.2 45.8 1 0.998 C 0 5.8 5.8 0.86 0.788 C 15 16.9 15.8 0.86 0.828 C 45 27.2 28.2 0.89 0.848 C 75 33.6 29.3 1.04 0.938 C 105 34.9 32.3 1.08 0.998 C 135 37.6 34.9 1.15 1.038 C 165 38.9 35.3 1.17 1.038 C 195 39.7 37.9 1.21 1.068 C 225 40.9 37.7 1.21 1.058 C 255 41.1 38 1.17 1.048 C 285 43.8 40.5 1.13 1.048 C 315 42.5 41.8 1.17 1.048 C 345 43 41.6 1.12 1.048 C 375 43.8 41.9 1.1 1.048 C 405 44 41.4 1.12 1.038 C 435 43.9 43.3 1.1 1.048 C 465 42.7 1.028 C 495 43 1.018 C 525 42.7 18 C 555 44.5 1.018 c 585 42.8 0.979 c 0 5.3 5.1 0.98 1.019 c 15 14 14.1 0.83 0.929 c 45 18.9 18.6 0.87 0.839 c 75 25 22 1.02 0.869 c 105 21.8 24 1.14 0.989 c 135 28.2 24.7 1.21 19 c 165 28.1 24.2 1.2 1.059 c 195 28 26.6 1.23 1.049 c 225 28.8 27.3 1.21 1.06
(table con’d)
101
9 C 255 29.7 24.9 1.23 1.069 c 285 30.2 28.3 1.2 1.069 c 315 31.2 26.9 1.2 1.039 c 345 30 28.3 1.17 1.029 c 375 30.2 27.7 1.15 0.999 c 405 31.8 27.4 1.11 0.999 c 435 30.5 28.7 1.13 19 c 465 31 27.7 1.13 1.029 c 495 28.7 1.029 c 525 27.4 1.019 c 555 27.4 0.989 c 585 28 0.9610 c 0 5.4 5.8 0.91 0.810 c 15 18.3 11.5 0.87 1.0310 c 45 25.7 21.6 0.95 0.881 0 c 75 29.7 26.6 1.03 0.9510 c 105 30.7 30.6 1.14 0.9710 c 135 33.5 32.8 1.11 1.0510 c 165 36.4 33.7 1.16 1.0210 c 195 38.2 37.7 1.14 1.0710 c 225 40.2 37.6 1.14 1.0510 c 255 41.1 39.1 1.09 1.0410 c 285 39.8 37.3 1.07 1.0110 c 315 43.7 39.7 1.03 1.0410 c 345 44.9 40.7 1.04 1.0310 c 375 45.6 41.3 1.03 1.0310 c 405 46 42 1.03 1.0110 c 435 36.7 1.0210 c 465 43.8 1.0110 c 495 44.2 1.0210 c 525 41.7 0.9910 c 555 44.6 110 c 585 43.3 111 p 0 5.7 6.3 0.85 0.911 p 15 18.3 19.4 0.95 0.9811 p 45 25.6 24.9 0.98 0.9911 p 75 26.7 27.2 1.09 0.9511 p 105 28.2 29.3 1.09 1.111 p 135 29 30.1 1.1 1.12
(table con’d)
102
11 P 165 29.5 30.9 1.12 1.1511 P 195 32 32 1.14 1.211 P 225 35 34.5 1.15 1.1811 P 255 35.6 36 1.09 1.1611 P 285 37 36.9 1.1 1.1311 P 315 37.4 38.2 1.09 1.0411 P 345 36.9 37 1.08 1.0311 P 375 38.1 39.2 1.07 1.0411 P 405 38.8 39.3 1.05 1.0111 P 435 39 40 1.06 111 P 465 39 41 1.04 111 P 495 38.9 41.8 1.02 111 P 525 39.4 42 1.01 0.9211 P 555 40 42.3 1.05 0.9911 P 585 38.9 42.9 1 0.9612 P 0 6.5 4.1 0.82 0.951 2 P 15 8.7 9.9 0.93 0.8612 P 45 18.5 17.1 0.96 0.8812 P 75 23.7 23.5 1.05 0.991 2 P 105 27 27.8 1.11 0.9612 P 135 28.2 29.3 1.13 0.9712 P 165 29.1 30.6 1.12 0.981 2 P 195 30 32 1.08 112 P 225 30.8 31.8 1.08 0.9912 P 255 31.5 31.4 1.08 1.0212 P 285 32.4 31.1 1.03 1.0212 P 315 32.9 33.5 1.01 1.0212 P 345 35 1.0212 P 375 34.1 1.0112 P 405 29.7 1.0313 C 0 6.9 7.5 0.9 0.9613 C 15 17.9 18.3 0.92 0.913 c 45 31.5 30.6 1.06 0.8813 c 75 38 35.7 1.11 113 c 105 43 39.6 1.27 113 c 135 42.8 43.1 1.27 1.041 3 c 165 43.3 43.1 1.25 1.0313 c 195 44.8 44.5 1.23 1.01
(table con’d)
103
13 C 225 45.3 46.4 1.2 1.0113 C 255 45.3 46.2 1.13 0.9713 C 285 49.4 46.8 1.09 0.9813 C 315 46.9 48.7 1.06 0.9913 C 345 47.4 46.4 1.06 0.9513 C 375 48.3 46.8 1.06 0.971 3 C 405 45 0.9613 C 435 46.9 0.9613 C 465 46.6 0.9513 C 495 46.7 0.9213 C 525 49.9 0.913 C 555 46.6 0.921 3 C 585 49.5 0.921 4 P 0 6 4.8 0.83 0.7914 P 15 11.7 12.2 0.91 0.8514 P 45 17.7 25.5 0.87 0.9614 P 75 25 30 0.99 1.0514 P 105 28.1 33.1 1.09 1.1714 P 135 28.6 34.3 1.19 1.1514 P 165 28.8 35.1 1.23 1.1514 P 195 28.9 34.6 1.21 1.1814 P 225 26.7 36.6 1.24 1.141 4 P 255 30.9 37.3 1.2 1.1214 P 285 31.1 38 1.17 1.1214 P 315 33.7 38.2 1.15 1.1315 P 0 4.7 5.2 0.98 0.8615 P 15 12.3 13.4 0.74 0.9815 P 45 18.3 17.6 0.84 1.115 P 75 25.2 24.5 1.05 1.1215 P 105 28.4 29 1.1 1.1115 P 135 29.3 30.3 1.12 1.0915 P 165 30.9 30.9 1.14 1.0615 P 195 31.3 32 1.14 1.0315 P 225 31.7 32 1.14 1.0215 P 255 30 32.4 1.1 1.0315 P 285 30.2 33 1.07 1.0815 P 315 31.1 32.5 1.04 115 P 345 28.4 33.1 1.01 0.98
(table con’d)
104
15 P 375 29 34 1.01 0.915 P 405 29.9 34.2 1 115 P 435 30.1 31 0.99 1.0915 P 465 31 0.9916 P 0 6.7 7.7 1 0.916 P 15 18.9 17.8 1.06 0.9916 P 45 22.3 20.5 1.05 1.0416 P 75 25.6 22.5 1.03 1.0516 P 105 27.8 25.6 1.02 1.0916 P 135 28 27.2 1.09 1.116 P 165 28 27.9 1.1 1.1216 P 195 29.8 28 1.12 1.141 6 P 225 32.4 30 1.15 1.1116 P 255 33 30.9 1.03 1.0416 P 285 34.5 32.5 1.01 1.0516 P 315 35 34 1 1.041 6 P 345 35.9 35 0.99 116 P 375 36 36 0.98 0.9916 P 405 35 36 1 0.9916 P 435 36.7 37.2 1.02 0.9416 P 465 37 37.3 1 0.9316 P 495 36.6 37 1 0.9216 P 525 37 38 0.89 0.916 P 555 36.3 38.4 0.98 0.8916 P 585 38 37.8 0.92 0.9917 C 0 8.6 7.6 1.1 0.917 C 15 19.9 19.3 0.8 0.871 7 c 45 36.3 34 0.89 0.9217 c 75 40.6 38 1.01 0.91 7 c 105 41.7 40.3 1.06 0.9217 c 135 43.7 40.2 1.06 0.9117 c 165 42.7 41 1.04 0.9517 c 195 44.4 43.1 1.04 0.9317 c 225 45.2 42.7 1.03 0.917 c 255 44 43 1.05 0.9217 c 285 46.7 43.4 1 0.9217 c 315 50.7 45 0.99 0.9217 c 345 50.6 46 1.03 0.9
(table con’d)
105
17 C 375 49 45.4 1.03 0.9117 C 405 46.2 44 1.04 0.951 7 C 435 46.1 45.7 0.99 0.9617 C 465 46.2 46 0.99 0.9317 C 495 46.9 46 0.99 0.921 7 C 525 47.2 0.9517 C 555 46.3 0.9217 C 585 44 0.9418 P 0 5.5 6.7 0.89 0.8318 P 15 15.1 15.3 0.76 0.991 8 P 45 26.6 25.6 0.84 0.9818 P 75 27 26.7 0.92 118 P 105 27.6 27 1.01 118 P 135 28 28.4 1.09 118 P 165 29.2 29.3 1.08 1.081 8 P 195 31.3 31.4 1.1 1.0418 P 225 34.6 33.9 1.12 1.0518 P 255 36.3 36.1 1.13 1.0318 P 285 36.9 36.9 1.12 1.0218 P 315 37.1 37.4 1.08 1.091 8 P 345 36.1 38.5 1.06 1.0418 P 375 37 37.4 1.09 1.051 8 P 405 37 |38 1.05 1.05
Table D.6. Lactate Data Bout A
NUMBER GROUP DRAW# LACTATE 1 LACTATE 21 C 1 2 1.41 C 2 7.5 5.71 C 3 9.6 7.61 C 4 12.2 8.72 P 1 1.5 22 P 2 6.7 7.82 P 3 9.2 10.22 P 4 11.9 133 P 1 1.1 1.33 P 2 9.1 7.93 P 3 10.5 9.9
(table con’d)
3 P 4 13.1 12.54 C 1 3.1 2.34 C 2 8.3 6.74 C 3 9.2 7.24 C 4 13.3 8.15 C 1 2 1.95 C 2 5.6 5.25 C 3 8.2 6.45 C 4 9.6 7.16 P 1 1.5 2.16 P 2 5.9 5.56 P 3 8 7.86 P 4 11.9 10.27 C 1 2.1 1.27 C 2 6.7 4.27 C 3 8.3 6.57 C 4 12.6 8.58 C 1 1.8 2.38 C 2 8 68 C 3 10.1 5.98 C 4 14.1 99 C 1 1.5 1.29 c 2 5.6 5.69 c 3 10.1 7.29 c 4 13.2 8.810 c 1 2.1 210 c 2 6.2 71 0 c 3 9.1 7.710 c 4 12.1 8.411 p 1 2.3 1.811 p 2 5.9 61 1 p 3 8.4 8.51 1 p 4 11.9 1212 p 1 1.9 31 2 3 2 7.2 6.912 3 3 10 9.812 p 4 14.1 14.213 c 1 2.1 1.5
(table con’d)
13 C 2 _ 8 813 C 3 11.4 9.21 3 C 4 13.2 1014 P 1 1.1 214 P 2 6.7 714 P 3 9.9 10.114 P 4 12.2 11.915 P 1 3 2.115 P 2 8.9 91 5 P 3 12.1 11.915 P 4 14.7 13.916 P 1 1.8 1.616 P 2 5.7 7.816 P 3 8.7 8.916 P 4 12.2 1317 C 1 2 2.21 7 c 2 7.9 6.717 c 3 10.4 7.417 c 4 13.2 8.918 p 1 1.6 1.418 p 2 7.3 7.818 p 3 11.1 10.818 P |4 14 14.1
Table D.7. Lactate Data Bout B
NUMBER GROUP DRAW# LACTATE 1 LACTATE 21 C 2 9.9 81 C 1 1.2 1.41 C 4 16 14.71 C 3 11 9.92 P 3 10.4 9.82 P 4 14.5 13.92 P 1 1.8 1.82 P 2 8.7 93 P 3 10.9 113 P 4 17.1 17.23 P 1 3.2 2.2
(table con’d)
3 P 2 9.9 9.54 C 3 12.2 11.54 C 4 15.2 14.54 C 1 2.1 24 C 2 9.3 8.15 C 2 8.5 7.35 C 1 1.3 2.25 C 4 13.2 13.55 C 3 12.1 106 P 3 1 3 136 P 4 14.2 146 P 1 2.2 2.36 P 2 8.4 97 c 3 13.2 137 c 4 15.6 13.27 c 1 1.1 1.97 c 2 10 9.18 c 3 14.1 13.58 c 4 16.7 148 c 1 1.5 2.28 c 2 12.5 10.89 c 3 12.9 11.89 c 4 15 149 c 1 2.4 1.89 c 2 10.1 8.910 c 2 9.3 8.510 c 1 1.1 1.410 c 4 15.1 14.31 0 c 3 13.9 12.911 p 3 13.9 13.711 p 4 16 17.21 1 p 1 1.9 1.31 1 p 2 7.9 8.112 p 2 9.3 8.912 p 1 2 2.112 3 4 17.2 1712 3 3 12.8 1313 c 3 14 13.4
(table con’d)
109
13 C 4 15.1 14.213 C 1 1.1 1.413 C 2 11.1 9.914 P 3 12 11.614 P 4 14.2 1 514 P 1 1.3 1.214 P 2 9.3 9.915 P 3 15.1 1615 P 4 18.1 17.615 P 1 1.8 2.215 P 2 9.8 9.916 P 2 7.9 816 P 1 2.3 1.916 P 4 15.1 14.716 P 3 13.1 13.617 C 3 14.6 141 7 c 4 15 1 417 c 1 IZ2 217 c 2 10.3 918 p 2 9.5 9.618 p 1 1.7 1.318 p s 14 1618 p 3 14.2 14
Table D.8. Lactate Data Bout C
NUMBER GROUP DRAW# LACTATE 1 LACTATE 21 C 1 1.5 1.21 C 2 7.8 7.21 C 3 10.5 10.11 C 4 15.1 13.92 P 1 2.3 2.12 P 2 7 7.42 P 3 9.2 9.82 P 4 13.4 13.53 P 1 2.2 23 P 2 9.7 9.53 P 3 10.5 10.3
(table con’d)
110
3 P 4 16 17.24 C 1 1.2 1.44 C 2 8.8 7.94 C 3 11.2 10.34 C 4 14.2 13.15 C 1 1.8 1.45 C 2 7.2 75 C 3 10.5 9.85 C 4 11.5 11.26 P 1 2 1.96 P 2 7.4 7.36 P 3 10 9.86 P 4 13.4 13.17 C 1 1.7 2.17 C 2 8.9 87 C 3 12.1 11.27 C 4 14.5 12.88 C 1 2.5 38 C 2 10 9.58 C 3 13.1 12.18 C 4 15.9 14.29 C 1 3 1.59 C 2 8.1 7.99 C 3 11.8 10.19 C 4 14.6 1310 C 1 1.4 2.310 C 2 9 8.510 C 3 12.9 1210 C 4 13.8 13.111 P 1 2.2 2.111 P 2 7.2 7.311 P 3 11.5 11.511 P 4 13.9 1412 P 1 2 1.312 3 2 8 7.812 3 3 11.4 11.112 3 4 15.7 15.313 c 1 1 1.7
(table con’d)
111
13 C 2 9.6 9.113 C 3 12.2 11.713 c 4 14.6 13.614 p 1 1.1 1.114 p 2 8.5 914 p 3 10.9 1 114 p 4 13.2 14.215 p 1 1.6 3.115 p 2 9 8.415 p 3 13.5 12.915 p 4 15.6 15.916 p 1 3 2.116 p 2 7 6.816 p 3 12.2 121 6 p 4 14.1 1517 c 1 2.1 2.117 c 2 9.9 9.117 c 3 12.1 1 11 7 c 4 14 13.418 p 1 1.8 1.21 8 p 2 10 9.518 p 3 15.1 13.918 p 4 16.8 15.7
Table D.9. Lactate Data Bout D
NUMBER GROUP DRAW# LACTATE 1 LACTATE 21 C 1 2 1.41 C 2 7.5 5.71 C 3 9.6 7.61 C 4 12.2 8.72 P 1 1.5 22 P 2 6.7 7.82 P 3 9.2 10.22 P 4 11.9 133 P 1 1.1 1.33 P 2 9.1 7.93 P 3 10.5 9.9
(table con'd)
112
3 P 4 13.1 12.54 C 1 3.1 2.34 C 2 8.3 6.74 C 3 9.2 7.24 C 4 13.3 8.15 C 1 2 1.95 C 2 5.6 5.25 C 3 8.2 6.45 C 4 9.6 7.16 P 1 1.5 2.16 P 2 5.9 5.56 P 3 8 7.86 P 4 11.9 10.27 C 1 2.1 1.27 C 2 6.7 4.27 C 3 8.3 6.57 C 4 12.6 8.58 C 1 1.8 2.38 C 2 8 68 C 3 10.1 5.98 C 4 14.1 99 c 1 1.5 1.29 c 2 5.6 5.69 c 3 10.1 7.29 c 4 13.2 8.810 c 1 2.1 210 c 2 6.2 710 c 3 9.1 7.710 c 4 12.1 8.411 p 1 2.3 1.81 1 p 2 5.9 611 p 3 8.4 8.51 1 p 4 11.9 121 2 p 1 1.9 312 3 2 7.2 6.912 3 3 10 9.812 3 4 14.1 14.213 c 1 2.1 1.5
(table con’d)
113
13 C 2 8 813 C 3 11.4 9.213 C 4 13.2 1 014 P 1 1.1 214 P 2 6.7 714 P 3 9.9 10.114 P 4 12.2 11.915 P 1 3 2.115 P 2 8.9 915 P 3 12.1 11.915 P 4 14.7 13.916 P 1 1.8 1.616 P 2 5.7 7.816 P 3 8.7 8.916 P 4 12.2 1317 C 1 2 2.217 c 2 7.9 6.717 c 3 10.4 7.41 7 c 4 13.2 8.918 p 1 1.6 1.418 p 2 7.3 7.818 p 3 11.1 10.818 p 4 14 14.1
Michael Cory Prevost was born on August 7, 1967 in
Opelousas, Louisiana. He graduated from Opelousas Senior
High School in 1985. He then enrolled at the University of
Southwestern Louisiana to pursue a B.S. in psychology. During
his years at USL he vigorously pursued a bodybuilding
program, adding 60 pounds of muscle to his physique. He
began working as an instructor in local health clubs and also
trained a local handicapped powerlifting team. He graduated
with a B.A. in general studies in 1990. Due to his newfound
interest in exercise and fitness he entered the graduate
program in exercise physiology at Louisiana State University
in 1991. While at LSU he received training in exercise
physiology, biochemistry, molecular biology and radiotracer
methodology. His research efforts have focused on the control
of myosin isozyme expression in muscle. With regards to this
research he has presented abstracts at the American College
of Sports Medicine and Federation of American Societies for
Experimental Biology meetings, published a paper in the
Journal of Applied Physiology and has several papers in
review. He has plans to be married immediately after
116
117
completing degree requirements and then enter the Navy as
an aerospace physiologist.
DOCTORAL EXAMINATION AND DISSERTATION REPORT
Candidate: Mi chae l Cory P r e v o s t
Major Field: Ki nes i o l o g y
T it le of D isse rta tio n : The E f f e c t s o f C r e a t i n e S u p p l e m e n t a t i o n on T o U l W o f H K S p S t and Me t a b o l i s m Dur i ng High I n t e n s i t y I n t e r m i t t e n t E x e r c i s e