Energy Economics and Policy - ETH Zurich Keywords: Energy Efficiency, Lighting, LED, CO 2 Equivalent, US Electricity Demand The Effects of Efficient Lighting in the USA by Louis Rondeau June 2011
Transcript
Prof. Rutherford April 2011
Energy Economics and Policy - ETH Zurich
08 Fall
Keywords: Energy Efficiency, Lighting, LED, CO2 Equivalent, US Electricity Demand
The Effects of Efficient Lighting in the USA by Louis Rondeau
June 2011
Energy Economics and Policy ETH-Zurich Prof. Rutherford June 2011
Louis Rondeau 3
Table of Contents
Lists of Figures ..................................................................................................................... 4
List of Tables ........................................................................................................................ 4
Introduction ......................................................................................................................... 5 Electricity in the World ............................................................................................................. 5 Electricity in the USA .................................................................................................................. 7 Lighting in the USA ...................................................................................................................... 9 Lighting Technology Comparison ........................................................................................ 11
The models ......................................................................................................................... 14 Summary ....................................................................................................................................... 15 Assumptions ................................................................................................................................ 15 Instant Change ............................................................................................................................ 16 Only LED Replacement Policy ................................................................................................. 19
Appendix A ......................................................................................................................... 26
Appendix B ......................................................................................................................... 32
Appendix C ......................................................................................................................... 33
Appendix E ......................................................................................................................... 35
Energy Economics and Policy ETH-Zurich Prof. Rutherford June 2011
Louis Rondeau 4
Lists of Figures Figure 1 - World Electricity Production from 1990 to 2008 (TWh) ............................. 6 Figure 2 - Total Domestic Electricity Consumption in 2009 (TWh) ............................. 7 Figure 3 - US Total Electricity Consumption in TWh from 1960 to 2030 ................... 7 Figure 4 – US Average Electricity Cost per kWh from 1960 - 2030 .............................. 8 Figure 5 - 2009 US Electricity Generation by Source .......................................................... 8 Figure 6 - US Lighting Consumption by Sector in 2001 ................................................... 10 Figure 7 - US Lighting Consumption by Type of Fixture ................................................. 10 Figure 9 - CFL Lamp (source: seco.cpa.state.tx.us) ........................................................... 12 Figure 8 - Incandescent Lamps (source: geconsumerproducts.com) ...................... 11 Figure 10 - HID Lamp (Source: Wikipedia) ........................................................................... 11 Figure 12 - 12.5W A19 Philips Bulb (Source: Philips) ..................................................... 13 Figure 11 - GE Outdoors LED Lighting (Source: GE Industrial Products) ............... 12 Figure 13 – Comparison between the forecasted Electrical Consumption with
Instant Change to LED and without any Change ....................................................... 17 Figure 14 - Comparison between the forecasted Electrical Consumption Cost
with Instant Change to LED and without any Change ............................................ 17 Figure 15 - Return on Investment of Instant Switching to LED ................................... 18 Figure 16 - Decrease of Tons of CO2 Equivalent due to LED Switching first model
........................................................................................................................................................ 18 Figure 17 - Comparison between Forecasted Consumption with Progressive
Change to LED and without any Change ...................................................................... 21 Figure 18 - Comparison between Forecasted Consumption Cost with Progressive
Change to LED and without any Change ...................................................................... 21 Figure 19 - Return on Investment of Progressive Switching to LED depending of
the Life Span of other Technology .................................................................................. 22 Figure 20 – Decrease of Tons of CO2 Equivalent due to LED Switching First Model
List of Tables Table 1 - US Lighting Consumption by Sector in 2001 ....................................................... 9 Table 2 - US Lighting Consumption by Technology and Sector in 2001 .................. 10 Table 3 – Average Number of Lamps per Building and Total Consumption per
Sector in 2001 .......................................................................................................................... 11 Table 4 – Average Number of Lighting Usage per Day per Sector and Technology
........................................................................................................................................................ 11 Table 5 - Average Performance of Different Lighting Technologies .......................... 13 Table 6 - Embodied C02 per Single Lamp .............................................................................. 14 Table 7 - Percentage of each Technology on the US Market depending of the Year
........................................................................................................................................................ 20 Table 8 - Power in Watts for each Lighting Technology ................................................. 20 Table 9 - LED Investments ($) depending on the Year .................................................... 20 Table 10 - Summary of the two Models with Horizon 2012-2030 ............................. 23
Energy Economics and Policy ETH-Zurich Prof. Rutherford June 2011
Louis Rondeau 5
Introduction With a fast growing population, humans are in great need of scare resources and energy. Due to the increasing use of these resources, the ecosystem has been drastically affected, and its sustainability is compromised. The United Nation reported that as of 2004 our "global carbon footprints would require more than two planets Earth to be under the annual carbon celling" (UNDP). With an increasing awareness of the problem, world organizations and governments try to promote ways to make us live more sustainably. Energy saving has been receiving enormous attention in the past few decades. Electricity saving is also part of it and many technologies have been developed to help consumers reduce their consumption. Lighting is one the main sectors that has received great attention. Companies have invested considerable amount of money in research and development to design products that are energy efficient. Governments also try promoting efficient lighting by giving incentives to encourage people to consider energy efficient technologies. This study aims to evaluate various ways of saving electricity in the United States of America (USA or US) by improving lighting consumption. First, the situation of electricity consumption in the world will give the reader the motivation being this study. Secondly, there will be a focus on the US electricity market and its lighting sector by analyzing different users and technologies that are involved. Two models will then be proposed on a time horizon of 2012-2030: (1) instant change to light-emitting diode (LED) lighting and (2) progressive change to LED lighting depending on the life span of other technologies to be replaced. Energy savings, investments, return on investments and greenhouse gazes will be evaluated.
Energy Economics and Policy ETH-Zurich Prof. Rutherford June 2011
Louis Rondeau 6
Electricity in the World
The increasing energy demand in the world, combined with the necessity of reducing greenhouse gases; represent one of the biggest challenges for humankind. With an increasing population and industrialization in most countries of the world, demand for energy has tremendously augmented. As it is also the case for electricity, demand has increased in the last years and will keep on doing so for the next many years. As figure 1 shows, the electricity demand has grown significantly in the last decade. From 1990 to 2008, the production of electricity changed from 11,865 TWh to 20,201 TWh (International Energy Agengy, 2009).
Figure 1 - World Electricity Production from 1990 to 2008 (TWh)
Utilization of renewable energies that produce less CO2 is one way of reducing consumption, e.g.: Wind and solar energy. Another approach is to reduce consumption at the source by improving energy efficiency and having sustainable energy policies. For example, Australia banned in 2007 the sales of incandescent light bulbs because they were not energy efficient compared to other lighting technologies (BBC, 2007).
The global electricity consumption in 2009 did not follow a normal pattern compared to previous years. It was cut down by 1.5% in 2009 (Enerdata, 2010) due to the global financial distress. It was the first time since WWII. This reduction is also reflected in the US annual consumption. Asia and Middle East were the only exception with a rising consumption due their booming economies.
As for the largest electricity consumers, figure 2 shows that the US is ranked first
followed closely by China with respectively 3'747 TWh and 3'149 TWh in 2009
(Enerdata, 2010).
0.0
5000.0
10000.0
15000.0
20000.0
25000.0
1990 1995 2000 2005
Wo
rld
Co
nsu
mp
tio
n T
Wh
Year
Energy Economics and Policy ETH-Zurich Prof. Rutherford June 2011
Louis Rondeau 7
Figure 2 - Total Domestic Electricity Consumption in 2009 (TWh)
Electricity in the USA Being one of the world's highest developed countries with more than 307'006'550 inhabitant as of July 2009 (U.S. Census Bureau, 2009), the U.S. has always been in great need of electricity. Figure 3 shows real US consumption data from 1960 to 2009 (EIA, 2009) and US forecasted data from 2010 to 2030 (EIA, 2009).
Figure 3 - US Total Electricity Consumption in TWh from 1960 to 2030
Energy Economics and Policy ETH-Zurich Prof. Rutherford June 2011
Louis Rondeau 8
Figure 4 shows real average US electricity cost in ¢/kWh from 1960 to 2009 (EIA, 2009) and forecasted from 2010 to 2030 (EIA, 2009).
Figure 4 – US Average Electricity Cost per kWh from 1960 - 2030
Figure 5 shows the US electricity generation by source as of 2009. We can see that coal, natural gas and nuclear are the biggest producers with respectively 44.9%, 23.4% and 20.3%. Renewables including hydroelectricity only count for 10.5% of the total production.
Figure 5 - 2009 US Electricity Generation by Source
0
1
2
3
4
5
6
7
8
9
10
11
19
60
19
64
19
68
19
72
19
76
19
80
19
84
19
88
19
92
19
96
20
00
20
04
20
08
20
12
20
16
20
20
20
24
20
28
¢/k
Wh
Year
6.9%
20.3%
23.4%
44.9%
1.0% 3.6%
Hydroelectricity
Nuclear
Natural Gas
Coal
Petroleum
Other Renewables
Energy Economics and Policy ETH-Zurich Prof. Rutherford June 2011
Louis Rondeau 9
Greenhouse Gas Equivalencies are nowadays used to quantify the sustainability of projects. In this paper, the emission calculator of the US Environmental Protection Agency is used as a reference. Data used to calculate the reference comes from the "Emissions & Generation Resource Integrated Database (eGRID)". The emission factor is the following: 6.91 x 10⁻⁴ metric tons CO2 / kWh Notes:
- Line losses are not included in the calculation. - Only CO2 is included in the calculation. No other greenhouses gases are
included. - See Appendix B for more details on the calculation.
Lighting in the USA Table 1 and figure 6 (Navigant Consulting, 2002) show the estimation of the total US electrical lighting consumption by sector in 2001. The total consumption is 765 TWh in 2001. If we compare this number with the total electricity consumption in the US in 2001 (3,631.65 TWh), lighting is roughly 21% of the US total consumption. If we look at different sectors, we see that commercial buildings account for the largest lighting consumption with 51%, followed by residential with 27%, industrial with 14% and outdoor stationary with 8%. Thus, residential and commercial consumers account for more than 78% of the total lighting consumption.
Table 1 - US Lighting Consumption by Sector in 2001
Sector
Electricity Use per Building
Number of Buildings
Site Energy
(TWh/yr) Percent of Total
Residential 1,946 106989000 208 27%
Commercial 83933 4657000 391 51%
Industrial 475063 227000 108 14%
Outdoor Stationary n/a n/a 58 8%
Total 765 100%
Energy Economics and Policy ETH-Zurich Prof. Rutherford June 2011
Louis Rondeau 10
Figure 6 - US Lighting Consumption by Sector in 2001
Table 2 and figure 7 (Navigant Consulting, 2002) provide further breakdowns by showing lighting usage by different light source technologies. As we can see, high intensity discharge lights (HID) are the primary source of outdoor stationary lighting with 87%. The industrial sector mostly uses fluorescent and HID with respectively 67% and 31%. The commercial sector mostly uses fluorescent and incandescent with respectively 56% and 32%. HID usage is also not negligible in this sector. As for residential lighting, it is mainly driven by incandescent technologies with more than 90%. Existing LED technology does not appear here since the usage is less than 1% for each sector.
Table 2 - US Lighting Consumption by Technology and Sector in 2001
Sector Incandescent Fluorescent HID
Residential 90% 10% 0%
Commercial 32% 56% 12%
Industrial 2% 67% 31%
Outdoor Stationary 11% 2% 87%
Figure 7 - US Lighting Consumption by Type of Fixture
27%
51%
14%
8%
Residential
Commercial
Industrial
Outdoor Stationary
0% 20% 40% 60% 80% 100%
Residential
Commercial
Industrial
Outdoor Stationary
Incandescent
Fluorescent
HID
Energy Economics and Policy ETH-Zurich Prof. Rutherford June 2011
Louis Rondeau 11
Table 3 (Navigant Consulting, 2002) shows the estimated average number of lamps installed for a standard building. Since the sector of outdoor stationary cannot be represented in a "per building" column, only the total number of lamps is included.
Table 3 – Average Number of Lamps per Building and Total Consumption per Sector in 2001
Technologies Residential Commercial Industrial % of lamps Consumption (TWh)
Incandescent 37 91 33 63% 321.2
Fluorescent 6 324 1340 35% 313.4
HID 0.04 7 67 2% 130
LED 0 0.4 0.3 0% 0.1
Total 43.04 422.4 1440.3 100% 764.7
Number of buildings 106989000 4657000 227000 n/a n/a
Table 4 (Navigant Consulting, 2002) gives an estimate of the average daily operating hours by light source. It shows that incandescent lighting has a longer usage in the commercial, industrial and outdoor stationary sector, but still, the national average is still low (2.8 h/day) due to the large number of residential lights that are turned on only 1.9 h/day on average.
Table 4 – Average Number of Lighting Usage per Day per Sector and Technology
Lamp Type Residential (hour/day)
Commercial (hours/day)
Industrial (hours/day)
Outdoor stationary
(hours/day)
National Avg.
(hours/day)
Incandescent 1.9 10.2 16.7 7.9 2.8
Fluorescent 2.2 9.7 13.4 10.8 8.2
HID 2.8 10.1 13.9 11.3 11
LED - 23 23.4 7 22.2
Total 2 9 13.5 10.5 4.8
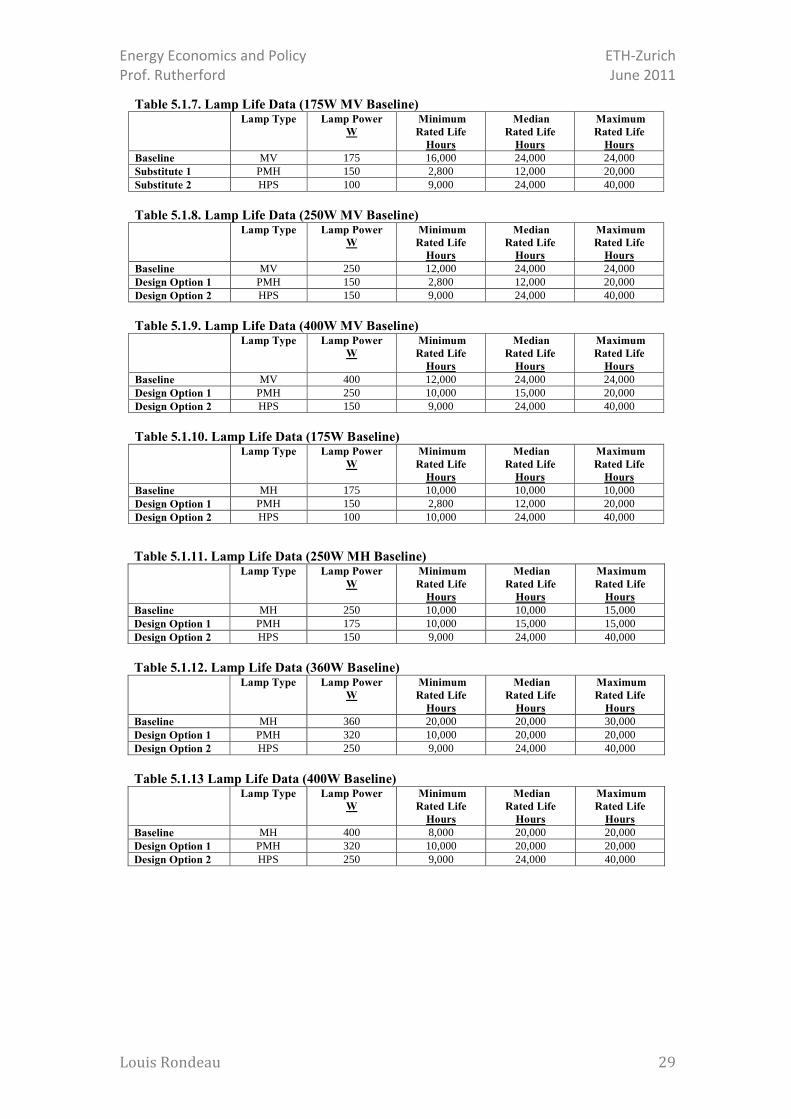
Lighting Technology Comparison This section presents a comparison of four well-known lighting technologies available on the U.S. market: incandescent, fluorescent, HID and LED. Thomas Edison invented the first electric light in December 1879 (Energy Star, 2011). It is known today as the first incandescent lamp. The technology is very simple and inexpensive to produce. However, it has a major disadvantage. It has the lowest lighting efficiency compared to newer lighting technologies developed. Incandescent lamps come in two common types: standard incandescent lamps and halogen lamps (see figure 8)
Energy Economics and Policy ETH-Zurich Prof. Rutherford June 2011
Louis Rondeau 12
Fluorescents are more energy efficient than incandescent lamps (Energy Star, 2011). For example, Energy star compact fluorescent lamps (CFL) are known to consume 75% less electricity than an incandescent bulb and can last up to 10 times longer. The CFL's technology is the same than a fluorescent lamps but it has been made in a compact way to replace incandescent in a retrofit way. Older fluorescent lighting technologies often result in poor light quality and flickering. (see figure 9)
High intensity discharge (HID) lighting systems are widespread in the industry because they are advantageous for lighting large areas where high ceilings are present. They normally range from 50 to 15'000 watts each (Wikipedia, 2011). The oldest HID lamps are using of mercury vapor and are not lighting efficient. Newer technologies use Metal halide (MH) or ceramic MH lamps. One of HID major disadvantage is that it takes some time for the lamp to warm-up and emit light. (see figure 10)
In the last two decades, light-emitting diode (LED) has reached consumers market precipitously. This technology is becoming more and more versatile and an efficient lighting source. Many retrofit models have been introduced into the market in the last few years, making LED attractive to both residential but also industrial consumers. LED has the potential to provide high efficiency and durability. It is also design to have an extremely long life compare to other technology. However, it presently has some disadvantages: it has a high initial price and it is highly sensitive to temperature and voltage change.
Figure 11 shows a retrofit model for stationary outdoors lamps. GE estimates that it can reduce energy consumption by 15 to 30 percent compared to already existing models. It also has an estimated life span of more 50,000 hours resulting in less maintenance. (GE Appliances & Lighting, 2010).
Figure 10 - HID Lamp (Source: Wikipedia)
Figure 11 - GE Outdoors LED Lighting (Source: GE Industrial Products)
Energy Economics and Policy ETH-Zurich Prof. Rutherford June 2011
Louis Rondeau 13
Figure 12 shows a Philips LED 12.5 Watts A19 bulb that can replace a 60-Watts A19 incandescent model. Its efficiency of 65 lumens per watt uses only about 20% of the energy of a 60-watt bulb. Philips rates it at 25,000 hours of operation.
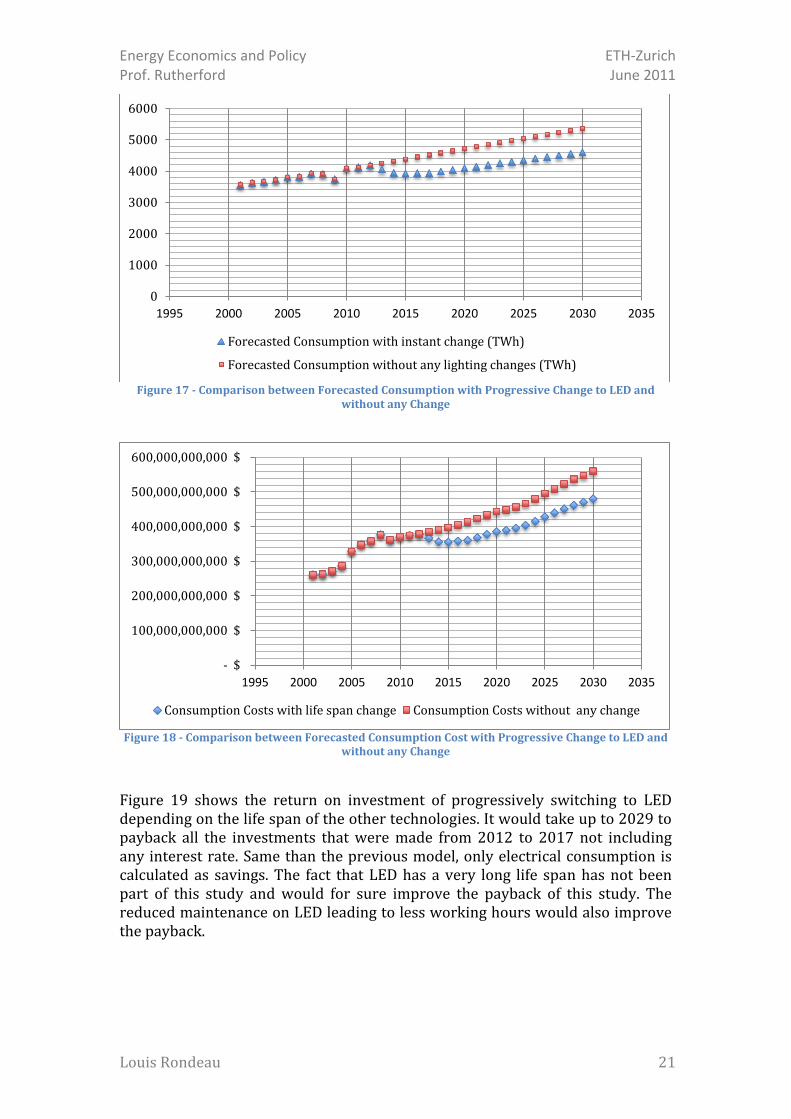
Table 5 (Lighting Research Center, 1999-2004) shows the different averaged performance metrics of the different technologies. Appendix A shows the different products that were evaluated for each technology. An important remark is that not all models available to the market were included in those averaged results. This table only gives a general idea of the different parameters that will be required to model energy savings in further sections. Table 5 shows that LED is the most efficient technology with 140 lm/W as compared with the most energy intensive one, incandescent with 18 lm/W. LED has also the longest life span with an average 60,000 hours compared to 1,500 hours for incandescent. A comparable 60W incandescent bulb with LED only requires 7.7 W. Fluorescent and HID are also efficient technologies with respectively 10.8W and 12.0 W as compared to 60W for incandescent. However, when it comes to initial price, LED has the highest initial cost with $7.12 per Watt as compared to $0.02 per Watt for incandescent and $0.28 per Watt for fluorescent. HID is also expensive because it requires many parts (ballast & lamp) with $2.76 per Watt.
Table 5 - Average Performance of Different Lighting Technologies
Incandescent Fluorescent HID LED
Efficacy (lm/W) 18 100 90 140
Life Span (in hours) 1500 10000 20000 60000
60 Watts incandescent example (W) 60.0 10.8 12.0 7.7
Cost ($) 1.345 2.98 33.12 54.95
Lamp Cost per Watt ($) 0.02 0.28 2.76 7.12
It is also important to consider the amount of embodied carbon of each lighting product. Embodied carbon can be defined as the energy used to make a product, bring it to the market and dispose of it. It has a life cycle perspective of the product. The embodied CO2 of incandescent, CFL and LED per single lamp are
Energy Economics and Policy ETH-Zurich Prof. Rutherford June 2011
Louis Rondeau 14
presented in table 6 (PhotonStar). It shows that LED is the one with the largest embodied CO2 (4.760 kg CO2/luminaire). This can be explained by the fact that the manufacturing process of LED is significantly more complex and energy consuming than incandescent and CFL.
Table 6 - Embodied C02 per Single Lamp
Type of Lamp Average Embodied CO2 per single lamp (kg CO2/luminaire)
Conventional LED Luminaire
12 4.760
Incandescent Lamp12
0.355
Compact Fluorescent lamp
12 0.194
1 Excluding transport and operation 2 Excluding ballast or driver
Energy Economics and Policy ETH-Zurich Prof. Rutherford June 2011
Louis Rondeau 15
The models
Summary The modeling part compares two different approaches for improving lighting consumption in the US. The first model will be called "Instant Change to LED". All incandescent, fluorescent and HID lights will instantly be replaced by LED. The model will only include the initial investments costs of the lights but will not include any installation costs. The second model will be called "Only LED Replacement Policy". This will imply that only LED will be allowed, as replacement once incandescent, fluorescent or HID needs to be replaced. The replacement will be done by using the previously estimated life spans. Consequently, we will estimate the required time to replace all incandescent, fluorescent and HID lights. Energy savings, investments, return on investments and greenhouse gases will be evaluated in each model.
Assumptions
- All modeling is performed from 2001 to 2030. - Years 2001 to 2009 are based on real data. Years 2010 to 2030 are based
on forecasted data and on available information that was found. (see sources in the introduction part)
- The last US census for lighting was performed in 2001; all calculations for usage habits will be based on 2001. We will therefore estimate that the lighting habits of 2001 are the same one as today. For example, we will assume that the average number of light in one building has not change from 2001 to 2030. However, lighting consumption will be adjusted with the ratio of increased or decreased electricity consumption for every year. For example, if the US total electricity consumption increases of 1 TWh between 2012 and 2013 and that lighting consumption is 30% of the total consumption, then lighting consumption increases of 0.3 TWh.
- The investments calculated in each model will only include the acquisition of the lights but will not include any installation costs.
- Savings from having less maintenance due to the better life span of LED will not be considered in the calculations.
- Light consumption, cost and life span are averaged with all available information that was found (see appendix A)
- All lights that have to be replaced have a retrofit LED model. Therefore no other parts than the light is included in the cost.
- We suppose that LED cost remain constant over time. This is a conservative assumption because it is likely that the technology will become more affordable in the near future.
- Since it is impossible to tell how old the existing lights are, we will pretend that at t = 0, they are brand new.
Energy Economics and Policy ETH-Zurich Prof. Rutherford June 2011
Louis Rondeau 16
Instant Change In this model, the simulation of a complete change of incandescent, fluorescent and HID to LED is performed on year 2012. From 2001 to 2011, electricity consumption remained the same as measured or predicted with data. In 2012, we see a decrease of electricity consumption due to the instant switch to LED. From 2012 to 2030 we see an increase of electricity consumption due to the overall increasing US electricity demand. For 2012, the estimation of the consumption of LED lighting is the following (including all replacements).
Let's now calculate the power required to convert in 2012:
Watts
Let's now calculate the investment required in 2012:
( )
Therefore, more than Watts need to be converted for a total cost of Finally, the savings of switching to LED are calculated:
Appendix D shows all calculations in details.
Energy Economics and Policy ETH-Zurich Prof. Rutherford June 2011
Louis Rondeau 17
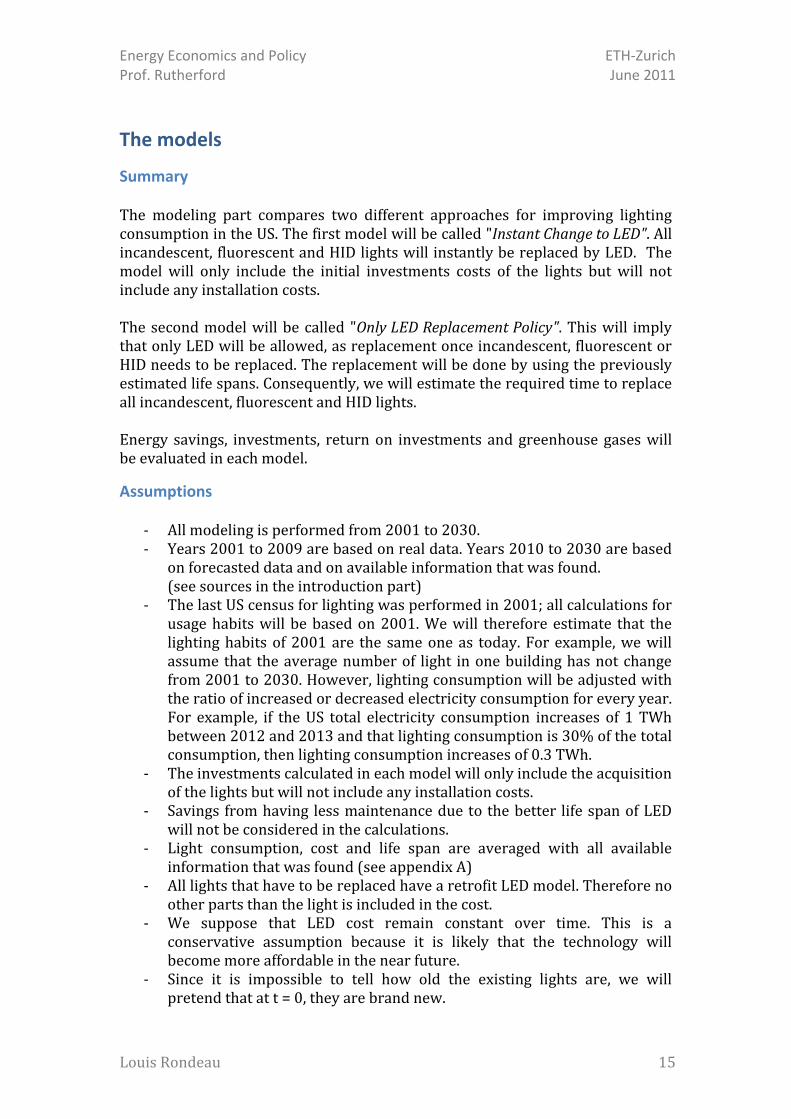
Figures 13 and 14 show the effect on electrical consumption and cost by instantly switching to LED lighting in 2012. From 2012 to 2030, it would represent savings of more than $1'156'659'300'716 or 12'060 TWh
Figure 13 – Comparison between the Forecasted Electrical Consumption with Instant Change to LED
and without any Change
Figure 14 - Comparison between the Forecasted Electrical Consumption Cost with Instant Change to
LED and without any Change
Figure 15 shows the return on investment of instantly switching to LED in 2012. It would take until 2027 to payback all the investment that was made in 2012 not including any interest rate. Note that only electrical consumption is calculated as savings. The fact that LED has a very long life span has not been taken into account in this study and would improve the payback of this study. The reduce maintenance on LED leading to less working hours would also improve the payback.
0.000
1000.000
2000.000
3000.000
4000.000
5000.000
6000.000
1995 2000 2005 2010 2015 2020 2025 2030 2035
Forecasted Consumption with instant change (TWh) Forecasted Consumption without any lighting changes (TWh)
$0
$100,000,000,000
$200,000,000,000
$300,000,000,000
$400,000,000,000
$500,000,000,000
$600,000,000,000
1995 2000 2005 2010 2015 2020 2025 2030 2035
Consumption Costs with instant change Consumption Costs without any change
Energy Economics and Policy ETH-Zurich Prof. Rutherford June 2011
Louis Rondeau 18
Figure 15 - Return on Investment of Instant Switching to LED
Figure 16 shows the decrease of emissions expressed as metric tons of CO2 equivalent. The y-axis is positive and represents the amount of saved metric tons of CO2 equivalent. From 2012 to 2030 it is 8'333'669'796 metric tons of CO2 equivalent that could be saved with an instant switch to LED. A comparison with the amount of embodied CO2 in LED is presented in the conclusion of this study.
Figure 16 - Decrease of Tons of CO2 Equivalent due to LED Switching first model
-1000000000000
-800000000000
-600000000000
-400000000000
-200000000000
0
200000000000
400000000000
20
12
20
13
20
14
20
15
20
16
20
17
20
18
20
19
20
20
20
21
20
22
20
23
20
24
20
25
20
26
20
27
20
28
20
29
20
30
ROI
0
100000000
200000000
300000000
400000000
500000000
600000000
1995 2000 2005 2010 2015 2020 2025 2030 2035
Energy Economics and Policy ETH-Zurich Prof. Rutherford June 2011
Louis Rondeau 19
Only LED Replacement Policy In this model, we simulate a progressive change of incandescent, fluorescent and HID to LED technology depending on the life span of the three first technologies. As written in the introduction part, incandescent lights have an average life span of 1'500 hours, fluorescent lights have 10'000 hours and HID lights have 20'000 hours. Only LED will be allowed as replacement once the life span for each technology is over. To calculate the number of days that each technology will be functioning before being change to LED, we have to use the average national usage in hours per days of each technology. Those numbers are presented in Table 4. The average use of incandescent, fluorescent and HID (in hours per days) is respectively 2.8, 8.2, and11 hours/day. Here are the equations to find out how long each technology will last before being changed to LED. As said in the assumptions, we assume that all lights are brand new on the first day of 2012.
Incandescent lights will all be replaced after 1.47 years, fluorescent lights after 3.34 years and HID lights after 4.98 years. Table 7 shows the different percentages of each technology usage depending of the year. After 4.98 years, all lights will be LED.
Energy Economics and Policy ETH-Zurich Prof. Rutherford June 2011
Louis Rondeau 20
Table 7 - Percentage of each Technology on the US Market depending of the Year
Year Incandescent Fluorescent HID LED
2012 63.02% 35.44% 1.51% 0.03%
2013 29.47% 35.44% 1.51% 33.57%
2014 0.00% 35.44% 1.51% 63.05%
2015 0.00% 12.09% 1.51% 86.40%
2016 0.00% 0.00% 1.48% 98.52%
2017 0.00% 0.00% 0.00% 100.00%
Since this model only takes in account the initial number of incandescent, fluorescent and HID lights as of 2012, calculations must only take in account energy savings and investments costs that are made with the initial number of watts in the first day of 2012. In other words, calculations exclude the additional lights from 2012-2017 that are due to an increased electricity demand in the US. Table 8 shows the different powers in watts for each category only including only the lights of 2012.
Table 8 - Power in Watts for each Lighting Technology
Table 9 shows the investment depending on the year. As we can see, there are not any investments in 2012 since all lights are still functional. In 2016, only a small number of HIDs has to be replaced. By 2017, all lights used are LEDs.
Table 9 - LED Investments ($) depending on the Year
Year Incandescent Fluorescent HID LED
2012 0 0 0 0
2013 0 0 0 $ 76464598922
2014 0 0 0 $ 432981936603
2015 0 0 0 $ 189366198202
2016 0 0 0 $ 4145124756
2017 0 0 0 $ 203111113037
Appendix E shows all calculations in details. Figures 17 and 18 show the effect on electrical consumption and cost of progressively switching to LED lights. From 2012 to 2030, it would represent savings of more than $1,049,648,869,667 or 10,875 TWh.
Energy Economics and Policy ETH-Zurich Prof. Rutherford June 2011
Louis Rondeau 21
Figure 17 - Comparison between Forecasted Consumption with Progressive Change to LED and
without any Change
Figure 18 - Comparison between Forecasted Consumption Cost with Progressive Change to LED and
without any Change
Figure 19 shows the return on investment of progressively switching to LED depending on the life span of the other technologies. It would take up to 2029 to payback all the investments that were made from 2012 to 2017 not including any interest rate. Same than the previous model, only electrical consumption is calculated as savings. The fact that LED has a very long life span has not been part of this study and would for sure improve the payback of this study. The reduced maintenance on LED leading to less working hours would also improve the payback.
0
1000
2000
3000
4000
5000
6000
1995 2000 2005 2010 2015 2020 2025 2030 2035
Forecasted Consumption with instant change (TWh)
Forecasted Consumption without any lighting changes (TWh)
- $
100,000,000,000 $
200,000,000,000 $
300,000,000,000 $
400,000,000,000 $
500,000,000,000 $
600,000,000,000 $
1995 2000 2005 2010 2015 2020 2025 2030 2035
Consumption Costs with life span change Consumption Costs without any change
Energy Economics and Policy ETH-Zurich Prof. Rutherford June 2011
Louis Rondeau 22
Figure 19 - Return on Investment of Progressive Switching to LED depending of the Life Span of other
Technology
Figure 20 shows the decrease of emissions expressed as metric tons of CO2 equivalent. The y-axis is positive and represents the amount of saved metric tons of CO2 equivalent. From 2012 to 2030 it is 7,514,675,353 metric tons of CO2 equivalent due to the progressive switch to LED. A comparison with the amount of embodied CO2 in LED is presented in the conclusion of this study.
Figure 20 – Decrease of Tons of CO2 Equivalent due to LED Switching First Model
-800000000000
-700000000000
-600000000000
-500000000000
-400000000000
-300000000000
-200000000000
-100000000000
0
100000000000
200000000000
20
12
20
13
20
14
20
15
20
16
20
17
20
18
20
19
20
20
20
21
20
22
20
23
20
24
20
25
20
26
20
27
20
28
20
29
20
30
ROI
0.000
100000000.000
200000000.000
300000000.000
400000000.000
500000000.000
600000000.000
1995 2000 2005 2010 2015 2020 2025 2030 2035
Energy Economics and Policy ETH-Zurich Prof. Rutherford June 2011
Louis Rondeau 23
Conclusion Table 10 sums up the results from the two different models used in this paper. Those numbers are the sums from year 2012 to 2030. We can see that the instant change proposition is the cheapest one ($864,815,777,791) with the highest savings ($1,156,659,300,715 or 12,060 TWh). These savings represent 12.5 times the electricity consumption of Japan in 2009. As for the second model, the savings are not as big as the first model ($1,049,648,869,667 or 10,875 TWh) but the investments are divided over many years ($906,068,971,519 over five years).
Table 10 - Summary of the two Models with Horizon 2012-2030
Model Consumption
Savings in TWh
Consumption Cost Savings
Metric tons of CO2
Equivalent Savings
Investment required
Instant Change to LED 12,060 $1,156,659,300,715 8,333,669,797
$864,815,777,791
Only LED Replacement Policy 10,875 $1,049,648,869,667 7,514,675,353
$906,068,971,519
This paper showed the amount of energy and greenhouse gases that can be reduced with the help of LED. It is more that 8,333,669,797 metric tons of CO2 equivalent saved in the first model and 7,514,675,353 metric tons in the second model. The high amount of embodied CO2 in LED was discussed in the introduction of this study. With the total number of lights in the US presented in table 3, the total amount of embodied CO2 that would result in a complete switch to LED is 1,014,441,989 metric tons of CO2. This would reduce roughly a little less than 15% of the GHG savings estimated in the two models. Additionally, the high initial costs of LED as it is in 2011, require huge investments from the ones who want to convert to LED. The long payback of switching to LED in the two models presented is mostly justified by these high initial costs. Conversions policies & programs that would oblige customers to entirely change to LED lights would require significant investments. From an economical point of view, it is very unlikely that a government would opt from such a program. One approach that could be feasible is an incentive that would encourage customers to buy LED when they have to replace their lights. For example, Energy Trust of Oregon has an incentive program called "Change a LIGHT Change the WORLD" (Energy Trust) that encourages their customers to buy energy efficient lights. Customers receive an order form with preapproved efficient LED or CFL lights. The offered products are highly subsidized by Energy Trust. Customers have the incentive to buy such products because they have lower acquisition costs but also lower consumption costs. This type of incentive offered by Energy Trust is particularity good when a technology is still expensive. The
Energy Economics and Policy ETH-Zurich Prof. Rutherford June 2011
Louis Rondeau 24
acquisition cost is shared between two parties and it encourages both sides to save money. One of the disadvantages of such a program is that only few customers (early movers) will consider the incentive. It is likely that a majority of consumers will still consider buying incandescent bulbs that are significantly cheaper than any of the products on the order form. But as it is with any new technology, time will help to get lower prices and the models presented in this paper will become more feasible. LED still has major issues that need to be fixed. The uncertainty in predicting long term performance, the color stability, the lack of application levels (retrofit) and the high sensibility to temperature and voltage change will have to be improved to make the technology more attractive to consumers. The global lighting industry is and will still be in an incandescent lock-in as long as a suitable replacement will not be found. CFL has become a standard in industrialized countries but it is still too expensive for the global market. Recently, LED has also become a standard for individuals and companies that want to set a new trend in the lighting sector. The technology is still too often used to impress rather than for its energy efficiency property. Besides, other technologies such as Electron Stimulated Luminescence (ESL) lights are presently being developed with the potential of reaching the global market faster than LED. With such a fast development, it is not an easy task to tell what technology will win. This study mainly focused on the period between 2011 and 2030. What if a better technology than LED becomes available during that period? A study similar to this one comparing LED and the new better technology would be appropriate to evaluate its potential. But the future looks great for LED technology. As written in "Global and China LED Industry Report 2009–2010", the LED market made a great leap in second-half of 2009, expanding dramatically from US$7bn in 2009 to US$10.7bn in 2010 (a growth rate unattainable by any other electronic product) (Semiconductor Today, 2010). Big companies such as GE, Philips, Cree, Toshiba and Osram are spending enormous amount of money in research and development to create products that end consumers will want in their houses and firms. Nowadays, streets are often lighted by LEDs. The transition from older technologies to LED will be faster than one might think!
It is important for the reader of this paper to understand that there are great uncertainties with the numbers that were calculated in this study. The assumptions presented in the two models would not hold in the real world. The goal of this paper was to give the potential of LED lighting in replacement of older lighting technologies.
Energy Economics and Policy ETH-Zurich Prof. Rutherford June 2011
Louis Rondeau 25
Bibliography
BBC. (2007, 02 20). Australia pulls plug on old bulbs. Retrieved 04 18, 2011, from BBC News: http://news.bbc.co.uk/2/hi/asia-pacific/6378161.stm EIA. (2009). Annual Energy Outlook 2009 with Projections to 2030. Washington: EIA. EIA. (2009). Annual Energy Review 2009. Washington: EIA. Enerdata. (2010, 01 01). Electricity domestic consumption. Retrieved 04 06, 2011, from 2010, Enerdata Statistical Review: http://yearbook.enerdata.net/electricity-domestic-consumption-by-region.html Energy Star. (2011). Larger Opportunities: Lighting. Energy Star. Energy Trust. Change a Light, Change the World. Portland: Energy Trust. GE Appliances & Lighting. (2010). GE's Evolve™ LED Cobrahead Street Lighting System's Best-in-Class Distinction Among Five GE Awards in Department of Energy Competition. Retrieved 04 16, 2011, from http://pressroom.geconsumerproducts.com/pr/ge/Cobrahead_BIC_2010.aspx International Energy Agengy. (2009). Historical World Electricity Consumption. Paris: IEA. Lighting Research Center. (1999-2004). National Lighting Product Information Program. Technology Altas. Navigant Consulting, I. (2002). National Lighting Inventory and Energy Consumption Estimate. Office of Energy Efficiency and Renewable Energy Building Technologies Program. Washington: U.S. Department of Energy. PhotonStar. Reducing Embodied CO2. Hampshire: PhotonStar. Semiconductor Today. (2010). LED market to grow from $7bn in 2009 to $10.7bn in 2010 then $20.4bn in 2012. Semiconductor Today. U.S. Census Bureau. (2009). U.S. Census 2009. Washington: U.S. Government. UNDP. Human Development Report. New York: United Nation. Wikipedia. (2011, 04 10). High-intensity discharge lamp. Retrieved 04 16, 2011, from Wikipedia, The Free Encyclopedia: http://en.wikipedia.org/w/index.php?title=High-intensity_discharge_lamp&oldid=423310255
Energy Economics and Policy ETH-Zurich Prof. Rutherford June 2011
Louis Rondeau 26
Appendix A Lighting properties
Appendix A.
74
Appendix A. Technology Tables and Assumptions
Table A-1. Approximate Properties of Lighting Technologies Considered
Lamp Type Available
Wattage
Efficacy
(lm/W) CRI CCT (K)
Life
(1000 hrs)
Incandescent 3
Standard - General Service 15-250 10-19 97 2,500-3,000 0.75 - 2.5
Standard - Reflector 30-120 8-12 97 2,500-3,000 2
Halogen - General Service 42-150 14-20 99 3,000 2 - 3.5
Quartz Halogen 35-150 11-17 99 2,800-3,000 2 - 5
Halogen - refl. - low volt 15-73 7-10 99 4
Low wattage (less than 25W) 3-25 3-17 99 0.2 - 9
Misc incandescent 0.5 - 37.5 99 0 - 3
Fluorescent 0
T5 4-13 25-55 52-75 3,000-6,500 6 - 7.5
T8 � less than 4� 17-30 35-82 60-90 3,000-6,500 15 - 20
T8 � 4� 32 78-87 70-90 3,000-5,000 15 - 20
T8 � More than 4� 35-86 78-87 52-84 3,000-4,100 7.5 - 20
T8 � U-bent 32 80-82 75-84 3,000-4,100 20
T12 � less than 4� 14-55 35-75 52-90 3,000-6,500 7.5 - 18
T12 � 4� 32, 34, 40 60-75 50-90 3,000-7,500 20
T12 � More than 4� 50-220 45-92 60-92 3,000-6,500 9 - 20
Energy Economics and Policy ETH-Zurich Prof. Rutherford June 2011
Louis Rondeau 32
Appendix B Greenhouse Gas Equivalencies
Electricity use (kilowatt-hours)
The Greenhouse Gas Equivalencies Calculator uses the Emissions & Generation
Resource Integrated Database (eGRID) U.S. annual non-baseload CO2 output
emission rate to convert reductions of kilowatt-hours into avoided units of carbon
dioxide emissions. Most users of the Equivalencies Calculator who seek
equivalencies for electricity-related emissions want to know equivalencies for
emissions reductions from energy efficiency or renewable energy programs.
These programs are not generally assumed to affect baseload emissions (the
emissions from power plants that run all the time), but rather non-baseload
generation (power plants that are brought online as necessary to meet demand).
Emission Factor
6.91 x 10⁻⁴ metric tons CO2 /
kWh (eGRID2010 Version 1.0, U.S. annual
non-baseload CO2 output emission rate,
year 2007 data)
Notes:
• This calculation does not include any greenhouse gases other than CO2.
• This calculation does not include line losses. Individual subregion non-baseload emissions rates are also available on the eGRID Web site.
To estimate indirect greenhouse gas emissions from electricity use, please use Power Profiler or use eGRID subregion annual output emission rates as a default
emission factor (see eGRID2010 Version 1.0 Year 2007 GHG Annual Output Emission Rates (PDF) (1 p, 278K, About PDF).
Sources: (EPA 2011) eGRID2010 Version 1.0, U.S. annual non-baseload CO2 output emission rate, year 2005 data U.S. Environmental Protection Agency, Washington, DC.


![Rondeau [Masterpiece Theater Theme] - Free-scores.com · Instrumentation: Piano solo ... Rondeau [Masterpiece Theater Theme] Author: Mouret, Jean-Joseph - Arranger: Wallace, William](https://static.documents.pub/doc/80x56/5afbda817f8b9aa34d8b5f03/rondeau-masterpiece-theater-theme-free-piano-solo-rondeau-masterpiece.jpg)


![Rondeau from the Partita in C Minor for ... - Sheet music · Rondeau from the Partita in C Minor for Violin & Viola [BWV 826 No. 5] Author: Bach, Johann Sebastian - Arranger: Magatagan,](https://static.documents.pub/doc/80x56/6103ac7b453c7a5bbc27c0c3/rondeau-from-the-partita-in-c-minor-for-sheet-music-rondeau-from-the-partita.jpg)


