Ii TTI-2-5-85-405-1 TEXAS TRANSPORT ATION INSTITUTE STATE DEPARTMENT OF HIGHWAYS AND PUBLIC TRANSPORTATION COOPERATIVE RESEARCH THE EFFECTS OF EMBEDMENT DEPTH, SOil PROPERTIES, AND POST TYPE ON THE PERFORMANCE OF HIGHWAY GUARDRAil POST RESEARCH REPORT 405-1 STUDY 2-5-85-405 HIGHWAY GUARDRAILS II in cooperation with the Department of Transportation Federal Highway Administration
Transcript
I~
Ii
TTI-2-5-85-405-1
TEXAS TRANSPORT ATION INSTITUTE
STATE DEPARTMENT OF HIGHWAYS AND PUBLIC TRANSPORTATION
COOPERATIVE RESEARCH
THE EFFECTS OF EMBEDMENT DEPTH, SOil PROPERTIES, AND POST TYPE ON THE PERFORMANCE OF HIGHWAY GUARDRAil POST
RESEARCH REPORT 405-1 STUDY 2-5-85-405 HIGHWAY GUARDRAILS
II
in cooperation with the Department of Transportation Federal Highway Administration
THE EFFECTS OF EMBEDMENT DEPTH, SOIL PROPERTIES, AND POST TYPE ON THE PERFORf,1ANCE OF HIGHWAY GUARDRAIL POST
7. Author's)
David W. Eggers and T. J. Hirsch
9, Performing Organ; zation Name and Address
Texas Transportation Institute The Texas AlAt~ University System College Station, Texas 77343
~~----------------~-------------------------~--~ 12. Sponsoring Agency Nome and Address
Texas State Department of Highways and Public Transportation; Transportation Planning Division P.O. Box 5051 Austin, Texas 78763
15. Supplementary Notes
Research performed in cooperation with DOT, FHHA.
.August1986 6. Performing Organ; zotion Code
8. Performing Organi zation Report No.
Research Report 405-1 10. Work Unit No.
11. Contract or Grant No.
Study No. 2-5-85-405 13. Type of Report and Period Covered
Inter,'m _ Seotember 1984 -. August'l986
14. Sponsoring Agency Code
Research Study Title: Guardrail on Low Fill Bridge Length Culverts 16. Abstract
The Texas State Department of Highways and Public Transportation (TSDHPT) currently uses two types of guardrail posts: (1) a circular wood post and (2) a steel W6 x 8.5 post. The current specifications require that the post must have a minimum soil embedment depth of 38 in. When a guardrail system is required at a culvert, SDHPT currently requires a rigid bridge rail when the full embedment depth of 38 in. cannot be achieved. The objective of this research study was to determine if the current. guardrail design could be modified to achieve the necessary strength when full post embedment could not be achieved. The purpose of this report was to assess the effects of post type, soi 1 condi t ions, and embedment depth on the load-deformation characteristics of the guardrail post. With this information, it is believed that a successful guardrail can be designed using more post with less than the full 38 in. embedment. Posts with only 18 in. or 24 in. embedment could be used at 3 ft-l 1/2 in. spacing and still produce the required strength for example.
A series of static load tests were conducted on timber and steel posts embedded 18 in., 24 in., 30 in., and 38 in. in two different soils to determine the effects of post type, soil conditions, and embedment depth on the amount of energy dissipated by the soi 1. The results of these fiel d tests were used to verify a mathematical model which could be used to predict guardrail post load capacity.
17. Key Words
Embedment Depth, Soil Properties, Post Types, Static Load Tests
18. Distribution Statement
No restrictions. This document is made available to the public through the National Technical Information Service 5285 Port Royal Road Springfield, Virginia' 22161
19. ~curity ClassH. (of this report) '20. Security Classil. (of thi s page) 21. No. of Poges 22. Price
Unclassified Unclassified 60
Form DOT F 1700.7 (8-69)
THE EFFECTS OF EMBEDMENT DEPTH, SOIL PROPERTIES, AND POST TYPE ON THE PERFORMANCE OF HIGHWAY GUARDRAIL POST
by
David W. Eggers Research Assistant
and
T. J. Hi rsch Research Engineer
Research Report 405-1 on
Research Study No. 2-5-85-405 Guardrail on Low Fill Bridge Length Culverts
Sponsored by
Texas State Department of Highways and Public Transportation in cooperation with
the U.S. Department of Transportation Federal Highway Administration
Texas Transportation Institute The Texas A&M University System College Station, Texas 77843
METRIC CONVERSION FACTORS
Symbol
in It yd mi
in' ft' yd' mi'
oz Ib
tsp Tbsp fI oz c pt qt gal ft 3
yd'
Approximate Conversions to Metric Measures
When You Know
inches feet yards miles
square inches square feet square yards square miles acres
., in • 2.54 (exactly). For other exact conversions and more detailed tables, see NBS Misc. Pub I. 286. Units of Weights and Measures. Price $2.25, SO Catalog No. C13.10:286.
INTRODUCTION MATHEMATICAL MODEL SOIL CONDITIONS STATIC LOAD TESTS
INTRODUCTION TESTING PROGRAM PLACEMENT OF POST EQUIPMENT AND INSTRUMENTATION TEST PROCEDURE
RESULTS AND CONCLUSIONS STATIC TEST RESULTS COMPARISON OF TEST RESULTS WITH THEORETICAL PREDICTIONS CONCLUSIONS RECOMMENDATIONS FOR FURTHER RESEARCH
REFERENCES APPENDIX A - SEQUENTIAL PHOTOGRAPHS FOR TESTS 5-16 APPENDIX B - SPECIFICATIONS FOR METAL BEAM GUARD FENCE
iii
1
2
8
16 16 16 16 16 22
26
26
26
37
37
38
39
52
LIST OF FIGURES
Fi gure Page
Brom's Ultimate Lateral Soil Resistance for Cohesive Soils 3 2 Brom's Ultimate Lateral Soil Resistance for Cohensionless Soils 4 3 Lateral Load vs. Embedment Depth for Analytical Model
(Cohensionless Soils) 5 4 Lateral Load vs. Embedment Depth for Analytical Model
(Cohesive Soils) 6
5 Test Site for Static Tests 9 6 Shearing Stress vs. Deflection for Two Different Normal Stresses 10
7 Shearing Stress vs. Normal Stress for Cohesive Soil 11 8 Gradation Curve for the Cohesionless Soil 14 9 Shear Strength of Rockfill Material from Large Triaxial Test 15
10 Location of Timber Posts 1-8 17 11 Placement of Timber Posts 1-8 18 12 Location of Steel Posts 9-16 19 13 Placement of Steel Posts 9-16 20 14 Static Testing System 23
15 Attachment of Force Transducer to Loading Bracket 24 16 Loading Bracket for Timber Post 25 17 Loading Bracket for Steel Post 25 18 Lateral Load vs. Deflection for Post Embedded 18 in. 27 19 Lateral Load vs. Deflection for Post Embedded 24 in. 28 20 Lateral Load vs. Deflection for Post Embedded 30 in. 29 21 Lateral Load vs. Deflection for Post Embedded 38 in. 30 22 Comparison of Analysis and Field Load Tests 1-4 and 9-12 31 23 Comparison of Analysis and Field Load Tests 5-8 and 13-16 32 24 Sequential Photographs for Test 5 40 25 Sequential Photographs for Test 6 41 26 Sequential Photographs for Test 7 42
27 Sequential Photographs for Test 8 43 28 Sequential Photographs for Test 9 44 29 Sequential Photographs for Test 10 45
iv
LIST OF FIGURES (continued)
Figure Page
30 Sequential Photographs for Test 11 46
31 Sequential Photog raphs for Test 12 47 32 Seq uent i a 1 Photographs for Test 13 48
33 Sequent i a 1 Photog raphs for Test 14 49
34 Sequent i a 1 Photographs for Test 15 50
35 Sequential Photographs for Test 16 51 36 Specifications for Metal Beam Guard Fence 53
v
Table
1
2
3
4
5
6
7
LIST OF TABLES
Summary of Static Analysis Propertis of the Soil Summary of Tests Summary of Results Percent of Static Post Test with an Embedment Depth of 38 Inches Comparison of Wood and Steel Guardrail Posts in Cohesive and Cohesionless Soil - Static and Impact Tests Strength of Timber Guardrail Posts in Rock
vi
7
12
21
33
34
35
36
INTRODUCTION
When this research study was initiated, the Texas State Department of Highways and Public Transportation (TSDHPT) required the wood guardrail post to have a minimum diameter of 7 in. and a minimum soil embedment depth of 38 in. If the top of the post was domed, the minimum overall length was 69 in., and a mi ni mum avera 11 post 1 ength of 66 in. was requi red if the top of the post was beveled. The specifications stated that the steel W6 x 8.5 guardrail post should comply with the beveled wood post. When a guardrail is required at a culvert where the fill depth will not permit the full embedment depth of the guardrail post, a "rigid" bridge rail is now installed. This rigid bridge rail then calls for a special transition between the flexible guardrail.
The purpose of this research report was to determine the force vs. displacement characteristics and amount of energy absorbed by the lateral soil resistance produced on timber and steel standard guardrail posts embedded 18 in., 24 in., 30 in., and 38 in. in a cohensionless and cohesive soil. The post type, soil properties and length of embedment are important factors in determi ni ng the behavi or of the guardrai 1 system. This i nformati on wi 11 be used in other phases of this study to modify the guardrail design. Hopefully, more posts caul d be used wi th shallower embedment to achi eve the desi red strength.
This phase of the study consists of a series of static tests on timber and steel posts embedded 18 in., 24 in., 30 in. and 38 in. in two different types of soil. The work plan consisted of
1. An existing mathematical model for static laterally loaded guardrail posts was used to predict the lateral capacity of the post.
2. Soil tests were conducted to determine the average properties of the cohesive and cohensionless soils.
3. Static field load tests were performed on timber and steel posts with 18 in., 24 in., 30 in. and 38 in. with embedment depths in two types of soils.
4. The test results were compared with each other and with the mathematical model.
1
MATHEMATICAL MODEL
Using the fundamental earth pressure theory developed by Coulomb, the static post capacity could be estimated for each specific test condition using the model reported by Broms (1 and 1)*. For short, free ended, rigid piles in cohesive soils, the distribution of soil resistance along the pile was simulated by Broms (1) as shown in Fig. 1. The ultimate lateral soil pressure along the length is a function of the undrained shear strength, Cu, and the pile diameter B.
For cohesion1ess soils, Broms (1) uses the ultimate pressure distribution shown in Fig. 2. The ultimate soil pressure is defined in terms of ~, L, B and Kp; where r is the effective unit weight of the soil, L is the embedment depth, B is the pile diameter and Kp is the Rankine passive earth pressure coefficient Kp = tan2(45 + ~/2).
The lateral capacity, P, for the cohesive and cohesion1ess soils can be determined by using moment and horizontal force static equilibrium equations. These lateral soil pressure distributions proposed by Broms are widely used in practice to predict the ultimate lateral capacity of a pile.
The ultimate lateral soil resistance for the cohensionless and cohesive soils was calculated using Broms· procedures at each embedment depth. These values are presented in Table 1. The lateral post capacity versus embedment depth are plotted in Figures 3 and 4. These static analysis results approximate the ultimate lateral soil capacity developed for each of the static load tests.
*Underscored numbers in parentheses correspond to numbers in the 1 ist of references.
2
1
p --
H
9C. B u
~~ ~ ~ ..... -vx
r"" .... '"'" ", .~
....
L-A
L
., 41\
A
~~
FIG; 'I-atom's Ultimate Lateral~Soil Resistance for Cohesive Soils (Ref. 1)
3
P
1 H
L
Pp --~------------~--.. ~--~--------------------~
-....-B-... ..... --- 3¥BLKp ---j
FIG. 2.-Brom ' s Ultimate Lateral; Soil Resistance for Cohesionless Soils (Ref. 2)
4
6
5
4
c.n 0-0,... ~
.Q 0,... u res
3 Cl. res u +.l c.n 0
0..
r-res ~ OJ +.l res 2 -'
1
Cohesionless Soil
In-Situ Soil Prol2erties
~= 140 pcf
,R/= 55 0
Post Prol2erties
H = 21 in. height
B = 7 in. diameter
20 30
Depth of Embedment (inches)
FIG. 3 .• -Latera 1 Load vs. Embedment Depth for Ana lyti ca 1 ~,10de 1 (Cohesionless Soil)
5
6
5
4
CJ')
CL or-~
~ or-U res
3 CL res u +l CJ')
0 CL
r--res s-O) +l res 2 .....J
1
Cohes i ve Soi 1
In-Situ Soil Pro~erties
6= 15.5 psi
;1= 14.7 0,
C = c + 6tanp/ u
Post Pro~erties
H = 21 in. height
B = 7 in. diameter
10 20 30
Depth of Embedment (inches)
FIG. 4.-Lateral Load vs. Embedment Depth for Analytical Model (Cohesive Soil)
6
TABLE 1
SUr·1r·1ARY OF STATIC ANALYSIS
Cohesionless Soil
~ = 140 pcf
,tf = 55 ()
Embedment Depth (i nches)
18
24
30
38
Cohesive Soil
6 = 15.5 psi
RI = 14.7 tJ
c = 3.5 psi
Cu = c + 6tanl
Embedment Depth (i nches )
. 18
24
30
38
Post Properties
Distance to Load ~ 21 in.
Post Diameter = 7 in.
Maximum Lateral Capacity, (kips)
0.7
1.3
2.3
4.0 -
Post Properties
Distance to Load = 21 in.
Post Diameter = 7 in.
J~aximum Lateral Capacity (kips)
1.3
2.0
2.9
4.1
7
SOIL CONDITIONS
To assess the effects of varying soi 1 conditions, it was decided to perform a series of tests in two soils (cohensionless and cohesive) with different properties. The test site was located at the Texas A&M University Research and Extension Center. The test site is shown in Fig. 5. The natural soil at the test site was a stiff cohesive clay which was used as the cohesive soil. A pit had to be constructed to remove the cohesive soil and replace it with a selected cohensionless soil for those tests.
For the natural cohesive soil, two soil borings were used to determine the soil conditions at the test site. Undisturbed soil samples were taken with a 2.0 in. diameter thin-walled tube sampler. Laboratory tests on the samples included unit weights and moisture contents. A direct shear test was also conducted to determine the cohesive strength and angle of internal friction of the cohesive soil. The test results from these tests are shown in Table 2.
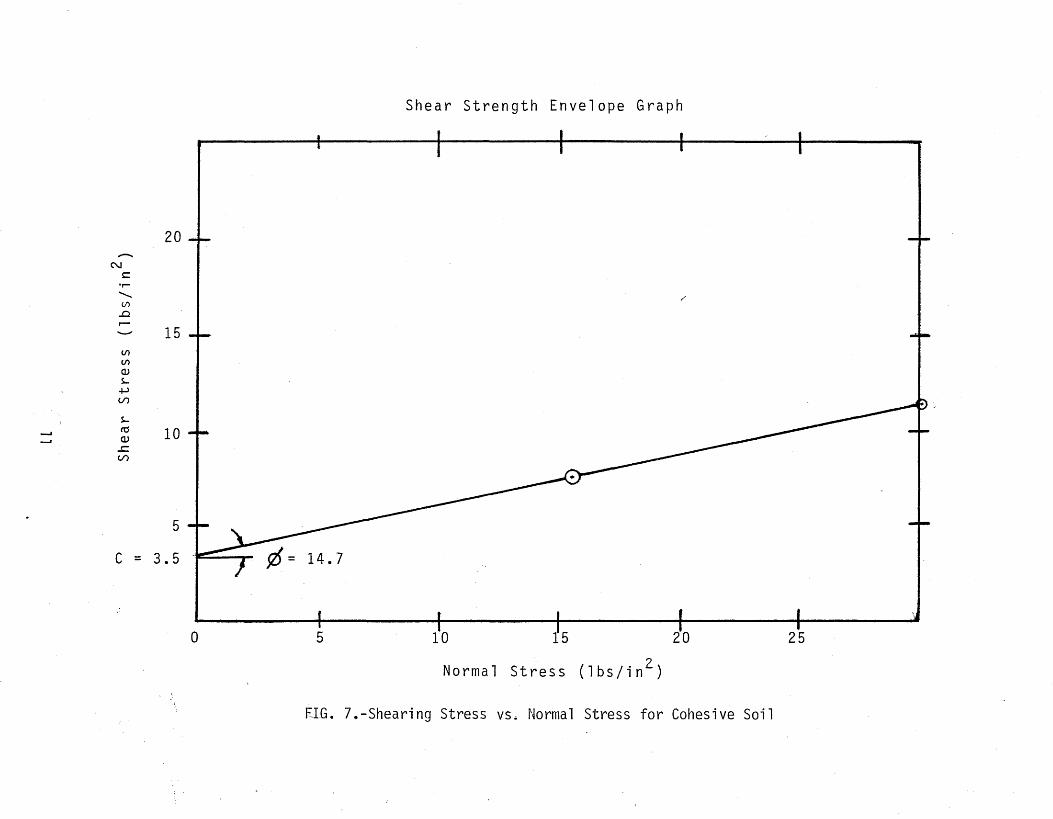
After the unconsolidated, undrained, direct shear tests were completed, a plot of shearing stress versus deflection was constructed as shown in Fig. 6. These curves were used to get the maximum shear strength of the soil for each normal stress to plot the strength envelope as shown in Fig. 7. The cohesion and angle of internal friction for the soil could be determined from Fig. 7. The test results indicated that the site consisted of a stiff clay.
The cohesionless soil used was a crushed limestone material obtained from near Georgetown, Texas. An existing stockpile containing this material was used. At the time the pit was constructed, the soil properties were determined using a McGuin water psychrometer and by taking soil samples for laboratory tests.
The in-situ unit weight was difficult to obtain from the McGuin water psychrometer test due to the large particle size of the soil. Conventional methods of shear strength determination could not be used because of the large particle size. To obtain the angle of shear resistance and cohesion, a sieve analysis and water content determination was conducted. A gradation curve, maximum particle size, relative density and overburden pressure were correlated to determine the shear strength and estimate the cohesion of the soil. The gradation curve obtained was constructed from the sieve analysis
8
~lG. G.-Test Site for Static Test r
9
L1
10
9
N 8 c:
or-
'--(/) 7
...Q
r-
6 (/)
(/)
0, OJ 5 s-
o/-> V)
s-1'0
4 OJ
..c 3 V)
2
1
o 1 2
Unconsolidated Undrained Direct Shear Test (UU)
3 4
0 = 30.3 psi
t max :- 11.4 psi
0= 15.5 psi
t max :-
5 6 7 8 9 10 Deflection X 10- 2 {inches)
7.5 psi
11 12 13
FIG. 6.-Shearing Stress vs. Deflection for Two Different Normal Stresses
--'
20
N !::
or-
......... V'l
..0 r--
15 (J')
(J')
OJ So..
4-> (/')
So.. res 10 OJ
...c:::: (/')
5
C = 3.5
Shear Strength Envelope Graph
o 5 10 15 20 25
Normal Stress (lbs/in 2 )
EIG. 7.-Shearing Stress vs .. Normal Stress for Cohesive Soil
Generalized Description of the
Total Unit Height ((ft)' pcf --' N
Average Moisture Content (w), %
Angle of Internal Fri cti on (¢),
Cohesion (C), psf
TABLE 2
PROPERTIES OF THE SOIL
Cohesive Soil
Soil Dark, grey stiff clay
126.9
21.8
Q 14.7
504
Cohesionless soil
Well graded crushed 1 i mes tone grave 1
140
--
48-55
0-50
shown in Fig. 8. The gravel was classified as a GW (well graded gravel,
gravel sand mixture, little or no fines) material of the Unified Soil
Cla"ssification System. The large triaxial test results presented by Leps (~)
are shown in Fig. 9. From these correlations a range of 48 to 55 degrees was
chosen for the angle of internal friction. The gravel pit had a large
variation of moisture content due to the entrapment of large pockets of
water. The moisture content could not be determined because of this
variation. The cohesion was estimated from the laboratory tests and engineering experience. The properties of the cohensionless soil are also
summarized in Table 2.
13
MECHANICAL ANALYSIS CHART u.s. Siand.rd Sie.,. OPlnina' In Inch.. U. S. Standard Si • .,e Numb.,. HYdrom.",
_~~1~~Z~~'~~~Tt~'~/~'4~I~n~~I~/,~~~;'~~~4~-r5r-~IF~ __ t~4~la~TZrr0-rs,0~~4rO~. __ .~~p 100 ~'4~0~Z~0;~0!~2~TtO~B~Z~I-r __ -r ____ ~rr~-r-r~ __ ~ ___ ~ ____ -'0 100'-.1 '" ~ , ,I 1.1 I.' I I I', I,. -.- I I I I I I
80
eo
~ 10 .. • • .. ao .A .. c : ao o
A.
~ 40 u .. • A.
50 . -
zo
to -
.- ..• ~ -.-
-~-~~=:
-- -..•... - .. __ ..
.. ,-'- -----_ .. -
Groih Siu in Minimet.ra
--··10
zo
--- - so ~ .. • •
. ••. - .-- 40 .. .. ,., • c --.. -._- --. ao .. -• .-_.-- •. _.-._.. cr;
- -- -- ----. - --- ao c • u
- .-. -.--- TO
eo
.. _-_.-- ---.0
--- - - f-··-f- ---.----
~ • A.
~~~ ____ ~G~R~A~V~E~L~~ ____ -4f~ ______ r-__ ~~~SAH_D __ y-____ ~~ ______ ~ Coo,.. fine M.dium fin. SILT or CLAY
S.oil CI ... iUcation Sy.t.m - Corp 0' Enain •• ,., U.S. Army
FIG~ 8. -Gradation Curve for the Cohesionless Soil
70~----~--------~'------~------~------------------------~1--------~ o Isabella granite 4 in. USED 1948 Q) Intiernillo diorite a in. eFE 1965
o Cachuma grave' tin. USaR 1953 • IntierniUo cQni'om a in. eFE 1965 -<> Cachuma gravel 3 in. USSR 1953 e Malpaso eonglom a in. eFE 1965
A Cachuma quarry 3 in. USSR 1955 T'" Pinzandaran grave. 8 in. eFE 1965 + Oroville tailings 3 in. USED 1963 • Infiernillo basalt 7 in. eFE 1966
" Soledad grave! 4 in. erE 1965 . x Intiemilla gneiss X 7 in. erE 1566
55
601or-----,.---------"I"'t-----+--- • Infiernillo gneiss Y 7 in. eFE 1966 I > Contreras grave' 7 in. eFE 1965 '" i ~ Sar.t! Fe roek 7 in. eFE 1965 ~ ~ -¢ rort Pecle sand Nc. 20 TML 1939
~ 55 ...----;.------I----~-~----I--... v Scituate sanci No. a TML 1941 " :. Average rocktill 8 Ottawa Std. sand TML 1938
~ ""'-, . '" -t
50~-----+--------~~~~~~----~--~~---r---------------------~ t --",L" ~ 45r------+1---------~~.----+----~~~~~~~------~~--~
30~--------------~----------------------~~----~------------~ 1 2 5 10 20 50 100 200 Norma. pressure (1' N' in pounds per square inch
FIG. 9 .. -Shear Strength of Rockfill Materials from Large Triaxial Tests (after Leps (~))
15
sea
STATIC LOAD TESTS
INTRODUCTION A series of static guardrail post tests were conducted to determine the
effects of embedment depth, soil conditions and post type on the load deformation characteristics of the posts. The effects of reducing the embedment coul d be determi ned from the compari son of energy absorbed by the soil-post system. It would be much more economical to have a guardrail system with a few posts embedded 18 in. that would enable a culvert to extend beneath. Currently, the TSDHPT requires a rigid bridge rail when full embedment depth cannot be achieved. These types of traffic rail systems are expens i ve to const ruct and somet i mes cause a trans i t ion prob 1 em between the flexible guardrail system and the rigid bridge rail system.
TESTING PROGRAM The static guardrail tests that were conducted are summarized in Table
3. A total of 16 tests was performed, eight in cohesive soil and eight in cohensionless soil. Both steel and timber posts were used with embedment depths of 18 in., 24 in., 30 in. and 38 in. for the comparison of energy absorpti on.
PLACEMENT OF POST The test setup and location of the posts are shown in Figs. 10 through
13. To assess the effects of varying soil conditions, the posts were placed in two soils with significantly different properties. A cohensionless gravel and a stiff cohesive clay were used for this purpose.
The posts were placed in the soil by augering a 24 in. diameter hole and tamping the soil around the post in several lifts. After the posts were tamped in place, a four-to-five week period followed to allow the soil to consolidate, relieve construction stresses and to become more uniform with the surrounding soil conditions.
EQUIPMENT AND INSTRUMENTATION In order to conduct the tests, a loading system had to be constructed
capable of (1) applying a horizontal force to the post at a uniform
16
r--l Post'l Pos t 5
~ Y Holes augered ,.. ....... ,....-..\ for post fO} 1 101. installation - / I \ _./ I t 51 :min.-I I 5 I min.
Pos t 2 Pos t 6
~/O :1 "-:-" (0) 1\ 4-r- " ..,/ ...... ./ J I
51 min. I I 5 I min. 221 Pos t 3
---'
Pos t 7 ~r' r t ........
.,.-,
'OJ If 0) I ...... ./ I '-) I t
I J 5 I min. 51 min. Post 8 I I t ~---, I
I ,o/v Existing soil Test pit ....,; I - J J . L __
Post 16~..- .. : i I \ Iv1J Existing soil I '- '/ J I . . L__ .
22 I 5' min.
5' min.
----..a.-t --r--"-I'" \ , ( J
'- ..,
~ min.
FIG 12. -Locati on of. Steel poosts 9-16 .
Po s t 10
Pas t 11
Test pit
N o
211J
38"
Placement of steel posts
Post 12 Post 11 Post 16 Post 15 5 I min. 51 min.
f 21" 21"
30"
Bottom of cohesionless soil pit
FIG. 13-Placement of Steel Posts9-16
Post 10 ~
Pas t 9 Post 14 Post 13 51 mi-n.
21"
18"
Test Post No. Type
1 Wood
2 Wood
3 Wood
4 Wood
5 Wood
6 Wood
7 Wood
8 Wood
9 Steel
10 Steel
11 Steel
12 Steel
13 Steel
14 Steel
15 Steel
16 Steel
TABLE 3
SU~1~~ARY OF -TESTS
Embedment Height Depth of Load (i n. ) (i n. )
18 21
24 21
30 21
38 21
18 21
24 21
30 21
38 21
Soil Type
Cohesionless
Cohesionless
Cohesionless
Cohesionless ~~---------
Cohesive
Cohesive
Cohesive
Cohesive ~.ct ________ """ __ ' ,1--".."...
18 21 Cohesionless
24 21 Cohesionless
30 21 Cohesionless
38 21 Cohesionless
18 21 Cohesive
24 21 Cohesive
30 21 Cohesive
38 21 Cohesive
21
displacement rate, (2) measuring the load acting on the post and (3) measuring the displacement of the post at ground level and at a height of 21 in. To apply the lateral force, a pulley was mounted to a concrete anchor at a height of 21 in. above ground level. A cable was placed through the pulley and attached to the load cell. The free end was attached to a fork lift truck. The fork lift truck slowly raised the cable upward, applying the lateral load to the post. This loading system is shown in Fig. 14.
The load applied to the post was measured by a load cell force transducer attached to the loading bracket as shown in Fig. 15. Before the test, the transducer was calibrated up to a maximum load of 15 kips. The force transducer was constructed of a metal bar instrumented with a full bridge of strain gages. The output from these strain gages was measured with a digital microvo1tmeter calibrated to read the load directly. For the series of static tests 1 through 4, the post deflections at the ground surface were measured. In order to locate the pivot point of the post, a second measurement was taken close to the top of the post. For energy absorption comparison, the measured horizontal deflections were graphically converted to deflections at a height of 21 in. For the series of tests 5 through 16 the horizontal deflections were measured once at a height of 21 in. The post displacements were measured with a measuring tape from a fixed point about 5 ft behind the post.
TEST PROCEDURE A specially constructed loading bracket was attached to the post at a
height of 21 in. above the ground. The brackets for the steel and timber posts are shown in Figs. 16 and 17. The bracket allowed a horizontal pull throughout the displacement of the post and eliminated the development of stress concentrations in the post. The load transducer was attached to the loading bracket and cable. A small amount of tension was transferred to the cable by raising the forks of the lift truck to take out the initial slack in the loading system. After the calibration number was checked, the load transducer was zeroed. The load was read off the digital microvo1tmeter at everyone-hal f inch of movement of the post. The test continued unti 1 the post began pulling out of the ground.
22
fIG. 14.-Static Testing System
23
FIG. 15.-Attachment of Force Transducer to the Loading Bracket
24 1
FIG. 16-Loading Bracket for Timber Post
rIG. 17.-Loading Bracket for Steel Post
25
RESULTS AND CONCLUSIONS
STATIC TEST RESULTS The lateral load versus deflection curves for the timber and steel posts
are summarized in Figs. 18 to 21. Maximum lateral load values and dissipated energy are presented in Table 4.
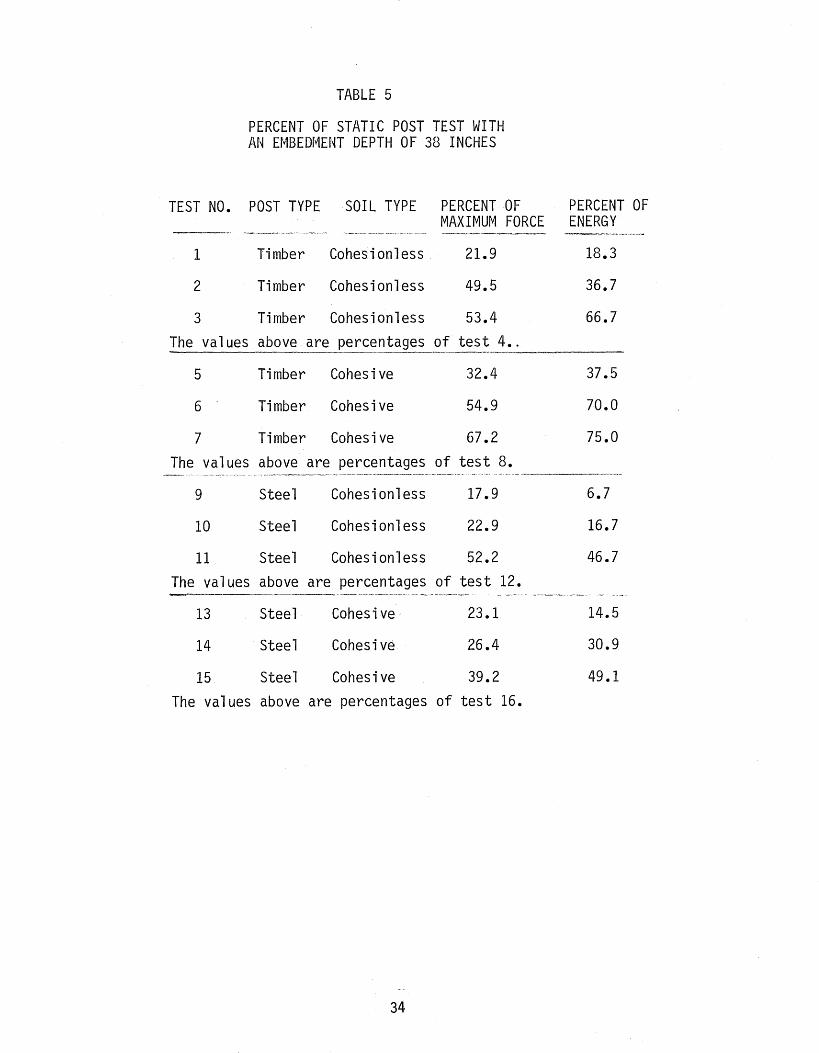
For most cases the steel post proved to have a slightly smaller ultimate load and less energy absorption than the timber post with corresponding embedment depths and soil conditions. This was true for all tests except for the steel post embedded 38 in. in cohesive soil. The cohesive soil dissipated more energy than the cohesionless soil for the posts embedded 18 and 24 in. For posts embedded 30 and 38 in., the cohesionless soil absorbed more energy. A si gni fi cant amount of energy absorbed by the soi 1 was lost by reduci ng the embedment depth of the guardrai 1 post. The percent di fferences of the absorbed energy and ultimate lateral capacity between the standard 38 in. embedded post and the other post with similar soil conditions are shown in Table 5. Tables 6 and 7 are provided from TTl Research Report 343-1 (i) and 343-1 Supplement (~) for additional comparisons.
COMPARISON OF TEST RESULTS WITH THEORETICAL PREDICTIONS The lateral post capacity versus embedment depth for each static test are
plotted with the analytical predictions in Figs. 22 and 23. The actual field test parameters used inca 1 cu 1 at i ng the theoret i ca 1 cu rve were summa ri zed previously in Table 1. For the cohension1ess soil, the theoretical curve underpredicts the actual lateral capacity of the post. This could have been caused by the vari at i on of the soi 1 propert i es after the soi 1 test samples were taken. The analytical model is also sensitive to the angle of internal friction. This parameter could only be estimated because of inconsistency of the cohesion1ess soil conditions. The predicted lateral loads for the cohesive soils closely followed the field load test results.
FIG. 21.-Lateral Load vs. Deflection for Post Embedded 38 in.
Legend
Test 4 Test 8
Test 12 Test 16
Des c r i pt ion
Test 4 - Timber post in cohesionless s~il
Test 8 - Timber post in c~hesive soil
Test 12 - Steel post in cohesionless soil
Test 16 - Steel- post in cohesive soil
6
•
5
I
4 I
U)
0-or-~
Analytical ~ Curve or-U ctj Cl. 3 Cohesionless Soil ctj u t
+-> Steel Post X U) • 0 Timber Post • 0..
.--ctj s-OJ
+-> ctj 2 .....J
1
10 20 30
Depth of Embedment (inches)
FIG. 22.-eomparison of Analysis and Field Load Tests 1-4 and 9-12
31
6
5
I I
I
4
V)
Cl.. or-~ Ana lyti cal
~ Curve or-U rtj Cl.. 3 Cohesive Soil rtj u +..> Steel Post X-V)
0 Timber Post • 0..
.--rtj s... OJ
+..> rtj
2 -'
1
10 20 30
Depth of Embedment (inche )
FIG. 23. -Comparison of Analysis and Field Load Tests5-8 and 13-16
32
Test Post No. Type
1 Wood
2 Wood
3- Wood
4 Wood
5 Wood
6 Wood
7 \lood
8- Wood
9 Steel
10 Steel
11 Steel
12 Steel
13 Steel
14 Steel
15 Steel
16 Steel -
TABLE 4
SUt·1f~ARY OF RESULTS
Soil '-1aximum * Type Force
(kips)
Cohesionless 1.20
Cohesionless 2.71
Cohesionless 2.92
Cohesion1ess 5.47
Cohesive 1.32
Cohesive 2.24 -
Cohesive 2.74
Cohesive 4.08
Cohesionless 0.86 -
Cohesionless 1.10
Cohesionless 2.51
Cohesionless 4.81
Cohesive 1.28
Cohesive 1.46
Cohesive 2.17
Cohesive 5.54
Energy** (kips-ft)
1.1
2.2
4.0
6.0
1.5
2.8
3.0
4.0
0.4
1.0
2.8
6.0
O.B
1.7
2.7
5.5
*Maximum force reached throug~l 18 inches of horizontal deflection. **Energy dissipated after 18 inches of horizontal deflection. -
33 i
TEST NO.
1
2
3 The values
5
6
7
TABLE 5
PERCENT OF STATIC POST TEST WITH AN EMBEDMENT DEPTH OF 38 INCHES
POST TYPE SOIL TYPE PERCENT OF MAXIMUM FORCE "<~'"~"",'''''--'-''''''''~"--~
Timber Cohesionless 21.9
Timber Cohesionless 49.5
Timber Cohesionless 53.4 above are percentages of test 4 •.
Timber Cohesive 32.4
Timber Cohesive 54.9
Timber Cohesive 67.2
The values above are percentages of test 8.
PERCENT OF ENERGY
--"~,~,,,,,,
18.3
36.7
66.7
37.5
70.0
75.0
"- .. ---.~~---~.--, ~,~~~~ -~.~
9 Steel Cohesionless 17.9 6.7
10 Steel Cohesionless 22.9 16.7
11 Steel Cohesionless 52.2 46.7
The values above are percentages of test 12. ~..-_,~_,~ ~_~,_v_.~_"-'--.~~,~, ____ . __ ., __ ......."" •. ~"
- --"-'-~~--""""""~---"---'-- -'~'-~.---".-~
13 Steel Cohesive· 23.1 14.5
14 Steel Cohesive 26.4 30.9
15 Steel Cohesive 39.2 49.1
The values above are percentages of test 16.
34
TABLE "6 - COMPARISON OF WOOD AND STEEL GUARDRAIL POSTS IN COHESIVE AND COHESIONLESS SOIL - STATIC AND IMPACT TESTS (Ref. 4)
STATIC TEST IMPACT TEST 17 MPH
TEST TYPE POST TYPE SOIL MAX. LOAD . MAX. ENERGY* ~'1AX. LOAD HAX. ENERGY* NO. KIPS KI P-FT KIPS KI P-FT
1 WOOD COHESIVE 3.7 4.2 16.3 19.2
2 STEEL COHESIVE 3.3 3.8 17.0 17.1
WOOD COHESIONLESS 3.2 4.4 .j 13.3 POST BROKE'
STEEL COHESIONLESS 3.3 4.2 ' 22.4 22.4
EMBEDMENT DEPTH - 38 IN., LOAD HEIGHT - 21 IN.
COHESIVE SOIL = 124 PCF C = 2 KSF
COHESIONLESS SOIL = 119 PCF ~ = 500
*MAX. POST DEFL. WAS 18 IN.
35
TABLE -:; - STRENGTH OF TU1BER GUARDRAIL POSTS IN ROCK - 12 IN. DIAMo HOLE 18 IN. DEEP
HOLE BACKFILLED WITH CONCRETE, SAND, LIMESTONE t CLAY (Ref. 5)
TEST TYPE POST TYPE SOIL NO.
IB WOOD ROCK-CONC.
28 WOOD ROCK-SAND
3B WOOD ROCK-LIMESo
48 WOOD ROCK-CLAY
36
STATIC TEST
MAX. LOAD MAX. ENERGY KIPS KIP-FT
9.9 2.7
8.5 3.5
8.4 3.2
11.4 4.2
I :
: MAX. DEFLo: MAX. DEFL. : , 3 TO 8 IN. t 10 TO 14 IN. I i . I I .... -- - - -- - - - - - - - - ... 1
CONCLUSIONS The conclusions that can be drawn from this research study are as
follows: 1. The analytical model can be used for the analysis of laterally loaded
guardrail posts. The comparison of the test results with the analytical predictions indicate that the analysis procedures are fairly reliable for short, free-ended, statically loaded piles (posts).
2. The static guardrail post tests conducted indicate that the steel posts tend to absorb 1 ess energy than timber posts. The cohesi ve soil dissipates more energy than cohesionless soil for posts embedded 18 and 24 in. For posts embedded 30 and 38 in., the cohesionless soil absorbs more energy. The amount of energy absorbed by the soil is significantly reduced by decreasing the embedment depth of the post.
3. It should be realized that the above results and conclusions are based on a 1 imited number of tests performed in the fi el d on the steel and timber posts. Due to the 1 imited time and resources available to the authors, repeatability of the tests was never verified. Dynamic field tests should also be conducted to verify the static test results.
RECOMMENDATIONS FOR FURTHER RESEARCH The following areas are recommended for further research: 1. The conclusi ons drawn from this research study were based on a
limited number of load tests conducted on steel and timber guardrail posts embedded with four different depths in two types of soil. To further support the findings of this study, additional load tests should be performed.
2. To verify the static load tests, dynamic field tests should be performed to study the dynamic behavior of guardrail posts under lateral loads.
37
REFERENCES
1. Broms, B., "Lateral Resistance of Piles in Cohesive Soils," Journal of
Soil Mechanics and Foundations Division, ASCE, Vol. 90, No. SM2, March
1964, pp. 27-63.
2. Broms, B., "Lateral Resistance of Piles in Cohensionless Soils," Journal
of Soil Mechanics and Foundations Division, ASCE, Vol. 90, No. SM3, March
1964, pp. 123-156.
3. Leps, Thomas M., "Revi ew of Shea ri ng St rength of Rock fi 11 ," Journal of
Soil Mechanics and Foundation Division, ASCE, Vol. 96, No. SM4, July 1970,
pp. 1157-1170.
4. Dewey, J. F., Jeyapalan, J. K., Hirsch, T. J., and Ross, H. E., "A Study
of the Soil-Structure Interaction Behavior of Highway Guardrail Post," TTl
Report No. 343-1 to SDHPT, Austin, Texas, July 1983.
5. Eggers, D. W., Hirsch, T. J., and Ross, H. E., "Strength of Guardrail Post
in Rock," TTl Report No. 343-1 Supplement to SDHPT, Austin, Texas,
September 1984.
38
APPENDIX A
SEQUENTIAL PHOTOGRAPHS FOR TESTS 5-16 (Tests 1-4 photographs are provided on colored slides)
lIE lIE Uouol CIOM, POOt _1119 _ for ollOrt (~' or _I _"ons of 1oI8GF at b"cIQl ando as _ .... wMr. in the plana. 6' ... 3- 'IKIClnq may be
_d on llIe o""'n."...... (ff".. a 'rafflc flaw
olandlllNnl} lild of 1oI8GF pIC ... d on roadways
1--------------'10"01111 with one-woy 'raf_,:.:fi.;.,C ....;OP.:;,;.;.;,.ro,;..I....;io....;"I;,;._ .,.... ______ -1 ~"orioDIO --l 25:";' ~;"...--------..,.-2 a' 12'OS"!!I-H--S'o3'~'03'~ . t-. S'o3~, '0 3"--j--S'o3"--l. ,
... ~~~====T~ _ •. ~_M.~ •• i_~.n.a.~I~~A~.C~ft~a'~S'~C'~'ia~n~::::::::IE::::====~ -- i ------------- 11 h-i ,--.". , , -' I i II I i I:
Ground line::::; "-T .. ",1Ita1 AIICIIO' Poll
and AIICIIOr
"NOTE: Tt'lil dunena.on measured to center of apitci wnen T"mlnot COfIfttCtor is wild.
T .... inol Rail
ELEVATION
tto-. '4· .. I··S~"
eoST CONNECTION
1'·0"
6" ft' I -'T,
il , l'oolEI ;;31
'SIOI 0/,' l 2~2'
BACK-UP PLATE
Oval Shouloer I 0
aullon Hlad m;1 rL-
~\6" Mln...::fi I '5/8" ~6" Min. -D <
ANCHOR OR SPLICE BOLT 5/8 " NUT POST BOLT: Simlla, UClpt Ilnot~
( 'l.'. H'Il bolfl requIted for Te .. mlnal CanNetOf' 1
I: Non-$plic. StHl Post Only
1. THE EXACT POSITlmJ OF C1l'AJW FENCE SHALL IE AS SMOW!t ELSnMOE ON' THE PLA.lfS 01 1.5 DJaEC'l'E;l !¥ TIft L"OGINUir.. GUARD nNe! SHALl. It TlA.-'SlTlONEO TU A SltOOl1I £OInIECT1OS Wl1'H OTH£i. GU •• D ,peE OR SrAucn:aE MI1.1NG AS SifO\o1( £LSEW£I£ ON' 'LANS.
2. AT THE OPTID:f OF THE COKtaAcroa THE &AlL ELIKDo7S roa THi CU4ID FfJfCE HAY IE FUIUnSHED n: tIT1IU 12 1/2 Oil 2.5 rOOT NOH1IU.L LENGTHS WiTH POST JOLT SLOTS 'oa COllN!~:T10Jij TO POSHi.
J. 101.1S SKALL 1£ OF SUFFICIEKT LINCTH to DTJ!51) TItJIDUGII THE ruu.. TlUCIlIISS DF THI NL'l AND XO JiIOR[ TKA.~ 3/1." 10050 If.
4. 'IlIE TOP OF 'nit -rn. ... HW. MCHOl POST AND ALL S1'ItL FlttllGS 't1IIIao. SMAlL It C.\LYMI%!D A "INUll'M OF 10" AS SNOWS.
WOOD POST Wood Poet 1oI0y ae DOllied
or 8e.eled
P~ST CONNECTION rEEL POST
5. WHDE SOLID lOCK IS_DlcomcrEAED DR Wilt lHOW1C ON THE ,!.US. tHE lUNlUEit OF THE HOLES SHALL 1£ APPaoxlMATELY 12 INCHE5. THE J.\OCFILLING SKALL IE VI1'1l .\ CotiESIONL£.~S MArEKlAL. A!iD EMIIlItDIT Dune !UW.L 1£ 1'.6" 0& HOU AS D1UtTEa IY TIll &Gliln. TUdin POITS SHALLxot IlStT Ui CONCRETE.
NOTE, Thil ". ,....,.. 4 .... 110110' HOleS (S,,", or field) It, _ T.,fluftcU ROlf ...... Hr .al'l 8-"''' IIIIHa end Y."a,fI., Pt .... n .... ,.forat1H"'-"t.
TERMINAL CONCRETE ANCHOR
OPTIONAL TERMINAL ANCHOR POST NOTE· ThiS Ootlonat Po" ra •• ., .. tN ItW of the 10 Ga. T."" .... ' CONIeCfor .rtll 4- ~.M Botll for otlacflflteftt to IN AMho, Pesf.
NOTE- Eillte, Post _y bit UNci wilh
.lthe, Anchor. No Construction .Ioint
i. 011_ in 'lie Concr.te AnClIOr. T .. ",inol Rail _y bit IIollld to
Post OM in 'wist pOSition prior to plaCin9 Conc,.te AnChar. UP ... ' 10· IMin.1 of A_or Post ...... , bit Gel.enized.
WOOD LINE POST NOTE <D' Wllere 0 _inal lall\llh of 5'-S' il ~fild as _ta .... III_I in lite plana. ,_ 11._ ... _ ,hall be ,educed by 0' 0 6".
ELEVATION OF NOMINAL 12 "2 FOOT GUARD RAIL
125 F __ ion, lftOy also bit IUPIIlildl
FIG. 36.-Specifications for Metal Beam Guard Fence
•• 1111 1'EJfIIXAl. NiOlOl POSt SItALL IE SET ue CLASS "".". ..... 01 "e- COKIET! UI ACCOILUI.IK:E WlTlI ITtH. "COJICatTt FOJI SnllC'l'1!HS". 01 SET IlII CQtIICUf[ Ix ACaWMlCC! VITtI lTCi "CONCUTE
;=~"iAJ~~S~ :~'~~D-~~ THE 110 Itp UQU,altilO toIfsnUCflON OF "M
1. TIMlII I'OSTS MAY II nnUD AT APPllDXlMT!LY 10 -D!GIIr:s ~ till TOP 011 JCmf DDS 1lT1lI HU'H S1DI OF TOP OF posy PLACEDTow.uD THE IlOAllWA'I' 01 THEY mv ItDOltW. WMES".lUCkEDurT". T1t! CPP£W PORTIO!{ 0," TH! POST SKAU. It ltOTCHED )/4" To PlOVU,[ rtAi SUlFAtE fOR TJMlll SPACEK. It Touauct OF !. liS" WILL .IE P!"'lITTtD 0tI tilE !l:JTQW) POITIOlf or THE POSJ.
I. :l~c:r:.EAS~u!.0i~ ~~=I::r"':""~Q:~ alUtn or ... a.wICTI011 SIMIS.AJ 1"0 Tal
9. S'lelA!. 'AilleATI_ VU.1 •• UQWUD LX USTAUATlOII5 )lAY'" " CURYA1UU OF un l'IIU 1~' aADl1:S.
POST SPAtllCC WILL IE •• - 3" UClPT TlL\T nrt: "1ST POST V1LL IE 2" ,.(It TM£ TlllJIKA&. AJIOIott POST ""'D ilI£ !IIXl T.oo POSTS S.ACID AT 12' - ." WIlll A "1.1_ or I POStS AIUAC!XT 11\ stal:CTUau SPACED AT 3' ... 1 1/2",
STEEL POSTS SKAU. IE ILOCUD ot'T. A "".S 011 .,..,.0 S1'UL S'ACU SMALL II USED Villi STU!. POSTS. JACI( ... tP PLATES SMALIlIE PJOVIDlD AT UCTUICEDlATE ' .... sma) Inti. POSlS.
=~~~~ci:C;I:': :~"WtlS~~t~~ ..... x 6" Jl 110· TUAJEU L'XL!S5 OTftEIWlst SMDW!t 111 TIll Pu."iS. CCAAD: met PLACED IS nil. VJelKITV or a:aas SMALL IE
~l:~~~~~~~~!lio!~=~1:~:~fL.!s:~T~sl~~:!p~~~t:T~;L. ."lLDED- STElL POSTS A.''D SP.lC!k5: SHAll. MEET nit aEQUlltMEJm; Of' ASnt A-7l9. TIl!: Fl.lNCE WrDTH A.'i:D THICXXESS. wn nnex_E5S. A.:m nE'TN (IF wu.Dm 1'OS1s ... "Gas PALL EQUAL oa UCUD THE nIM!XSloss or A. srAJiDAID lOLLED ",.I.!!.
STEEL POSTS NOD SPACERS SHALL Mttr TH! UQUIADIPTS Or ASTM .... 36. IOJ.T. JIOLES IlIAI.L H "Pf'lWKJllAtELY CIXtUED J£1'WtD WEI AU -moE. OF FUIKOE OF I'ACDS AD ?OITS. tNLESS ontElNlSE 5JKIIo-~ 1!C THE l"LA.'5. MIG' 5ftAU. It Pu.cm Ult1l TIE fACE or UIL DII!CTLY AIOVE THE SH01.iLDU EDCE {OltCUIJFACtl llClPT 1lIt 25' ttlKlJW.dCIIOIt5!CTljJhA."tDADJACE!O" 2V 0" Mltif SHAU. IE n..u.ED AT 25:1 (LONGfTt.'DtSAL:1Atf.1W.) TO PIOVIDI It. 2' o"!'E! IETWUJC
::~:s~!c~p. ~~ 7~i~~~:':"::~~;Ft~:nr:.:~ ~:S~=J:~~ OF
G!JAIO FDCE.
WASHEa5 USED WITH THE ElGIIT "8" !-PUC! 101.:1'5 AIC1) 1Il'TS 1U.T AU PIllIV1Dm 101 TEDIIW.. CO!fJfECTOI5 o\. ... D'OI. TEIDIJJOIt.L -"'otDJ POSTS SHALL IE. 1 3'4" x 3" xl/I'''. 01 tOO J.D. AtiD 2" o.D • ., 0.114" (""lSI 1t".2) JlAJUKlW tyPE A rUUI VA!ldtS.
STATE DEPARTMENT OF HIGHWAYS AND PUBLIC TRANSPORTATION