i THE EFFECTS OF EXTENSIVE MUSICAL TRAINING ON TIME PERCEPTION REGARDING HEMISPHERIC LATERALIZATON, DIFFERENT TIME RANGES AND GENERALIZATION TO DIFFERENT MODALITIES Thesis submitted to the Institute for Graduate Studies in Social Sciences in partial satisfaction of the requirements for the degree of Master of Arts in Cognitive Science by Emre Sevinç Boğaziçi University 2007
Transcript
i
THE EFFECTS OF EXTENSIVE MUSICAL TRAINING ON TIME
PERCEPTION REGARDING HEMISPHERIC LATERALIZATON, DIFFERENT
TIME RANGES AND GENERALIZATION TO DIFFERENT MODALITIES
Thesis submitted to the
Institute for Graduate Studies in Social Sciences
in partial satisfaction of the requirements for the degree of
Master of Arts
in
Cognitive Science
by
Emre Sevinç
Boğaziçi University
2007
ii
The Effects of Extensive Musical Training on Time Perception Regarding
Hemispheric Lateralization, Different Time Ranges and Generalization to Different
Modalities
The thesis of Emre Sevinç
has been approved by:
Prof. Dr. Reşit Canbeyli (Thesis advisor) ____________________ Prof. Dr. Cem Say _____________________ Assist. Prof. Dr. Burak Güçlü _____________________ Assist. Prof. Dr. Esra Mungan _____________________ Dr. Ayşecan Boduroğlu _____________________
September 2007
iii
Thesis Abstract
Emre Sevinç, “The Effects of Extensive Musical Training on Time Perception
Regarding Hemispheric Lateralization, Different Time Ranges And Generalization
To Different Modalities”
Time perception and estimation are very important aspects of human behavior.
Whether these are based on a single internal clock or the result of distributed and
emergent processes in the brain is still a matter of debate. The present thesis
investigated the effects of lateralized presentation of auditory and tactile stimulation
to assess whether time estimation is lateralized and affected by stimulus modality.
Additionally, performances of both female and male trained musicians were
compared to those of non-musicians to evaluate the effects of gender and training in
time estimation. In an identical subject design, subjects attended a time duration
comparison task for short (100 to 900 milliseconds in 50 milliseconds increments
with a standard stimulus of 500 msec) and long ranges (1 to 5 seconds in 250
milliseconds increments with a standard of 3000 msec) in auditory and tactile
modalities. Subjects listened to pairs of sounds either monaurally or binaurally and
indicated whether the two stimuli were of equal duration. Tactile (vibratory) stimuli
were applied on the top of either the right or the left hand. Stimulus pairs were
presented in ascending or descending order. The results suggested a gender
difference; males were more accurate in time estimation. Gender differences may be
due to different corpus callosum sizes between males and females. Findings also
suggested that musicians were more accurate except for the short tactile range. Better
performance by musicians in both modalities suggests that time estimation in one
iv
modality can be generalized to others. Additionally, an analysis of estimation errors
compared to the standard durations (percent of error) indicated that overall
performance was better in the long range. There was no significant laterality effect
except for long range tactile condition. Better overall performances of subjects in
estimating the longer standard duration suggest that there may be different timing
mechanisms in the brain, such as for long ranges which may include cognitive
processes and for short ranges that are more low-level (sensory) and automatic. The
present results also provide support for the view that the brain does not have a
lateralized internal clock.
v
Tez Özeti
Emre Sevinç, “Kapsamlı Müzik Eğitiminin Hemisferik Yanallaşma, Farklı Zaman
Erimleri ve Farklı Modalitelere Genelleştirilmesi Bakımından Zaman Algılamasına
Etkileri”
Zaman algılaması ve kestirimi insan davranışının çok önemli bileşenlerinden olup
beyindeki tek bir içsel saate mi dayandığı yoksa dağıtık süreçlerden mi
kaynaklandığı halen tartışma konusudur. Bu tez zaman kestiriminin uyarım
modalitesi ve hemisfer yanallığına dayalı olup olmadığını değerlendirmek için
yanallaşmış işitsel ve dokunsal uyarımların etkilerini inceledi. Ek olarak, cinsiyet ve
eğitimin zaman kestirimindeki etkilerini değerlendirmek için eğitimli kadın ve erkek
müzisyenlerin performansı müzisyen olmayanlarla karşılaştırıldı. Özdeş bir denek
tasarımında, denekler, işitsel ve dokunsal olarak kısa (standart uyaran 500 milisaniye
olacak şekilde 100’den 900 milisaniyeye 50 milisaniyelik artırımlarla) ve uzun
(standart uyaran 3000 milisaniye olacak şekilde 1’den 5 saniyeye 250 milisaniyelik
artırımlarla) süreli aralıkları içeren süreleri karşılaştırdılar. Denekler tek kulaktan
(sağ ya da sol kulak) veya çift kulaktan ses çiftlerini dinleyip bunların sürelerinin
aynı olup olmadığını belirttiler. Dokunsal (titreşimsel) uyaranlar sol ya da sağ elin
üst kısmına uygulandı. Uyaran çiftleri artan ve azalan dizilerde sunuldu. Sonuçlar
cinsiyet farklılığı göstermedi; erkeklerin zaman kestiriminde daha hassas olduğu
saptandı. Cinsiyet farklılığı erkekler ve kadınlar arasındaki corpus callosum
boylarının farklılığından kaynaklanıyor olabilir. Bulgular kısa süreli dokunsal görev
haricinde müzisyenlerin daha hassas olduğunu da gösterdi. Müzisyenlerin daha iyi
performansı, bir modalitedeki zaman kestirim performansının başka modalitelere de
vi
genellenebileneceğini göstermektedir. Buna ek olarak, kestirim hatalarının standart
uyaran sürelerine oranlarına dayalı (hata yüzdesi) analizleri, deneklerin
performanslarının uzun sürelerde daha iyi olduğunu gösterdi. Uzun süreli dokunsal
görev haricinde bir yanallık etkisi gözlemlenmedi. Sonuçlar müzik eğitiminin zaman
kestirim performansını da etkilediğini ve işitsel olarak gerçekleşen bu eğitimin farklı
modalitelere genellenebileceğine işaret etmektedir. Deneklerin genel olarak uzun
sürelerde daha iyi performans göstermeleri ise beyinde farklı mekanizmalar
olduğuna, uzun süreli zaman kestirimi için bilişsel süreçleri de içeren, kısa süreler
için ise daha düşük seviyeli (duyusal), otomatik süreçlere dayanan mekanizmalar
olabileceğini göstermektedir. Çalışmanın sonuçları beyinde belli bir bölgeye
özelleşmiş bir saat olmadığı görüşünü desteklemektedir.
vii
ACKNOWLEDGEMENTS
I first would like to thank my thesis supervisors, Prof. Dr. Reşit Canbeyli
and Prof. Dr. Cem Say, for their support during the preparation of this thesis. I also
would like to thank Assist. Prof. Dr. Burak Güçlü for his support throughout the
project. Their guidance and comments improved the scope and quality of this thesis.
I would like to thank Prof. Dr. Sumru Özsoy for the support she
had provided during my studies in the Cognitive Science Department. I also thank all
faculty members contributing to the program.
Many thanks to my friend Nalan Saraç for telling me about this program in
the first place. I also want to thank my friend and business partner Memduh Er for
giving me the courage to apply, and supporting me during hard times. Another
source of support and courage was my friend Tolga Kürkçüoğlu. My dear brother
Ergin Sevinç was always there when I needed him, thanks to him, too.
This thesis is dedicated to my mother Drita Işık Sevinç and my late
grandfather Şaban Sevinç.
viii
CONTENTS
INTRODUCTION 1
Perception of Time ---------------------------------------------------------------------------- 2
Hemispheric Communication, Lateralization and Learning of Temporal Processing5
Generalization of Temporal Processing and Search for Different Time Ranges ----- 7
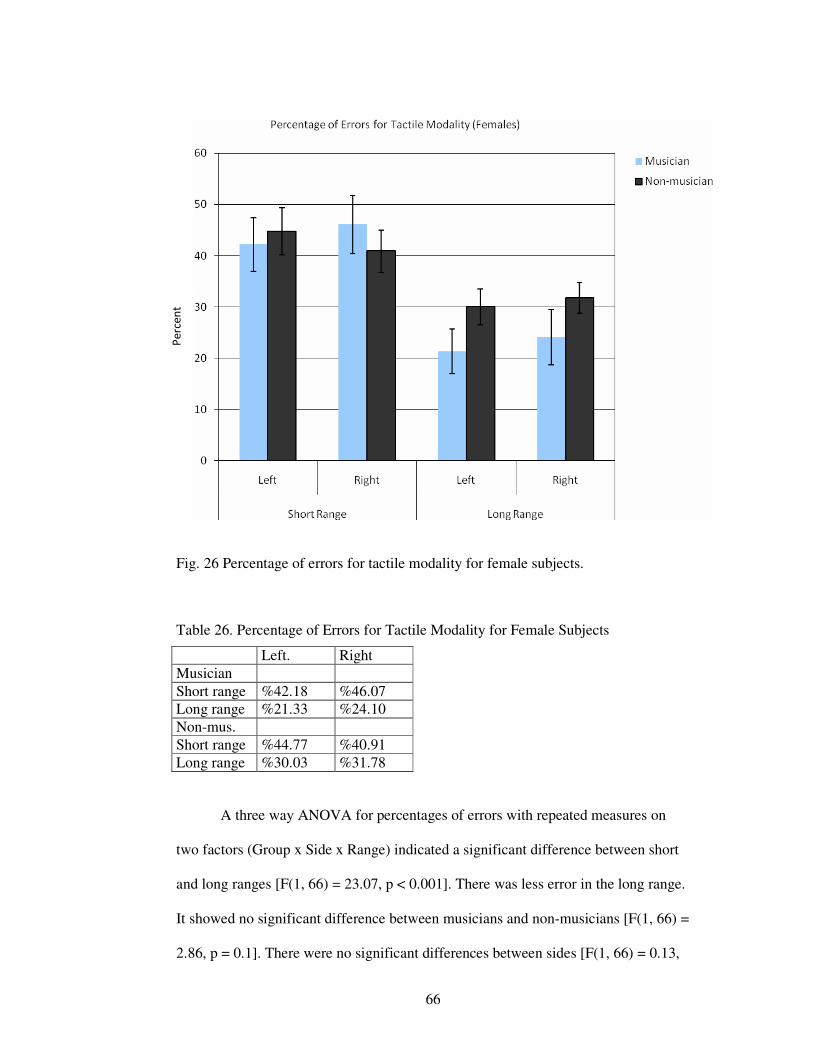
1. The absolute average times (in milliseconds) at which female subjects decided that the tones were of equal length for ascending and descending tone sequences. .........24 2. The absolute difference between the female subjects’ decision and the standard stimulus (3000 msec.) for ascending and descending tone sequences. .....................26 3. The average of ascending and descending sequences’ absolute difference between the female subjects’ decision and the standard stimulus (3000 msec.). ....................27 4. The absolute average times (in milliseconds) at which male subjects decided that the tones were of equal length for ascending and descending tone sequences. .........29 5. The absolute difference between the male subjects’ decision and the standard stimulus (3000 msec.) for ascending and descending tone sequences. .....................31 6. The average of ascending and descending sequences’ absolute difference between the male subjects’ decision and the standard stimulus (3000 msec.). .......................32 7. The absolute average times (in milliseconds) at which female subjects decided that the vibrations were of equal length for ascending and descending vibratory sequences................................................................................................................34 8. The absolute difference between the female subjects’ decision and the standard stimulus (3000 msec.) for ascending and descending vibratory sequences. ..............36 9. The average of ascending and descending sequences’ absolute difference between the female subjects’ decision and the standard stimulus (3000 msec.). Lower numbers mean better interval time discrimination. ..................................................37 10. The absolute average times (in milliseconds) at which male subjects decided that the vibrations were of equal length for ascending and descending vibratory sequences................................................................................................................39 11. The absolute difference between the male subjects’ decision and the standard stimulus (3000 msec.) for ascending and descending vibratory sequences. ..............41 12. The average of ascending and descending sequences’ absolute difference between the male subjects’ decision and the standard stimulus (3000 msec.). Lower numbers mean better interval time discrimination. ..................................................42 13. The absolute average times (in milliseconds) at which female subjects decided that the tones were of equal length for ascending and descending tone sequences....44 14. The absolute differences between the female subjects’ decision and the standard stimulus (500 msec.) for ascending and descending tone sequences. .......................46 15. The average of ascending and descending sequences’ absolute difference between the female subjects’ decision and the standard stimulus (500 msec.)..........47 16. The absolute average times (in milliseconds) at which male subjects decided that the tones were of equal length for ascending and descending tone sequences. .........49 17. The absolute difference between the male subjects’ decision and the standard stimulus (500 msec.) for ascending and descending tone sequences. .......................51 18. The average of the absolute differences for ascending and descending auditory short range sequences for male subjects. .................................................................52 19. The absolute average times (in milliseconds) at which female subjects decided that the vibrations were of equal length for ascending and descending vibratory sequences................................................................................................................54 20. The absolute difference between the female subjects’ decision and the standard stimulus (500 msec.) for ascending and descending vibratory sequences. ................56
x
21. The average of ascending and descending sequences’ absolute difference between the female subjects’ decision and the standard stimulus (500 msec.)..........57 22. The absolute average times (in milliseconds) at which male subjects decided that the vibrations were of equal length for ascending and descending vibratory sequences................................................................................................................59 23. The absolute difference between the male subjects’ decision and the standard stimulus (500 msec.) for ascending and descending vibratory sequences. ................61 24. The average of ascending and descending sequences’ absolute difference between the male subjects’ decision and the standard stimulus (500 msec.).............62 25. Percentage of errors for auditory modality for female subjects. .........................64 26. Percentage of errors for tactile modality for female subjects..............................66 27. Percentage of errors for auditory modality for male subjects. ............................68 28. Percentage of errors for tactile modality for male subjects.................................70
xi
TABLES
1. Absolute Times for Long Range Auditory Signals in Ascending and Descending Order for Female Subjects ......................................................................................24 2. Absolute Differences for Long Range Auditory Signals in Ascending and Descending Order for Female Subjects ...................................................................26 3. The Average of the Absolute Differences for Ascending and Descending Auditory Long Range Sequences for Female Subjects ...........................................................27 4. Absolute Times for Long Range Auditory Signals in Ascending and Descending Order for Male Subjects ..........................................................................................29 5. Absolute Differences for Long range Auditory Signals in Ascending and Descending Order for Male Subjects.......................................................................31 6. The Average of the Absolute Differences for Ascending and Descending Auditory Long Range Sequences for Male Subjects...............................................................32 7. Absolute Times for Long Range Tactile Ascending and Descending Order for Female Subjects......................................................................................................34 8. Absolute Differences for Long Range Tactile Ascending Order for Female Subjects ..................................................................................................................36 9. The Average of the Absolute Differences for Ascending and Descending Tactile Long Range Sequences for Female Subjects ...........................................................37 10. Absolute Times for Long Range Tactile Ascending and Descending Order for Male Subjects .........................................................................................................39 11. Absolute Differences for Long Range Tactile Ascending Order for Male Subjects...............................................................................................................................41 12. The Average of the Absolute Differences for Ascending and Descending Tactile Long Range Sequences for Male Subjects...............................................................42 13. Absolute Times for Short Range Auditory Ascending and Descending Order for Female Subjects......................................................................................................44 14. Absolute Differences for Short Range Auditory Ascending and Descending Order for Female Subjects ......................................................................................46 15. The Average of the Absolute Differences for Ascending and Descending Auditory Short Range Sequences for Female Subjects ............................................47 16. Absolute Times for Short Range Auditory Ascending and Descending Order for Male Subjects .........................................................................................................49 17. Absolute Differences for Short Range Auditory Ascending and Descending Order for Male Subjects ..........................................................................................51 18. The Average of the Absolute Differences for Ascending and Descending Auditory Short Range Sequences for Male Subjects................................................52 19. Absolute Times for Short Range Tactile Ascending and Descending Order for Female Subjects......................................................................................................54 20. Absolute Differences for Short range Tactile Ascending and Descending Order for Female Subjects ................................................................................................56 21. The Average of the Absolute Differences for Ascending and Descending Tactile Short Range Sequences for Female Subjects ...........................................................57 22. Absolute Times for Short Range Tactile Ascending and Descending Order for Male Subjects .........................................................................................................59 23. Absolute Differences for Short Range Tactile Ascending and Descending Order for Male Subjects....................................................................................................61
xii
24. The Average of the Absolute Differences for Ascending and Descending Tactile Short Range Sequences for Male Subjects...............................................................62 25. Percentage of Errors for Auditory Modality for Female Subjects.......................64 26. Percentage of Errors for Tactile Modality for Female Subjects..........................66 27. Percentage of Errors for Auditory Modality for Male Subjects ..........................68 28. Percentage of Errors for Tactile Modality for Male Subjects .............................70
1
CHAPTER 1
INTRODUCTION
Time estimation is one of the most important aspects of human behavior in general
and human cognition in particular. Since the human brain does not seem to be
equipped with a high precision clock that records time intervals and compares them
with the previous ones, time for us is not an accurate and absolute measure, but
always an estimation of an objective physical property.
What makes the issue even more complicated is that time is not in the same
category with light, sound, physical pressure, etc., all of which can be sensed and
perceived directly. We have sensory organs to detect subtle changes in terms of
visual, tactile or auditory stimulation; however, there is no time-sensing organ in our
body, yet time estimation and discrimination are implicit in many of the tasks
humans perform daily. Without timing mechanisms it is not possible to detect the
location of a sound source, produce and understand speech, make music, drive an
automobile, engage in sports, sleep and wake up.
Some of the tasks described above span a very wide range of time interval
estimations. For example, finding the location of a sound source takes a temporal
processing in the range of microseconds (Middlebrooks & Greenhaw, 1991),
whereas speech or music related timing is in the milliseconds range (Masaki,
Kashioka, & Campbell, 2002). On the other hand, deciding when to make a right
move in some sports, estimating how long a musical piece one has just listened to
lasted, and guessing how long a speech took needs temporal processing in the range
2
of seconds to minutes. Finally, the biological clock that regulates our circadian
rhythms works in the range of approximately 24 hours (Halberg & Cornélissen,
1994; Rietveld, 1996).
Perception of Time
The diversity of the phenomena of time perception in many different tasks such as
sound localization, speech production and music performance has drawn a lot of
interest in research since the early days of psychophysics and cognitive science. By
observing performances of humans in different areas as mentioned above, it is easy
to see that humans can estimate time ranges with relative accuracy. It is clear that if
we could not make such estimations this would have drastic negative effect in many
daily tasks including motor-control related activities. Two of the most important
questions regarding time perception can be stated as “how can humans estimate time
in different ranges with relative accuracy?” and “what is the source of variability in
humans’ estimations of time?”
Early models of time perception tried to answer the above questions in terms
of a single internal-clock hypothesis (see Grondin, 2001 for a review). It was
assumed that the brain somehow had a clock mechanism such as a pacemaker-
accumulator system. The pacemaker ‘module’ was responsible for emitting pulses
which the accumulator collected, leading to perception of time. The accuracy and
variability of timing were related to the clock frequency. Changes in the clock
frequency would account for differences in time perception. Variability would be
explainable by stochastic processes of the clock, e.g. by a Poisson process.
A similar biological timing model based on Gibbon’s scalar expectancy
theory proposed to explain timing in animals (Gibbon, 1977). The clock based model
3
of Gibbon and Church comprises three main processes (Gibbon & Church, 1984),
namely the clock process, memory process and decision processes. The clock process
includes a pacemaker, a switch and an accumulator. As stated above, the pacemaker
emits pulses according to some predefined frequency model and these are switched
into the accumulator. The memory process is where the information from the
accumulator is passed on to the working memory and then carried to the reference
memory and the decision process. The final component, the decision process,
includes a comparator which receives information from working memory and
reference memory, compares them and produces a yes / no answer based on the
equality of magnitude of time estimations from those memories.
This model was one of the important contributions to animal and human
timing even though its main theme was to provide a pure mathematical model which
would fit experimental data. Although there is current research to provide
neurological plausibility for this model (Matell & Meck, 2000), its assumptions of an
internal clock, and a pacemaker-accumulator place a heavy practical burden because
no central clock has yet been found in the brain. Since time estimation and
perception are essential to and implicit in many different tasks, it is very doubtful
that a specific part of the brain is dedicated to this kind of processing.
In addition to the problems mentioned above, from an evolutionary
perspective, such a model is more in line with a predefined precise design and is not
compatible with the brain's redundancy for various tasks. It also does not take into
account the problem of different performance in characteristics for different time
range estimations which is the case for time perception and estimation in humans.
There are also other models that try to account for the experimental timing
data which do not assume an internal clock. For example, Dragoi et. al., 2003,
4
provide a two-unit artificial network and related differential equations for the
dynamics of the network. This model does not assume any internal clock, multiple
oscillators or any explicit time based comparison process. Although lack of such
assumptions provides strong points for the model, it still suffers from
neuropsychological plausibility. Even though the authors give a detailed
mathematical model, they do not suggest which parts or mechanisms of the human
brain their model’s components would correspond to. In addition, they also suggest
that at least two extra oscillators are needed for their model to be able to explain the
multiple timing phenomena in which two time intervals can be independently and
simultaneously timed by animals.
Fortunately these are not the only types of theories in the field of time
perception and estimation research. There are population clock models and
simulations that, in addition to not assuming any explicit internal clock, take into
account the properties of real neuron cell assemblies (Buonomano, 2005;
Buonomano & Karmakar, 2002; Eagleman, et al., 2005). In this type of models,
information related to time is not explicitly stored or “counted” in the central nervous
system, but emerges as the “product” of the interaction of neurons. Such models are
supported by interval timing experiments in the range of milliseconds. Because they
do not suppose a centralized clock-like mechanism, and are based on biologically
plausible neural simulations, they are more compatible with the current view of brain
anatomy and functionality. Since this modeling approach is rather generic in terms of
neurons, it may account for the diffuse system of different brain structures that are
related to timing such as basal ganglia, cerebellum, supplementary motor area,
striatum, dorsolateral prefrontal cortex and parietal cortex.
5
Hemispheric Communication, Lateralization and Learning of Temporal Processing
The human brain is comprised of two hemispheres which are mainly connected by
the corpus callosum, a large tract of nerve fibers. Even though both hemispheres
seem to be symmetrical to a first approximation, there are functional and anatomical
asymmetries (Hellige, 2001). For example, most human brains have a wider frontal
region in the right hemisphere whereas the frontal part of the left hemisphere is
narrower and its rear part, the occipital region, is slightly wider (Hellige, 2001). This
anatomical asymmetry of cerebral hemispheres is sometimes called the
“counterclockwise torque” as if the brain was subjected to an angular force in the
counterclockwise direction. Another anatomical asymmetry is related to the Sylvian
fissure (lateral fissure) which is a boundary mark above the temporal lobe and
between the frontal and parietal lobes. Generally the Sylvian fissure is longer and
straighter in the left hemisphere and a bit shorter and more curved at its posterior tip
in the right hemisphere (Hellige, 2001).
In addition to the anatomical asymmetries described above, there are also
functional asymmetries in the brain. For example, areas related to speech production
and understanding, such as Broca’s and Wernicke’s areas, are found in the left
cerebral hemisphere of the brain (Hellige, 2001).
Hemispheric communication and lateralization add to the complexity of
psychological time perception. Presently, there is no consistent model which
accounts for different temporal processing data. Traditionally, it is strongly believed
that the left hemisphere has an advantage in rapid temporal processing, specifically
in the range of milliseconds because of the linguistic specialization of the left
6
hemisphere (Elias, Bulman-Fleming, & McManus, 1999). On the other hand, there is
evidence that the right hemispheric cortical networks, especially the right
dorsolateral prefrontal cortex, and the right inferior prefrontal cortex receive focus
for temporal processing in the millisecond to second range (Belin, et al., 2002; Rubia
and Smith, 2004). In addition, a recent visual temporal processing experiment in
which a split-brain patient took part reports a clear right hemisphere advantage in
processing time intervals in the range of a few milliseconds (Gazzaniga, Corballis, &
Funnel, 2003). In the reported work, two experiments were conducted. In one, pairs
of black circles were presented simultaneously, during half of the trials both of them
stayed on the computer monitor for the same amount of time and in the other half
they had different durations of visibility. In the first half, both circles stayed on the
screen for 200 milliseconds. In the second half, one of the circles stayed for 200
milliseconds and the other circle stayed for less than 200 ms by 24, 36, 48, 60 or 72
milliseconds for 240 trials in total (120 for each visual field). The split-brain patient
was instructed to press the keys denoting “yes” if he thought that the circles stayed
for the same amount of time, or press another set of keys denoting “no” if the circles
stayed on the screen for different amounts of time. The result was that the subject’s
right hemisphere had an advantage and better performance than the left hemisphere
in duration comparisons. Results of this research were against the view that left
hemisphere was solely specialized for temporal processing. As mentioned earlier,
that evidence was supportive of the idea that temporal processing which is implicit in
so many different cognitive tasks cannot be localized to a region within one
hemisphere.
Notwithstanding the surprising evidence for right hemispheric advantage
related to temporal processing, there is evidence for left hemispheric advantage in
7
different modalities of temporal processing such as brief tactile stimuli. For example,
when vibrations that lasted for 120 milliseconds and contained 6 msec. or 18 msec.
gaps (in the middle of the vibration) were applied unilaterally to the hands of 30 first
year university students, it was observed that there was a left hemisphere advantage:
the left hemisphere’s brief temporal gap detection performance was better than the
right hemisphere’s (Nicholls & Whelan, 1998).
Generalization of Temporal Processing and Search for Different Time Ranges
There is also the issue of generalization of temporal processing experience and how
that relates to hemispheric lateralization. The neural population clock model of time
perception briefly described in the previous section predicts that exercise must have
an effect on temporal processing. In line with this idea, there is evidence that the
human brain can generalize temporal processing to different modalities or different
qualities. It has been found that practicing temporal interval discrimination tasks (in
the range of hundreds of milliseconds) can generalize to different spectral auditory
markers (Wright, et al., 1997). In that study, 14 subjects were trained for one hour
per day for 100 msec intervals for ten days, and then their performance in a temporal
interval discrimination task was measured. The task was to discriminate a temporal
interval of 100 msec bounded by very short 1 Khz tones from longer intervals. It was
found that the trained subjects were able to detect 100 msec intervals bounded by
different frequencies of short tones; however, they were not able to generalize this to
the untrained intervals such as 50, 200, or 500 msec. This study suggested that
discrimination of auditory time intervals developed with a short period of training
and this type of learning was specialized temporally but not spectrally.
8
Another study also suggested that short period of practice of interval timing
improved performance and this ability generalized across different modalities,
hemispheres and skin locations (Nagarajan, et al., 1998). The authors trained 22
subjects for 10 to 15 days for tactile temporal interval discrimination task. Subjects
were provided with two mechanical vibration pulses to their palm (thenar eminence)
that were separated by a fixed amount of time and then another pair of same modality
of pulses which were separated by a longer target duration. They were asked to
indicate which of the pairs was separated by the target (longer) duration. Once their
temporal discrimination threshold was determined, they were trained for 900 trials
everyday for 10 to 15 days. After the training, it was found that the subjects were
able to do the similar discrimination task for the vibrations applied to other parts of
the body such as different fingers and contralateral hands. They also showed similar
performances for the durations that were defined by auditory signals. However the
trained subjects were not able to generalize across different temporal intervals. These
results suggest that even though similar time estimation mechanisms may exist in the
brain for different sensory modalities, a central internal clock model is not adequate
because it does not account for such generalizations and learning of interval timing.
Gender Differences
The question “is there a difference between genders regarding time estimation?” does
not have a definitive answer. First of all the issue of brain asymmetry between
genders is not a settled one. This is important because if the time estimation
mechanism (or mechanisms) is distributed in the brain, then this may be affected by
various asymmetries between genders.
9
Even though meta analyses do not provide conclusive evidence for detailed
gender based brain asymmetries (Hellige, 2001), there are data which suggest that in
some conditions such as auditory signal based time estimation, there are gender
differences (Dolu, et al., 2004), suggesting that males are more accurate in
prospective time estimation. Another study also provides evidence for better
performance of males in time duration judgments (Loftus, et al., 1986). In addition, a
review by Block, Hancock, and Zakay shows that there is some small but significant
difference between genders in terms of prospective time estimation where subjects
are previously informed that they would be making duration judgments (Block,
Hancock, & Zakay, 2000).
There is also different evidence for hemispherical connectivity and corpus
callosum differences between genders. For example a study by DeLacoste-Utamsig
& Holloway provides evidence for larger splenium in the females (DeLacoste-
Utamsig & Holloway, 1982). However another study by Jäncke and Steinmetz casts
doubt on that evidence by failing to find evidence for significant gender differences
in terms of corpus callosum shape and size (Jäncke & Steinmetz, 2003).
Thus it is reasonable to investigate the effect of gender in time estimation
using different ranges, modalities and sides by having gender balanced experiment
groups.
Using Music Experience
The previous sections provided evidence that humans can handle temporal
processing tasks better if there had been some previous practice. There is also a
generalization to different modalities, hemispheres and markers (intramodal
differences) but not to different intervals.
10
Using some aspect of temporal expertise as in extensive professional music
training can shed light on important aspects of temporal processing in the human
brain. Since musical temporal processing is in the range of milliseconds, people who
are music experts are good candidates to investigate the models and hypotheses of
time perception, cross-modal interval estimation generalization, and hemispheric
lateralization.
Previous studies provide data that show that even though musical abilities
such as tonal processing (both low level pitch processing and high level melodic
processing) and rhythmic processing are generally located in the right hemisphere for
non-musicians, extensive professional musical training leads to the left hemisphere
dominance for musical processing (Bever & Chiarello, 1974). These data lead to the
prediction that people who are experts in temporal processing in the range of
milliseconds must be able to do successful time discrimination judgments (in the
range of tens of milliseconds to hundreds of milliseconds) for different modalities
(e.g. auditory, tactile) and hemispheres. Another prediction is that, musical
performance is related to the range of milliseconds and since, as stated in the
previous section, that temporal processing practice does not generalize to different
intervals, professional musicians are not expected to differ from non-musicians for
temporal stimuli in the 1 second to 5 second range. There is also evidence suggesting
that auditory temporal processing happens on two different timescales, 25-50 msec
and 200-300 msec (Boemio, et al., 2005).
In the light of these ideas, an experimental task was designed to investigate
the effects of musical training on timing mechanism and laterality. The task was to
make time estimations in two different time ranges (short and long) for two
11
modalities, tactile and auditory. To investigate the potential effects of laterality,
stimuli were applied to the left side and the right side of the body.
The following were the hypotheses to be tested based on the current time
perception framework using the experimental task mentioned above:
1. Professional musicians (M) will perform better in temporal discrimination
tasks that are in the sub-second range compared to non-musicians (NM). This
means that musician’s errors are going to be smaller compared to non-
musicians in the 100 msec. to 900 msec. (with 50 msec increments) range for
both auditory and tactile modalities.
2. M will be able to generalize the above temporal discrimination task to
different modalities such as tactile stimulation.
3. M and NM will have similar performance levels for temporal discrimination
tasks in the 1 to 5 sec. range of time perception (with 250 msec increments).
12
CHAPTER 2
METHOD
Subjects
Two groups took part in the experiments, “musicians” (M) and “non-musicians”
(NM). “Musician” meant a person who had at least seven years of musical training
and one who played with an orchestra or a band. “Non-musician” meant a person
who had no professional music training and did not play any musical instrument
professionally or with an orchestra or a band.
Seventeen musicians and 22 non-musicians participated in the experiments.
Both groups consisted of subjects who were either Boğaziçi University students or
friends of the experimenter. They were either undergraduates or graduate students.
The musician group consisted of 8 women and 9 men; with an average age of 24.11
years (SD = 2.95). The average years of musical experience for the group was 11
years (min. 7, max. 15 years). There were 12 guitar, 5 piano (keyboard), and 2
saxophone players in the group; some of the players were multi-instrumentalists.
The non-musician group consisted of 12 women and 10 men; with an average
age of 26.77 years (SD = 2.91). Thirteen of the musicians and 18 of the non-
musicians reported themselves as being right-handed. One male musician and 1 male
non-musician reported themselves as being left-handed.
13
Stimuli
There were two types of stimuli: auditory sequences (auditory modality) and tactile
sequences (tactile modality). The auditory sequences had pairs of auditory signals in
two different ranges: R1 as the sub-second range (100 msec. to 900 msec, 500 msec.
as the standard stimulus) and R2 as the supra-second range (1 to 5 seconds, 3 seconds
as the standard stimulus). R1 was the range between 100 msec. and 900 msec. The
standard stimulus was 500 msec. and the difference was 50 msec. (∆ = 50 msec.);
ranging from 100 msec. to 900 msec. in steps of 50 msec. This range included
comparison intervals such as (500, 750), (250, 500), (850, 500), etc., each including
the standard stimulus in the first or the last part in a counterbalanced order. The
ordering of the intervals (either ascending or descending) was in fixed order but the
direction of the sequence and the slot of the standard stimulus were randomized, such
The point for which the ‘Yes’ answer was given marked the approximate
boundary of the subject's threshold for temporal discrimination, the closer that was to
the standard stimulus the better was the accuracy of making a temporal judgment,
hence a lower threshold of temporal discrimination. The arithmetic mean of the non-
standard stimulus at the last ‘No’ answer and the one at the ‘Yes’ answer was taken,
for the above hypothetical data set the result would be (400 + 450) / 2 = 425 msec.
Then the absolute difference between this number and the standard stimulus (e.g. 500
msec.) was taken to indicate how close the subject came to the standard stimulus, in
this case 500 – 425 = 75 msec. This was the absolute difference for the ascending
sequence. Using the same calculations the absolute difference for descending
sequence was also calculated and the average of absolute difference of ascending and
the absolute difference of descending sequence gave the average absolute difference
for one permutation.
18
To counterbalance the experimental conditions, the subjects were first
assigned one of the modalities. If they were assigned to the auditory condition, the
experiment was done for either the left or the right ear, or both ears stimulated for
both the short and long range auditory sequences. If subjects were first assigned to
the tactile condition, similarly short and long range tactile sequences were applied
either to the left or the right side of the body (the middle finger) with a
counterbalanced order as described earlier. This led to the following conditions for
the experiment: long range left ear, long range right ear, long range both ears, long
range left hand, long range right hand, short range left ear, short range right ear, short
range both ears, short range left hand, and short range right hand.
19
CHAPTER 3
RESULTS
For every experiment conducted for musicians and non-musicians, the pair of stimuli
to which they responded as “yes” by pressing the green button (meaning that they
perceived the pair of signals as having equal duration) was recorded for two
ascending and two descending sequences. For each sequence average of the time
point for the “yes” answer and the one before that was taken (e.g. if subject decided
that the pair of signals in the long ascending range, e.g. (2500, 3000), had same
duration then it was calculated as (2250 + 2500) / 2 = 2375 msec.). This led to two
data points for each type of sequence (two for ascending, two for descending). The
average of numbers for ascending and the average of numbers for descending
sequences were calculated. This calculation gave the absolute times for one subject
(one for ascending and one for descending sequence). To be able to assess the error
made by subjects, the absolute difference between these two numbers and the
standard stimulus (3000 msec. for long range and 500 msec. for short range) were
calculated. For example, if the absolute average time for an ascending sequence was
calculated as 2375 msec, then the absolute difference was 3000 – 2375 = 625 msec.
Finally, the average of the absolute differences for ascending sequence and the
descending sequence gave the average of absolute differences for the subject.
20
Gender Differences
A four way analysis of variance (ANOVA) with repeated measures on two factors
(Gender x Group x Side x Ascending / Descending) for long range auditory condition
indicated a significant difference between male and female subjects [F(1, 210) =
4.62, p = 0.03]. Male subjects were better than female subjects in the long range
auditory time estimation. There was significant difference between musicians and
non-musicians [F(1, 210) = 33.06, p < 0.001]. Musicians were better than non-
musicians. There was no significant difference between sides [F(2, 210) = 0.49, p =
0.48]. There was a significant difference between ascending and descending order
[F(1, 210) = 11.99, p < 0.001]. The performance of subjects was better in the
ascending order. There was no interaction between gender, group, side and ordering
of sequences (for Gender x Group [F(1, 210) = 0.42, p = 0.51], for Gender x Side
[F(2, 210) = 1.31, p = 0.30], for Group x Side [F(2, 210) = 0.14, p = 0.71], for
Gender x Ascending/Descending [F(1, 210) = 0.30, p = 0.60], for Group x
Ascending/Descending [F(1, 210) = 1.31, p = 0.25], for Side x
Ascending/Descending [F(1, 210) = 2.20, p = 0.15], for Gender x Group x Side [F(2,
210) = 0.32, p = 0.57], for Gender x Group x Ascending/Descending [F(1, 210) =
2.26, p = 0.14], for Gender x Side x Ascending/Descending [F(2, 210) = 0.01, p =
0.97], for Group x Side x Ascending/Descending [F(2, 210) = 0.61, p = 0.44], for
Gender x Group x Side x Ascending/Descending [F(2, 210) = 0.95, p = 0.33]).
The same type of test for long range tactile condition did not show a
significant difference between genders [F(1, 134) = 1.02, p = 0.31]. There was
significant difference between musicians and non-musicians [F(1, 134) = 30.23, p <
0.001]. Musicians were better than non-musicians. There was no significant
difference between sides [F(2, 134) = 3.9, p = 0.0501]. There was a significant
21
difference between ascending and descending order [F(1, 134) = 21.95, p < 0.001].
The performance of subjects was better in the ascending order. There was no
interaction between gender, group, side and ordering of sequences (for Gender x
Group [F(1, 134) = 0.05, p = 0.81], for Gender x Side [F(1, 134) = 1.03, p = 0.31],
for Group x Side [F(1, 134) = 0.05, p = 0.82], for Gender x Ascending/Descending
[F(1, 134) = 0.34, p = 0.56], for Group x Ascending/Descending [F(1, 134) = 0.04, p
= 0.82], for Side x Ascending/Descending [F(1, 134) = 0.26, p = 0.61], for Gender x
Group x Side [F(1, 134) = 0.99, p = 0.32], for Gender x Group x
Ascending/Descending [F(1, 134) = 0.55, p = 0.46], for Gender x Side x
Ascending/Descending [F(1, 134) = 0.15, p = 0.67], for Group x Side x
Ascending/Descending [F(1, 134) = 0.25, p = 0.61], for Gender x Group x Side x
Ascending/Descending [F(1, 134) = 0.72, p = 0.39]).
The same type of test for short range auditory condition indicated a
significant difference between genders [F(1, 214) = 10.46, p < 0.01]. Males were
better than females in the short range auditory time estimation task. There was
significant difference between musicians and non-musicians [F(1, 214) = 14.61, p <
0.001]. Musicians were better than non-musicians. There was no significant
difference between sides [F(2, 214) = 0.01, p = 0.97]. There was a significant
difference between ascending and descending order [F(2, 214) = 26.88, p < 0.001].
The performance of subjects was better in the ascending order. There was no
interaction between gender, group, side and ordering of sequences (for Gender x
Group [F(1, 214) = 0.18, p = 0.67], for Gender x Side [F(2, 214) = 1.98, p = 0.30],
for Group x Side [F(2, 214) = 0.01, p = 0.92], for Gender x Ascending/Descending
[F(1, 214) = 0.50, p = 0.47], for Group x Ascending/Descending [F(1, 214) = 0.21, p
= 0.64], for Side x Ascending/Descending [F(2, 214) = 0.61, p = 0.43], for Gender x
22
Group x Side [F(2, 214) = 0.26, p = 0.60], for Gender x Group x
Ascending/Descending [F(1, 214) = 0.001, p = 0.96], for Gender x Side x
Ascending/Descending [F(2, 214) = 0.49, p = 0.48], for Group x Side x
Ascending/Descending [F(2, 214) = 0.65, p = 0.42], for Gender x Group x Side x
Ascending/Descending [F(2, 214) = 0.86, p = 0.35]).
The same type of test for short range tactile condition showed no significant
difference between male and female subjects [F(1, 133) = 4.35, p < 0.05]. There was
no significant difference between musicians and non-musicians [F(1, 133) = 2.90, p
= 0.09]. There was no significant difference between sides [F(1, 133) = 1.47, p =
0.22]. There was a significant difference between ascending and descending order
[F(1, 133) = 17.04, p < 0.001]. The performance of subjects was better in the
ascending order. There was no interaction between gender, group, side and ordering
of sequences (for Gender x Group [F(1, 133) = 1.13, p = 0.29], for Gender x Side
[F(1, 133) = 2.70, p = 0.11], for Group x Side [F(1, 133) = 1.21, p = 0.27], for
Gender x Ascending/Descending [F(1, 133) = 0.03, p = 0.85], for Group x
Ascending/Descending [F(1, 133) = 0.87, p = 0.35], for Side x
Ascending/Descending [F(1, 133) = 0.20, p = 0.65], for Gender x Group x Side [F(1,
133) = 0.24, p = 0.62], for Gender x Group x Ascending/Descending [F(1, 133) =
0.02, p = 0.96], for Gender x Side x Ascending/Descending [F(1, 133) = 0.10, p =
0.75], for Group x Side x Ascending/Descending [F(1, 133) = 0.01, p = 0.91], for
Gender x Group x Side x Ascending/Descending [F(1, 133) = 0.21, p = 0.64]).
23
Long Range Time Estimation
Auditory Modality - Females
Fig. 1 shows the time estimations (absolute times) for the auditory long range
sequence for musicians and non-musicians in the female group. The ascending and
descending sequences are given separately for left ear, right ear and both ears. Table
1 summarizes the absolute time data for the long range auditory ascending and
descending conditions (all numbers are in milliseconds, standard stimulus is 3000
msec).
24
Fig. 1 The absolute average times (in milliseconds) at which female subjects decided that the tones were of equal length for ascending and descending tone sequences.
Table 1. Absolute Times for Long Range Auditory Signals in Ascending and Descending Order for Female Subjects
A three way ANOVA for absolute times with repeated measures on two
factors (Group x Side x Ascending/Descending) for females in the auditory long
range time estimation task showed no significant difference between groups [F(1,
110) = 0.08, p = 0.78]. There was no significant difference between sides [F(2, 110)
= 0.80, p = 0.37]. There was a significant difference between ascending and
Tim
e (
mse
c)
25
descending orders [F(1, 110) = 332.05, p < 0.001]. The absolute time for ascending
order was closer to the standard stimulus. There were no significant interactions
between groups, sides and ascending/descending order (for group x side [F(2, 110) =
0.15, p = 0.69], for group x ascending/descending [F(1, 110) = 1.19, p = 0.16], for
side x ascending/descending [F(2, 110) = 1.49, p = 0.22], for group x side x
ascending/descending [F(2, 100) = 0.58, p = 0.44]).
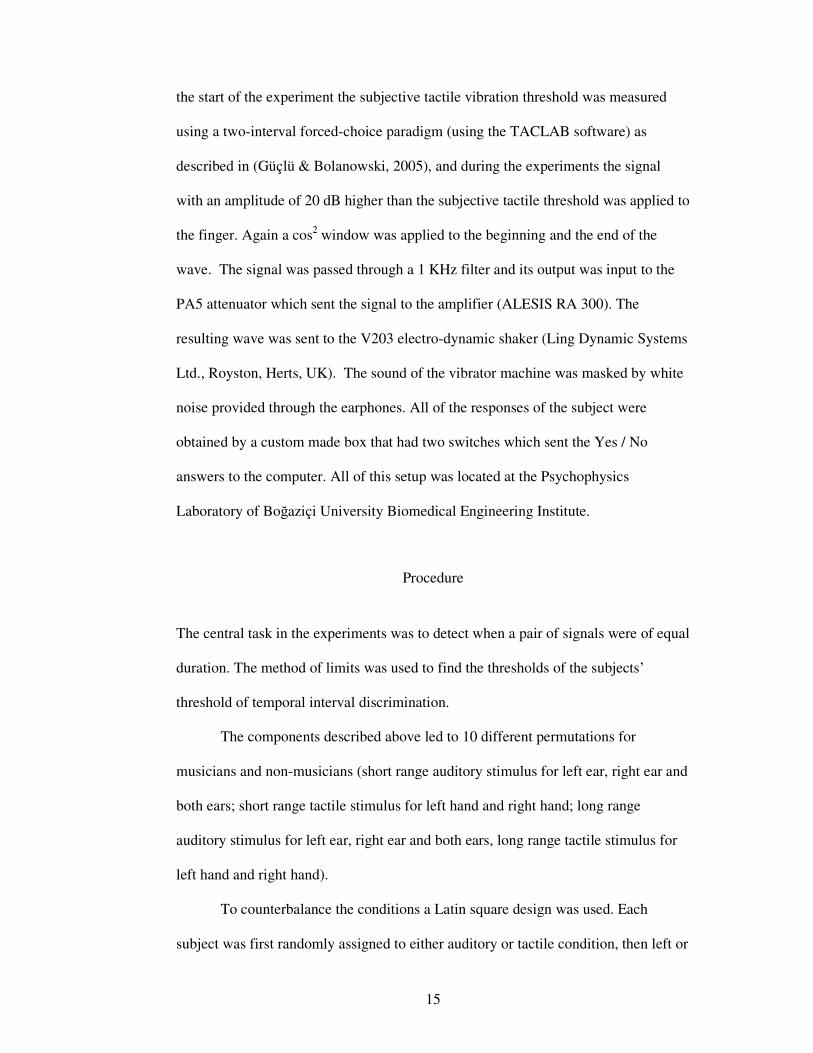
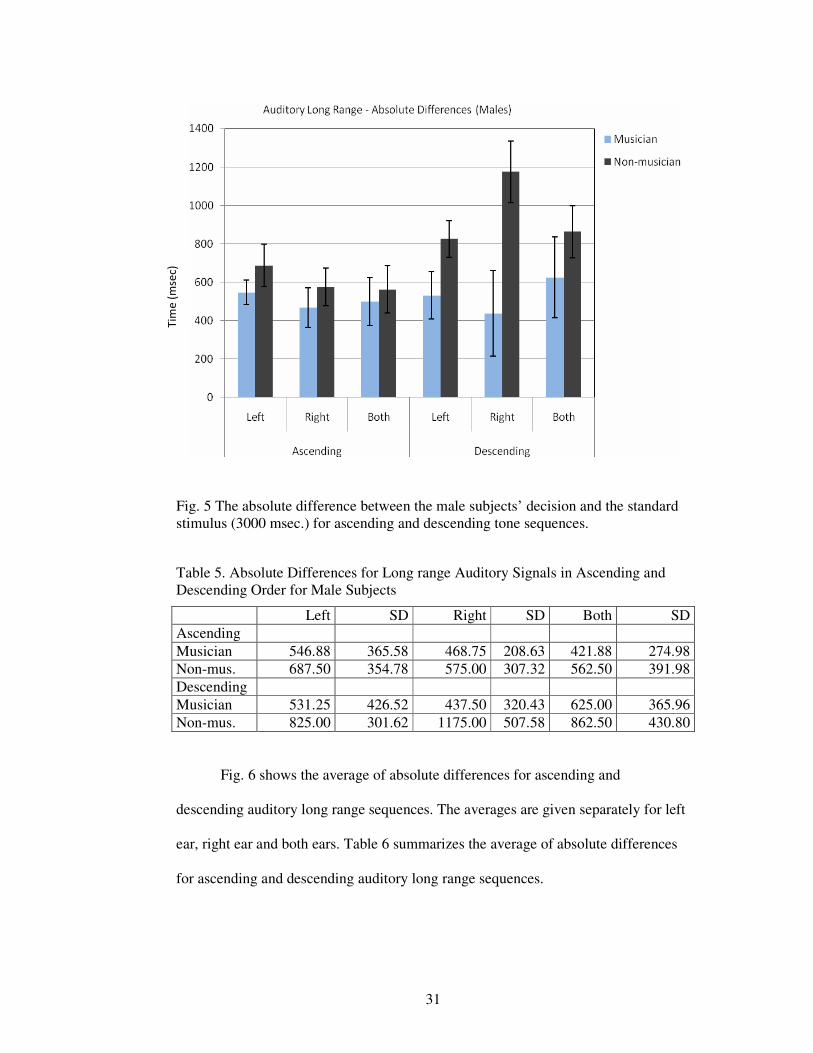
Fig. 2 shows the absolute difference between the subjects’ absolute response
time and the standard stimulus for the auditory long range ascending and descending
sequences. The ascending and descending sequences are given separately for left ear,
right ear and both ears. Table 2 summarizes the absolute difference data for the long
range auditory ascending and descending conditions (all numbers are in
milliseconds).
26
Fig. 2 The absolute difference between the female subjects’ decision and the standard stimulus (3000 msec.) for ascending and descending tone sequences.
Table 2. Absolute Differences for Long Range Auditory Signals in Ascending and Descending Order for Female Subjects
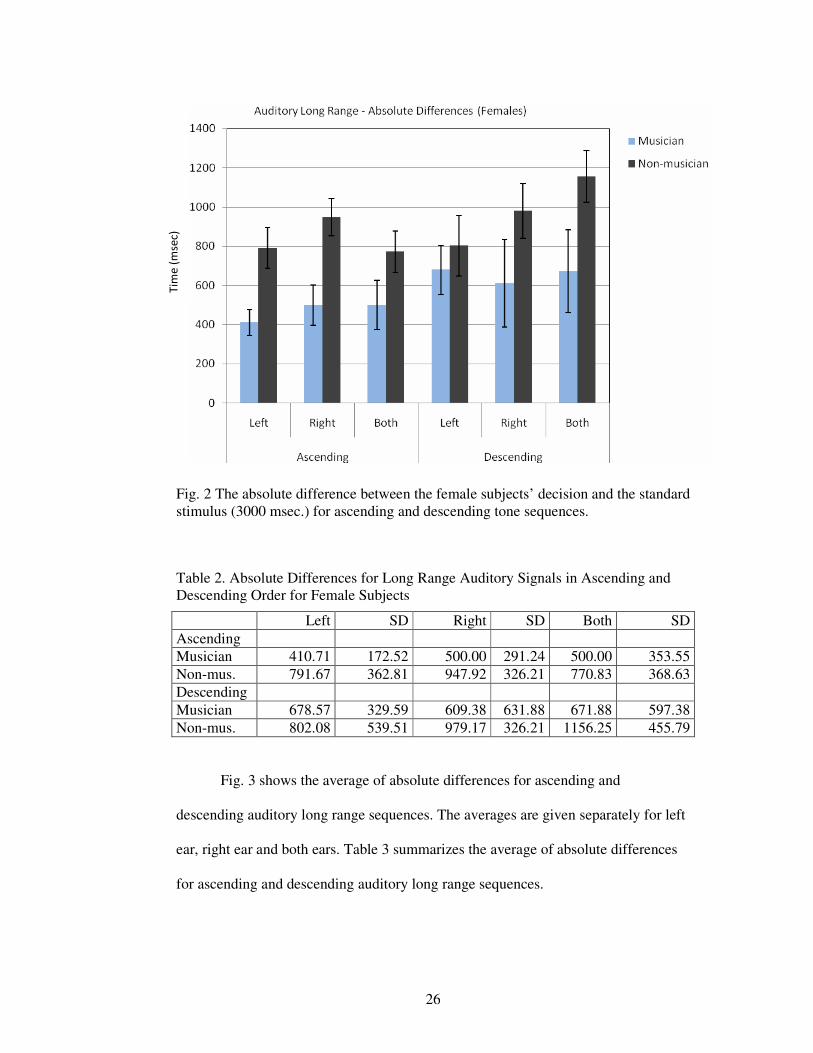
Fig. 3 shows the average of absolute differences for ascending and
descending auditory long range sequences. The averages are given separately for left
ear, right ear and both ears. Table 3 summarizes the average of absolute differences
for ascending and descending auditory long range sequences.
Tim
e (
mse
c)
27
Fig. 3 The average of ascending and descending sequences’ absolute difference between the female subjects’ decision and the standard stimulus (3000 msec.).
Table 3. The Average of the Absolute Differences for Ascending and Descending Auditory Long Range Sequences for Female Subjects
Left. SD Right SD Both SD Musician 544.64 221.60 554.69 438.69 585.94 462.83 Non-mus. 796.88 412.97 963.54 376.38 963.54 355.02
A three way ANOVA for absolute differences with repeated measures on two
factors (Group x Side x Ascending / Descending) for the female group indicated that
there was a significant difference between musicians and non-musicians [F(1, 110) =
18.39, p < 0.001]. Absolute differences for musicians were smaller than non-
musicians. There was also significant difference for ascending / descending order
[F(1, 110) = 3.98, p < 0.05]. The absolute difference for descending order was
bigger. This test did not show any significant interaction between the groups, ears
Tim
e (
mse
c)
28
and ascending or descending order (for group x side [F(2, 110) = 0.39, p = 0.53], for
group x ascending/descending [F(1, 110) = 0.05, p = 0.81], for side x
ascending/descending [F(2, 110) = 1.02, p = 0.31], for group x side x
ascending/descending [F(2, 110) = 1.37, p = 0.24]).
Auditory Modality - Males
Fig. 4 shows the time estimations (absolute times) for the auditory long range
sequence for musicians and non-musicians in the male group. The ascending and
descending sequences are given separately for left ear, right ear and both ears. Table
4 summarizes the absolute time data for the long range auditory ascending and
descending conditions (all numbers are in milliseconds, standard stimulus is 3000
msec).
29
Fig. 4 The absolute average times (in milliseconds) at which male subjects decided that the tones were of equal length for ascending and descending tone sequences.
Table 4. Absolute Times for Long Range Auditory Signals in Ascending and Descending Order for Male Subjects
Fig. 6 shows the average of absolute differences for ascending and
descending auditory long range sequences. The averages are given separately for left
ear, right ear and both ears. Table 6 summarizes the average of absolute differences
for ascending and descending auditory long range sequences.
Tim
e (
mse
c)
32
Fig. 6 The average of ascending and descending sequences’ absolute difference between the male subjects’ decision and the standard stimulus (3000 msec.).
Table 6. The Average of the Absolute Differences for Ascending and Descending Auditory Long Range Sequences for Male Subjects
Left. SD Right SD Both SD Musician 539.06 376.39 453.13 225.97 523.44 307.89 Non-mus. 756.25 227.17 875.00 325.43 712.50 398.78
A three way ANOVA for absolute differences with repeated measures on two
factors (Group x Side x Ascending / Descending) for the male group indicated that
there was a significant difference between musicians and non-musicians [F(1, 100) =
14.80, p < 0.001]. The absolute differences for musicians were smaller than non-
musicians. There was also significant difference for ascending / descending order
[F(1, 100) = 9.11, p < 0.01]. The absolute difference for the descending order was
bigger than the ascending order. There was no difference for sides [F(2, 100) = 0.12,
p = 0.72]. This test did not show any significant interaction between the groups, ears
Tim
e (
mse
c)
33
and ascending or descending order (for group x side [F(1, 100) = 0.02, p = 0.87], for
group x ascending/descending [F(1, 100) = 4.19, p = 0.43], for side x
ascending/descending [F(2, 100) = 1.15, p = 0.28], for group x side x
ascending/descending [F(2, 100) = 0.02, p = 0.87]).
Tactile Modality - Females
Fig. 7 shows the time estimations (absolute times) for the tactile long range sequence
for musicians and non-musicians in female group. The ascending and descending
sequences are given separately for left hand and right hand. Table 7 summarizes the
absolute time data for the long range tactile ascending and descending conditions (all
numbers are in milliseconds, standard stimulus is 3000 msec).
34
Fig. 7 The absolute average times (in milliseconds) at which female subjects decided that the vibrations were of equal length for ascending and descending vibratory sequences.
Table 7. Absolute Times for Long Range Tactile Ascending and Descending Order for Female Subjects
A three way ANOVA for absolute times with repeated measures on two
factors (Group x Side x Ascending/Descending) for females in the tactile long range
time estimation task showed no significant difference between groups [F(1, 67) =
0.10, p = 0.74]. There was no significant difference between sides [F(1, 67) = 0.41, p
Tim
e (
mse
c)
35
= 0.52]. There was significant difference between ascending and descending orders
[F(1, 67) = 331.05, p < 0.001]. The absolute time for ascending order was closer to
the standard stimulus. There were no significant interactions between groups, sides
and ascending/descending order (for group x side [F(1, 67) = 0.01, p = 0.89], for
group x ascending/descending [F(1, 67) = 0.16, p = 0.72], for side x
ascending/descending [F(1, 67) = 0.14, p = 0.70], for group x side x
ascending/descending [F(1, 67) = 0.13, p = 0.71]).
Fig. 8 shows the absolute difference between the subjects’ absolute response
and the standard stimulus for the tactile long range ascending and descending
sequences. The ascending and descending sequences are given separately for the left
hand and the right hand. Table 8 summarizes the absolute difference data for the long
range tactile ascending condition (all numbers are in milliseconds).
36
Fig. 8 The absolute difference between the female subjects’ decision and the standard stimulus (3000 msec.) for ascending and descending vibratory sequences.
Table 8. Absolute Differences for Long Range Tactile Ascending Order for Female Subjects
Fig. 9 shows the average of absolute differences for ascending and
descending tactile long range sequences. The averages are given separately for the
left hand and the right hand. Table 9 summarizes the average of absolute differences
for ascending and descending auditory long range sequences.
Tim
e (
mse
c)
37
Fig. 9 The average of ascending and descending sequences’ absolute difference between the female subjects’ decision and the standard stimulus (3000 msec.). Lower numbers mean better interval time discrimination.
Table 9. The Average of the Absolute Differences for Ascending and Descending Tactile Long Range Sequences for Female Subjects
A three way ANOVA for absolute differences with repeated measures on two
factors (Group x Side x Ascending/Descending) indicated a significant difference
between musicians and non-musicians [F(1, 67) = 14.04, p < 0.001]. The absolute
errors for musicians were smaller than the absolute error for non-musicians. There
was no significant difference between hands [F(1, 67) = 0.39, p = 0.53]. There was a
significant difference for ascending / descending order [F(1, 67) = 7.27, p < 0.01].
The absolute error for descending was bigger than the one for ascending. There were
Tim
e (
mse
c)
38
no interactions between the groups, hands and order of the sequences (for group x
side [F(1, 67) = 0.25, p = 0.61], for group x ascending/descending [F(1, 67) = 0.12, p
= 0.72], for side x ascending/descending [F(1, 67) = 0.35, p = 0.55], for group x side
x ascending/descending [F(1, 67) = 0.05, p = 0.81]).
Tactile Modality - Males
Fig. 10 shows the time estimations (absolute times) for the tactile long range
sequence for musicians and non-musicians in male group. The ascending and
descending sequences are given separately for left hand and right hand. Table 10
summarizes the absolute time data for the long range tactile ascending and
descending conditions (all numbers are in milliseconds, standard stimulus is 3000
msec).
39
Fig. 10 The absolute average times (in milliseconds) at which male subjects decided that the vibrations were of equal length for ascending and descending vibratory sequences.
Table 10. Absolute Times for Long Range Tactile Ascending and Descending Order for Male Subjects
A three way ANOVA for absolute times with repeated measures on two
factors (Group x Side x Ascending/Descending) for males in the tactile long range
time estimation task showed no significant difference between groups [F(1, 67) =
0.74, p = 0.39]. There was no significant difference between sides [F(1, 67) = 0.03, p
Tim
e (
mse
c)
40
= 0.95]. There was significant difference between ascending and descending orders
[F(1, 67) = 341.82, p < 0.001]. The absolute time for ascending order was closer to
the standard stimulus. There were no significant interactions between groups, sides
and ascending/descending order (for group x side [F(1, 67) = 1.11, p = 0.29], for
group x ascending/descending [F(1, 67) = 1.37, p = 0.25], for side x
ascending/descending [F(1, 67) = 1.14, p = 0.63], for group x side x
ascending/descending [F(1, 67) = 0.60, p = 0.44]).
Fig. 11 shows the absolute difference between the subjects’ absolute response
and the standard stimulus for the tactile long range ascending and descending
sequences. The ascending and descending sequences are given separately for the left
hand and the right hand. Table 11 summarizes the absolute difference data for the
long range tactile ascending condition (all numbers are in milliseconds).
41
Fig. 11 The absolute difference between the male subjects’ decision and the standard stimulus (3000 msec.) for ascending and descending vibratory sequences.
Table 11. Absolute Differences for Long Range Tactile Ascending Order for Male Subjects
Fig. 12 shows the average of absolute differences for ascending and
descending tactile long range sequences. The averages are given separately for the
left hand and the right hand. Table 12 summarizes the average of absolute
differences for ascending and descending auditory long range sequences.
Tim
e (
mse
c)
42
Fig. 12 The average of ascending and descending sequences’ absolute difference between the male subjects’ decision and the standard stimulus (3000 msec.). Lower numbers mean better interval time discrimination.
Table 12. The Average of the Absolute Differences for Ascending and Descending Tactile Long Range Sequences for Male Subjects
A three way ANOVA for absolute differences with repeated measures on two
factors (Group x Side x Ascending/Descending) indicated a significant difference
between musicians and non-musicians [F(1, 67) = 16.67, p < 0.001]. The absolute
errors for musicians were smaller than the one for non-musicians. There was also a
significant difference between hands [F(1, 67) = 5.32, p = 0.05]. The right hand had
smaller absolute difference than the left hand. There was a significant difference for
ascending / descending order [F(1, 67) = 16.47, p < 0.001]. The absolute difference
Tim
e (
mse
c)
43
for descending order was bigger than the one for ascending order. There were no
significant interactions between the groups, hands and order of the sequences (for
group x side [F(1, 67) = 0.87, p = 0.35], for group x ascending/descending [F(1, 67)
= 0.54, p = 0.46], for side x ascending/descending [F(1, 67) = 0.01, p = 0.92], for
group x side x ascending/descending [F(1, 67) = 1.08, p = 0.30]).
Short Range Time Estimation
Auditory Modality - Females
Fig. 13 shows the time estimations (absolute times) for the auditory short range
sequence for musicians and non-musicians in the female group. The ascending and
descending sequences are given separately for left ear, right ear and both ears. Table
13 summarizes the absolute time data for the short range auditory ascending and
descending conditions (all numbers are in milliseconds, standard stimulus is 500
msec).
44
Fig. 13 The absolute average times (in milliseconds) at which female subjects decided that the tones were of equal length for ascending and descending tone sequences.
Table 13. Absolute Times for Short Range Auditory Ascending and Descending Order for Female Subjects
A three way ANOVA for absolute times with repeated measures on two
factors (Group x Side x Ascending/Descending) for females in the short range time
estimation task showed no significant difference between groups [F(1, 112) = 0.04, p
= 0.83]. There was no significant difference between sides [F(2, 112) = 0.05, p =
Tim
e (
mse
c)
45
0.81]. There was a significant difference between ascending and descending orders
[F(1, 112) = 630.27, p < 0.001]. The absolute time for ascending order was closer to
the standard stimulus. There were no significant interactions between groups, sides
and ascending/descending order (for group x side [F(2, 112) = 0.68, p = 0.40], for
group x ascending/descending [F(1, 112) = 0.51, p = 0.33], for side x
ascending/descending [F(2, 112) = 0.61, p = 0.43], for group x side x
ascending/descending [F(2, 112) = 0.22, p = 0.63]).
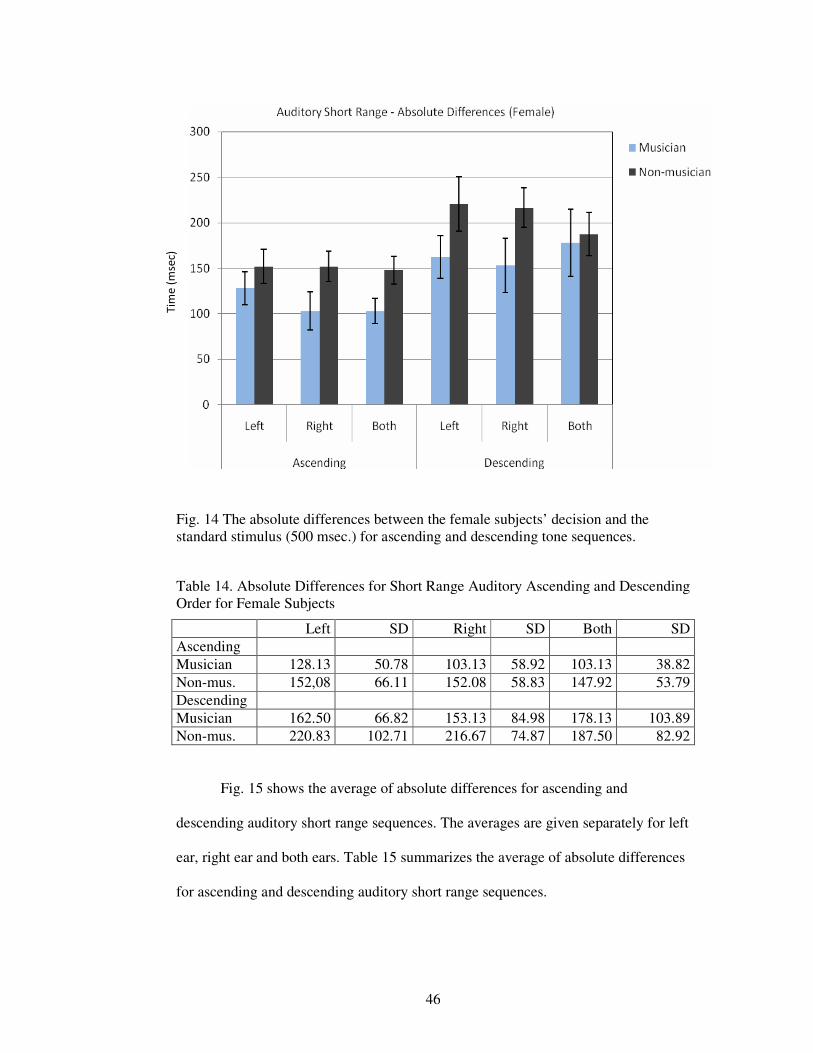
Fig. 14 shows the absolute difference between the subjects’ absolute response
and the standard stimulus for the auditory short range ascending and descending
sequences. The ascending and descending sequences are given separately for left ear,
right ear and both ears. Table 14 summarizes the absolute difference data for the
short range auditory ascending and descending conditions (all numbers are in
milliseconds).
46
Fig. 14 The absolute differences between the female subjects’ decision and the standard stimulus (500 msec.) for ascending and descending tone sequences.
Table 14. Absolute Differences for Short Range Auditory Ascending and Descending Order for Female Subjects
Fig. 15 shows the average of absolute differences for ascending and
descending auditory short range sequences. The averages are given separately for left
ear, right ear and both ears. Table 15 summarizes the average of absolute differences
for ascending and descending auditory short range sequences.
Tim
e (
mse
c)
47
Fig. 15 The average of ascending and descending sequences’ absolute difference between the female subjects’ decision and the standard stimulus (500 msec.).
Table 15. The Average of the Absolute Differences for Ascending and Descending Auditory Short Range Sequences for Female Subjects
Left. SD Right SD Both SD Musician 145,31 49.97 128,13 60.78 140,63 67.40 Non-mus. 186,46 78.42 184,38 60.57 167,71 63.17
A three way ANOVA for absolute differences with repeated measures on two
factors (Group x Side x Ascending/Descending) also showed that there was a
significant difference between musicians and non-musicians [F(1, 112) = 8.80, p <
0.01]. The absolute differences for musicians were smaller than the one for non-
musicians. There was also significant difference between ascending and descending
order [F(1, 112) = 17.28, p < 0.001]. The absolute difference for descending was
bigger than the one for ascending. There was no interaction between the groups, ears,
Tim
e (
mse
c)
48
and ascending / descending order (for group x side [F(2, 112) = 0.08, p = 0.77], for
group x ascending/descending [F(1, 112) = 0.08, p = 0.78], for side x
ascending/descending [F(2, 112) = 0.01, p = 0.93], for group x side x
ascending/descending [F(2, 112) = 1.45, p = 0.23]).
Auditory Modality - Males
Fig. 16 shows the time estimations (absolute times) for the auditory short range
sequence for musicians and non-musicians in the male group. The ascending and
descending sequences are given separately for left ear, right ear and both ears. Table
16 summarizes the absolute time data for the short range auditory ascending and
descending conditions (all numbers are in milliseconds, standard stimulus is 500
msec).
49
Fig. 16 The absolute average times (in milliseconds) at which male subjects decided that the tones were of equal length for ascending and descending tone sequences.
Table 16. Absolute Times for Short Range Auditory Ascending and Descending Order for Male Subjects
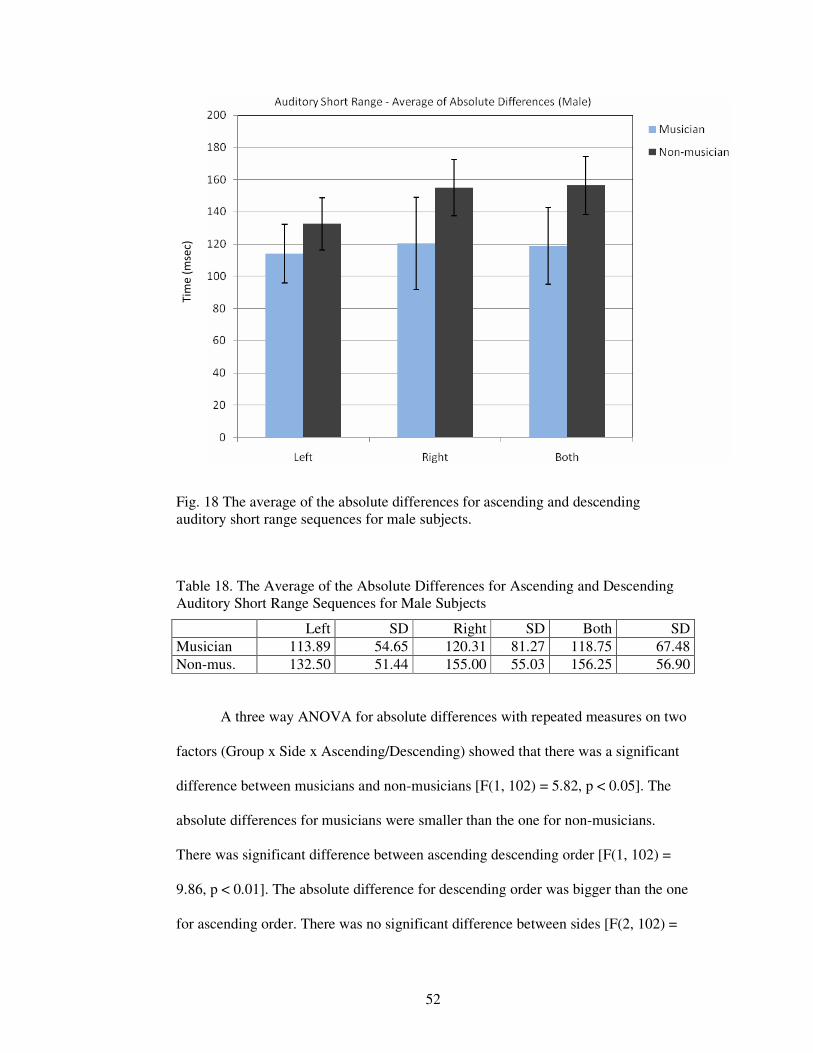
Fig. 18 shows the average of absolute differences for ascending and
descending auditory short range sequences. The averages are given separately for left
ear, right ear and both ears. Table 18 summarizes the average of absolute differences
for ascending and descending auditory short range sequences.
Tim
e (
mse
c)
52
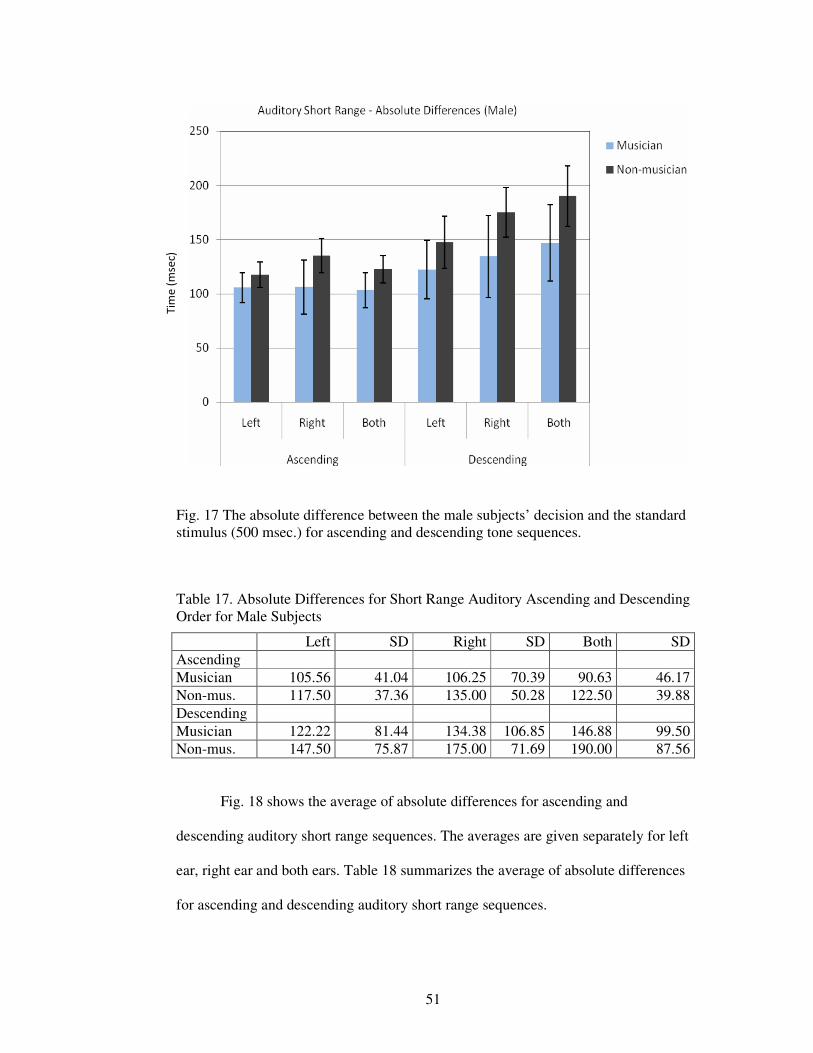
Fig. 18 The average of the absolute differences for ascending and descending auditory short range sequences for male subjects.
Table 18. The Average of the Absolute Differences for Ascending and Descending Auditory Short Range Sequences for Male Subjects
Left SD Right SD Both SD Musician 113.89 54.65 120.31 81.27 118.75 67.48 Non-mus. 132.50 51.44 155.00 55.03 156.25 56.90
A three way ANOVA for absolute differences with repeated measures on two
factors (Group x Side x Ascending/Descending) showed that there was a significant
difference between musicians and non-musicians [F(1, 102) = 5.82, p < 0.05]. The
absolute differences for musicians were smaller than the one for non-musicians.
There was significant difference between ascending descending order [F(1, 102) =
9.86, p < 0.01]. The absolute difference for descending order was bigger than the one
for ascending order. There was no significant difference between sides [F(2, 102) =
Tim
e (
mse
c)
53
1.13, p < 0.30]. There were no significant interactions between the groups, ears, and
ascending / descending order (for group x side [F(2, 102) = 0.20, p = 0.65], for group
x ascending/descending [F(2, 102) = 0.13, p = 0.71], for side x ascending/descending
[F(2, 102) = 1.14, p = 0.28], for group x side x ascending/descending [F(2, 102) =
0.01, p = 0.91]).
Tactile Modality - Females
Fig. 19 shows the time estimations (absolute times) for the tactile short range
sequence for musicians and non-musicians in the female group. The ascending and
descending sequences are given separately for left hand and right hand. Table 19
summarizes the absolute time data for the short range tactile ascending and
descending conditions (all numbers are in milliseconds).
54
Fig. 19 The absolute average times (in milliseconds) at which female subjects decided that the vibrations were of equal length for ascending and descending vibratory sequences.
Table 19. Absolute Times for Short Range Tactile Ascending and Descending Order for Female Subjects
A three way ANOVA for absolute times with repeated measures on two
factors (Group x Side x Ascending/Descending) for females in the tactile short range
time estimation task showed no significant difference between groups [F(1, 66) =
0.64, p = 0.42]. There was no significant difference between sides [F(1, 66) = 0.01, p
Tim
e (
mse
c)
55
= 0.94]. There was significant difference between ascending and descending orders
[F(1, 66) = 476.18, p < 0.001]. The absolute time for ascending order was closer to
the standard stimulus. There were no significant interactions between groups, sides
and ascending/descending order (for group x side [F(1, 66) = 0.28, p = 0.59], for
group x ascending/descending [F(1, 66) = 0.08, p = 0.87], for side x
ascending/descending [F(1, 66) = 0.03, p = 0.89], for group x side x
ascending/descending [F(1, 66) = 0.91, p = 0.34]).
Fig. 20 shows the absolute difference between the subjects’ absolute response
and the standard stimulus for the tactile short range ascending and descending
sequences. Ascending and descending sequences are given separately for the left
hand and the right hand. Table 20 summarizes the absolute difference data for the
short range tactile ascending and descending conditions (all numbers are in
milliseconds).
56
Fig. 20 The absolute difference between the female subjects’ decision and the standard stimulus (500 msec.) for ascending and descending vibratory sequences.
Table 20. Absolute Differences for Short range Tactile Ascending and Descending Order for Female Subjects
Fig. 21 shows the average of absolute differences for ascending and
descending tactile short range sequences. The averages are given separately for the
left hand and the right hand. Table 21 summarizes the average of absolute
differences for ascending and descending tactile short range sequences.
Tim
e (
mse
c)
57
Fig. 21 The average of ascending and descending sequences’ absolute difference between the female subjects’ decision and the standard stimulus (500 msec.).
Table 21. The Average of the Absolute Differences for Ascending and Descending Tactile Short Range Sequences for Female Subjects
A three way ANOVA for absolute differences with repeated measures on two
factors (Group x Side x Ascending/Descending) showed that there was no significant
difference between musicians and non-musicians (F(1, 65) = 0.14, p = 0.71) but it
showed that there was a significant difference for ascending and descending
sequences [F(1, 65) = 7.02, p < 0.05]. The absolute difference for descending order
was bigger than the one for ascending order. There was no significant difference
between sides [F(1, 65) = 0.09, p = 0.76]. No significant interaction was found
between the groups, hands and ascending / descending order (for group x side [F(1,
Tim
e (
mse
c)
58
65) = 1.16, p = 0.29], for group x ascending/descending [F(1, 65) = 0.42, p = 0.51],
for side x ascending/descending [F(1, 65) = 0.01, p = 0.92], for group x side x
ascending/descending [F(1, 65) = 0.15, p = 0.69]).
Tactile Modality - Males
Fig. 22 shows the time estimations (absolute times) for the tactile short range
sequence for musicians and non-musicians in the male group. The ascending and
descending sequences are given separately for left hand and right hand. Table 22
summarizes the absolute time data for the short range tactile ascending and
descending conditions (all numbers are in milliseconds).
59
Fig. 22 The absolute average times (in milliseconds) at which male subjects decided that the vibrations were of equal length for ascending and descending vibratory sequences.
Table 22. Absolute Times for Short Range Tactile Ascending and Descending Order for Male Subjects
A three way ANOVA for absolute times with repeated measures on two
factors (Group x Side x Ascending/Descending) for males in the tactile short range
time estimation task showed no significant difference between groups [F(1, 68) =
0.19, p = 0.66]. There was no significant difference between sides [F(1, 68) = 0.69, p
= 0.41]. There was significant difference between ascending and descending orders
Tim
e (
mse
c)
60
[F(1, 68) = 411.41, p < 0.001]. The absolute time for ascending order was closer to
the standard stimulus. There were no significant interactions between groups, sides
and ascending/descending order (for group x side [F(1, 68) = 0.24, p = 0.61], for
group x ascending/descending [F(1, 68) = 1.45, p = 0.22], for side x
ascending/descending [F(1, 68) = 1.40, p = 0.27], for group x side x
ascending/descending [F(1, 66) = 0.50, p = 0.48]).
Fig. 23 shows the absolute difference between the subjects’ absolute response
and the standard stimulus for the tactile short range ascending and descending
sequences. Ascending and descending sequences are given separately for the left
hand and the right hand. Table 23 summarizes the absolute difference data for the
short range tactile ascending and descending conditions (all numbers are in
milliseconds).
61
Fig. 23 The absolute difference between the male subjects’ decision and the standard stimulus (500 msec.) for ascending and descending vibratory sequences.
Table 23. Absolute Differences for Short Range Tactile Ascending and Descending Order for Male Subjects
Fig. 24 shows the average of absolute differences for ascending and
descending tactile short range sequences. The averages are given separately for the
left hand and the right hand. Table 24 summarizes the average of absolute
differences for ascending and descending tactile short range sequences.
Tim
e (
mse
c)
62
Fig. 24 The average of ascending and descending sequences’ absolute difference between the male subjects’ decision and the standard stimulus (500 msec.).
Table 24. The Average of the Absolute Differences for Ascending and Descending Tactile Short Range Sequences for Male Subjects
Left SD Right SD Musician 183.33 80.53 230.56 74.51 Non-mus. 153.75 54.02 175.00 71.44
A three way ANOVA for absolute differences with repeated measures on two
factors for (Group x Side x Ascending/Descending) showed that there was significant
difference between musicians and non-musicians [F(1, 68) = 4.29, p = 0.05]. The
absolute differences for non-musicians were smaller than the one for musicians. It
also showed that there was a significant difference for ascending and descending
sequences [F(1, 68) = 10.33, p < 0.05]. The absolute difference for descending order
was smaller than the one for ascending order. There was significant difference
between sides [F(1, 68) = 4.29, p = 0.05]. No interaction was found between the
Tim
e (
mse
c)
63
groups, hands and ascending / descending order (for group x side [F(1, 68) = 0.21, p
= 0.64], for group x ascending/descending [F(1, 68) = 0.44, p = 0.50], for side x
ascending/descending [F(1, 68) = 0.32, p = 0.56], for group x side x
ascending/descending [F(1, 68) = 0.06, p = 0.79]).
Analyses of Percentage of Errors
Fig. 25 and Table 25 below show the percentages of errors (for the average of
differences) for female musicians and non-musicians in the auditory modality. The
percentages of errors were calculated according to the formula: percentage of error =
((subject’s response time – standard stimulus time) / standard stimulus time) * 100.
64
Fig. 25 Percentage of errors for auditory modality for female subjects.
Table 25. Percentage of Errors for Auditory Modality for Female Subjects
Left. Right Both Musician Short range %29.01 %25.65 %28.11 Long range %18.21 %18.53 %19.53 Non-mus. Short range %37.37 %36.85 %33.5 Long range %25.62 %32.10 %32.11
A three way ANOVA for percentages of errors with repeated measures on
two factors (Group x Side x Range) for females in the auditory modality indicated a
significant difference between short and long ranges [F(1, 111) = 9.22, p < 0.01].
There was less error in the long range. It also showed significant difference between
Pe
rce
nt
65
musicians and non-musicians [F(1, 111) = 16.90, p < 0.001]. Musicians had less
error than non-musicians. There were no significant differences between sides [F(2,
111) = 0.01, p = 0.89]. There were no significant interactions between groups, sides
and ranges (for group x side [F(2, 111) = 0.02, p = 0.86], for group x range [F(1,
111) = 0.51, p = 0.47], for side x range [F(2, 111) = 1.28, p = 0.26], for group x side
x range [F(2, 111) = 0.40, p = 0.52]).
Fig. 26 and Table 26 below show the percentage of errors (for the average of
differences) for female musicians and non-musicians in the tactile modality.
66
Fig. 26 Percentage of errors for tactile modality for female subjects.
Table 26. Percentage of Errors for Tactile Modality for Female Subjects
Left. Right Musician Short range %42.18 %46.07 Long range %21.33 %24.10 Non-mus. Short range %44.77 %40.91 Long range %30.03 %31.78
A three way ANOVA for percentages of errors with repeated measures on
two factors (Group x Side x Range) indicated a significant difference between short
and long ranges [F(1, 66) = 23.07, p < 0.001]. There was less error in the long range.
It showed no significant difference between musicians and non-musicians [F(1, 66) =
2.86, p = 0.1]. There were no significant differences between sides [F(1, 66) = 0.13,
Pe
rce
nt
67
p = 0.71]. There were no significant interactions between groups, sides and ranges
(for group x side [F(1, 66) = 0.91, p = 0.34], for group x range [F(1, 66) = 4.16, p =
0.54], for side x range [F(1, 66) = 0.03, p = 0.85], for group x side x range [F(1, 66)
= 0.08, p = 0.77]).
Fig. 27 and Table 27 below show the percentage of errors (for the average of
differences) for male musicians and non-musicians in the auditory modality.
68
Fig. 27 Percentage of errors for auditory modality for male subjects.
Table 27. Percentage of Errors for Auditory Modality for Male Subjects
Left. Right Both Musician Short range %22.78 %24.01 %23.7 Long range %17.96 %15.10 %17.45 Non-mus. Short range %26.50 %31.0 %31.25 Long range %25.20 %29.17 %23.75
A three way ANOVA for percentages of errors with repeated measures on
two factors (Group x Side x Range) indicated a significant difference between short
and long ranges [F(1, 101) = 5.50, p < 0.05]. There was less error in the long range.
Pe
rce
nt
69
It also showed significant difference between musicians and non-musicians [F(1,
101) = 12.34, p < 0.001]. Musicians made less error than non-musicians. There were
no significant differences between sides [F(2, 101) = 0.14, p = 0.69]. There were no
significant interactions between groups, sides and ranges (for group x side [F(2, 101)
= 0.06, p = 0.80], for group x range [F(1, 101) = 0.57, p = 0.45], for side x range
[F(2, 101) = 0.53, p = 0.47], for group x side x range [F(2, 101) = 0.23, p = 0.62]).
Fig 28 and Table 28 below show the percentage of errors (for the average of
differences) for male musicians and non-musicians in the tactile modality.
70
Fig. 28 Percentage of errors for tactile modality for male subjects.
Table 28. Percentage of Errors for Tactile Modality for Male Subjects
Left. Right Musician Short range %36.66 %45.00 Long range %24.76 %19.14 Non-mus. Short range %30.75 %35.00 Long range %33.33 %29.58
A three way ANOVA for percentages of errors with repeated measures on
two factors (Group x Side x Range) indicated a significant difference between short
and long ranges [F(1, 66) = 12.67, p < 0.001]. There was less error in the long range.
It showed no significant difference between musicians and non-musicians [F(1, 66) =
Pe
rce
nt
71
0.02, p = 0.88]. There were no significant differences between sides [F(1, 66) = 0.30,
p = 0.58]. There were no significant interactions between groups, sides and ranges
(for group x side [F(1, 66) = 0.22, p = 0.63], for group x range [F(1, 66) = 0.76, p =
0.27], for side x range [F(1, 66) = 0.28, p = 0.74], for group x side x range [F(1, 66)
= 0.22, p = 0.63]).
72
CHAPTER 4
DISCUSSION
The findings in the previous chapter were mainly investigated on the basis of
quantitative perspectives: absolute time estimations and absolute differences. The
first one, the absolute time was the measure by which the subject thought a pair of
stimuli were equal, e.g. if the absolute time was stated as 600 msec in the short time
range condition for descending order, it meant that subject estimated that a signal
which lasted 600 msec was equal to the standard signal that actually lasted 500 msec
(the standard stimulus for the short range condition). The case was similar for the
ascending order, e.g. for short range, the absolute value of 350 msec. meant that the
subject thought that two signals which had durations of 500 msec (standard stimulus)
and 350 msec respectively were of equal duration. On the other hand, the absolute
differences were used to assess how close to the standard stimulus the subject’s
estimate was, e.g. for the examples above the absolute difference for 600 msec was
100 msec (|600 – 500| = 100) and the absolute difference for 350 msec was 150 msec
(|350 – 500| = 150). Even though analyses of variance were calculated for absolute
time estimations, this discussion is mainly based on the absolute differences’
analyses of variance because they provide a better way to see how much error the
subjects made compared to standard stimulus and thus providing a simpler and easier
to understand measure.
73
Gender Differences
The results indicate significant gender differences in all modes of time
estimation except in the long range tactile condition. Male subjects were better at
estimating the time in long range auditory, short range auditory and short range
tactile conditions.
Even though the evidence is not conclusive, there are studies which suggest
that men have larger corpus callosum compared to women (Bishop & Wahlsten,
1997; Sullivan, et al., 2001). This may be one of the reasons why male subjects in the
present study were generally better than female subjects in estimating time. A larger
corpus callosum may lead to better and faster signal transmission from one side of
the body to the contralateral hemisphere of the brain, thus to better information
processing for time estimation. However, it also must be noted that there is still
dispute whether the corpus callosum creates inhibitory or excitatory effects on the
contralateral hemisphere (Bloom & Hynd, 2005). Another important point is that
even though males are believed to have larger corpus callosum, recent findings
suggest that this may not be the case (Jäncke & Steinmetz, 2003).
In addition, a meta-analytic review in which data from 4,794 female and
4,688 male subjects were examined shows that there is some small but significant
difference between genders in terms of prospective time estimation when subjects are
previously informed in advance that they would be making duration judgments
(Block, Hancock & Zakay, 2000). Prospective time estimation was used in this
study, too. This meant that subjects were informed that they were about to make time
estimation judgments before the experiment started (which is in contrast with the
retrospective time estimation paradigm in which subjects are asked to make time
judgments after they finish the experiment; they do not know that they will be asked
74
to estimate time beforehand). The current findings support the conclusions of the
meta-analytic review by Block, et al (2000).
Effects of Music Training on Laterality
Comparisons of performances by musicians and non-musicians show
significant differences between these groups (for both genders for long durations) in
both modalities such that musicians have better time estimation than non-musicians.
Regarding hemispheric differences, there are no significant differences except for
long range tactile condition for male subjects. Male musicians in the tactile long
range condition have better performances when the tactile stimulus was applied to
their right hands (left hemisphere). Male non-musicians also have better
performances with right hand stimulation (left hemisphere).
On the other hand, except for the long range tactile condition, no significant
difference was found in terms of laterality for auditory or tactile long duration
estimation. Another point is that for short auditory duration estimation, there is a
significant difference between musicians and non-musicians (both male and female
subjects); musicians are better than non-musicians again without any laterality
difference; however for short tactile durations no such difference was found between
female musicians and female non-musicians, suggesting that they have
approximately similar performance profiles for short tactile durations. On the other
hand, male musicians were less accurate than male non-musicians in the short tactile
range.
Part of this result is compatible with the finding that somatosensory interval
discriminations generalize across hemispheres (Nagarajan, et al., 1998). However,
75
there is evidence for left hemispheric advantage for temporal processing of brief
tactile stimuli in which vibrations in the range of 120 msec were used with brief gaps
lasting 6 to 18 msec (Nicholls & Whelan, 1998). This also contrasts with the study
which suggests that mainly right hemispheric activation is found for time interval
discrimination around one second (Smith, et al., 2003). Under these circumstances,
the findings of the current study suggest it is difficult to claim that there is central
clock localized strictly either in the left or the right hemisphere of the brain.
Effects of Music Training on Time Estimation
Comparisons of performances by musicians and non-musicians show significant
differences between these groups (for both genders for long durations) in both
modalities such that musicians have better time estimation than non-musicians.
Another conclusion that may be drawn is that even though the functional and
anatomical changes in the musicians’ brains are presumed to be related to musical
tones and not to non-musical pure sinusoidal tones (Pantev et al., 2003), it can be
seen from the results that musicians had more accurate performance for “non-
musical” auditory duration estimation in the form of pure sinusoidal auditory signals.
The present findings suggest that the implicit time training of musicians generalize to
different time ranges and even for non-musical auditory stimuli. Musicians also
generalize to long tactile durations, showing better performance compared to non-
musicians, but this is not the case for short tactile durations. This finding shows
modality-specific time estimation (Grondin, 2003; Klapproth, 2003), at least for the
short range. The reason that the musicians’ performances for tactile short duration
estimation were worse than their tactile long duration estimation may be related to
76
the cognitive versus sensory timing distinction put forward by Rammsayer (2003).
He states that time processing in the range of milliseconds is related to sensory
(biological) timing mechanisms, whereas processing in the range of seconds is
mediated by cognitive mechanisms. This means that musicians may be relying on
cognitive strategies such as counting and using working memory which is a possible
strategy for estimating time ranges longer than 1 second. On the other hand,
neuropharmacological experiments by Rammsayer suggest that time estimation of
brief intervals in the milliseconds range is beyond cognitive control and seems to be
modulated mainly by dopamine activity in the basal ganglia. If that is the case, then
the performance difference between short auditory and tactile duration estimations
may suggest that musicians are able to transfer their cognitive time estimation skills
for long range auditory time estimation to the short range auditory time estimation,
but they are not able to do so for the tactile condition in which they had no training
(implicit time training in the context of musical training is based on auditory, not
tactile processing).
Musicians’ brains undergo functional and anatomical changes because of
extensive specialized training (such as enlarged left planum temporale; Ho, Cheung,
& Chan, 2003), and this may lead to differences between auditory perception and
somatosensory perception resulting in the findings mentioned above for short
auditory and tactile duration estimation. Another example of anatomical difference
between musicians and non-musicians is that there are data showing that the anterior
half of corpus callosum is significantly larger in musicians compared to non-
musicians (Schlaug, 2003). Similar to the performance difference between genders,
bigger size of corpus callosum in the brains of musicians may account for better time
estimation.
77
Analyses of Percentage of Errors
Percentage of error analyses also reveal important points about the
performance of subjects regarding length of time ranges. Male subjects have better
estimation of time than female subjects. Both genders make smaller errors in the long
range auditory condition. As for the tactile range, the situation is similar; the error
made for long range tactile time estimation is smaller than the short range tactile time
estimation. Even though it is not possible to create a model using just two data points
(short range mean percentage of error and long range mean percentage of error),
there is a clear trend which shows that it is easier to do time estimations in the long
range. The error analyses are also compatible with the previous analyses stated
above, since they also show that male subjects made less errors compared to female
subjects and musicians have better time estimation compared to non-musicians.
The reason for the difference between long and short ranges can be related to
the cognitive time estimation skills which were mentioned in the previous section. In
the light of distinction put forward by Rammsayer, the subjects may be relying on
cognitive strategies to make temporal estimations in the seconds range which is not
automatic unlike the automatic time estimation made for the ranges around the 500
msec range. If this is true, then the present studies suggest that cognitive time
estimations of temporal durations are more accurate than sensory estimations.
Conclusion
The main idea of this thesis was to investigate aspects of time estimation
mechanisms and assess how an extensive specialized training such as music training
that requires implicit timing performance would affect timing of different durations
78
for different modalities and hemispheres. The present study was based implicitly on
the assumption that there is no single clock in the brain localized to a specific region
but rather a distributed timing system emerges from the interaction of neural cell
assemblies. The data presented above support this idea because there are no
significant differences between the hemispheres for different durations and
modalities. Another idea was that musical training would generalize across different
modalities. The data support the idea that musicians were able to generalize to
different modalities for the long durations but not for the short durations, their short
tactile duration estimations were not significantly different from non-musicians.
To summarize the data and the results, it can be said that the first hypothesis
which proposed that musicians would perform better in temporal discrimination tasks
that are in the sub-second range compared to non-musicians was partially supported;
musicians were better than non-musicians for short auditory time estimations.
However, musicians were not better than non-musicians in the short range tactile
time estimation. The results also supported the second hypothesis partially which
stated that musicians would be able to generalize the temporal discrimination task to
different modalities. Data showed that musicians were also better for long range
tactile time estimation, however there was no significant difference for short tactile
durations. Finally, the third hypothesis which stated that musicians and non-
musicians would have similar performance levels for temporal discrimination tasks
in the long range was not supported because significant difference was found
between musicians and non-musicians for the long range time estimation, musicians
were better in the long range time estimation tasks.
For further study, it may be suitable to take a more vigorous approach to the
problem of time estimation mechanisms in the brain by using a wider range of
79
temporal stimuli, and population of subjects. For example, in addition to musicians,
subjects who necessarily use time estimation regularly, such as in some professional
sports, can be compared with people who are not professional sports players. The
methods of the experiments can be more detailed by including different standard
stimuli such as 1 second, 5 second, or more. In addition to measuring the response of
subjects behaviorally more sophisticated measurement techniques such as EEG,
fMRI and PET can be used. Besides, different modalities such as visual modality can
be used in experimental design so that different modalities can be contrasted in terms
of time estimation.
80
REFERENCES
Belin, P., McAdams, S., Thivard, L., Smith, B., Savel, S., Zilbovicius, M., et al. (2002). The neuroanatomical substrate of sound duration discrimination. Neuropsychologia, 40, 1956-1964.
Bever, T. G., & Chiarello, R. (1974). Cerebral dominance in musicians and non-
musicians. Science, 185, 537-54. Bishop, K.M., & Wahlsten D. (1997). Sex differences in the human corpus callosum:
myth or reality? Neuroscence and Biobehavioral Reviews, 21(5), 581-601 Block, R.A., Hancock, P.A., & Zakay, D. (2000). Sex differences in duration
judgments: a meta-analytic review. Memory and Cognition, 28(8), 1333-46. Bloom, J.S., Hynd, G.W. (2005). The role of the corpus callosum in interhemispheric
transfer of information: excitation or inhibition? Neuropsychology Review, 15(2), 59-71.
Boemio, A., Fromm, S., Braun, A., & Poeppel, D. (2005). Hierarchical and
asymmetric temporal sensitivity in human auditory cortices. Nature Neuroscience, 8, 389-395.
Buonomano, D. V. (2005). A learning rule for the emergence of stable dynamics and
timing in recurrent networks. Journal of Neurophysiology, 94, 2275-2283. Buonomano, D. V., & Karmakar, U. R. (2002). How do we tell time? The
Neuroscientist , 8(1), 42-51. DeLacoste-Utamsing, M.C., & Holloway , R.L. (1982). Sexual dimorphism in the
human corpus callosum. Science, 216(4553), 1431-1432. Dolu, N., Gölgeli, A., Süer, C., Asçıoğlu, M., Özesmi, Ç., & Şahin, Ö. (2004). Sex-
related differences in time estimation and the role of expectancy. International
Journal of Neuroscience, 114(7), 805-815. Dragoi, V., Staddon, J. E., Palmer, R. G., & Buhusi, C. V. (2003). Interval timing as
an emergent learning property. Psychological Review, 110(1), 126-144. Eagleman, D. M., Tse, P. U., Buonomano, D. V., Janssen, P., Nobre, A. C., &
Holcombe, A. O. (2005). Time and the brain: How subjective time relates to neural time. The Journal of Neuroscience , 25 (45), 10369-10371.
81
Elias, L. J., Bulman-Fleming, M. B., & McManus, I. C. (1999). Visual temporal
asymmetries are related to asymmetries in linguistic perception. Neuropsychologica, 37, 1243-1249.
Gazzaniga, M., Corballis, P., & Funnel, M. (2003). Temporal discrimination in the
split brain. Brain and Cognition (53), 218-222. Gibbon, J. (1977). Scalar expectancy theory and Weber's law in animal timing.
Psychological Review, 84, 279-325. Gibbon, J. & Church, R. M. (1984). Sources of variance in an information processing
theory of timing. In H. Roitblat, T. G. Bever, & H. S. Terrace (Eds.), Animal
cognition (pp. 465-488). Hillsdale, NJ: Erlbaum. Grondin, S. (2003). Sensory modalities and temporal processing. In Helfrich, H.
(Ed.), Time and Mind II: Information Processing Perspectives, (pp. 61-77). Hildesheim, Germany: Hogrefe & Huber Publishing.
Grondin, S. (2001). From physical time to the first and second moments of
psychological time. Psychological Bulletin, 127(1), 22-44. Güçlü, B., Bolanowski, S.J. (2005) Vibrotactile thresholds of the Non-Pacinian I
channel: I. Methodological issues. Somatosensory and Motor Research, 22 (1-2), 49-56.
Halberg, F., & Cornélissen, G. (1994). Introduction to chronobiology. Retrieved June
9, 2007, from http://www.msi.umn.edu/~halberg/introd/index.html Hellige, J. B. (2001). Hemispheric Asymmetry: What's Right and What's Left
(Perspectives in Cognitive Neuroscience). Cambridge, Massachusetts: Harvard University Press.
Ho, Y., Cheung, M., & Chan, A.S. (2003) Music training improves verbal but not
visual memory: cross-sectional and longitudinal explorations in children. Neuropsychology, 17(3), 439-450.
Jäncke, L., & Steinmetz, H. (2003). Anatomical brain asymmetries and their
relevance for functional asymmetries. In K. Hugdahl, & R.J. Davidson (Eds.), The
Asymmetrical Brain (187-229). Cambdridge, Massachusetts: MIT Press. Klapproth, F. (2003). Notable results regarding temporal memory and modality. In
Helfrich, H. (Ed.), Time and Mind II: Information Processing Perspectives, (pp. 79-96). Hillsdale, NJ: Erlbaum.
Loftus, E.F., Schooler, J.W., Boone, S.M., & Kline, D. (1986). Time went by so
slowly: Overestimation of event duration by males and females. Applied
Cognitive Psychology, 1(1), 3-13.
82
Masaki, M., Kashioka, H., & Campbell, N. (2002). Modeling the timing characteristics of different speaking styles. Proceedings of 2002 IEEE Workshop
on Speech Synthesis, (pp. 63-66). Matell, M. S., & Meck, W. H. (2000). Neuropsychological mechanisms of interval
timing behaviour. BioEssays , 94-103. Middlebrooks, J. C., & Greenhaw, D. M. (1991). Sound localization by human
listeners. Annual Review of Psychology, 1, 135-159. Nagarajan, S. S., Blake, D. T., Wright, B. A., Byl, N., & Merzenich, M. M. (1998).
Practice-related improvements in somatosensory interval discrimination are temporally specific but generalize across skin location, hemisphere and modality. The Journal of Neuroscience, 18 (4), 1559-1570.
Nicholls, M. E. & Whelan, R. E. (1998). Hemispheric asymmetries for the temporal
resolution of brief tactile stimuli. Journal of Cilinical and Experimental
Neuropsychology , 20(4), 445-456. Pantev, C., Engelien A., Candia, A.V., & Elbert, T. (2003) Representational cortex
in musicians. In I. Peretz, & R. Zatorre (Eds.), The Cognitive Neuroscience of
Music, (pp. 382-395). USA: Oxford University Press. Rammsayer, T. (2003). Sensory and cognitive mechanisms in temporal processing
elucidated by a model system approach. In Helfrich, H. (Ed.), Time and Mind II:
Information Processing Perspectives, (pp. 97-113). Hillsdale, NJ: Erlbaum. Rietveld, W. (1996). General introduction to chronobiology. Brazilian Journal of
Medical and Biological Research , 29(1), 63-70. Rubia, K., & Smith, A. (2004). The neural correlates of cognitive time management:
a review. Acta Neurobiologiae Experimentalis, 64, 329-340. Schlaug, G. (2003) The brain of musicians. In I. Peretz, & R. Zatorre (Eds.), The
Cognitive Neuroscience of Music, (pp. 366-381). USA: Oxford University Press. Smith, A., Taylor, E., Lidzba, K., & Rubia K. (2003). A right hemispheric
frontocerebellar network for time discrimination of several hundreds of milliseconds. Neuroimage, 20(1), 344-50.
Sullivan, E.V., Rosenbloom M.J., Desmond, J.E., Pfefferbaum, A. (2001). Sex
differences in corpus callosum size: relationship to age and intracranial size. Neurobiological Aging, 22(4), 603-11. Wright, B. A., Buonomano, D. V., Mahncke, H. W., & Merzenich, M. M. (1997).
Learning and generalization of auditory temporal-interval discrimination in humans. The Journal of Neuroscience , 17 (10), 3956-3963.