Page 1
THE EFFECTS OF FINANCIAL DISTRESS ON THE VALUE OF
FIRMS LISTED AT THE NAIROBI SECURITIES EXCHANGE
BY
MICHAEL GITONGA KANYUGI
D61/79405/2015
A RESEARCH PROJECT SUBMITTED IN PARTIAL
FULFILLMENT OF THE REQUIREMENTS FOR THE AWARD OF
MASTER OF BUSINESS ADMINISTRATION, SCHOOL OF
BUSINESS, UNIVERSITY OF NAIROBI
NOVEMBER, 2016
Page 2
ii
DECLARATION
I hereby declare that this project is my original work and has not been presented to any
university or an institution of higher learning for an award of a degree.
Name: Michael Gitonga Kanyugi Signature…………………..
Registration Number: D61/79405/2015 Date…..................................
This project has been submitted for examination with my approval as the university
supervisor.
Supervisor: Dr. Sifunjo Kisaka Signature………………….
Lecturer, Department of Finance and Accounting Date……………………….
School of Business
The University of Nairobi
Page 3
iii
ACKNOWLEDGEMENTS
My deepest appreciation goes to the Almighty God for sufficient and omnipresent grace
through the process conducting this research.
I wish to express my utmost gratitude and appreciation to my supervisor, Dr. Sifunjo
Kisaka, Lecturer department of finance and accounting, whose leadership, suggestions,
corrections and patience was enormous and inspirational.
Special thanks to my family members, friends and colleagues who have in one way or
another contributed to the completion of this research project.
Page 4
iv
DEDICATION
This research project is dedicated to my dear wife, Veronica Njoroge and daughters
Leesah and Leenah for their support and encouragement.
Page 5
v
TABLE OF CONTENTS
DECLARATION .......................................................................................................... ii
ACKNOWLEDGEMENTS ......................................................................................... iii
DEDICATION ............................................................................................................. iv
TABLE OF CONTENTS ..............................................................................................v
LIST OF TABLES ..................................................................................................... viii
LIST OF FIGURES ..................................................................................................... ix
ABBREVIATIONS ........................................................................................................x
ABSTRACT ................................................................................................................. xi
CHAPTER ONE ............................................................................................................1
INTRODUCTION .........................................................................................................1
1.1 Background ...........................................................................................................1
1.1.1 Financial Distress ...............................................................................................2
1.1.2 Value of Firm ......................................................................................................2
1.1.3 Financial Distress and Value of Firms in Kenya ...............................................4
1.1.4 Nairobi Securities Exchange ..............................................................................6
1.2 Research Problem .................................................................................................6
1.3 Objectives of the Study .........................................................................................8
1.4 Importance of the Study........................................................................................8
CHAPTER TWO ......................................................................................................... 10
LITERATURE REVIEW............................................................................................ 10
2.1 Introduction ......................................................................................................... 10
2.2 Theoretical Literature Review ............................................................................ 10
2.2.1 Capital Structure Theory ................................................................................. 10
2.2.2 Trade-off Theory .............................................................................................. 11
2.2.3 Credit Risk Theory ........................................................................................... 12
2.3 Determinants of Financial Distress and Value of Firms .................................... 13
2.3.1 Capital Adequacy and Quality of Assets ......................................................... 13
2.3.2 Management Efficiency .................................................................................... 14
2.3.3 Funding/Liquidity Management ...................................................................... 14
Page 6
vi
2.3.4 Macroeconomic Factors ................................................................................... 15
2.4 Empirical Literature Review .............................................................................. 15
2.4.1 International Studies on Financial Distress ..................................................... 16
2.4.2 Local Studies on Financial Distress ................................................................. 17
2.5 Conceptual Framework ...................................................................................... 18
2.6 Summary of Literature Review .......................................................................... 20
CHAPTER THREE ..................................................................................................... 21
RESEARCH METHODOLOGY ................................................................................ 21
3.1 Introduction ......................................................................................................... 21
3.2 Research Design .................................................................................................. 21
3.3 Population and Sample ....................................................................................... 22
3.4 Data and Data Collection Instruments ............................................................... 23
3.5 Data Analysis ....................................................................................................... 23
3.5.1 Conceptual Model ............................................................................................ 24
3.5.2 Analytical Model .............................................................................................. 26
3.5.3 Diagnostic tests ................................................................................................. 27
CHAPTER FOUR ....................................................................................................... 28
DATA ANALYSIS, RESULTS AND DISCUSSION ................................................. 28
4.1 Introduction ......................................................................................................... 28
4.2 Summary Statistics .............................................................................................. 28
4.3 Diagnostic tests .................................................................................................... 29
4.3.1 Correlation Analysis ......................................................................................... 29
4.3.2 Regression Analysis .......................................................................................... 30
4.4 Estimated Model.................................................................................................. 31
4.5 Discussion of Research Findings ......................................................................... 32
4.6 Summary of Findings .......................................................................................... 33
CHAPTER FIVE ......................................................................................................... 34
SUMMARY, CONCLUSIONS AND RECOMMENDATIONS ................................ 34
5.1 Introduction ......................................................................................................... 34
5.2 Summary of the study ......................................................................................... 34
5.3 Conclusion and Policy Recommendations .......................................................... 35
Page 7
vii
5.4 Limitations of the Study ...................................................................................... 36
5.5 Recommendations for Further Research ........................................................... 37
REFERENCES ............................................................................................................ 39
APPENDICES ............................................................................................................. 46
Appendix 1: Companies Listed at the NSE ................................................................ 46
Appendix 2: Companies Sampled for Review ............................................................ 49
Appendix 3: Companies with Z-score of less than 2.99 .............................................. 51
Page 8
viii
LIST OF TABLES
Table 4.1 Descriptive Statistics 28
Table 4.2 Correlation Analysis 29
Table 4.3 Model Summary 30
Table 4.4 Analysis of Variance 31
Table 4.5 Model Coefficients 32
Page 9
ix
LIST OF FIGURES
Figure 1 Conceptual Model 19
Page 10
x
ABBREVIATIONS
CDSC Central Depository and Settlement Scheme
EBITDA Earnings before Interest, Tax, Depreciation and Amortization
EBIT Earnings before Interest and Tax
GDP Gross Domestic Product
ICDC Industrial and Commercial Development Corporation
IFRS International Financial Reporting Standards
IPO Initial Public Offering
NSE Nairobi Securities Exchange
REIT Real Estate Investment Trusts
ROA Return on Assets
ROE Return on Equity
SPSS Statistical Software for Social Scientists
Page 11
xi
ABSTRACT The subject of corporate financial distress has become increasingly important to
stakeholders of any business as management of the precarious situation can lead to either
turnaround or total collapse of the business. This study aimed at establishing the effects
of financial distress on the value of firms listed at the NSE. The objectives of the study
were to determine whether financial distress had any notable impact on the value of the
firms listed at the NSE and whether distress risk was adequately priced by the market.
Particularly, the study focussed on financial distress as predicted by Altman’s Z-score
model and value of firm, proxy of which being market capitalisation. Secondary data was
collected from the annual reports and financial statements of 34 companies listed at the
NSE over a five-year period spanning between 2011 and 2015. Data was analysed using
Microsoft Excel 2013 and SPSS version 20.0.0.0. Regression and correlation tests were
conducted on the data to determine the nature and extent of the relationship between the
independent variable (financial distress) and dependent variable (value of firm).
Moderating variables in the study included financial leverage, profitability and quality of
assets. The study revealed a strong positive relationship of 74% between the log of
market capitalisation and the Altman’s Z-score. Further, the study shown that there
existed a positive beta value of 0.2054 between the two variables indicating that a unit
increase in Altman’s Z-score (an indicator of reduction in the level of financial distress)
would lead to 0.2054 increase in the log of market capitalisation with other factors held
constant.
Page 12
1
CHAPTER ONE
INTRODUCTION
1.1 Background
Business failure results in enormous economic consequences. The impact is especially
colossal for stakeholders of listed entities (Lin, Ko & Blocher, 1999). In many cases, the
failure is preceded by a period of uncertainty and the financial status of the company is
often by financial instability and distress. Andrade and Kaplan (1998) found out that
there was a direct relationship between firm’s level of borrowings and probability of
being financially distressed. Their study revealed that high-borrowing levels was the
primary cause of financial distress in many organisations.
Liquidity, a key component in the success of any business is critical in the effective
running of various segments of any business (Buseretse, 2015). Financial distress
becomes evident when a firm defaults on its obligations when they fall due (Platt 2002).
While research has shown that levered firms have a tax shield advantage compared to
those that are not, management and those charged with governance of these firms must
ensure that the firms are optimally leveraged to avoid the adverse effects of financial
distress, which may lead to a reduction of shareholder’s wealth (Pandey, 2010). In the
last decade, a number of entities listed at the NSE have had to deal with financial distress
emanating from a myriad of systematic and unsystematic variables.
A number of empirical studies (Andrade & Kaplan, 1998; Asquith et al., 1994;
Theodossiou et al., 1996; Whitaker, 1999) have provided some evidence that financial
distress arises mainly from endogenous risk factors, such as mismanagement, high
leverage, poor corporate governance, poor products offering, demotivated staff and
inefficient operating structure. The correlation between financial distress and these
factors is, according to capital market theory, of unsystematic nature and diversifiable.
However, financial distress may also be caused by exogenous factors, which are not
within the control of the organisation such as high interest rates, unfavourable changes in
government policy and high borrowing rates.
Page 13
2
1.1.1 Financial Distress
Platt and Platt (2006), through an empirical study concluded, that a firm is said to be in
financial distress when it gets into a demanding situation whether financially,
operationally or legally such that it cannot honour its obligations when they fall due. He
provided a multidimensional approach of determining whether an entity is financially
distressed by checking whether it has reported negative earnings before special items
such interest, depreciation, amortization and tax. This implied that entities, which were
financially distressed often, reported a loss from their key operational activities.
(Hofer, 1980) noted that in many cases, entities in financial distress strive to get out of
the difficult situation by executing different turnaround strategies such as downsizing,
elimination of loss making product lines, hiring of experts, restructuring, disposal of
unproductive assets as well as improving the working capital cycle. Different researchers
have embraced different definitions of financial distress depending on the specific aspects
of the business being considered in the studies. Lau (1987) interprets financial distress as
evidence of layoffs, restructurings, or missed dividend payments for consecutive periods.
Asquith, Gertner and Scharfstein (1994) define financial distress as a low interest
coverage ratio while Whitaker (1999) refers to financial distress as a condition when the
entity is operating with negative working capital. In this study, Altman’s Z-score was
used as an indicator of the level of financial distress; whereby a firm with a score of less
than 1.8 was considered to be financially distressed.
1.1.2 Value of Firm
Firm valuation is essential for various reasons, the most important being the
determination of the stock prices (Keys & Biggs, 1990) which reflect the performance of
the firm. Similarly, the value of a firm is determined through different parameters,
(Precha, 2004) but the most important ones relate to profitability and liquidity.
Depending on the requirements of the particular valuation (mergers and acquisitions,
Page 14
3
restructurings, takeovers etc.), different valuation techniques can be employed, with a
special consideration of the intended purpose.
The simplest method of valuation is the book value. This method is easy to use but it has
several shortcomings, the fundamental one being that it depends on historical aspects of
the assets and does not take into consideration expected future cash flows to be generated
by the assets. Further, the values are determined based on interpretation of accounting
standards that often require a certain level of judgement. This, therefore, may lead to
values that are significantly different from the realizable values (Goosen, Jensen, &
Wells, 1999. The second method is determination of the present value of all the expected
future cash flows expected to flow from the assets and discounted at a reasonable
discounting rate (Miller & Modigliani, 1961). Their hypothesis was however qualified by
certain assumptions which many scholars have often criticised as unrealistic such as
existence of a perfect market where all the participants are well informed, rational and
access information instantaneously hence eliminating the room for arbitrage profits.
The third measure is accounting net worth adjusted for any exceptional items such as
depreciation, amortization and other elements that are chiefly driven by accounting rules
in the simulation. These adjustments generally depend on the specific aspects of the
simulation though generally accepted rules can be defined in the simulation matrix. Other
methods involve application of certain levels of judgement to determine certain values
that are against ratings along a psychometric scale. The outcomes interpreted based on
certain scale are converted to monetary values through by application of certain
mathematical formulae (Precha, 2004). The fourth method of valuation is the
determination of the market value of its outstanding shares, simply referred to as the
market capitalisation. This is a common method of determining the value of companies
whose stocks are traded publicly. Its application, however, requires an efficient real
market for shares such as the Nairobi Securities Exchange with a considerable number of
frequent rational participants to achieve reliable valuation (Precha, 2004). For purposes
of this study, log of market capitalization was used as the proxy for value of firms listed
at the NSE.
Page 15
4
1.1.3 Financial Distress and Value of Firms in Kenya
An entity is said to be in a financial distress state if it faces operating, investing and
financing difficulties to the extent that it is not able to settle its obligations when they fall
due (Adeyemi, 2011). During the period of distress, the entity incurs various costs
whether directly or indirectly which often affects its ability to generate returns and
consequently lead to a reduction in the value of the entity. Directly attributable costs of
financial distress relates to costs incurred the entity in the effort to reverse the precarious
situation. Examples of these costs include restructuring fees, auditor’s remuneration,
management compensation and consultancy fees paid to lawyers, among others. On the
other hand, indirect costs are costs incurred by the entity principally to react to the actions
taken by stakeholders of the company such as employees, suppliers, investors and
shareholders (Pandey, 2010).
The state of financial distress in any organization reduces employees’ motivation and
creates an opportunity for them to agitate for revision of the terms of service. In most
cases, they spend their time looking for better opportunities as they may feel that the
company in its financial distress situation may not meet their personal growth targets.
Consequently, most of the talented employees are offered attractive compensation
packages by the competitors, which compel them to either leave the company or
renegotiate their compensation packages. Reduced productivity coupled with replacement
of talent results in a direct cost on the business and often destroy the company’s
reputation and value. The other possible outcome of financial distress state is the loss of
the market share to competition as the competitors may execute an aggressive strategy
aimed at attracting customers of the troubled entity through price wars and the distressed
entity may be driven out of the market (Natalia, 2007).
Pandey (2010) postulates that when an entity is in a state of financial distress, principal
suppliers become less forbearing and may restrict or suspend their suppliers for fear of
losing their funds should the entity be liquidated. Financiers or investors in the other hand
Page 16
5
shy away from providing the all required capital injection to the entity or provide the
finds at stringent terms making the already troubled entity unable to turnaround.
Consequently, unavailability of required resources such as supplies for use in the
production line and finances to acquire new assets or replace impaired ones hampering
the production process. In addition, shareholders may take a drastic measure of investing
the little resources left in risky undertakings with the home that the projects results in
positive cash flows reversing the desperate situation and resulting in gains to them.
However, if the projects fail, creditors suffer significant losses.
Pandey (2010) further observes that managers of a distressed firm are often tempted to
misappropriate entity’s assets and resources and at the same time become more and more
risk averse. The immediate consequence of this situation is that short-term decisions and
interests are given attention as opposed to long-term strategies that would sustain the
business in the long run. As a result, investments in the quality of the products and
support through acquisition of the appropriate assets take a back seat. Further,
accountability is not enhanced as the focus shifts to management of liquidity to avoid
deepening the crisis. Ultimately, the entity fails to take advantage of potential investment
opportunities that may reserve the distress situation.
The state of financial distress, therefore, leads to weakening of a financial system of the
troubled entity and prejudices the rapport between the entity and various stakeholders
including the employees. Employees become strained and their motivation levels reduce
resulting in a negative impact on the entire organisation structure. Loss of key employees
is detrimental to the survival of the already strained entity and can easily force the entity
into liquidation (Natalia, 2007). There is, therefore, a need to constantly review the
financial status of the entity and evaluate whether there are indicators of distress so that
the adverse effects are eliminated before the actual impact is felt.
Page 17
6
1.1.4 Nairobi Securities Exchange
In Kenya, dealings in shares and stocks dates back to 1922 when an informal exchange
was launched in the Exchange Bar at the Stanley Hotel in Nairobi. However, the market
was not formal, as there did not exist any rules and regulations to govern stock broking
activities. Trading took place on a ‘gentleman's agreement.’ Standard commissions were
charged with clients being obligated to honour their contractual commitments of making
good delivery, and settling relevant costs. At that time, stock broking was a side-line
business conducted by accountants, auctioneers, estate agents and lawyers who met to
exchange prices over a cup of coffee (https://www.nse.co.ke/nse/about-nse.html). In
1951, the first professional stock broking firm was established and in 1953, NSE was
recognized as an overseas stock exchange.
In 1954, NSE was registered as an association of stockbrokers under the Societies Act.
Trade was conducted by telephone and prices determined through negotiation. In 1988,
the first privatisation through the NSE was realised through a successful sale of a 20%
government stake in Kenya Commercial Bank and in 1991, NSE was registered as a
private company. The company has achieved significant milestones such as automation
of clearing and settlement of shares under Central Depositor and Settlement Corporation
(CDSC) in 2004 and on Monday, 11th September 2006, live trading on the automated
trading systems of the Nairobi Stock Exchange was implemented. NSE has continued to
innovate and has introduced different market segments as well as new products such as
the Real Estate Investment Trusts (REITs).
1.2 Research Problem
Evaluating the capability of a company to remain a going concern in the foreseeable
future is an area of significant interest to investors, creditors, auditors and other
stakeholders. The significance of this issue has stimulated a lot of research concerning
financial distress and formulation of various theories such as the Credit Risk Theory
Page 18
7
hypothesised by Merton in 1974. This theory asserts that a credit risk arises when a
borrower does not repay the borrowed funds when they fall due and the lender is exposed
to a potential loss due to default. Defaulting on settling obligations when they fall due is
an indicator of financial distress, which leads to loss of value (Tan, 2012).
A number of organizations listed at the NSE such as Uchumi Supermarkets Limited,
Kenya Airways, Mumias Sugar Limited, and Express Kenya Limited etc. have gone
through cycles of financial distress in the recent past arising from a myriad of factors. A
research project on the effect of financial distress on the value of the firm, therefore,
presents a pool of knowledge for companies listed at the NSE to establish if they are in
distress and if so, how their values are affected and how to rectify the situation. Further,
this study presents a perfect opportunity for assessing how firms operating in highly
turbulent and competitive environment as well as with inherent operational risks may be
affected by financial distress. These circumstances may be worsened if the firms are
highly leveraged. High operational risks coupled with high debt levels may lead to
financial distress leading to negative return on equity. These factors exacerbated by
negative perception in the market, loss of market share and imminent low investor
confidence often lead to depreciation of the value of the company (Tan 2012).
Numerous studies on prediction of corporate bankruptcy or financial distress have been
conducted both locally and internationally. Tan (2012) did a study to evaluate the
correlation between financial distress and value of the firms in Asia. He concluded that
financially distressed firms performed below average and their market values deteriorated
during the season of distress. His study however was limited to the period of Asian
Financial Crisis of 1997 and 1998 hence the need to conduct a current study to establish
whether the findings still hold for a developed financial systems. Mohamed (2013)
conducted a study on bankruptcy prediction of firms listed at the NSE using Altman’s Z-
score model. Her findings were congruent with those of Makini (2015) who conducted a
study to test the validity of Atman’s Z-score model in predicting financial distress of
firms listed at the NSE. The two researchers concluded that while Altman’s Z-score
model is a popular bankruptcy prediction model, it is qualitative in nature and does not
Page 19
8
take into account other factors that may lead to corporate failure such as corporate
governance, changes in the competitive environment, product failures, adverse changes in
legislation among others which ultimately affect the value of the firms. These findings
were similar to those of Lin, Ko & Blocher (1999) in their study on predicting corporate
financial distress who concluded that financial distress precedes bankruptcy.
While many studies have been undertaken on the prediction of financial distress
(Andrade & Kaplan, 1998, Lin, Ko & Blocher, 1999, Tan, 2012, Makini, 2015), few have
been undertaken to establish the impact of financial distress on the value of the firms.
This study, therefore, intends to answer the question: what are the possible indications of
financial distress and how does financial distress impact on the value of the firms listed at
the NSE?
1.3 Objectives of the Study
Financial distress, whether resulting in insolvency or not, has many direct and indirect
costs on the business. For instance, investors may shy away from supplying required
capital injection to the business or provide funds at high cost coupled with unfavourable
repayment terms making it difficult for the business to raise funds required to take
advantage of profitable investments. Similarly, shareholders who have limited liability of
the company may decide to invest in more risky projects, which are deemed to offer more
returns with whatever cash the firm may be left with (Pandey, 2010). Managers of these
firms must therefore strive to strike a balance between taking advantage of tax shield on
interest expense and the possible impact of financial distress. It is against this backdrop
that this research endeavours to establish the impact of financial distress on the value of
entities listed at the NSE and whether the distress risk is adequately priced in the market.
1.4 Importance of the Study
Many research projects on the characteristics of financially sound businesses have been
conducted over time. However, research financial distress is relatively young and the
Page 20
9
subject has not been conclusively research to create an adequate pool of knowledge. The
findings of this study are, therefore, important to several parties including commercial
banks that provide short term and long term financing to organizations listed at the NSE,
potential investors, the Government of Kenya and researchers.
Banks and other financiers’ benefit from its findings by understanding how financial
distress impact on the value of organizations listed at the NSE. This is due to the fact that
when companies are in difficult financial position, they are quickly confronted with the
dilemma of how to inject capital to fund their restructuring and turnaround strategies. The
fact that financial boost may not necessarily lift the company from the troubled situation,
(Natalia, 2007); these companies are aligned to seeking funds from the banks who must
consider these risks when pricing their products.
The Government of Kenya benefits from the findings of this study by understanding how
financial distress impacts on the financial performance and value of entities listed at the
NSE and is better placed to formulate and implement policies that not only safeguard
companies’ liquidity but also improve their financial performance. Other companies
listed at the NSE benefit from the findings of this study by understanding the challenges
facing financially distressed firms and how they can position themselves to overcome
them (Thuo, 2012). This is due to the fact that several empirical studies have indicated
that financial distress is largely unsystematic (Andrade & Kaplan, 1998; Asquith et al.,
1994; Theodossiou et al., 1996; Whitaker, 1999), and therefore can be diversified
successfully.
Researchers on the other hand benefit from the findings of this study because it fills the
current research gap where current studies reveal that public listed firms encounter
financial distress from time to time (Muthamia, 2013) but do not conclusively determine
whether or not such situations effect the value of these firms and whether distress risk is
adequately priced in the market.
Page 21
10
CHAPTER TWO
LITERATURE REVIEW
2.1 Introduction This chapter examines the relevant literature relating to predicting, signs and effects of
financial distress as well as the funding and liquidity of firms as a prerequisite for
alleviating or minimizing the effects of financial distress. Section 2.2 presents the
theoretical literature review while section 2.3 outlines the determinants of financial
distress and value of a firm. Section 2.4 presents empirical literature from international
and local studies while section 2.5 shows the conceptual framework and finally section
2.6 draws a conclusion based on the reviews.
2.2 Theoretical Literature Review This section reviews theoretical literature on business funding and liquidity which are
essentially the main theories on capital structure, credit risk and cash management. We
have, therefore, focused on Capital Structure Theory, Trade-off Theory, and Credit Risk
Theory.
2.2.1 Capital Structure Theory Capital Structure Theory also referred Modigliani-Miller Theory or simply MM theory,
was developed by two great scholars, Modigliani and Miller in 1958. The theory
postulates that capital structure is irrelevant as far as the returns on investments are
concerned and that leverage of the firm has no effect on the market value of the firm
(Modigliani & Miller, 1958). It is however, founded on certain assumptions such
existence of a perfect market where the participants are rational, which have been
criticised by scholars. Their study and argument makes this theory particularly relevant in
this study as most of the companies listed at the NSE are highly leveraged in their capital
structure raising the question of when a balance should be achieved between the benefit
of tax shield on the interest expense and the adverse effect of financial distress.
Page 22
11
Stiglitz (1969) approved the validity of the MM theory under their assumptions saying
that the theory formed a starting point for a thorough appreciation of the funding function
of a business. Kraus and Litzenberger (1973) also supported the theory within the
assumptions of risk-free debt and costless bankruptcy. McDonald and Koch (2006) in
their extensive research on bank management, argue that since banks operate with less
equity than non-financial companies, they are faced with increased financial leverage and
volatility of earnings. Since earnings affect the value of a firm, McDonald and Koch
(2006) effectively appear to challenge the Modigliani-Miller theory. Durand (1963) also
criticized the Modigliani-Miller theory on grounds of its assumptions saying that they
were unrealistic and do not exist in modern economies.
2.2.2 Trade-off Theory The trade-off concept hypothesised by the trade-off theory is applied in a situation where
the firm works towards striking a balance between taking advantage of tax shield on
interest expense arising from debt financing and the actual cost of the debt. A number of
considerations are made such as agency costs and potential cost of distress to ensure that
the organization arrives at an optimal capital structure incorporating debt and equity
financing. Trade-off theory has received support and criticism in equal measure
especially due to debates over validity of MM theory. Trade-off theory postulates that
when corporate taxes are incorporated in the MM theory, the tax shield on interest
expense is an added benefit to the business making debt financing more preferred
compared to equity financing (Mokhova & Zinecker, 2013).
On the one hand, evidence from empirical studies suggest that even though preferred
level of leverage may exist, it is not as critical as since many studies reveal that leverage
reduces with profitability which contradicts the trade-off prediction; that more profitable
organisations should borrow more to take advantage of tax shield. Managers, therefore,
are confronted with the dilemma of taking advantage of tax shield and the adverse effects
and costs of financial distress. In order to deal with this dilemma, the organisation trades-
Page 23
12
off between tax benefits and the risks associated with of financial distress. This assertion
is of particular importance in this study as most of the firms listed at the NSE have some
level of leverage in their capital structure. Hewlege and Liang (1996) in their study on the
validity of pecking order theory finds the ease of raising finance for business operations
does not depend of the level of retained earnings and organizations that could easily
acquire bank loans often preferred equity financing instead.
2.2.3 Credit Risk Theory
Credit risk theory, otherwise referred to as the Structural Theory was introduced by
Merton in 1974. The theory explains that default is likely to arise through a diffusion
process characterised by certain external parameters, usually refereed by the theory as,
structural models. Through these models, default risk is inherent and as a result, actual
default on the agreed terms can occur at any time during the period of the debt instrument
and not necessarily on maturity (Longstaff & Schwartz, 1995). This implies that, credit
risk must be assessed continuously and actions taken to avert any adverse effects.
Credit, in most cases, involve two parties, the lender (who bears the credit risk in case of
default) and the borrower. The two parties get into a mutual agreement such that the
lender agrees to provide goods and services or provide financing and the payments to be
made a later date with or without an interest component. In as much as the two parties
agree to abide by the agreement, credit risk arises as not all borrowers manage to repay
the borrowing amounts when they fall due (Cornett & Saunders, 2006). The lenders are
exposed to credit risk, which is simply the risk of partial or total loss whether financially
of otherwise when the situation is not addressed and reversed in good time (Nyunja,
2011). This assertion is significant for purposes of this study as financial distress is one of
the factors that may lead to default on the contractual obligations between the lender and
the borrower. .
Page 24
13
2.3 Determinants of Financial Distress and Value of Firms The contributors or causes of financial distress in a firm can be been divided into
endogenous and exogenous factors (Pandey, 2010). Endogenous factors are associated
with individual firm’s internal characteristics that affect performance and are within the
firm’s control. Karels and Plakash (1987) stated that endogenous factors, which are the
main contributors to financial distress, can be accredited to poor corporate governance
and mismanagement of company resources. External factors are chiefly the
macroeconomic influences that are beyond the control of the firm. These external risk
factors are universal and generally affects all companies irrespective of the industry they
are operating in provided the entire market is affected. Empirical studies have provided
evidence that some of the external risk factors are unfavorable interest and exchange
rates, high inflation, unfavorable legislation among others. These factors do not depend
on the level of experience or competence of the management (Karels & Plakash, 1987).
2.3.1 Capital Adequacy and Quality of Assets Capital is defined as the level of equity funds provided to support the business operations
and act as cushion against unprecedented losses (Athanasoglou, Sophocles & Matthaios,
2005). It is a source of liquidity given that most deposits are prone to fluctuations in
amounts and pricing. It has also a direct effect on performance because it allows
expansion into risky but profitable business opportunities (Sangmi & Nazir, 2010) and
acquisition of assets to generate revenues.
On the other hand, the quality of assets held by a firm determines its ability to generate
cash flows necessary to invest in more profitable projects or retire debts. This implies that
the quality of the assets portfolio determines the firm’s profitability, in that a good quality
of assets is an assurance of future cash flows (Natalia, 2007). A good portfolio mix of
assets means that the firm can generate revenues more efficiently without having to
necessarily incur huge costs in terms interest costs.
Page 25
14
2.3.2 Management Efficiency Management efficiency in the use of company resources is sometimes used as a measure
of quality. It is reflected in the level of operating expenses, with a lower level of
operating expenses being an indicator of higher level of management efficiency,
profitability and value of the firm (Athanasoglou et. al., 2005). There are other measures
used to evaluate the management efficiency such as the level of motivation of staff,
extent of deterrence and detection of fraud, strength of the internal control systems,
management culture, consistency and perception in the market.
When a firm is financially distressed, managers may be tempted to misappropriate assets
and misuse entity resources in the form of incentives and generally avoid risky
investments. They may start focusing on the short-term rather than long-term strategies
which would be in the best interest of the firm (Pandey, 2010). These decisions often
aggravate the already delicate situation of the company leading to further loss in value.
2.3.3 Funding/Liquidity Management Liquidity determines the ability of an organization to take immediate advantage of
profitable investments. An organization that is adequately funded is better placed to
negotiate for better terms of trade as most suppliers would want to deal with it. Funding,
therefore, is a prerequisite for success of organizations especially in a highly competitive
market. Dang (2011) through an empirical analysis of leverage, debt maturity and firm
investment noted that adequate level of funding and liquidity was positively correlated to
profitability. He concluded that high leverage is disadvantageous to the organization’s
level of investment and limits the organization’s growth opportunities.
The most common ratios for measuring liquidity according to Dang (2011) are quick
ratio (current assets to current liabilities) and total assets to total liabilities. In this study,
Page 26
15
we focused on these ratios among others. Said and Tumin (2010) however find no
relationship between liquidity and profitability amongst Chinese and Malaysian banks.
2.3.4 Macroeconomic Factors Macroeconomic factors are generally the factors that universally affect all the businesses
in the industry such as high interest rates, high inflation levels, unfavorable government
legislation and political environment. These factors have a direct impact on the
profitability of the organizations and their effects cannot be diversified away as they are
not organizational specific. When the economy is experiencing a season of boom,
empirical studies have shown that appetite for loans to support the growth is usually high
compared to season of economic recession. Athanasoglou et al. (2005) argue that the
correlation between inflation and profitability and hence the value of a firm is debatable,
an argument also supported by Vong and Hoi (2009).
Pan & Pan (2014) in their comprehensive study on macroeconomic factors and
profitability of commercial banks in China conclude that macroeconomic environment
had a significant effect on the ability of commercial banks in Chine to generate returns
for the shareholders. They noted that profitability of the banks sampled had a directly
relationship with the level of vibrancy of the economy, interest rates, liquidity levels in
the market and inflation levels. On the other hand, they noted a negative correlation
between the total market capitalization of the stocks have negative correlations and
profitability. From their study, they concluded that while there are many macroeconomic
variables that affect the level of profitability in the market, economic vibrancy measured
by the level of money supply and growth was the most obvious.
2.4 Empirical Literature Review
This section reviews the international and local studies on financial distress and their
relevance to this study. Similarities and differences in the findings by the various
researchers are also drawn.
Page 27
16
2.4.1 International Studies on Financial Distress Natalia (2007) conducted an empirical on the distress risk in the organizations that faced
a certain level of financial distress. She noted that financial distress is generally
disproportionate and depends on many factors including the general performance of the
market. During seasons of economic boom, distressed stocks attract investors’ attention
as they foresee an opportunity to enjoy huge returns after a successful implementation of
turnaround strategies. However, during seasons of economic recession, investors are
usually conscious of the losses they are likely to make should the situation worsen and
become more risk averse.
Pasaribu (2008) conducted a study that aimed at establishing the characteristics of
financially distressed entities listed at the Jakarta Stock Exchange. His study focussed on
the entities listed in the trading segment of the Exchange. The empirical results of his
study showed that companies that were characterised by a lack of economic value-add,
illiquidity, low efficiencies at the operating level as well as high level of debt had a high
probability of being financially distressed. He concluded that though there were many
possible contributors of financial distress in an organization, high leverage was a key
indicator.
Tan (2012) conducted a study on financial distress and financial performance with a
focus on the Asian Financial Crisis of 1997-1998. His sample comprised of 277 entities
and noted that the crisis had caused an exogenous shock, which changed the focus of
management from dealing with internal issues such as financial performance and
leverage. The study reaffirmed the findings by other researchers that high financial
leverage contributed to a great extent the decline in the value of the firms. It was clear
from the findings of his study that entities with low financial leverage outperformed those
with high financial leverage and they were better placed to withstand external shocks.
Page 28
17
Anggraini (2014) conducted a study to establish an appropriate financial distress
prediction model for Indonesian companies with the added variable of corporate
governance. The research involved 42 companies, which were consistently in the
performance index for Stock Exchange in Indonesia within 3 years (2011-2013) period.
The estimation model used was panel data regression, with Fixed Effect Method
approach. He concluded that while managerial ownership had an inconsequential effect
on financial distress, institutional ownership had a substantial effect on the ability of the
entity to withstand financial distress. Liquidity as a moderating variable had no
significant influence towards the ownership structure.
Mahama (2015) assessed the state of financial distress through the application of
Altman’s Z-score 10 entities listed at the Ghana Stocks Exchange for the period between
2007 and 2013. He noted signs of financial trouble as; company not timely paying
creditors; company being sued in collection matters; company suffering a significant
event that is not deemed to recur; company’s bank or secured lender threatening to shut
down business operations; a union threatening some type of action against the company;
a major supplier threatening to terminate services to the company; company not being
able to perform its contracts on time or cannot perform at all; liabilities of the company
being greater than its assets; and company’s business model no longer being viable.
2.4.2 Local Studies on Financial Distress Bwisa (2010) tested the usefulness and validity Altman’s revised model in predicting
financial distress for entities in Kenya. He noted that the model was reliable as it resulted
high level of prediction accuracy with 60% of the analysed sample showing an overall
70% validity of the model. He concluded that the model was a good tool that can be
applied by organisations in various sectors to determine if they were in distress so that
appropriate corrective actions such as hiring of turnaround managers can be taken in
good time.
Page 29
18
Kipruto (2013) adopted the Multivariant Discriminant Analysis (MDA) statistical
technique as used by Altman. He was concerned with testing the validity of Altman’s
model for predicting financial distress in Uchumi supermarkets. He found out that the
model was a good predictor of financial distress. The company recorded 21 declining Z-
score values indicating that it was experiencing financial distress and hence the reason for
its delisting from the NSE in 2006.
Memba and Job (2013) in their study on causes of financial distress in firms financed by
ICDC Kenya established that financial distress was largely caused endogenous factors.
They identified a number of these factors, the key ones poor corporate governance
coupled by weak internal control systems. Other factors included improper use of
resources, inappropriate capital structure, difficulties in accessing affordable credit,
shortage of capital and poor human resources policies and practices leading to
unwarranted legal battles. Their findings were in tandem with the findings of Tan (2012)
on financial distress of companies in Asia.
Mohamed (2013) conducted a study that aimed at predicting bankruptcy of entities listed
at the NSE using Altman’s Z-score model on a sample of nine successful firms and seven
failed firms. She noted that though the model is ideal for predicting financial distress and
has been widely used in different markets, it wrongly classified 25.7% of the observed
firms as safe even though they were delisted from NSE. Her study shows that the model
should be used with caution and a multi-discriminant analysis model should be used as it
incorporates other variables and hence can yield a higher predictive accuracy.
2.5 Conceptual Framework
According to Pandey (2010), determinants of financial distress with or without
insolvency can be divided into internal (intrinsic) and external (extrinsic) factors. The
intrinsic factors refer to challenges within the firm and only affect the particular firm or
simply firm specific challenges. Examples are poor management of firm’s resources,
misappropriation of assets and fraud. On the other hand, extrinsic factors are universal
Page 30
19
and generally impact all the businesses operating in the given market. They emanate from
adverse changes in macroeconomic variables (Karels & Plakash, 1987). Figure 1 shows
the conceptual model illustrating how the various variable contribute to the subject of this
study, the independent variable being financial distress and dependent variable being the
value of firm.
Figure 1: Conceptual Model
Independent Variables Moderating variable Dependent Variables
Source: Pandey, I. M. (2010). Financial Management (10th Ed)
Endogenous factors
• Management efficiency
• Internal control system
• Operational efficiency
• Resources availability
• Quality of assets
• Succession planning
• Quality of products and
services
Exogenous Factors
• Competition in the market
• Market risks
• Commodity prices
• Rates of exchange
• Borrowing rates
• Government legislation
• Inflation rates
Company characteristics
• Size
• Profitability
• Maturity
• Industry
• Agility to changes in
the environment
Financial Distress
and
Value of firm
Page 31
20
This study focused on the impact of financial distress on the value of firms listed at the
NSE. The independent variable was financial distress while the dependent variable was
the value of the firms. Moderating variables included the level of leverage, profitability
and the quality of the assets. The independent and moderating variables in this study were
largely driven by the company characteristics and were therefore driven largely by
endogenous factors listed above. The nature and quality of the assets of the company
determines the quality of the products and services and the ability of the company to
command a competitive edge in the industry in which it operates as well as agility to the
changes in the operating environment. These factors contribute to the capability of the
company to attract strategic investors who provide the financial muscle required in times
of distress (Ooghe & Prijcker, 2008).
Empirical studies have supported a strong positive correlation between the level of
returns and the investment in quality assets implying that if the assets were utilised
efficiently, the entity would always generate a corresponding return to the investment in
assets. Further, the quality of the assets enables the company to innovate, expand the
product and services range and adapt to the changes in the environment with ease. In this
study, therefore, quality of the assets as measured by ROA as well as profitability as
measured by ROE were adopted as moderating variables.
2.6 Summary of Literature Review
Existing literature identifies a strong positive link between financial distress and return on
equity and consequently the value of the firms. However, some of the empirical studies
do not lead to the same conclusion such as the study of Said and Tumin (2010) on the
empirical review of performance of Malasian and Chinese banks. There is also a growing
debate as to whether poor performance and loss of value in financially distressed
institutions is as a result of the financial distress situation itself or other factors that would
need isolation. The question of whether distress risk is adequately priced by the market
also arise and it is against this back drop that this study seeks to examine the effects of
financial distress on the value of firms listed at the NSE.
Page 32
21
CHAPTER THREE
RESEARCH METHODOLOGY
3.1 Introduction
This chapter reviews the methodology of the study. Section 3.2 highlights the research
design while section 3.3 discusses population and sample adopted in the study. Section
3.4 reviews the sources of data and the collection instruments employed in the study. The
chapter culminates with section 3.5 which presents data analysis, conceptual and
analytical models.
3.2 Research Design The objectives of this study were to find out the effects of financial distress on the value
of firms listed at the NSE and whether the distress risk was adequately priced in the
market. Shukla (2010) defines research design as the roadmap for carrying out a research
project. It gives a general structure of how the research should be conducted and assists
the researcher to keep the big picture in mind throughout the research process. A well
throughout research design is critical as it reminds the research the key aspects especially
when there are temptations to wander away from the initial outline of the study. This
study employed a correlational study design with a focus on companies listed at NSE
Mugenda and Mugenda (2003) presents a correlational research design as a specific type
of non-experimental design used to describe the association between two variables or
among many variables that could be positive, neutral or negative. This design was
considered appropriate for this study as it assisted the researcher in establishing the
nature and strength of the relationship among the variables. The study made use of
correlation and regression techniques as they were considered the best tools for analyzing
relationships and predictions among financial or economic variables (Mugenda and
Mugenda, 2003). The study involved more than one independent variables and therefore
made use of multivariate econometric technique to establish relationships among
Page 33
22
variables. Besides finding out if there were any relationships, these techniques also
helped in determining the strength and directions of the relationships.
3.3 Population and Sample
Target population refers to the complete cluster of objects to which a researcher intends
to generalize the findings or outcomes of the study (Mugenda & Mugenda, 2003). For
purposes of this study, companies listed at the NSE comprised the target population. A
total of 67 firms, whose securities were offered for trading at the NSE as at 30th
September 2016 formed the target population. These companies have been granted
approvals by Capital Markets Authority to offer their securities for trading at the NSE
after fulfilling certain terms and conditions and are listed in Appendix 1.
Sampling is a thoughtful process of identifying specific objects from the target population
for testing while ensuring the selected objects represent fairly the characteristics for the
entire population (Orodho & Kombo, 2002). In this study, a purposive sampling model,
which is a nonprobability sampling technique, was considered the most appropriate in
selecting the specific objects to be tested. This is due to the fact that it gives the
researcher a leeway of identifying and testing the specific objects with the required
information or characteristics (Mugenda & Mugenda, 2003). The sample selected for this
study comprised all the listed companies at the NSE in the automobile, commercial and
services, construction, energy and manufacturing sectors because they possessed the
required information and Altman’s Z-score, a proxy for financial distress would apply for
these companies. Appendix 2 shows the list of the companies that were sampled for the
study.
Empirical evidence from studies on predicting financial distress in companies listed at the
NSE show that most of the firms listed at the NSE may have experienced financial
distress in one way or another (Makini, 2015). The study focused on 34 companies in the
automobile, commercial and services, construction, energy and manufacturing sectors out
of the 67 companies listed at the NSE. However, the data that was analyzed related to
Page 34
23
those companies that experienced financial distress as predicted by Atman’s Z-score
during the period between 2011 and 2015. These were the companies whose Z-score in
any of the years under review was noted to be less than 2.99 as shown by Appendix 3.
3.4 Data and Data Collection Instruments
The study used secondary data which was be obtained from annual audited financial
reports, NSE Investor Handbook (2015-2016), and organisation’s records such as in-
house magazines, journals, publications as well as websites of firms studied. Financial
information of a five-year period between 2011 and 2015 was used since it was
considered current and long enough to provide sufficient variables to assist in
determining the effects of distress on the value of the firms with the data frequency being
yearly.
The data collected was quantitative in nature. Financial information extracted related to
working capital, total assets, total liabilities, retained earnings, borrowings, EBIT, the
book value of the equity and revenues. The collected data was reorganised and used to
determine liquidity and profitability ratios such as the current ratio, ROA, ROE and
Leverage. The currency used for reporting the data was the Kenya shillings, abbreviated
as KES. The dependent variable was the value of the firm as measured by the log of
market capitalization of the shares of the entity.
3.5 Data Analysis Marshall and Rossman (1999), define data analysis as the process that involves
reorganizing the data for purposes of extracting meaningful information that would be
used to make deductions. The data was analyzed using Microsoft Excel (MS Excel) and
Statistical Software for Social Scientists (SPSS) Version 20.0.0.0. SPSS and MS Excel
were preferred as they produce output that find adequate statistical inference and
generally easy to use. The output of the data analysis was reported in various tables
highlighting the relevant statistics.
Page 35
24
3.5.1 Conceptual Model This section covers the relevant variables that were used to establish the effects of
financial distress on the value of firms listed at the NSE over a period of five years
between 2011 and 2015. These variables were categorised into dependent (denoted by Y)
and independent variables (denoted by X) and their relationship expressed in terms of a
mathematical function yields the following:
Y= f (X1, X2, X3, X4)
Value of firm = f (Financial Distress, Quality of Assets, Financial
leverage, Profitability)
The dependent variable in this study was the value of the firms listed at the NSE. Market
capitalisation was used as the proxy for the value of the firm and hence the discriminant
variable. It represents the market value of all outstanding shares and requires an efficient
real market for shares such as the NSE with a considerable number of frequent
participants to achieve reliable valuation (Precha, 2004). At the NSE, market
capitalization is measured by the 20 shares index and the All shares index, both of which
are a representation of the value of the shares of various companies listed at the NSE and
hence the value of those companies.
According to Pandey (2010) financial distress results in many direct and indirect costs
and hence a significant impact on the value of the firm. Direct costs may include the
insolvency costs which in many cases lead to high legal and administrative costs. Indirect
costs on the other hand may relate to the reactions by various stakeholders such as
managers and potential investors in situations of distress. These costs of financial distress
causes an increase in the expected rate of return by potential investors resulting in a
reduction in the value of the firm. For purposes of this study, financial distress was
measured by Altman Z-score.
Many local studies have been carried out to determine the validity of Altman’s Z- score
model in predicting financial distress on Kenyan entities. Makini (2015) found a very
Page 36
25
strong relationship between the Z-score and the variables. He concluded that the model
was applicable for predicting financial distress of firms listed at the NSE. His findings
were similar to those of Kipruto (2015), who used the model to predict financial distress
in Uchumi Supermarkets Limited. Mohamed (2013) in her study of bankruptcy prediction
of firms listed at the NSE concluded that the Altman’s Z-score was a useful measure for
quick determination of the level of financial distress in an organisation.
Altman’s Z-score model identifies five key independent variables (illustrated below by
M1, M2, M3, M4, M5) which are used to predict the existence of financial distress in an
entity.The Alman’s Z-score is then determined by the following equation.
Z=0.012M1+0.014M2+0.033M3+0.006M4+0.0999M5
Where: M1 – Working Capital (WC)/Total Assets (TA)
M2 – Retained Earnings (RE) /Total Assets (TA)
M3 – Earnings before Interest and Taxes (EBIT) /Total Assets (TA)
M4 – Market Capitalization (MC) / Total Liabilities (TL)
M5 – Sales (S)/Total Assets (TA)
The resulting Z-score is then interpreted as follows; when Z is greater than or equal to
3.0, the entity is considered to be safe; when Z is between 2.7 and 3.0, the entity is
probably safe but this is in the grey area and caution should be taken. However, when Z
is between 1.8 and 2.7, the company is likely be fall into trouble situation within two
years and when Z is <= 1.8, the company is highly likely to be in financial distress
(Altman, 1984).
The other dependent variable for the study was quality of assets which determines the
ability of the assets to generate cash flows necessary to invest in more profitable projects
or retire debts. In this study, quality of assets was measured by ROA. Return on Assets
(ROA) which is a ratio of the income earned by the firm to the assets used in business
operations is a key ratio for measuring financial performance. It is commonly defined as
the net income (or pre-tax profit) over total assets. ROA shows the ability of management
to acquire assets at reasonable costs and spend them in profitable investments (Ahmed,
Page 37
26
2009). A higher ROA is an indicator that the firm has efficiently utilized its assets to
generate revenues.
Financial leverage as a moderating variable in this study was operationalized as the
extent to which firms listed at the NSE maintained a level of leverage that maximized tax
advantage of interest deductions and improved company performance while ensuring that
the company did not get into financial distress (Gill et al, 2012). It was measured as a
ratio of total debt (arising principally from borrowings) to total equity. Profitability on the
other hand, as measured by Return on Equity (ROE), was another measurement of
financial performance and defined as net profit as a proportion of the total shareholders’
funds injected to the business. ROE was considered an important indicator of a firm’s
profitability and growth potential. Unlike ROA which is a measure of financial
performance that is important to all providers of funds, ROE is mainly important to
equity holders (Ahmed, 2009).
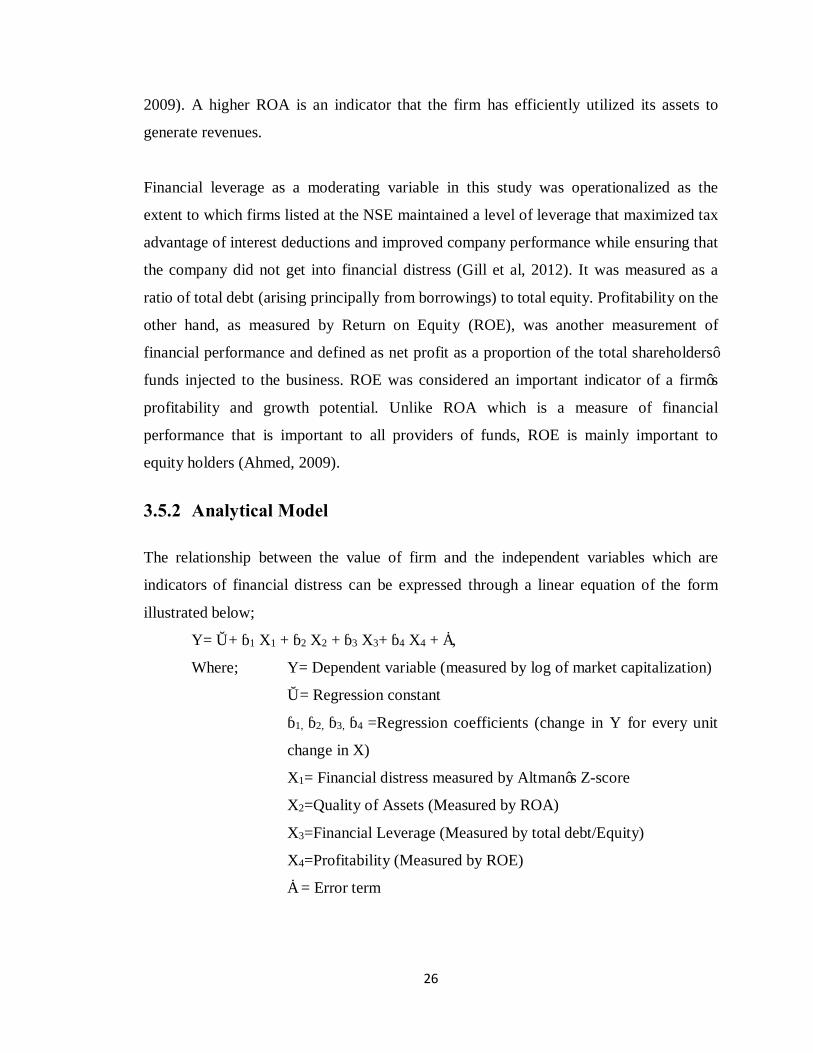
3.5.2 Analytical Model
The relationship between the value of firm and the independent variables which are
indicators of financial distress can be expressed through a linear equation of the form
illustrated below;
Y= α + β1 X1 + β2 X2 + β3 X3+ β4 X4 + ℮,
Where; Y= Dependent variable (measured by log of market capitalization)
α = Regression constant
β1, β2, β3, β4 =Regression coefficients (change in Y for every unit
change in X)
X1= Financial distress measured by Altman’s Z-score
X2=Quality of Assets (Measured by ROA)
X3=Financial Leverage (Measured by total debt/Equity)
X4=Profitability (Measured by ROE)
℮ = Error term
Page 38
27
3.5.3 Diagnostic tests
The nature and strength of the relationship between the dependent and independent
variables was measured through various diagnostic tests such as tests for multicollinearity
among the variables and the tests of normality. Correlation coefficient of greater than 0.9
for the various variables was deemed to be an indicator multicollinearity and appropriate
adjustments were made. The study made use of the Analysis of Variance (ANOVA)
technique to test the hypothesis concerning the relationship between financial distress and
the value of firms listed at the NSE. The test which was a two-tailed test was done at a
95% confidence level and, therefore, a 5% level of significance. The regression
coefficient of determination was used to test the strength of a cause and effect of the
correlation between the dependent variable (value of the firm) and the independent
variables (Financial distress, Quality of Assets, Financial Leverage and Profitability).
Page 39
28
CHAPTER FOUR
DATA ANALYSIS, RESULTS AND DISCUSSION
4.1 Introduction This chapter highlights data analysis, results and discussion of the findings. Section 4.2
highlights the summary statistics while section 4.3 discusses the results of diagnostic
tests. Section 4.4 presents the estimated model and section 4.5 discusses the findings of
the study. The chapter culminates with section 4.6 which summarizes key findings.
4.2 Summary Statistics The study sought to determine the effects of financial distress on the value of firms listed
at the NSE. The main reason was to assist the researcher to establish whether the distress
risk emanating from both endogenous and exogenous factors affecting organizations in
Kenya was adequately priced in the market. Table 4.2.1 describes the data used in the
study by providing the measures of central tendency, dispersion, skewness and kurtosis.
Table 4.1 Descriptive Statistics
Measure Altman's Z-score
ROA Leverage ROE Market Capitalization
Mean 2.074266 -0.001676 0.031933 0.210357 4.783587 Standard Error 0.331291 0.0176736 1.069334 0.217819 0.194436 Median 2.100128 -0.016865 0.816603 0.069599 4.987611 Standard Deviation 0.740789 0.0395195 2.391104 0.487058 0.434773 Sample Variance 0.548769 0.0015617 5.717381 0.237226 0.189028 Kurtosis 0.636698 -0.377294 4.605383 3.826684 4.901204 Skewness 0.210852 0.7334899 -2.11558 1.89268 -2.20966 Coefficient of Variance 0.159715 10.545107 33.48680 1.035473 0.040646 Minimum 1.106401 -0.044759 -4.20012 -0.16632 4.007717 Maximum 3.118146 0.0559436 1.644327 1.054068 5.006949
Source: The data in the table above shows the descriptive analysis of information derived
from the audited accounts of firms listed at the NSE between 2011 and 2015
Page 40
29
The results from the descriptive statistics of firms with a certain level of financial distress
as predicted by Altman’s Z-Score reveal that for the 25 observations made from 5
companies for the years between 2011 and 2015, average value of firms as measured by
the log of average market capitalisation was 4.783. Altman’s Z-score, leverage, and
return on equity had positive mean values while quality of the assets as measured by
ROA had a negative mean value. The coefficient of variance (CV) as determined by
standard deviation divided by the mean indicated that for the sample selected, there was
relatively high variance on leverage and return on assets (CV>1) and a low variance on
Atman’s Z-score, return on equity and market capitalization.
4.3 Diagnostic tests
These tests were used to test the strength of the relationship between financial distress
and value of firms listed at the NSE. Section 4.3.1 shows correlation analysis while
section 4.3.2 shows regression analysis of the dependent and independent variables.
4.3.1 Correlation Analysis The correlation between the dependent and independent variables was determined to
establish the nature of the relationship. Table 4.2 shows the results of the correlation
analysis.
Table 4.2 Correlation Analysis Altman's
Z-score ROA Leverage ROE Market
Capitalisation Altman's Z-score 1 ROA 0.800084 1 Leverage 0.641176 0.084741 1 ROE -0.547641 0.033185 -0.992664 1 Market Capitalisation 0.740831 0.214092 0.989558 -0.967625 1
Source: The data in the table above shows the correlation analysis of information derived
from the audited accounts of firms listed at the NSE between 2011 and 2015
Page 41
30
The findings as illustrated in the table above show that there were fairly strong positive
and negative correlations between the dependent variable (value of firms measured by log
of market capitalization) and the independent variables; financial distress (measured by
Altman’s Z-score), quality of assets (measured by ROA), leverage (measured by
debt/equity) and profitability (measured by ROE). The strong correlation of 0.74 between
market capitalization and Altman’s Z-score model indicate that as the level of financial
distress decrease (as demonstrated by an increase Altman’s Z-score), the value of the firm
most likely increase by almost the same measure provided other factors are held constant.
Further, the results indicate a very high positive relationship of 0.99 between market
capitalization and leverage and an equally high negative correlation of 0.97 between
market capitalization and return on equity. The correction between market capitalization
and return on assets is fairly weak at only 0.21.
4.3.2 Regression Analysis This section presents the model summary, analysis of variance and the model
coefficients. From the correlation analysis discussed in the section above, there was a
fairly weak correlation between market capitalization and quality of assets as measured
by ROA. As a result, the variable was dropped from the model. Tables 4.3 (model
summary) and 4.4 (Analysis of Variance) show the results of the analysis which was
conducted at 95% confidence level.
Table 4.3 Model Summary
Regression Statistics Multiple R 0.9999842 R Square (R2) 0.9999683 Adjusted R Square 0.9998732 Standard Error 0.0048958 Observations 5
Source: The data in the table above shows the regression analysis of information derived
from the audited accounts of firms listed at the NSE between 2011 and 2015
Page 42
31
The findings reveal a perfect relationship between the variables as regression coefficient
represented by Multiple R in the table above is nearly equal to 1 at 0.99998. The
coefficient of determination, demonstrated by R2, shows that 99.997% of the results fall
on the regression line; which demonstrates that the model for the study perfectly
describes the relationship between the variables. The adjusted coefficient of
determination is equally high at 99.987% demonstrating that model is applicable for the
various dependent variables. The standard error which measures the precision within
which the regression coefficient is measured is quite low at only 0.0049 signaling a high
reliability of the data points.
Table 4.4 Analysis of Variance
Degrees of Freedom (DF)
Sum of Squares (SS)
Mean Sum of Squares (MS)
F-statistic Significance F
Regression 3 0.756089546 0.252029849 10514.943 0.0071686 Residual 1 2.39687E-05 2.39687E-05 Total 4 0.756113515
Source: The data in the table above shows the regression analysis of information derived
from the audited accounts of firms listed at the NSE between 2011 and 2015
From the results above, the overall test for the null hypothesis, indicated by F-statistics of
10514.9 and the significance associated with P-value of 0.0071686 (shown by column
labelled “Significance – F”) indicate the existence of a strong relationship between the
variables. Since the significance associated with P-value of 0.0071686 is lower than 0.05
(the confidence level assumed for this study), then we reject the null hypothesis.
4.4 Estimated Model
This section provides the estimated model based on the outcome of the study. The
statistics considered in arriving at the estimated model are the regression model
Page 43
32
coefficients, the standard errors, t-statistics and the resulting p-values. Table 4.5 shows
these statistics which form the basis of the estimated model.
Table 4.5 Model Coefficients
Coefficients Standard Error t Stat P-value Intercept 4.570412274 0.009323919 490.1814645 0.001298741 Altman's Z-score 0.205424423 0.014917638 13.77057287 0.046149441 Leverage -0.06359731 0.031983859 -1.988418913 0.296648645 ROE -1.002574338 0.144009007 -6.961886348 0.090822352
Source: The data in the table above shows the regression analysis of information derived
from the audited accounts of firms listed at the NSE between 2011 and 2015
The results of the model coefficient reveal that holding the Altman’s Z-score, leverage
and return on assets to a constant zero, log of market capitalisation would be equal to
4.5704. Altman’s Z-score has a positive beta value of 0.2054 indicating that a unit
increase in Altman’s Z-score (an indicator of reduction in the level of financial distress)
leads to a 0.2054 increase in the log of market capitalisation. Conversely, both leverage
and ROE have negative beta values indicating that, a reduction in the unit of leverage and
return on equity leads to a reduction in log of market capitalisation by 0.0636 and
1.00257 respectively.
4.5 Discussion of Research Findings Tan (2012) in his study on financial distress and financial performance of 277 Asian
Companies from eight countries in the Asian Economy concluded that the relationship
between firm performance and financial leverage was negative. Using financial leverage
as a proxy for financial distress, the results of his study suggested that financially
distressed firms underperformed leading to erosion of their value in the market. This
study confirms the conclusion by Tan (2012) as the results show that an increase in a unit
of leverage would result in a 0.0636 reduction in the market capitalisation. Correlation
Page 44
33
analysis discussed in section 4.3.1 above however seem to contradict this analogy as it
shows a very strong relationship between leverage and market capitalisation. It is
therefore logical to conclude that contrary to proposition by MM Theory, the value of
firm increases with increase in the level of leverage up to a certain point after which
distress risk increases leading to reduction in the value of firm with any subsequent
increase in level of leverage. Managers must therefore work towards striking a balance
between taking advantage of tax shield created by leverage and avoiding adverse effects
of financial distress.
The study further confirms the applicability of Altman’s Z-score model as a tool for
predicting financial distress. The results indicate a strong positive correlation of 0.74
between Atman’s Z-score and market capitalisation, as well as a positive relationship
between the two variables with a beta coefficient of 0.2054. Financial distress, therefore,
causes a reduction in the value of firms and the key concern for managers should be
whether the distress risk is actually priced in the market.
4.6 Summary of Findings
The results of the study show a strong relationship between the value of firms listed at the
NSE and financial distress. These results are largely in line with available literature on
financial distress and confirms other empirical studies (Natalia, 2007, Andrade and
Kaplan, 1998, Mahama, 2015) that have been conducted on the subject. It is therefore
possible to conclude that the value of the firm is affected by the level of financial distress
whether arising from endogenous or exogenous factors, the level of leverage and the level
of firm’s profitability. Further, quality of the assets as measured by ROA does not have a
significant impact on the value of the firm as determined by market capitalisation.
Page 45
34
CHAPTER FIVE
SUMMARY, CONCLUSIONS AND RECOMMENDATIONS
5.1 Introduction
This chapter provides a summary of findings, key conclusions and recommendations.
Section 5.2 highlights the summary of the study, while section 5.3 discusses the
conclusions. Section 5.4 presents the limitations of the study and the chapter concludes
with section 5.5 which discusses recommendations for further research.
5.2 Summary of the study The study sought to establish the effects of financial distress on the value of firms listed
at the NSE though a multivariate analysis, with moderating variables being leverage,
profitability and quality of assets. The main reason was to assist the researcher establish
whether the distress risk emanating from endogenous or exogenous factors is adequately
priced in the market. The results of the study indicated a strong positive relationship of
0.7408 between market capitalisation, which was used as the proxy for value of firm, and
Altman’s Z-score, which was the measure of financial distress. The study further revealed
that the regression model assumed in the study perfectly described the relationship
between the variables as demonstrated by the adjusted coefficient of determination,
adjusted R2, of 99.987%.
This study confirms a number of empirical studies on financial distress (Andrade &
Kaplan, 1998; Asquith et al., 1994; Theodossiou et al., 1996; Whitaker, 1999) which
reveal that to a great extent, financial distress arises from company specific factors and
therefore diversifiable. The data collected for purposes of this study confirms this
hypothesis as even though most of the firms listed at the NSE are highly leveraged, not
many of them have experienced financial distress to the extent of liquidation. For a
number of cases, turn around strategies have been successfully executed reversing the
adverse effects of financial distress. In addition, in as much as the value of these firms are
Page 46
35
to some extent (about 21%) affected by the level of financial distress, there are other
exogenous factors such as competition and general macroeconomic environment that
contribute to the overall value of firms.
5.3 Conclusion and Policy Recommendations
The findings strongly confirm a number of studies (Andrade and Kaplan 1998, Natalia,
2007, Mahama, 2015) who concluded that high leverage was a unique characteristic of
firms that faced financial distress. However, many researchers on financial distress have
had difficulties in estimating the actual impact of financial distress on the value of firms.
The challenge is based on the premise that it is probable that reduction in the value of the
firm could be attributable to the factors that drove the company to the state of financial
distress in the first place and not necessarily the aftermath of financial distress. In support
of this hypothesis, Altman (1984) noted that financial distress was characterised by many
direct and indirect costs but could not explicitly separate financial distress from the
negative shocks in the market arising from myriad of endogenous and exogenous factors.
A number of empirical studies on financial distress (Asquith, Gertner, &Scharfstein,
1994, Hotchkiss, 1995, Gilson, 1997, LoPucki & Whitford, 1993) find indirect evidence
that financial distress contributes to negative performance of firms.
Overall, the results of this study presents a contribution to the body of evidence that the
impact of financial distress on the overall value of the entity can be fundamentally
reduced depending on whether the firm successfully executes a turnaround strategy. More
universally, the results of this study indicate the level of financial distress as predicted by
Altman’s Z-score increased with general slump in industry performance as shown by
reduction in the All Shares Index for securities listed at the NSE in the years 2014 and
2015. This, therefore, begs the question as to whether the net reduction in the value of the
firms arises principally from financial distress itself or economic distress. The results
show that 60% of the firms in distress recorded positive operating margins at the time of
distress that were certainly higher than the industry average. For this reason, the
researcher believes that the sample was chiefly financially distressed and not
Page 47
36
economically distressed notwithstanding the fact that the economic distress or shocks
could not be fully eliminated.
This study concludes that the effects of financial distress are low when management
reviews the trade-off between the possible costs of financial distress and the tax
advantage of using debt in the capital structure (Andrade and Kaplan, 1998) and strikes a
balance. An optimal capital structure should be designed and closely monitored to ensure
that while the organisation is taking advantage of potential tax shield on the interest cost,
it is not adversely exposed to the dangers of financial distress. The researcher therefore
recommends that while there are undoubtedly tax benefits associated with debt, there is
an increasing need for constant assessment of the benefits of debts in the capital structure
and the adverse effect of financial distress likely to arise as a result of high leverage.
5.4 Limitations of the Study
The study relied on secondary data, which was obtained from annual reports and audited
financial statement of the companies, NSE Investor Handbook (2015-2016), and CMA
library. In as much as there are generally accepted accounting principles employed in the
preparation and reporting of financial statements such as IFRS and The Kenyan
Companies Act, these companies used different levels of judgement in designing
accounting policies and therefore reliability, comparability and quality of data was not
100% guaranteed. Further, in some cases the data was not readily available in the
required format.
The study was limited to financial distress as measured by the Altman’s Z scores, quality
of assets, leverage and profitability. Other qualitative factors that affect the value of firms
such as general macroeconomic factors, economic downturn, and government policies
such interest rates capping among others were not considered in this study. On the other
hand, a more comprehensive and detailed analysis would warrant additional time and
certainly the time taken for this study was not sufficient for the level of detail and
analysis presented by this study.
Page 48
37
The study largely relied on quantitative data spanning a period of five years (2011-2016)
which was not adjusted for inflation and any one-off circumstances that could skew the
results. It is possible that different results would be derived if the data was adjusted to
reflect the impact of inflation. Further, the study had a limitation in terms of scope as it
focussed on publicly listed firms and ignored private firms, which are usually small and
medium-sized, and prone to financial distress. This may limit fair findings that could
have been arrived at, if a bigger number of observations incorporating the private entities
could have been analysed. Since the data used is mainly from financial statements of
public companies, it is therefore not prudent to conclude that results would be similar for
private companies and partnerships without empirical review. Finally, the study does not
consider measures taken by the management to reverse the effects of financial distress
such as turnaround strategies, which have been confirmed to be largely effective by
empirical studies (Natalia, 2007 and Mbogo & Waweru, 2014).
5.5 Recommendations for Further Research
This study focused on financial distress as predicted by the Altman’s Z score model for
manufacturing entities and therefore did not consider entities in the financial sector such
as banks, insurance companies and investment firms. There is therefore a need to carry
out the research with a focus on these industries and determine whether the results would
hold irrespective of the industry being considered. Further, the results would be more
convincing if qualitative aspects of the businesses were considered such as changes in
management, product failures, negative publicity, industrial actions and union strikes and
their impact on the value of the distressed firms assessed. The researcher therefore
recommends a repeat of the study but with a focus on these aspects.
The researcher further recommends an in-depth review of firms that are financially
distressed to determine whether the distress is largely contributed by unsystematic
endogenous risk factors which could be diversified away. This would call for a walk-
through of the entities by considering period preceding distress, the period of distress as
well as the period after the season of distress if turnaround strategies are implemented.
Page 49
38
This would give a wholesome view of the impact of financial distress on the value of the
firms. In addition, to complement the results of this study, a review of the effects of
financial distress on the value of private entities would be necessary and comparisons
drawn.
Page 50
39
REFERENCES Adeyemi, B. (2011). Bank Failure in Nigeria: A Consequence of Capital Inadequacy,
Lack of Transparency and Non-Performing Loans. Banks and Bank System, 6(1), 99- 109
Agarwal, V., Taffler, R. (2002): The Distress Factor Hypothesis in Equity Returns:
Market Mispricing or Omitted Variable? Working Paper, Cranfield School of
Management.
Ahmed, S. (2009). International Finance Discussion Papers. Number 987. December
2009. Are Chinese Exports Sensitive to Changes in the Exchange Rate? Altman, E.I. (1984) A further investigation of the bankruptcy cost question, Journal of
Finance 39, 1067-1089. Altman, E.I. (2000). Predicting financial distress of companies: Revisiting the Z-score
and ZETA® models. Stern School of Business, New York University. Andrade, G. & S. Kaplan (1998). How Costly is Financial (Not Economic) Financial
Distress – Evidence from Highly Leveraged Transactions that Became Distressed. Journal of Finance, 53:1443-1493.
Anggraini, D. (2014) Financial Distress Model Prediction for Indonesian Companies.
International Journal of Management and Administrative Sciences (IJMAS Asquith P, R. Gertner & D. Scharfstein (1994). Anatomy of Financial Distress: An
Examination of Junk-bond Issuers. Quarterly Journal of Economics, Vol. 109, No. 3, 1189-1222.
Athanasoglou, P. P., Sophocles, N. B., & Matthaios, D.D. (2005).Bank-specific, industry
Specific and macroeconomic determinants of bank profitability. Working Paper,
Bank of Greece. 1(1), 3-4.
Aziz, M. & Dar, H. (2006). Predicting Corporate Financial Distress: Whither Do We Stand? Corporate governance, 6(1), 18-33. Doi: 10.1108/14720700610649436
Page 51
40
Burns, A. & Groove, B. (2003); The Practice of Nursing Research: Conduct, critique & utilisation. 4th edition. W. B. Saunders Company
Buseretse V. A (2015). The effect of liquidity on profitability of microfinance banks in
Kenya. Unpublished MBA Project, University of Nairobi. Bwisa, A.A (2010). Evaluation of applicability of Altman’s revised model in prediction of
financial distress. Unpublished MBA project. The University of Nairobi.
Cornett, M. M & Saunders, A. (2006). Financial Institutions Management: A Risk
Management Approach, 5th Edition. McGraw-Hill.
Dang, V. A. (2011). Leverage, debt maturity and firm investment: An empirical Analysis.
Journal of Business Finance and Accounting
Durand, D. (1963). The cost of capital in an imperfect market: A reply to M-M.
American Economic Review, 53.
Franks, J. & Torous, W. (1994). A comparison of financial reconstructing in distressed
exchanges and reorganizations, Journal of Financial Economics 35, 349-370.
Gill, A.S., Mand, H.S., Sharma, S.P., & Mathur, N. (2012). Factors that influence
financial leverage of small business firms in India. International Journal of
Economics and Finance, 4(3), 33.
Gilson, S., John, K., Lang, L. (1990). Troubled debt restructurings: An empirical study of
private reorganization of firms in default, Journal of Financial Economics 26,
315-353.
Gilson. S. (1997) Transactions costs and capital structure choice: Evidence from
financially distressed firms, Journal of Finance 52, 161-197.
Page 52
41
Goosen, K. R., Jensen, R., & Wells, R. (1999). Purpose and learning benefits of business simulations: A design and development perspective. Developments in Business Simulation & Experiential Learning, 26, 133-145.
Hewlege, J.,& Liang, L (1996). Is There a Pecking Order? Evidence from a Panel of IPO
Firms. Journal of Financial Economics, 40,429-458.
Hofer, C. W. (1980). Turnaround Strategies. Journal of Business Strategy, Vol. Summer,
19-31. Hotchkiss, Edith, 1995, Post-bankruptcy performance and management turnover, Journal
of Finance 50, 3-22. Karels, G. & Plakash, A. (1987). Multivariate Normality and Forecasting Business
Bankruptcy. Journal of Business Finance and Accounting, 14(4), 573-593.
Keys, J. B., & Biggs, W. D. (1990). A review of business games. In J. W. Gentry (Ed.),
Guide to business gaming and experiential learning (pp. 48-73). East Brunswick, NJ: Nichols/GP Publishing
Kipruto, E. K. (2013). The validity of Altman’s failure prediction model in predicting
corporate financial distress in Uchumi Supermarket in Kenya. Unpublished MBA
Project, University of Nairobi.
Kiege, P.N (1991). Business failure prediction using discriminant analysis. Unpublished
MBA project. University of Nairobi.
Kraus, A., & R.H. Litzenberger (1973). A State-Preference Model of Optimal Financial
Leverage, Journal of Finance 33, 911-922.
Lau, A. H. (1987). A Five-State Financial Distress Prediction Model. Journal of
Accounting Research, Vol. 25, No. 1, 127-138. Lin, P., L. Ko, & E. Blocher. 1999. Prediction of Corporate Financial Distress: An
Application of the Composite Rule Induction System. Presented at the 1999 Annual Meetings of the American Accounting Association, San Diego.
Page 53
42
Longstaff, P., Schwartz, E. (1995). A simple approach to valuing risky fixed and floating
rate debt. Journal of Finance, Vol.5pp789-819
LoPucki, L. & Whitford W (1993). A Corporate governance in the bankruptcy
reorganization of large publicly held companies, University of Pennsylvania Law
Review 141, 669-800.
Mahama, M. (2015). Assessing the State of Financial Distress in Listed Companies in
Ghana: Signs, Sources, Detection and Elimination – A Test of Altman’s Z-
Score, European Journal of Business and Management, Volume 7 No 3, 2015
McDonald, S. & Koch, T. (2006). Management of Banking (6th ed.). Thomson Publishers.
Memba, F. & Job, A. N. (2013). Causes of Financial Distress: A Survey of Firms Funded
by Industrial and Commercial Development Corporation in Kenya.
Interdisciplinary Journal of Contemporary Research in Business.
Marshall, C. & Rossman, G.B. (1999) Designing qualitative research. 3rd ed. London:
Sage Publications.
Merton, R. C. (1974). The Risk Structure of Interest Rates, Journal of Finance, 29
(1974), 449-70.
Miller, M. H., & Modigliani, F. (1961). Dividend policy, growth, and the valuation of shares. Journal of Business, 34, 411-433
Makini, P. A. (2015). Validity of Altman’s Z-score Model in Predicting Financial
Distress of Listed Companies at the Nairobi Securities Exchange. Unpublished
MBA project, University of Nairobi.
Page 54
43
Mbogo, J. & Waweru, G. (2014) Corporate Turn Around Strategies By Financially Distressed Companies Quoted At The Nairobi Securities Exchange Research Journal of Finance and Accounting, Vol.5, No.2
Modigliani, F. and M. H. Miller, 1958. The Cost of Capital, Corporate Finance and the
Theory of Investment, American Economic Review 48, 261-297
Mohamed, S. (2013). Bankruptcy prediction of firms listed at the Nairobi Securities
Exchange. Unpublished MBA Project, University of Nairobi. Mokhova, N. & Zinecker, M. (2013). The determinants of capital structure: the evidence
from of European Union. Acta Universitatis Agriculturae et Silviculturae
Mendelianae Brunensis, LHI, 7, pp. 2533-2546
Monti, E.N. & Moriano, G, R. (2010). A Statistical Analysis to Predict Financial
Distress. Journal Service & Management, 2010(3)
Mugenda, O. & Mugenda, A. (2003). Research Methodology: Quantitative and
Qualitative Approaches. Acts Press, Nairobi, Kenya.
Muthamia, G. M (2013). The effect of financial distress on stock returns of firms quoted at the Nairobi securities exchange. Unpublished MBA Project, University of Nairobi.
Nairobi Securities Exchange official website: https://www.nse.co.ke/nse Natalia, O. (2007). Corporate Financial Distress: An Empirical Analysis of Distress Risk
(Doctoral Dissertation No. 3430, University of St. Gallen, St. Gallen, Switzerland).
Nyunja, F. (2011). Credit Risk. KASNEB Newsline, January-march (1), 39-45
Ooghe, M.N. & Prijcker, S. (2008). Failure Process and Causes of Company
Bankruptcy: A typology. Management Decision, 46 (2), 223-242. Orodho, A. &Kombo, D. (2002). Research Methods. Nairobi: Kenyatta University
Institute of Open Learning
Page 55
44
Pan, Q. & Pan, M. (2014). The impact of macro factors on the profitability of China‟s
commercial banks in the decade after WTO accession. Open Journal of Social Sciences, 2, 64-69.
Pandey, I. M. (2010). Financial Management (10th Ed). New Delphi, India, Vikas
Publishing Popiel, P.A. (1994). Financial Systems in Sub – Saharan Africa: A Comparative Study, World Bank, Discussion Paper, No.260, Africa Technical Department Series, Washington, DC, World Bank
Pasaribu, R. (2008) Financial Distress Prediction in Indonesia Stock Exchange - Case
Study of Trade Industry Public Company
Platt, H. & M. B. Platt (2002). Predicting Corporate Financial Distress: Reflections on Choice Based Sample Bias. Journal of Economics and Finance, Vol. 26, No. 2, 184-199.
Platt, H. & M. B. Platt (2006). Understanding Differences between Financial Distress and Bankruptcy. Review of Applied Economics, Vol. 2, No. 2, 211-227.
Precha, T. (2004). Determining the value of a firm
Said, R.M., &Tumin, M. H. (2010). Performance and financial ratios of commercial
banks in Malaysia and China.
Sangmi G. & Nazir. K (2010).Analysing Financial Performance in India. Application of
CAMEL Model. Johar Educational Society of Pakistan,4(1),40-55
Shukla, P. (2010). Essentials of Marketing Research. Shukla & Ventus Publishing, ApS
Stiglitz, J. E. (1969).A re-examination of M-M theorem. American Economic Review,
59, pp. 784-93.
Taliani, I. J. (2010). Predicting financial distress in commercial banks in Kenya.
Unpublished MBA project. University of Nairobi.
Page 56
45
Tan, T. K. (2012). Financial Distress and Firm Performance: Evidence from the Asian
Financial Crisis. Journal of Finance & Accountancy
Theodossiou, P., Kahya, E., Koutmoa, G. & Christifi, A. 1997. Volatility reversion and
correlation structure of returns in major international stock markets', The
Financial Review, vol. 32, No 2, pp. 205-224
Thuo A. N (2012). The effects of interest rates volatility on stock returns: evidence from the Nairobi Securities Exchange. Unpublished MBA Project, University of Nairobi.
Vong, A., & Hoi, S. (2009).Determinants of Bank Profitability in Macao, (MBA thesis)
Faculty of Business Administration, University of Macau.
Whitaker, R. (1999). The Early Stages of Financial Distress. Journal of Economics and
Finance. 23(2), 123-133.
Page 57
46
APPENDICES
Appendix 1: Companies Listed at the NSE
S. NO
SECURITIES
TRADING SYMBOL
TOTAL NUMBER OF
ISSUED SHARES
AGRICULTURAL 1 Eaagads Ltd EGAD 32,157,000 2 Kakuzi Ltd KUKZ 19,599,999 3 Kapchorua Tea Co. Ltd KAPC 7,824,000 4 The Limuru Tea Co. Ltd LIMT 1,800,000 5 Sasini Ltd SASN 228,055,500 6 Williamson Tea Kenya Ltd WTK 17,512,640 AUTOMOBILES & ACCESSORIES 7 Car & General (K) Ltd C&G 40,103,308 8 Marshalls (E.A.) Ltd MASH 14,393,106 9 Sameer Africa Ltd FIRE 278,342,393 BANKING
10 Barclays Bank of Kenya Ltd BBK 5,431,536,000 11 CFC Stanbic of Kenya Holdings Ltd CFC 395,321,638 12 Diamond Trust Bank Kenya Ltd DTK 266,321,115 13 Equity Group Holdings Ltd EQTY 3,773,674,802 14 Housing Finance Group Ltd HFCK 352,416,667 15 I&M Holdings Ltd I&M 392,362,039 16 KCB Group Ltd Ord KCB 3,066,056,647 17 National Bank of Kenya Ltd NBK 308,000,000 18 NIC Bank Ltd NIC 639,945,603 19 Standard Chartered Bank Kenya Ltd SCBK 343,510,571 20 The Co-operative Bank of Kenya Ltd COOP 4,889,316,295
COMMERCIAL AND SERVICES
21 Atlas African Industries Ltd ADSS 1,497,370,885 22 Express Kenya Ltd XPRS 35,403,790 23 Hutchings Biemer Ltd HBER 360,000 24 Kenya Airways Ltd KQ 1,496,469,035 25 Longhorn Publishers Ltd LKL 369,940,476
Page 58
47
26 Nairobi Business Ventures Ltd NBV 23,600,000 27 Nation Media Group Ltd NMG 188,542,286 28 Standard Group Ltd SGL 81,731,808 29 TPS Eastern Africa Ltd TPSE 182,174,108 30 Uchumi Supermarket Ltd UCHM 364,959,616 31 WPP Scangroup Ltd SCAN 378,865,102
CONSTRUCTION & ALLIED
32 ARM Cement Ltd ARM 495,275,000 33 Bamburi Cement Ltd BAMB 362,959,275 34 Crown Paints Kenya Ltd BERG 71,181,000 35 E.A.Cables Ltd CABL 253,125,000 36 E.A.Portland Cement Co. Ltd PORT 90,000,000
ENERGY & PETROLEUM
37 KenGen Co. Ltd KEGN 6,243,873,779 38 KenolKobil Ltd KENO 1,471,761,200 39 Kenya Power & Lighting Co Ltd KPLC 1,951,467,045 40 Kenya Power & Lighting Ltd 4% Pref 20.00 KPLC.P0004 1,800,000 41 Kenya Power & Lighting Ltd 7% Pref 20.00 KPLC.P0007 350,000 42 Total Kenya Ltd TOTL 175,028,706 43 Umeme Ltd UMME 1,623,878,005
INSURANCE
44 Britam Holdings Ltd BRIT 1,938,415,838 45 CIC Insurance Group Ltd CIC 2,615,538,528 46 Jubilee Holdings Ltd JUB 65,884,500 47 Kenya Re Insurance Corporation Ltd KNRE 699,949,068 48 Liberty Kenya Holdings Ltd CFCI 535,707,499 49 Pan Africa Insurance Holdings Ltd PAFR 144,000,000
INVESTMENT
50 Centum Investment Co Ltd ICDC 665,441,775 51 Home Afrika Ltd HAFR 405,255,320 52 Kurwitu Ventures Ltd KURV 102,272 53 Olympia Capital Holdings Ltd OCH 40,000,000 54 Trans-Century Ltd TCL 281,426,593
INVESTMENT SERVICES
55 Nairobi Securities Exchange Ltd Ord 4.00 NSE 259,500,000
Page 59
48
MANUFACTURING & ALLIED 56 A.Baumann & Co Ltd BAUM 3,840,066 57 B.O.C Kenya Ltd BOC 19,525,446 58 British American Tobacco Kenya Ltd BAT 100,000,000 59 Carbacid Investments Ltd CARB 254,851,988 60 East African Breweries Ltd EABL 790,774,356 61 Eveready East Africa Ltd EVRD 210,000,000 62 Flame Tree Group Holdings Ltd FTGH 161,866,804 63 Kenya Orchards Ltd ORCH 12,868,124 64 Mumias Sugar Co. Ltd MSC 1,530,000,000 65 Unga Group Ltd UNGA 75,708,873
TELECOMMUNICATION & TECHNOLOGY
66 Safaricom Ltd SCOM 40,065,428,000 REAL ESTATE INVESTMENT TRUST
67 STANLIB FAHARI I-REIT. Ord.20.00 FAHR 180,972,300
Page 60
49
Appendix 2: Companies Sampled for Review
S. NO
SECURITIES
TRADING SYMBOL
TOTAL NUMBER OF
ISSUED SHARES
AUTOMOBILES & ACCESSORIES 1 Car & General (K) Ltd C&G 40,103,308 2 Marshalls (E.A.) Ltd MASH 14,393,106 3 Sameer Africa Ltd FIRE 278,342,393 COMMERCIAL AND SERVICES 4 Atlas African Industries Ltd ADSS 1,497,370,885 5 Express Kenya Ltd XPRS 35,403,790 6 Hutchings Biemer Ltd HBER 360,000 Kenya Airways Ltd KQ 1,496,469,035 Longhorn Publishers Ltd LKL 369,940,476 7 Nairobi Business Ventures Ltd NBV 23,600,000 8 Nation Media Group Ltd NMG 188,542,286 9 Standard Group Ltd SGL 81,731,808
10 TPS Eastern Africa Ltd TPSE 182,174,108 11 Uchumi Supermarket Ltd UCHM 364,959,616 12 WPP Scangroup Ltd SCAN 378,865,102
CONSTRUCTION & ALLIED
13 ARM Cement Ltd ARM 495,275,000 14 Bamburi Cement Ltd BAMB 362,959,275 15 Crown Paints Kenya Ltd BERG 71,181,000 16 E.A.Cables Ltd CABL 253,125,000 17 E.A.Portland Cement Co. Ltd PORT 90,000,000
ENERGY & PETROLEUM
18 KenGen Co. Ltd KEGN 6,243,873,779 19 KenolKobil Ltd KENO 1,471,761,200 20 Kenya Power & Lighting Co Ltd KPLC 1,951,467,045 21 Kenya Power & Lighting Ltd 4% Pref 20.00 KPLC.P0004 1,800,000 22 Kenya Power & Lighting Ltd 7% Pref 20.00 KPLC.P0007 350,000 23 Total Kenya Ltd TOTL 175,028,706 24 Umeme Ltd UMME 1,623,878,005
Page 61
50
MANUFACTURING & ALLIED 25 A.Baumann & Co Ltd BAUM 3,840,066 26 B.O.C Kenya Ltd BOC 19,525,446 27 British American Tobacco Kenya Ltd BAT 100,000,000 28 Carbacid Investments Ltd CARB 254,851,988 29 East African Breweries Ltd EABL 790,774,356 30 Eveready East Africa Ltd EVRD 210,000,000 31 Flame Tree Group Holdings Ltd FTGH 161,866,804 32 Kenya Orchards Ltd ORCH 12,868,124 33 Mumias Sugar Co. Ltd MSC 1,530,000,000 34 Unga Group Ltd UNGA 75,708,873
Page 62
51
Appendix 3: Companies with Z-score of less than 2.99
S. NO
SECURITIES
Z-SCORE YEAR 2015
AVERAGE Z-SCORE
(2011-2015) AUTOMOBILES & ACCESSORIES 1 Car & General (K) Ltd 2.4532 2.5282 COMMERCIAL AND SERVICES 2 Kenya Airways Ltd 0.9877 1.8922 ENERGY & PETROLEUM 3 KenGen Co. Ltd 0.6850 1.3574 4 Kenya Power & Lighting Co Ltd 1.4061 2.0223 MANUFACTURING & ALLIED 5 Mumias Sugar Co. Ltd 1.7475 4.2184