35
THE EFFECTS OF FISCAL SHOCKS ON THE EXCHANGE RATE IN THE EMU AND DIFFERENCES WITH THE US Francisco de Castro and Daniel Garrote Documentos de Trabajo N.º 1224 2012

THE EFFECTS OF FISCAL SHOCKS ON THE EXCHANGE RATE IN THE EMU AND DIFFERENCES WITH THE US
Francisco de Castro and Daniel Garrote
Documentos de Trabajo N.º 1224
2012

THE EFFECTS OF FISCAL SHOCKS ON THE EXCHANGE RATE IN THE EMU
AND DIFFERENCES WITH THE US

THE EFFECTS OF FISCAL SHOCKS ON THE EXCHANGE RATE
IN THE EMU AND DIFFERENCES WITH THE US (*)
Francisco de Castro (**)
BANCO DE ESPAÑA AND EUROPEAN COMMISSION
Daniel Garrote (***)
BANCO DE ESPAÑA
(*) We would like to thank Jacopo Cimadomo, the participants at the XIX Encuentro de Economía Pública held inSantiago de Compostela and an anonymous referee for very useful comments and discussions. The views expressed in this paper are those of the authors and do not necessarily reflect those of the Bank of Spain.
(**) Francisco de Castro : [email protected]. Banco de España. Alcalá 48, 28014 Madrid. Spain.
(***) Daniel Garrote: [email protected]. Banco de España. Alcalá 48, 28014 Madrid. Spain. Phone +34 91 338 7927.
Documentos de Trabajo N.º 1224
2012
The Working Paper Series seeks to disseminate original research in economics and fi nance. All papers have been anonymously refereed. By publishing these papers, the Banco de España aims to contribute to economic analysis and, in particular, to knowledge of the Spanish economy and its international environment.
The opinions and analyses in the Working Paper Series are the responsibility of the authors and, therefore, do not necessarily coincide with those of the Banco de España or the Eurosystem.
The Banco de España disseminates its main reports and most of its publications via the INTERNET at the following website: http://www.bde.es.
Reproduction for educational and non-commercial purposes is permitted provided that the source is acknowledged.
© BANCO DE ESPAÑA, Madrid, 2012
ISSN: 1579-8666 (on line)

Abstract
We analyse the impact of government spending shocks on the real effective exchange rate
and net exports in the Euro Area within a standard structural VAR framework. We employ a
new database that contains quarterly fiscal variables for the Euro Area as a whole. We show
that higher government spending leads to real exchange rate appreciation and to a fall in net
exports, jointly with lower primary budgetary surpluses, which turns out to be fully consistent
with the “twin deficits” hypothesis. The different components of public spending, namely
wage and non-wage consumption expenditure, overall public consumption expenditure and
public investment, bring about real appreciations. Our results are therefore also consistent
both with the home-bias hypothesis of public expenditure and with public investment
contributing to generating relative productivity gains in the traded goods sector.
Contrary to what is observed in the Euro Area, the real effective exchange rate
depreciates in the US in response to higher government spending. This discrepancy can
ultimately be explained by the reaction of nominal interest rate spreads and the uncovered
interest parity condition. The dissimilar reaction of short-term nominal interest rate spreads is
attributed to two factors, namely the role of the US dollar as a "safe haven" currency and the
countercyclical behaviour of discretionary government spending in the US.
JEL Classification: E62; H30.
Keywords: Euro Area; SVAR; fiscal shocks; effective exchange rates; relative prices; twin
deficits; fiscal multipliers.

Resumen
En este trabajo se analiza el efecto de las variaciones de gasto público sobre el tipo de
cambio efectivo real y sobre las exportaciones netas en el conjunto del área del euro con un
VAR estructural estándar. Con este fin se utiliza una nueva base de datos fiscal trimestral
para el área del euro. Nuestros resultados muestran que los aumentos de gasto público
directo provocan una apreciación del tipo de cambio efectivo real y un deterioro del
saldo por cuenta corriente, así como un empeoramiento del saldo primario de las
Administraciones Públicas, resultado que está en consonancia con la hipótesis de «déficits
gemelos». Los principales componentes del gasto público directo, (a saber, gastos de
personal y consumo público en compras de bienes y servicios, el consumo público total y la
inversión pública) generan apreciaciones reales. Así pues, nuestros resultados están también
en consonancia con la hipótesis de existencia de un sesgo nacional en el gasto público y
con la hipótesis de que la inversión pública da lugar a ganancias de productividad relativa en
el sector de bienes comerciables.
Contrariamente a lo que se observa en el área del euro, el tipo de cambio efectivo
real en Estados Unidos se deprecia como respuesta a incrementos del gasto público. Tal
discrepancia puede explicarse por la reacción del diferencial del tipo de interés con respecto
al resto del mundo y la condición de la paridad no cubierta del tipo de interés. La diferente
respuesta del diferencial de tipos de interés a corto plazo entre ambas áreas geográficas
puede atribuirse a la conjunción de dos elementos de distinta naturaleza: el papel de
moneda refugio del dólar y el comportamiento contracíclico del gasto público discrecional en
Estados Unidos.
Códigos JEL: E62; H30.
Palabras clave: área del euro, VAR estructural, perturbaciones fiscales, tipos de cambio
efectivos, precios relativos, déficits gemelos, multiplicadores fiscales.

BANCO DE ESPAÑA 9 DOCUMENTO DE TRABAJO Nº 1224
1 Introduction
The number of studies assessing the macroeconomic effects of fiscal shocks has increased in
the last decade. While the most prominent papers have focused on the US (Edelberg et al,
1999; Fatás and Mihov, 2001; Blanchard and Perotti, 2002; Perotti, 2004; Mountford and Uhlig,
2009, inter alia), growing evidence on other countries is available (Heppke-Falk et al., 2006, for
Germany; De Castro, 2006, and De Castro and Hernández de Cos, 2008, for Spain; Giordano
et al., 2007, for Italy; Marcellino, 2006, for the four largest countries of the Euro Area; Afonso
and Sousa, 2009a, 2009b, for Germany, Italy and Portugal; Bénassy-Quéré and Cimadomo,
2006, for Germany, the UK and the US; Burriel et al., 2010, for the whole Euro Area).
However, most of these studies fail to analyse in depth the impact of fiscal shocks
on external competitiveness. On the theoretic side, real appreciation following government
spending shocks is a robust prediction in most RBC and new-Keynesian DSGE models. This
notwithstanding, most of the empirical evidence concerning the US yields the opposite result:
the REER depreciates in response to higher public expenditure (Ravn et al.; 2007; Kim and
Roubini, 2008; Corsetti et al., 2009; Monacelli and Perotti, 2010; Enders et al., 2011). In fact,
Ravn et al. (2007) and Monacelli and Perotti (2010) also obtain this result for Australia, the
U.K. and Canada. By contrast, Beetsma et al. (2008) and Bénétrix and Lane (2009b) for
panels of EU and Euro Area countries, respectively, argue that government spending shocks
lead to real appreciations,1 in line with most theoretical predictions, and in sharp contrast to
the US case. In turn, Froot and Rogoff (1991), De Gregorio et al. (1994) and Galstyan and
Lane (2009b) observe long-run real appreciation in response to increases in government
consumption. Notwithstanding the lack of agreement concerning the response of the real
exchange rate, in all cases except Kim and Roubini (2008), fiscal expansions cause
deterioration of trade balances.
Hence, the purpose of our paper is twofold: first, we aim to assess the effects of
government spending shocks on the REER and on net exports in the Euro Area as a whole,
as there are very few studies that focus on this aggregate; second, we compare these effects
with those observed in the US and provide a potential explanation for the discrepancies
between the two geographical areas.
As far as the Euro Area is concerned, we allow for the different underlying transmission
channels of fiscal shocks to the REER and to net exports in order to frame our results within
possible theoretical benchmarks. Despite the fact that the Euro Area only goes back to 1999,
the synchronisation of monetary policies among core Euro Area countries dates from the
beginning of the 1990s. Moreover, economic integration among most of them was considerably
high even well before then. Hence, the aggregate analysis of fiscal policy shocks for the area as
a whole is a pertinent endeavour. In this respect, the closest study to our paper is Beetsma et al.
(2008), which analyses the effects of spending shocks on trade and budget balances in a panel
of 14 EU countries. They find that government spending shocks lead to higher budget deficits,
1. The same result is obtained by Lane and Milesi-Ferretti (2002), Bénétrix and Lane (2009a) or Galstyan and Lane
(2009a) for Ireland and De Castro and Fernández (2011) for Spain.
BANCO DE ESPAÑA 10 DOCUMENTO DE TRABAJO Nº1224
real appreciations and fall in trade balances, so their results are in line with the "twin deficits"
hypothesis. Meanwhile, Bénétrix and Lane (2009b) assess the effects of the composition of
government spending on the behaviour of the real exchange rate in a panel consisting of the
Euro Area countries. They observe that higher government consumption leads to real
appreciation, whereas public investment increases cause a decline in the relative price of non-
tradables and may thereby lead to real depreciation.
However, our paper differs from Beetsma et al. (2008) and Bénétrix and Lane
(2009b) in some important respects. From a purely methodological perspective, we look at
the Euro Area as a single entity, while the other two papers conduct panel analyses which
ascertain average responses across the countries considered. In practice, a panel analysis
implies that intra-EU trade linkages have not been netted out. Moreover, the real effective
exchange rates of the countries considered in panel analyses are gauged, inter alia, with
respect to the rest of the Euro Area or EU countries.
Another important difference concerns the data. These two studies use annual data,
whereas we employ quarterly figures. Annual data make some identifying assumptions more
controversial, especially the assumption that fiscal variables do not react contemporaneously
to other variables in the system. While it is true that most spending plans are already
determined in the budget approved the previous year, amendments in the course of the fiscal
year are frequent. Hence, our paper complements the analysis in Beetsma et al. (2008) and
Bénétrix and Lane (2009b) in various important ways.
As for the comparison with the US, we find dissimilar responses in the Euro Area
and the US, in line with previous results in the literature. While the real effective exchange rate
appreciates in response to government expenditure shocks in the EMU, the opposite
happens in the US. In order explain these disparities, we analyse the reaction of the nominal
effective exchange rate to spending shocks in both areas, the role of the uncovered interest
parity condition and the cyclical behaviour of government spending shocks. Due to data
availability for the Euro Area, we focus on the sample 1981-2007.
We base our conclusions on impulse response functions drawn from structural
VARs, wherein discretionary fiscal shocks have been identified following the methodology
proposed by Blanchard and Perotti (2002) and Perotti (2004). Our two main findings are that
government expenditure increases bring about real effective exchange rate (REER henceforth)
appreciations and higher budgetary primary and external deficits, in line with the "twin deficits"
hypothesis. Likewise, the discrepancies observed in the reaction of the REER between the
Euro Area and the US are related to the dissimilar reaction of short-term nominal interest rate
spreads, which is ultimately attributed to the concurrence of three factors in the US: its
leading role in the world business cycle, the role of "safe haven" currency of the US dollar and
the countercyclical behaviour of government spending shocks.
The rest of the paper is organised as follows: section 2 explains how the real
exchange rate reacts to public spending shocks in theoretical models, section 3 describes
the data and section 4 the methodological issues. Section 5 gives the results for the Euro
Area, while section 6 frames them in the theoretical literature. Section 7 compares these
results with those obtained with US data. Finally, we present our conclusions in section 8.
BANCO DE ESPAÑA 11 DOCUMENTO DE TRABAJO Nº 1224
2 The relationship between spending shocks, exchange rate movements and
trade balances in theoretical models
On the theoretical field, although there is not full unanimity about the sign of the response of
the exchange rate to public spending shocks, in most of the models fiscal expansions lead to
real appreciation. The traditional Mundell-Fleming model, an open economy version of the
Hicksian IS-LM framework, predicts that higher government spending would spur economic
activity and hence private consumption. The resulting higher final demand would then
provoke an upward reaction of nominal and real interest rates that would trigger capital
inflows and entail nominal and real appreciation. Higher final demand and currency
appreciation would deteriorate the trade balance.
Home bias is another usual argument behind spending shocks-led real
appreciations in the literature. Insofar as government spending mostly concentrates on home-
produced goods, fiscal expansions should make these goods relatively scarcer, thereby
increasing their relative price with respect to imported goods and leading to real appreciation
(see Frenkel and Razin, 1996).
Likewise, real appreciation is a robust theoretical prediction in most RBC and DSGE
models. Under complete international markets for state-contingent assets, higher public
expenditure results in a negative wealth effect that depresses private consumption. In this
context, the usual consumption risk sharing condition implies that lower domestic private
consumption calls for an appreciation of the real exchange rate.2 However, the assumption of
complete markets is not crucial for real appreciation. Galí et al. (2007) show that the
introduction of Rule-of-Thumb consumers may bring about positive private consumption
responses to government shocks provided that the share of these consumers is sufficiently
high. In this connection, Erceg et al. (2005) allow for Rule-of-Thumb consumers in one version
of their open macroeconomic model and obtain the positive private consumption responses
to government shocks, jointly with real appreciation. The latter takes place because
irrespective of the share of Rule-of-Thumb consumers, consumption by forward-looking
agents still declines due to the negative wealth effect. As only these agents have access to
complete international financial markets, their consumption behaviour determines exchange
rate movements via the aforementioned usual consumption risk sharing condition.
Conversely, a number of possible explanations for real depreciations caused by
government expenditure shocks have also been put forward. Obstfeld and Rogoff (1995),
under the assumption that the government follows a balanced budget rule, predict that in a
large economy, a fiscal expansion increases the real interest rate, thereby depressing private
consumption. Since the demand for money is assumed to depend on private consumption,
insofar as prices are sticky, a fall in consumption leads to a depreciation of the nominal and
real exchange rate. The problem with this hypothesis is however that in most pieces of
empirical evidence private consumption rises following government spending shocks. Corsetti
2. Monacelli and Perotti (2010) make an interesting comparison of the effects of government spending shocks on private
consumption and the real effective exchange rate across different theoretical frameworks.

BANCO DE ESPAÑA 12 DOCUMENTO DE TRABAJO Nº1224
et al. (2009) contribute an interesting result. They argue that the economy's response to a
spending rise depends highly on agent's expectations of spending reversals in the future.
Thus, if current deficits are expected to be at least partly offset in the future long-term interest
rates might even go down. In this context, private consumption would increase jointly with a
depreciation of the real exchange rate. In turn, Enders et al. (2011) justify real depreciations
on the grounds of short-run international price movements tending to amplify instead of
mitigate country-specific consumption risk. Finally, Ravn et al. (2007) introduce deep habits in
consumption in an open economy model. In this framework, an increase in public expenditure
provokes a countercyclical reaction of equilibrium mark-ups, a rise of wages and private
consumption and a deterioration of the trade balance. Moreover, they argue that the decline
of domestic mark-ups makes the domestic economy relatively inexpensive with respect to the
foreign one, thereby causing real exchange rate depreciation.
As regards the effects on the trade balance, non-Ricardian models tend to display a
positive correlation between net exports and the change in the budgetary primary surplus in
response to higher public expenditure. In other words, with some qualifications depending on
the size and the openness of the economy at hand, predictions of non-Ricardian models lean
towards the "twin deficits" hypothesis. Thus, higher domestic demand and the real
appreciation caused by an increase in government spending will stimulate imports, while
exports may be negatively affected by the real appreciation. Thus, trade balances will fall
jointly with governments' primary surpluses.

BANCO DE ESPAÑA 13 DOCUMENTO DE TRABAJO Nº 1224
3 The data
The baseline VAR includes quarterly data on public expenditure (gt), net taxes (tt) and GDP (yt),
all in real terms,3 the GDP deflator (pt), the ten-year interest rate of government bonds (rt)4 and
the CPI-based real effective exchange rate (REER) vis à vis the rest of the world. All variables
are seasonally adjusted and enter in logs except the interest rate, which enters in levels.
The definition of the fiscal variables follows Blanchard and Perotti (2002) and Perotti
(2004). In particular, government spending (gt) is defined as the sum of government
consumption and investment, while net taxes (tt) are defined as total government current
receipts, less current transfers excluding interest payments on government debt.5 The REER
is the relative price of the similar a consumption basket in two different economies and is
defined as:
t
ttt P
PEREER
*
(1)
where Et is the nominal effective exchange rate defined in terms of Euros per units of foreign
currency, Pt is the level of home prices and Pt* the foreign price level. According to this
definition decreases in Et and REERt reflect a nominal and a real appreciation, respectively.
We try other VAR specifications aiming to better understand the responses of
certain variables to fiscal shocks. In particular, we assess the reactions of nominal effective
exchange rates, net exports or the role of relative prices, including relative prices of non-
tradables with respect to tradables. For this purpose, we make the following usual
decomposition of the REER:
**
,
,
,
*,
//
ttT
ttT
tT
tTtt PP
PP
P
PEREER (2)
Taking logs in (2) leads to the following expression:
tNTtTt reerreerreer ,, (3)
where reerT,t denotes the real effective exchange rate of traded goods and reerNT,t the cross-
country ratio of the relative price of traded with respect to non-traded goods (or relative price
of non-traded goods). Following Burstein et al. (2005) and Monacelli and Perotti (2010), we
compute the index of traded goods prices as the arithmetic average of the import and export
price index: txtmtT PPP ,,,,, 21
where pmt and pxt denote the import and export price
3. In all cases the GDP deflator is employed so as to obtain the corresponding real values.
4. The long-term interest rate is preferred to the short-term one because of its closer relationship with private
consumption and investment decisions. However, this choice turned out to be immaterial to the results in that the
inclusion of short-term rates in the VAR led to similar conclusions.
5. More concretely, transfers include all expenditure items except public consumption, public investment and interest
payments.

BANCO DE ESPAÑA 14 DOCUMENTO DE TRABAJO Nº1224
indexes (all in logs). In turn, tTP ,* is obtained as the index of traded goods of the Euro Area
trading partners, weighted by their bilateral trade share, which is taken from Eurostat (see
table 1). Non-traded goods prices have been obtained as a residual.
Table 1. Bilateral and total trade share
Euro area US
Australia 0.8 0.6
Canada 1.3 18.3
Denmark 2.5 0.3
Euro area 14.0
Japan 5.2 12.7
Korea 1.4 0.0
New Zealand 0.2 0.2
Norway 1.8 0.4
Sweden 4.2 0.9
Switzerland 6.3 0.9
United Kingdom 18.5 3.6
United States 15.7
Total trade share 57.6 51.7
On the other hand, as we are also interested in the analysis of exchange rate
responses to different types of fiscal shocks we included non-wage government
consumption, government spending on wages and salaries and public investment in turn as
endogenous variables. As before, the GDP deflator was used to get their corresponding real
values.
For our analysis, we use the quarterly fiscal database for the Euro Area aggregate
for the period 1980Q1-2007Q4 compiled by Paredes et al. (2009).6 The raw ingredients they
use are closely linked to the ones used by national statistical agencies to provide their best
estimates (intra-annual fiscal data, mostly on a cash basis) and preserve full coherence with
official, annual data. Exchange rate data have been obtained from the IFS (IMF) database, and
the imports and exports price deflators from the OECD. The rest of the data used in the paper
are taken from ECB’s Area Wide Model Database (see Fagan et al., 2005). For the US, both
fiscal and national accounts data have been taken from the NIPA accounts from the Bureau
of Economic Analysis.
6. This database is the same as that used in Burriel et al. (2010). Its main advantage is that it avoids the endogenous
bias that arises if fiscal data interpolated on the basis of general macroeconomic indicators were used with
macroeconomic variables to assess the impact of fiscal policies. While some authors might argue against using non-
official, estimated time series, the use of quarterly data facilitates the identification of fiscal shocks under the Blanchard-
Perotti approach, especially shocks to direct government spending. While it seems a sensible assumption that
government spending decisions are predetermined within the quarter, it appears difficult to defend with annual data,
thereby casting doubts on the estimated impulse responses in VARs. Hence, our preference for relying on quarterly
data.

BANCO DE ESPAÑA 15 DOCUMENTO DE TRABAJO Nº 1224
Despite the obvious drawback of using estimated instead of raw data for the Euro
Area, quarterly data are preferred to annual ones because they avoid the need of making too
stringent identifying assumptions. Rather, quarterly data allow for within-year feedback
responses among all the variables in the system, especially between fiscal variables and GDP.

BANCO DE ESPAÑA 16 DOCUMENTO DE TRABAJO Nº1224
4 Specification and identification of the (S)VAR model
The reduced-form VAR is specified in levels and can be written as
ttt UXLDX 1)( (4)
where Xt ≡ (gt, tt, yt, pt, rt, reert) is the vector of endogenous variables and D(L) is an
autoregressive lag-polynomial. The benchmark specification includes a constant, but no
deterministic trends. The vector Ut ≡ (reert
rt
pt
yt
tt
gt uuuuuu , , , , , ) contains the reduced-
form residuals, which in general will present non-zero cross-correlations. The VAR includes
two lags of each endogenous variable according to the information provided by LR tests, the
Akaike, Schwarz and Hannan-Quinn information criteria and the final prediction error.7
We apply the identification strategy proposed by Blanchard and Perotti (2002) and
Perotti (2004), which exploits decision lags in policy making and information about the
elasticity of fiscal variables to economic activity.8 Their strategy relies on the assumption that
the reduced-form residuals of the gt and tt equations, gtu and
ttu , can be thought of as
linear combinations of three types of shocks: a) the automatic responses of spending and net
taxes to the rest of macroeconomic variables in the system, b) systematic discretionary
responses of fiscal policy to the same set of macro variables and c) random discretionary
fiscal policy shocks, which are the truly uncorrelated structural fiscal policy shocks the effects
of which are the purpose of our analysis.
The innovation model can be written as tt VU , where Vt ≡
(reert
rt
pt
yt
tt
gt eeeee ,e , , , , ) is the vector containing the orthogonal structural shocks.
Accordingly, the reduced-form residuals are linear combinations of the orthogonal structural
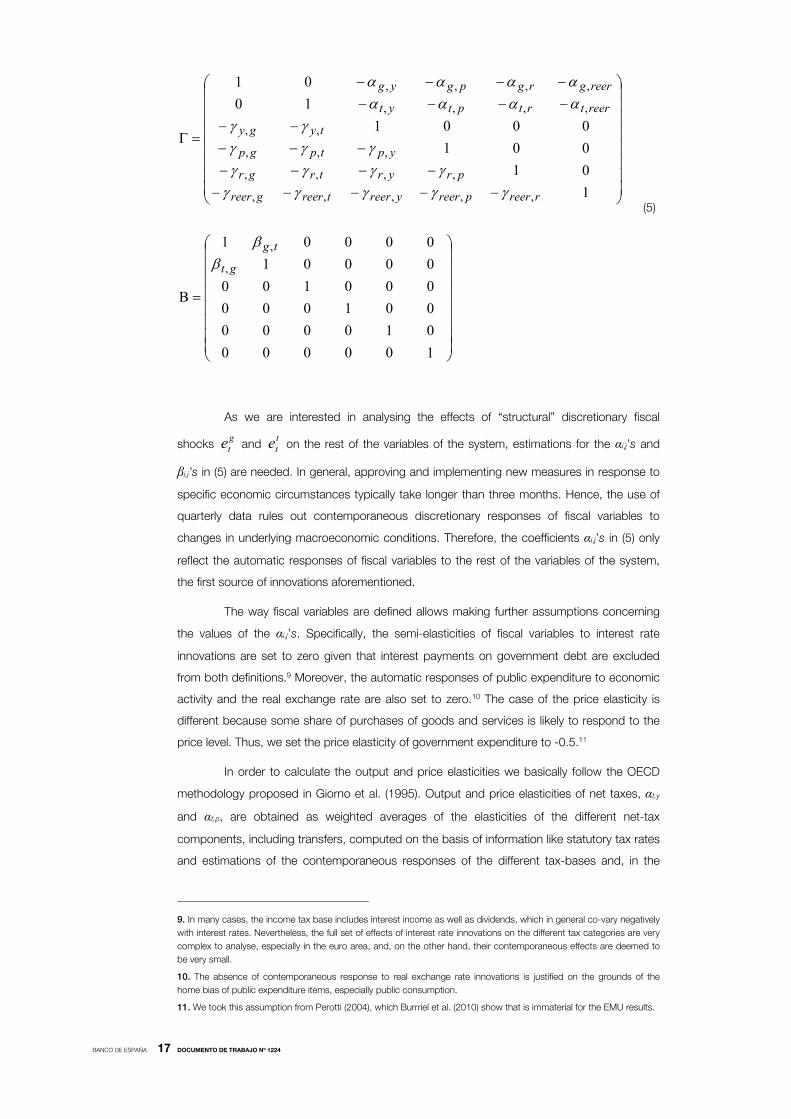
shocks of the form tt VU 1. The respective matrixes Γ and Β can be written as:
7. In order to assess the robustness of our results to different specifications and transformations, we tried several
alternatives, including estimating with variables in per capita terms, allowing for four lags instead of two, introducing a
deterministic time trend and substituting the long-term interest rate by a short-term one. These different alternatives
showed broadly the same qualitative results. In addition, we estimated our baseline VAR for the period previous to the
monetary union. In this case, we also obtained broadly similar qualitative results, although impulse-response functions
were estimated more imprecisely due to the lower degrees of freedom.
8. Focusing on the euro area does not prevent from relying on this identification scheme. This identification method,
usually applied to single countries, is also valid in our case because fiscal shocks at the euro area level are ultimately
fiscal shocks originated in one or several Member States at the same time. It is equivalent to identifying fiscal shocks in
highly decentralized countries.
BANCO DE ESPAÑA 17 DOCUMENTO DE TRABAJO Nº 1224
1000000100000010000001000000100001
1010010001
1001
,
,
,,,,,
,,,,
,,,
,,
,,,,
,,,,
gt
tg
rreerpreeryreertreergreer
pryrtrgr
yptpgp
tygy
reertrtptyt
reergrgpgyg
(5)
As we are interested in analysing the effects of “structural” discretionary fiscal
shocks gte and
tte on the rest of the variables of the system, estimations for the αi,j’s and
βi,j’s in (5) are needed. In general, approving and implementing new measures in response to
specific economic circumstances typically take longer than three months. Hence, the use of
quarterly data rules out contemporaneous discretionary responses of fiscal variables to
changes in underlying macroeconomic conditions. Therefore, the coefficients αi,j’s in (5) only
reflect the automatic responses of fiscal variables to the rest of the variables of the system,
the first source of innovations aforementioned.
The way fiscal variables are defined allows making further assumptions concerning
the values of the αi,j’s. Specifically, the semi-elasticities of fiscal variables to interest rate
innovations are set to zero given that interest payments on government debt are excluded
from both definitions.9 Moreover, the automatic responses of public expenditure to economic
activity and the real exchange rate are also set to zero.10 The case of the price elasticity is
different because some share of purchases of goods and services is likely to respond to the
price level. Thus, we set the price elasticity of government expenditure to -0.5.11
In order to calculate the output and price elasticities we basically follow the OECD
methodology proposed in Giorno et al. (1995). Output and price elasticities of net taxes, αt,y
and αt,p, are obtained as weighted averages of the elasticities of the different net-tax
components, including transfers, computed on the basis of information like statutory tax rates
and estimations of the contemporaneous responses of the different tax-bases and, in the
9. In many cases, the income tax base includes interest income as well as dividends, which in general co-vary negatively
with interest rates. Nevertheless, the full set of effects of interest rate innovations on the different tax categories are very
complex to analyse, especially in the euro area, and, on the other hand, their contemporaneous effects are deemed to
be very small.
10. The absence of contemporaneous response to real exchange rate innovations is justified on the grounds of the
home bias of public expenditure items, especially public consumption.
11. We took this assumption from Perotti (2004), which Burrriel et al. (2010) show that is immaterial for the EMU results.
BANCO DE ESPAÑA 18 DOCUMENTO DE TRABAJO Nº1224
case of transfers, the relevant macroeconomic aggregate to GDP and price changes. Tax
base elasticities of the different tax and transfer categories have been taken from van den
Noord (2000) and Bouthevillain et al. (2001), whereas output elasticities of the relevant tax
bases were, however, obtained from econometric estimation with quarterly data. According
to our estimations, the output elasticity in the Euro Area is 1.54, whereas the price elasticity
amounts to 1.14.12
Furthermore, given that our main interest lies on spending shocks we assume that
expenditure decisions are prior to tax ones, which implies a zero value for βg,t. This allows us
to retrieve gte directly and to use it to estimate βt,g by OLS, which completes the identification
of the first two equations. Since we are interested in studying the effects of fiscal policy
shocks, the ordering of the remaining variables is immaterial to the results. Therefore, the
sequential ordering for the remaining shocks ytu ,
ptu ,
rtu and
reertu is imposed. The
corresponding structural shocks are estimated by instrumental variables in turn, using gte
and tte as instruments for
gtu and
ttu , respectively. In what follows we present our results in
terms of impulse response functions. As usual, these are reported jointly with 68% confidence
bands13 obtained by Monte Carlo integration methods with 1000 replications.
One usual criticism to this methodology is whether VAR shocks are truly exogenous
and unpredictable. While legislative and implementation lags make that changes in
government spending and taxes can be anticipated, it is often claimed that VARs cannot
properly account for such anticipation effects (see Leeper, et al., 2008). If agents are forward
looking SVAR may fail to correctly estimate fiscal shocks, thereby leading to biased estimates
of their effects. In this regard, Ramey (2011) provides evidence that SVAR-based innovations
in the US as identified in Blanchard and Perotti (2002) can be anticipated and Granger caused
by Ramey and Shapiro (1998) war episodes. However, Perotti (2004) finds little evidence that
SVAR-based innovations are predictable. In turn, Bouakez et al. (2010) show that Ramey's
results are most likely driven by the Korean War episode and thus the fiscal foresight problem
is not severe enough to preclude the use of SVAR innovations as correct measures of
unanticipated fiscal shocks.14
12. In the case of the US output and price elasticities amount to 1.94 and to 1.15, respectively. See Burrriel et al. (2010)
for further details.
13. Edelberg et al. (1999), Fatás and Mihov (2001), Blanchard and Perotti (2002) or Perotti (2004) among others, also
choose this bandwidth to present their results. Nevertheless, choosing a lower significance level would keep the basic
and most important results broadly unchanged, especially the appreciation of the real exchange rate, although such
appreciation would only be significant during the first year.
14. We performed Granger causality tests between our estimated government spending structural shocks and changes
in the output gap with different lags. In no case was the null hypothesis that changes in the output gap do not G-cause
spending shocks rejected.

BANCO DE ESPAÑA 19 DOCUMENTO DE TRABAJO Nº 1224
5 The effects of government spending shocks
5.1 The baseline VAR
Figure 1 displays the responses of the endogenous variables to an increase of government
expenditure by 1% of GDP in the EMU. The government spending shock takes 12 quarters to
fade out. In turn, net taxes increase on impact although quickly, after four quarters, become
non-significant. As expected, spending shocks bring about a deterioration of the general
government primary balance, especially due to the higher persistence of the response of
government spending.
The increased public spending leads GDP to rise on impact and to display a
significant positive response for 5 quarters. The impact output multiplier is gauged at 0.85,
whereas the cumulative output multiplier15 after one year amounts to 0.98 and to 0.87 eight
quarters after the shock (see table 2). These values are significant within a 68% confidence
interval and are within range of most of the empirical evidence available.16
Private consumption and private investment were included in turn in the VAR
replacing GDP.17 In both cases, their impulse responses display a similar pattern to that of
GDP. Private consumption increases on impact and remains significant for around four
quarters, phasing out thereafter. Private investment rises on impact as well, in line with the
accelerator hypothesis, although such increase is only marginally significant. This positive
response fades away rather quickly.
Table 2. Cumulative output multipliers in EMU
Quarters
1 4 8 12 16 20
Baseline model 0.85* 0.98* 0.87* 0.60 0.27 -0.04
Note: The asterisk indicates significance within one-standard deviation band-width.
15. The cumulative multiplier at a given quarter is obtained as the ratio of the cumulative response of GDP and the
cumulative response of government expenditure at that quarter.
16. See Burriel et.al (2010). Specifically, focusing on Germany, Perotti (2004) gauges a short-term multiplier of around
0.5, whereas Heppke-Falk et al. (2006) obtain an impact multiplier of 0.62. In turn, Baum and Koester (2011) get a
cumulative output multiplier of 0.7 at the fourth quarter after the shock in their linear specification. De Castro (2006) and
De Castro and Hernández de Cos (2008) estimate multipliers around 1.3 after one year for Spain, while Giordano et al.
(2007) obtain much higher values, around 1.2 and 2.4 on impact and after four quarters, respectively, for Italy, although
in this latter case multipliers only apply to a shock to purchases of goods and services.
17. To identify the fiscal shocks, we need to compute the elasticities of fiscal variables to private consumption and
investment. They are gauged by multiplying the GDP elasticities by the inverse of the output elasticities of private
consumption and investment, respectively.

BANCO DE ESPAÑA 20 DOCUMENTO DE TRABAJO Nº1224
Figure 1. Responses to an increase in government spending by 1% of GDP
in the EMU: Baseline VAR
Prices start rising one quarter after the shock and display a hump-shaped response.
Accordingly to this pattern, government spending shocks entail persistent and significant
inflation increases in the Euro Area for around two years. Likewise, the (nominal and real)
long-term interest rate shows a hump-shaped rise in reaction to the shock.
Government spending shocks lead to a fairly persistent real appreciation in the Euro
Area. In our case, a 1% of GDP shock to direct government expenditure entails a real
appreciation of 4.8% at the 4th quarter and of 4.4% two years after the shock. This result is
fully consistent with Bénétrix and Lane (2009b), who use a panel with the Euro Area countries
and with Beetsma et al. (2008) for a panel of EU countries. Moreover, our result is also in line
with other pieces of evidence on some individual countries such as Bénétrix and Lane
-2.0
0.0
2.0
4.0
6.0
1 3 5 7 9 11 13 15 17 19
Government Spending
-4.0
-2.0
0.0
2.0
4.0
6.0
1 2 3 4 5 6 7 8 9 10 11 12 13 14 15 16 17 18 19 20
Net Taxes
-1.5-1.0-0.50.00.51.01.5
1 3 5 7 9 11 13 15 17 19
GDP
-0.5
0.0
0.5
1.0
1.5
2.0
1 3 5 7 9 11 13 15 17 19
Prices
-50
0
50
100
150
1 3 5 7 9 11 13 15 17 19
10-year nominal interest rate
-50
0
50
100
150
1 3 5 7 9 11 13 15 17 19
10-year real interest rate
-12.0-10.0-8.0-6.0-4.0-2.00.0
1 3 5 7 9 11 13 15 17 19
Accumulated Primary Balance (% GDP)
-8.0-6.0-4.0-2.00.02.0
1 3 5 7 9 11 13 15 17 19
Real Effective Exchange Rate
-3.0
-2.0
-1.0
0.0
1.0
2.0
1 3 5 7 9 11 13 15 17 19
Private Consumption
-3.0
-2.0
-1.0
0.0
1.0
2.0
1 3 5 7 9 11 13 15 17 19
Private Investment

BANCO DE ESPAÑA 21 DOCUMENTO DE TRABAJO Nº 1224
(2009a)18 and Galstyan and Lane (2009a) for Ireland or De Castro and Fernández (2011) for
Spain. However, such real appreciation to public spending shocks contrasts sharply with the
results obtained in other studies for some other countries. Specifically, Kim and Roubini
(2008) and Enders et al. (2011) for the U.S., Monacelli and Perotti (2010) for Australia, the
U.S. and the U.K. and Ravn et al. (2007) for a pool of Australia, Canada, the U.S. and the
U.K., find that higher government expenditure yields real depreciations.
In order to deepen the understanding of real exchange rate responses, we replaced
the REER in our VAR by its two main components, notably the nominal effective exchange
rate and relative prices. In the case of the EMU as a whole, the increase in home prices can
only be considered as an imperfect proxy for the rise in relative prices. Due to its considerable
size, fiscal shocks in the Euro Area may imply non-negligible effects on international prices.
Figure 2 presents the corresponding impulse responses. The observed real appreciation
stems from both a nominal appreciation (e.g. appreciation of the nominal effective exchange
rate, NEER) and an increase of relative prices, with the appreciation of the NEER being far
more persistent.
Figure 2. Responses to an increase in government spending in EMU:
VAR with nominal effective exchange rates and relative prices
-2.0
0.0
2.0
4.0
6.0
1 3 5 7 9 11 13 15 17 19
Government Spending
-4.0
-2.0
0.0
2.0
4.0
6.0
1 2 3 4 5 6 7 8 9 10 11 12 13 14 15 16 17 18 19 20
Net Taxes
-1.5-1.0-0.50.00.51.01.5
1 3 5 7 9 11 13 15 17 19
GDP
-0.50.00.51.01.52.02.5
1 3 5 7 9 11 13 15 17 19
Prices
-100
-50
0
50
100
150
1 3 5 7 9 11 13 15 17 19
10-year nominal interest rate
-100-50
050
100150
1 3 5 7 9 11 13 15 17 19
10-year real interest rate
-10.0-8.0-6.0-4.0-2.00.02.04.0
1 3 5 7 9 11 13 15 17 19
Nominal Effective Exchange Rate
-1.5-1.0-0.50.00.51.01.52.0
1 3 5 7 9 11 13 15 17 19
Relative prices
18. The appreciation they obtain for Ireland is much lower than our estimates for the euro area. They find a real
appreciation of 0.9% on impact that increases in the subsequent three years, to reach a 2.6% appreciation in the
third year.

BANCO DE ESPAÑA 22 DOCUMENTO DE TRABAJO Nº1224
5.2 Sectoral effects
The baseline VAR was also re-specified by replacing the REER by both the real exchange
rates of traded and non-traded goods as shown in equation (3). Figure 3 shows that the real
exchange rate of traded goods and the relative price of non-traded goods appreciate after a
shock to government spending.19 Although the appreciation appears more intense in the
former case, it is only significant in the case of non-traded goods, which is consistent with the
home-bias view on government spending. Insofar as it concentrates mostly on home-
produced goods, mainly non-tradables, fiscal expansions contribute to increasing their
relative price with respect to traded goods and to imported goods. In this sense, the bottom
graph of the Figure 3 shows that import prices fall relative to export prices.
Figure 3. Responses of real exchange rates of traded and non-traded goods to a
spending shock in EMU
-5.0
-4.0
-3.0
-2.0
-1.0
0.0
1.0
2.0
1 3 5 7 9 11 13 15 17 19
Traded goods
-2.5
-2.0
-1.5
-1.0
-0.5
0.0
0.5
1.0
1 3 5 7 9 11 13 15 17 19
Non-traded goods
-1.5
-1.0
-0.5
0.0
0.5
1.0
1.5
2.0
1 2 3 4 5 6 7 8 9 10 11 12 13 14 15 16 17 18 19 20
Pexp/Pimp
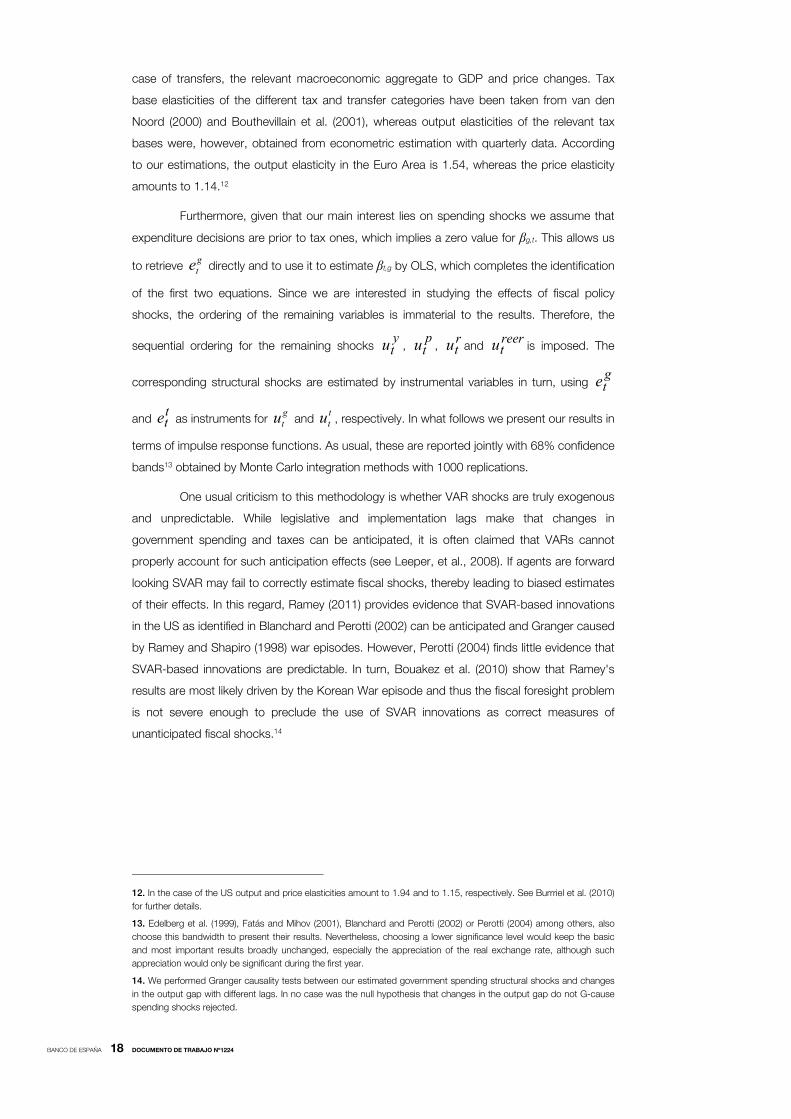
5.3 Productivity, unit labour costs and mark-ups
The responses of productivity, real wages and mark-ups are important to understand in depth
the channels through which fiscal shocks affect the real effective exchange rate. An increase
in government spending stimulates both nominal and real wages (see Figure 4) which is in line
with other empirical studies for the US (see Perotti, 2007), as well as with the predictions by a
number of new-Keynesian models (e.g. Galí et al., 2007). At the same time, labour
19. Monacelli and Perotti (2010) find that both components, traded and non-traded, depreciate in response to an
increase in public spending.
BANCO DE ESPAÑA 23 DOCUMENTO DE TRABAJO Nº 1224
productivity shows a temporary upturn but to a lower extent than nominal wages and rapidly
fades away, thereby raising unit labour costs of the economy.
In turn, the rise of unit labour costs outweighs that of prices. Although there is not a
direct measure of mark-ups, they can reasonably be approximated by the gap between
prices and unit labour costs. Hence, on the basis of this assumption, government spending
shocks entail a countercyclical reaction of mark-ups.
Figure 4. Effects of government spending on costs, productivity and mark-ups in
EMU
-0.6-0.4-0.20.00.20.40.60.81.01.21.4
1 2 3 4 5 6 7 8 9 10 11 12 13 14 15 16 17 18 19 20
Real wages
-0.4
-0.2
0.0
0.2
0.4
0.6
0.8
1.0
1.2
1 2 3 4 5 6 7 8 9 10 11 12 13 14 15 16 17 18 19 20
Labour productivity
-0.5
0.0
0.5
1.0
1.5
2.0
2.5
1 2 3 4 5 6 7 8 9 10 11 12 13 14 15 16 17 18 19 20
Unit labour costs
-1.2
-1.0
-0.8
-0.6
-0.4
-0.2
0.0
0.2
0.4
1 2 3 4 5 6 7 8 9 10 11 12 13 14 15 16 17 18 19 20
Markups
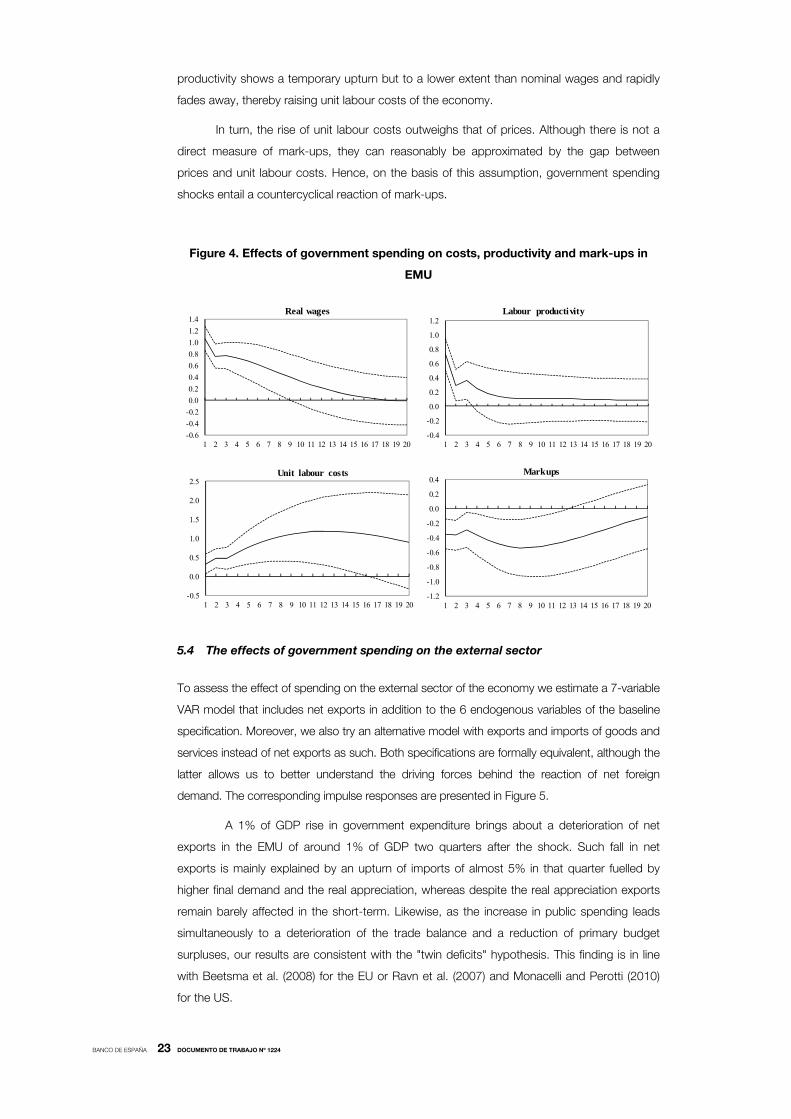
5.4 The effects of government spending on the external sector
To assess the effect of spending on the external sector of the economy we estimate a 7-variable
VAR model that includes net exports in addition to the 6 endogenous variables of the baseline
specification. Moreover, we also try an alternative model with exports and imports of goods and
services instead of net exports as such. Both specifications are formally equivalent, although the
latter allows us to better understand the driving forces behind the reaction of net foreign
demand. The corresponding impulse responses are presented in Figure 5.
A 1% of GDP rise in government expenditure brings about a deterioration of net
exports in the EMU of around 1% of GDP two quarters after the shock. Such fall in net
exports is mainly explained by an upturn of imports of almost 5% in that quarter fuelled by
higher final demand and the real appreciation, whereas despite the real appreciation exports
remain barely affected in the short-term. Likewise, as the increase in public spending leads
simultaneously to a deterioration of the trade balance and a reduction of primary budget
surpluses, our results are consistent with the "twin deficits" hypothesis. This finding is in line
with Beetsma et al. (2008) for the EU or Ravn et al. (2007) and Monacelli and Perotti (2010)
for the US.

BANCO DE ESPAÑA 24 DOCUMENTO DE TRABAJO Nº1224
Figure 5. Effects of government spending on net exports in EMU
-2.5-2.0-1.5-1.0-0.50.00.51.01.52.02.5
1 2 3 4 5 6 7 8 9 10 11 12 13 14 15 16 17 18 19 20
Net Exports% GDP
-30.0
-25.0
-20.0
-15.0
-10.0
-5.0
0.0
5.0
10.0
1 2 3 4 5 6 7 8 9 10 11 12 13 14 15 16 17 18 19 20
Real Imports
-8.0-7.0-6.0-5.0-4.0-3.0-2.0-1.00.01.0
1 2 3 4 5 6 7 8 9 10 11 12 13 14 15 16 17 18 19 20
Public Saving% GDP
-30.0
-25.0
-20.0
-15.0
-10.0
-5.0
0.0
5.0
10.0
1 2 3 4 5 6 7 8 9 10 11 12 13 14 15 16 17 18 19 20
Real Exports
-3.0-2.5-2.0-1.5-1.0-0.50.00.51.01.52.0
1 2 3 4 5 6 7 8 9 10 11 12 13 14 15 16 17 18 19 20
Current Account balance% GDP
0.0
1.0
2.03.0
4.05.0
6.0
7.08.0
1 2 3 4 5 6 7 8 9 10 11 12 13 14 15 16 17 18 19 20
Private Saving% GDP
The current account balance (which is the sum of the trade balance, the income
balance and the transfers balance) follows the same pattern as the trade balance,
deteriorating after an expansionary shock. As Figure 5 shows, a 1% of GDP increase of
government spending leads to a peak deterioration of the current account balance of some
0.3% of GDP in the second quarter after the shock. The observed worsening of the external
balance stems from the deterioration of the public saving, offset by the increase in private
saving only in part, which turns out to be consistent with the rejection of the Ricardian
hypothesis.
5.5 The effects of different expenditure components
Government consumption and government investment may be expected to have different
effects on relative prices.20 To assess their effects, we replaced government expenditure by
public consumption and public investment in turn in our baseline VAR. Figure 6 shows the
responses of the REER to shocks to different government spending items. As expected, an
increase in government consumption entails a real appreciation as a result of higher relative
demand for non-tradables in the Euro Area; a shock of 1% of GDP leads to a real
20. Ricci et al. (2008) and Lee et al. (2008) highlight the empirical role of government consumption as an important driver
of medium-term real exchange rate movements for a large panel of countries.

BANCO DE ESPAÑA 25 DOCUMENTO DE TRABAJO Nº 1224
appreciation of 1.4% on impact and reaches its peak at quarter 4 with a 4.2%. The real
appreciation after two and three years remains sizeable, of 3.8% and 3.4%.21 While shocks to
government's purchases of goods and services and to overall public consumption imply
appreciations that turn out to be significant, expansions of government's personnel
expenditure lead to non-significant, though still negative, responses of the REER. These
results are broadly in line with the findings in Froot and Rogoff (1991), De Gregorio et al.
(1994) and Galstyan and Lane (2009b).
Public investment in the literature is deemed to have an ambiguous impact on the real
exchange rate depending on how it affects the relative productivity of traded vs. non-traded
goods. Thus, an increase in public investment that enhances productivity in the tradables sector
may generate real appreciation through the Balassa-Samuelson mechanism, whereas if such
productivity gains take place fundamentally in the non-tradables sector, it may actually lead to
real depreciation caused by a decline in the relative price of non-tradables.
The real exchange rate in the EMU also appreciates significantly when public
investment rises. Accordingly, public investment shocks in the Euro Area do not seem to have
entailed a relative increase of the productivity in the non-traded goods sector. Rather, it
seems that public investment may have contributed to generating productivity gains in traded
goods. This result is consistent with the observed decline of the price of traded goods relative
to non-traded goods. However, it contrasts with the findings in Galstyan and Lane (2009b),
who detect no significant long-term impact on the real exchange rate for the EMU countries.
Figure 6. Responses of the real effective exchange rate to shocks to different
government spending components in EMU
-12.0
-10.0
-8.0
-6.0
-4.0
-2.0
0.0
2.0
4.0
1 3 5 7 9 11 13 15 17 19
Non-wage expenditure
-20.0
-15.0
-10.0
-5.0
0.0
5.0
10.0
1 3 5 7 9 11 13 15 17 19
Personnel expenditure
-10.0
-8.0
-6.0
-4.0
-2.0
0.0
2.0
4.0
1 3 5 7 9 11 13 15 17 19
Public consumption
-35.0-30.0-25.0-20.0-15.0-10.0-5.00.05.0
10.0
1 3 5 7 9 11 13 15 17 19
Public investment
21. Galstyan and Lane (2009b) find that a shock of similar magnitude leads to a real appreciation of 2.14 in the euro
area, well below the values reported here.

BANCO DE ESPAÑA 26 DOCUMENTO DE TRABAJO Nº1224
6 Framing the results in theoretical models
US data usually show that public spending increases lead to positive private consumption
responses and real exchange rate depreciation. While finding models able to reconcile both
facts can be a challenging endeavour22 (as acknowledged by Monacelli and Perotti, 2010),
our results so far can easily be accommodated to some theoretical frameworks. In principle,
our results can fit well basic predictions by the conventional Mundell-Fleming model as well by
some New Keynesian formulations.
Firstly, the positive responses of output, private consumption, prices and nominal
and real interest rates, jointly with the observed nominal and real appreciation are consistent
with the traditional Mundell-Fleming setting. The increase in public spending would spur
economic activity and hence private consumption. Likewise, the resulting higher final demand
would provoke an upward reaction of nominal and real interest rates, thereby triggering
capital inflows and nominal (and real) appreciation.
Secondly, consistency with Balassa-Samuleson arguments is also found, as we
observe both increases in relative home prices and in the relative price of non-traded with
respect to traded goods. If government spending mostly concentrates on home-produced,
mainly non-traded goods, fiscal expansions should make them relatively scarcer, thereby
increasing their relative price with respect to imported goods and leading to real appreciation
(Frenkel and Razin, 1996).
Thirdly, higher private consumption, coupled with countercyclical mark-ups and real
appreciation following an increase in public spending can be accommodated to theoretical
predictions by a number of DSGE models wherein firms develop their activity in a
monopolistic competition environment and in absence of complete markets. In particular,
positive responses of private consumption, jointly with countercyclical mark-ups are in
accordance with the predictions in Galí et al. (2007). Moreover, the open economy version of
this model in Erceg et al. (2005) also fits the observed real appreciation caused by
government spending shocks well. Despite the observed aggregate increase of private
consumption, fully Ricardian agents would consume less due to the negative wealth effect. As
only non-constrained consumers are assumed to have access to complete international
financial markets, lower consumption by this group of consumers would call for a real
appreciation for the equilibrium risk-sharing condition of consumption to hold. Our impulse-
responses are consistent with this channel.
Finally, in these alternative theoretical frameworks public expenditure expansions
entail higher domestic demand, real appreciation, a fall in the trade balance and a reduction of
the budgetary primary surplus. The empirical evidence provided in this paper is also in
accordance with these predictions. Consequently, as far as government expenditure shocks
22. Ravn et al. (2007) find that the presence of deep habits is able to lead to a countercyclical reaction of equilibrium
markups. Thus, an increase in government spending would entail a generalized decline of markups in domestic markets
with respect to foreign markets, thereby making the domestic economy relatively inexpensive. Hence, the real exchange
rate would depreciate.

BANCO DE ESPAÑA 27 DOCUMENTO DE TRABAJO Nº 1224
are concerned, our results are consistent with the "twin deficits" hypothesis. In this regard,
they are also in line with the evidence presented in Beetsma et al. (2008) for the EU and in
Ravn et al. (2007) or Monacelli and Perotti (2010) for the US.

BANCO DE ESPAÑA 28 DOCUMENTO DE TRABAJO Nº1224
7 Comparing the Euro Area with the US: are they different?
The most prominent empirical papers that analyse the effects of fiscal shocks on variables
characterizing the external sector focus on the US (Ravn et al.; 2007; Kim and Roubini, 2008;
Corsetti et al., 2009; Monacelli and Perotti, 2010) and show that government spending brings
about exchange rate depreciation, in contrast with the evidence provided in the previous
sections for the Euro Area. The question is why the real effective exchange rate behaves so
differently in these two areas of a very similar size. In order to provide some explanation, we
estimated similar SVAR models to those used for the Euro Area for the US.
Figure 7 shows the responses of the main macroeconomic variables to a
government spending shock. Despite some differences in terms of the shape of the
responses and their timing, they are qualitatively similar to the Euro Area. Higher government
spending brings about increases in GDP and private consumption in the first three quarters
after the shock. Government expenditure also entails higher prices and interest rates, jointly
with a deterioration of primary balances.
When comparing the responses in Figure 1 and 7 we observe that the real effective
exchange rate does react differently in the two areas. While government spending shocks
lead to a real appreciation in the Euro Area, the REER in the United States depreciates on
impact and in the medium term, with the response being non-significant between the 2nd and
8th quarters after the shock. This finding is in line with Kim and Roubini (2008), Monacelli and
Perotti (2010), Ravn et al. (2007) or Enders et al. (2011). In any case, it is surprising that the
REER displays such a different behaviour between both areas.
Theoretical models can be found to fit any of both sets of results separately. On the
one hand, the responses of GDP, consumption, interest rates and the REER in the Euro Area
seem to fit well the basic predictions of the conventional Mundell-Fleming as well of some
New Keynesian formulations that incorporate rule-of-thumb consumers23 and some degree of
price stickiness (Erceg et al., 2005). On the other hand, while positive private consumption
responses appear difficult to reconcile with real depreciation in the US (Monacelli and Perotti,
2010), Ravn et al. (2007) and Corsetti et al. (2009) propose promising alternative frameworks
that are able to accommodate both stylised facts. In this paper though, the most challenging
task is to explain why the real effective exchange rate behaves so differently in these two
areas of a very similar size.
It appears very unconvincing that the transmission channels differ significantly
between both areas. Figure 8 shows that the REER depreciates in response to both public
consumption and public investment shocks in the US, contrary to what happens in the Euro
Area (Figure 6). Therefore, the different reaction of real exchange rates seems difficult to
attribute to dissimilar effects of public investment on the productivity of non-traded relative to
traded goods. Actually, the depreciation of the REER in the US to public consumption shocks
resembles largely the observed one following shocks to total government spending.
23. See Galí et al. (2007).

BANCO DE ESPAÑA 29 DOCUMENTO DE TRABAJO Nº 1224
Figure 7. Responses to an increase in government spending in the US
3
2
1
0
1
2
3
4
5
-2.0
0.0
2.0
4.0
6.0
1 2 3 4 5 6 7 8 9 10 11 12 13 14 15 16 17 18 19 20
Government Spending
-15.0
-10.0
-5.0
0.0
5.0
1 2 3 4 5 6 7 8 9 10 11 12 13 14 15 16 17 18 19 20
Net Taxes
-3.0
-2.0
-1.0
0.0
1.0
2.0
1 2 3 4 5 6 7 8 9 10 11 12 13 14 15 16 17 18 19 20
GDP
0.0
0.5
1.0
1.5
2.0
1 2 3 4 5 6 7 8 9 10 11 12 13 14 15 16 17 18 19 20
Prices
-100-50
050
100150200
1 2 3 4 5 6 7 8 9 10 11 12 13 14 15 16 17 18 19 20
10-year nominal interest rate
-4.0-3.0-2.0-1.00.01.02.0
1 2 3 4 5 6 7 8 9 10 11 12 13 14 15 16 17 18 19 20
Private Consumption
-50
-40
-30
-20
-10
0
1 2 3 4 5 6 7 8 9 10 11 12 13 14 15 16 17 18 19 20
Cumulative Primary Balance (% of GDP)
-5.0
0.0
5.0
10.0
1 2 3 4 5 6 7 8 9 10 11 12 13 14 15 16 17 18 19 20
Real Effective Exchange Rate
The alternative decompositions of the REER offer interesting information. Figure 9
reveals that the observed real depreciation stemming from higher expenditure in the US is
entirely due to the depreciation of the NEER, whereas home relative prices rise (implying that
the impact increase on local prices is more sizeable than on foreign prices).24 Hence, the
depreciation of the NEER in the US more than offsets the appreciation that would take place
via relative prices.
The responses of the real exchange rate of traded and non-traded goods also differ
between both areas. While non-traded goods appreciate in the US, traded goods show the
opposite behaviour due to the depreciation of the nominal effective exchange rate (Figure 9).
Accordingly, the overall depreciation of the real exchange rate is explained by the depreciation
of tradables outweighing the appreciation of non-tradables. This different reaction contrasts
with the Euro Area, where both the real exchange rates traded goods and the relative price of
non-traded goods appreciate in response to a shock to government spending.
24. In none of both cases can the increase in home prices be taken as a good proxy for the increase in relative prices,
given that both areas are fairly big and their shocks may have non-negligible effects on international prices.

BANCO DE ESPAÑA 30 DOCUMENTO DE TRABAJO Nº1224
Figure 8. Responses of the REER to different government spending
components in the US
-2.0
0.0
2.0
4.0
6.0
8.0
10.0
1 2 3 4 5 6 7 8 9 10 11 12 13 14 15 16 17 18 19 20
Pûblic consumption
-2.0
-1.0
0.0
1.0
2.0
3.0
4.0
5.0
6.0
1 2 3 4 5 6 7 8 9 10 11 12 13 14 15 16 17 18 19 20
Public investment
These results are consistent with the view that government spending mostly
concentrates on home-produced goods, mainly non-tradables. Fiscal expansions contribute
to making these goods relatively scarcer, thereby increasing their relative price with respect to
imported goods which tends to appreciate the real exchange rate of non-tradables regardless
of the area (Frenkel and Razin, 1996). The final effect on the real effective exchange rate is
thus determined by the reaction of the nominal effective exchange rate.
But the main question remains open: why nominal effective exchange rates react to
spending shocks so differently in both geographical areas? Amid other factors such as
changes in economic prospects or the evolution of risk premia, short-term shifts in nominal
effective exchange rates are deemed to be determined by the spreads between home and
foreign short-term nominal interest rates, i.e. the uncovered interest parity. Thus, in order to
understand the reaction of the NEER to government spending shocks, it seems crucial to
assess how such shocks affect interest rate spreads.
Figure 9. Decomposition of the REER in the US
----
--
-4.0
-2.0
0.0
2.0
4.0
6.0
8.0
10.0
12.0
1 2 3 4 5 6 7 8 9 10 11 12 13 14 15 16 17 18 19 20
Nominal Effective Exchange Rate
-0.50.00.51.01.52.02.53.03.54.0
1 2 3 4 5 6 7 8 9 10 11 12 13 14 15 16 17 18 19 20
Relative prices (P/P*)
-5.0
0.0
5.0
10.0
15.0
20.0
1 2 3 4 5 6 7 8 9 10 11 12 13 14 15 16 17 18 19 20
Real Traded goods Exchange Rate
-10.0
-8.0
-6.0
-4.0
-2.0
0.0
2.0
1 2 3 4 5 6 7 8 9 10 11 12 13 14 15 16 17 18 19 20
Real Non-traded goods Exchange Rate

BANCO DE ESPAÑA 31 DOCUMENTO DE TRABAJO Nº 1224
Figure 10. Effects of government spending on the short-term nominal interest rate
spreads
-250
-200
-150
-100
-50
0
50
100
1 2 3 4 5 6 7 8 9 10 11 12 13 14 15 16 17 18 19 20
US
-50
0
50
100
150
200
1 2 3 4 5 6 7 8 9 10 11 12 13 14 15 16 17 18 19 20
Euro area
As we aim to assess the effects on effective exchange rates vis-à-vis the rest of the
world the relevant spreads should be gauged with respect to a "world" interest rate excluding
the Euro Area or the US. Given that such variables do not exist we have calculated a proxy in
each case. Thus, the relevant foreign short-term nominal interest rate for the Euro Area has
been gauged as a weighted average of the short-term interest rates of the main OECD
countries excluding the Euro Area.25 For the US, the relevant foreign short-term interest rate is
obtained in a similar way, replacing the US short-term rate by the Euro Area one. As in the
case of prices of traded goods, we use the weights of trading partners, taken from Eurostat in
the case of the EMU and US Census Bureau for the USA. (see Table 1).
In addition to the baseline variables, we include the relevant interest rate spreads in
our VAR. Figure 10 seems to confirm our intuition. Short-term nominal interest rate spreads
move in opposite directions to government spending shocks; higher government spending
widens the spread in the case of the EMU, while narrows it in the US. Thus, according to the
uncovered interest parity condition, the NEER should appreciate in the Euro Area and
depreciate in the US, just exactly what VAR responses show.
The dissimilar reaction of short-term nominal interest rate spreads is probably
determined by the leading role of the US dollar as a "safe haven" currency in slowdowns.
Figure 11 compares our estimated structural government spending shocks from the baseline
VAR with the change in the output gap in both areas.26 Public spending in the US displays a
broadly countercyclical behaviour; positive shocks tend to pervade with negative output gap
changes. Given the leading role of the US in the world business cycle downturns would be
accompanied by raising overall risk aversion. In this context, our results suggest that interest
rate increases due to higher public spending in the US would call for even more elevated ones
in the rest of the world.
By contrast, as there has not been a single currency until 1999, no such "safe
haven" role can be attributed to the EMU as a whole during most of the time span covered by
25. These countries are Australia, Canada Denmark, Japan, Korea, New Zealand, Norway, Sweden, Switzerland and the
UK.
26. The change in the output gap as opposed to its level to assess the fiscal policy stance is currently preferred both in
the European Commission and the IMF.

BANCO DE ESPAÑA 32 DOCUMENTO DE TRABAJO Nº1224
the dataset.27 Until that date, the NEER is derived form a basket of currencies with different
risk perceptions. Hence, interest rate movements were not matched by shifts of similar
magnitude abroad. On the other hand, as of the introduction of the euro in 1999, the Stability
and Growth pact has compelled a number of Member States to adopt pro-cyclical fiscal
policies in the context of the crisis in the early 2000s, as opposed to what it is observed in the
US. As Member States failed to consolidate sufficiently in good times, the 3% of GDP deficit
threshold was breached in many cases. Thus, countries had to adopt consolidation
programmes to restore fiscal positions.
Figure 11. Fiscal stance and short-term interest rate spreads
27. Even after the adoption of the euro, such safe haven role cannot be advocated either as the current sovereign debt
crisis shows.
Euro area
-7.0
-5.0
-3.0
-1.0
1.0
3.0
5.0
7.0
Dec-82 Dec-84 Dec-86 Dec-88 Dec-90 Dec-92 Dec-94 Dec-96 Dec-98 Dec-00 Dec-02 Dec-04 Dec-06-0.025
-0.015
-0.005
0.005
0.015
0.025
Change in output gap Interest rate spread Structural spending shocks (right scale)
Corr (eg,ygap)=0.28
United States
-7
-5
-3
-1
1
3
5
7
Dec-82 Dec-84 Dec-86 Dec-88 Dec-90 Dec-92 Dec-94 Dec-96 Dec-98 Dec-00 Dec-02 Dec-04 Dec-06-0.03
-0.02
-0.01
0.00
0.01
0.02
0.03
Change in output gap Interest rate spread Structural spending shocks (right scale)
Corr (eg,ygap)=-0.15

BANCO DE ESPAÑA 33 DOCUMENTO DE TRABAJO Nº 1224
8 Conclusions
This paper assesses the effects of public spending shocks on the exchange rate and the
trade balance in the Euro Area. We base our analysis on impulse responses derived from
SVARs identified according to the methodology sketched in Blanchard and Perotti (2002). For
this purpose, we employ a new database that contains quarterly fiscal variables for the Euro
Area as a whole.
Our analysis shows that government spending brings about positive output
responses, with output multipliers somewhat below one. In turn, higher government spending
leads to positive responses of private consumption, real exchange rate appreciation and a fall
in net exports, coupled with lower primary surpluses. Hence, our results in this regard are fully
consistent with the “twin deficits” hypothesis.
Likewise, government spending shocks in the Euro Area bring about a rise in home
relative prices and in the relative prices of non-traded with respect to traded goods.
Moreover, we find that higher public spending entails upward responses of labour costs that
outweigh the increase in prices, thereby leading to a countercyclical reaction of mark-ups, in
line with a number of new-Keynesian theoretical models.
The expansion in all the analysed components of public spending, namely wage and
non-wage consumption expenditure, overall public consumption expenditure and public
investment, bring about real appreciations. Our results are therefore also consistent both with
the home-bias hypothesis of public expenditure and with public investment contributing to
generating relative productivity gains in the traded goods sector.
Finally, the comparison with the US reveals a different pattern of response of the
REER to government spending shocks in both geographical areas. The real exchange rate
appreciation in the EMU contrasts with the depreciation observed in the US. This difference is
explained by the reaction of the nominal effective exchange rate in each case, as the relative
price of non-traded goods behaves in a similar way.
The reason for such opposite behaviour is found in the reaction of nominal interest
rate spreads. When government spending increases such spread widens in the EMU while it
narrows in the US. According to the uncovered interest parity condition, the NEER should
appreciate in the Euro Area and depreciate in the US, just as VAR responses show. The
dissimilar reaction of short-term nominal interest rate spreads is attributed to the leading role
of the US dollar as a "safe haven" currency, especially in slowdowns, jointly with the broadly
countercyclical behaviour of public spending. Accordingly, interest rate increases in the US
due to higher public spending in troughs coupled with higher overall risk aversion, would lead
to even more elevated foreign sovereign bond rates.
BANCO DE ESPAÑA 34 DOCUMENTO DE TRABAJO Nº1224
References
AFONSO, A. and R. M. SOUSA (2009a). The macroeconomic effects of fiscal policy. ECB Working Paper Series No.
991, January.
AFONSO, A. and R. M. SOUSA (2009B). The macroeconomic effects of fiscal policy in Portugal: a Bayesian SVAR
analysis. School of Economics and Management, Working Papers Nº 09/2009/DE/UECE.
BAUM, A. and G.B. KOESTER (2011). The impact of fiscal policy on economic activity over the business cycle –
evidence from a threshold VAR analysis. Deutsche Bundesbank. Discussion Paper Series 1: Economic Studies No
3/2011.
BEETSMA, R., M. GIULIODORI and F. KLAASSEN (2008). The Effects of Public Spending Shocks on Trade Balances
and Budget Deficits in the European Union. Journal of the European Economic Association, 6(2-3), pp. 414-423.
BÉNASSY-QUÉRÉ, A. and J. CIMADOMO (2006). Changing patterns of domestic and cross-border fiscal policy
multipliers in Europe and the US. CEPII WP #2006-24.
BÉNÉTRIX, A. S. and LANE, P.R. (2009a). The impact of fiscal shocks on the Irish economy. The Economic and Social
Review, 40(4), pp. 407-434.
BÉNÉTRIX, A. S. and LANE, P.R. (2009b). Fiscal shocks and the real exchange rate. IIIS Discussion Paper No. 286,
March.
BLANCHARD, O. J. and R. PEROTTI (2002). An Empirical Characterization of the Dynamic Effects of Changes in
Government Spending and Taxes on Output. Quarterly Journal of Economics, 117, pp. 1329-1368.
BOUAKEZ, H., F. CHIHI and M. NORMANDIN (2010). Measuring the effects of fiscal policy. Centre Interuniversitaire sur
le Risque, les Politiques Économiques et l'Emploi, Working Paper 10-16, May.
BOUTHEVILLAIN, C., COUR-THIMANN, P., VAN DEN DOOL, G., HERNÁNDEZ DE COS, P., LANGENUS, G., MOHR,
M., MOMIGLIANO, S., TUJULA, M., 2001. Cyclically adjusted budget balances: An alternative approach. ECB
Working Paper Series No. 77.
BURRIEL, P., F. DE CASTRO, D. GARROTE, E. GORDO, J. PAREDES and J. J. PÉREZ (2010). Fiscal policy shocks in
the euro area and the US: an empirical assessment. Fiscal Studies 31 (2), pp. 251-285.
BURSTEIN, A., M. EICHENBAUM and S. REBELO (2005). Large Devaluations and the Real Exchange Rate. Journal of
Political Economy, 113(4), pp. 742-784.
CORSETTI, G., A. MEIER and G. MÜLLER (2009). Fiscal Stimulus with Spending Reversals, IMF Working Paper
WP/097106.
DE CASTRO, F. (2006). The macroeconomic effects of fiscal policy in Spain. Applied Economics, 38, pp. 913-924.
DE CASTRO, F and P. HERNÁNDEZ DE COS (2008). The economic effects of fiscal policy: the case of Spain. Journal of
Macroeconomics, 30, pp. 1005-1028.
DE CASTRO, F and L. FERNÁNDEZ (2011). The Effects of Fiscal Shocks on the Exchange Rate in Spain. Banco de
España Working Paper No. 1121.
DE GREGORIO, J., A. GIOVANNINI and H. WOLF (1994). International Evidence on Tradables and Nontradables
Inflation. European Economic Review, 38, pp. 1225-1244.
EDELBERG, W., M. EICHENBAUM, and J.D.M. FISHER (1999). Understanding the Effects of a Shock to Government
Purchases. Review of Economic Dynamics, 2, pp. 166-206.
ENDERS, Z., G. MÜLLER and A. SCHOLL (2011). How do Fiscal and Technology Shocks affect Real Exchange Rates?
New Evidence for the United States. Journal of International Economics 83(1), pp. 53-69.
ERCEG, C.J., L. GUERRIERI and C. GUST (2005). Expansionary Fiscal Shocks and the US Trade Deficit. International
Finance, 8 (3), pp 363–397.
FATÁS, A. and I. MIHOV (2001). The effects of fiscal policy on consumption and employment: theory and evidence.
CEPR Discussion Paper Series No. 2760.
FAGAN, G., J. HENRY and R. MESTRE (2005). An area-wide model (AWM) for the euro area. Economic Modelling, 22,
pp. 39-59.
FRENKEL, J.A. and A. RAZIN (1996). Fiscal Policies and Growth in the World Economy, Third Edition. MIT Press,
Cambridge, MA.
FROOT, K. and K. ROGOFF (1991). The EMS, the EMU, and the Transition to a Common Currency. NBER
Macroeconomics Annual, Vol. 6, pp. 269-317.
GALÍ, J., D. LÓPEZ-SALIDO and J. VALLÉS (2007). Understanding the effects of government spending on consumption.
Journal of the European Economic Association, 5, pp. 227-270.
GALSTYAN, V. and P.R. LANE (2009a). Fiscal policy and international competitiveness: evidence for Ireland. The
Economic and Social Review, 40(3), pp. 299–315.
GALSTYAN, V. and P.R. LANE (2009b). The Composition of Government Spending and the Real Exchange Rate.
Journal of Money Credit and Banking, 41(6), pp. 1233–1249.
GIORDANO, R., S. MOMIGLIANO, S. NERI and R. PEROTTI (2007). The effects of fiscal policy in Italy: Evidence from a
VAR model. European Journal of Political Economy, 23, pp. 707–733.
GIORNO, C., P. RICHARDSON, D. ROSEVEARE and P. VAN DEN NOORD (1995). Potential output, output gaps and
structural budget balances. OECD Economic Studies 24.
GOLINELLI, R. and S. MOMIGLIANO (2009). The cyclical reaction of fiscal policies in the euro area: the role of modelling
choices and data vintages. Fiscal Studies, 30, pp. 39-72.
HEPPKE-FALK, K.H., J. TENHOFEN and G.B. WOLFF (2006). The macroeconomic effects of exogenous fiscal policy
shocks in Germany: a disaggregated SVAR analysis. Deutsche Bundesbank. Discussion Paper Series 1: Economic
Studies No 41/2006.

BANCO DE ESPAÑA 35 DOCUMENTO DE TRABAJO Nº 1224
KIM, S., and N. ROUBINI (2008). Twin deficit or twin divergence? Fiscal policy, current account, and real exchange rate
in the U.S. Journal of International Economics, 74(2), pp. 362–383.
LANE, P.R. and G. M. MILESI-FERRETTI (2002). Long-Run determinants of the Irish real exchange rate. Applied
Economics, 34(5), pp. 549-55.
LEE, J., G. M. MILESI-FERRETTI, J. OSTRY, A. PRATI and L. RICCI (2008). Exchange Rate Assessments: CGER
Methodologies. IMF Occasional Paper No. 261.
LEEPER, E.M.. T.B. WALKER and S.S. YANG (2008). Fiscal foresight: analytics and econometrics. NBER Working Paper
Series No. 14028.
MARCELLINO, M. (2006). Some stylized facts on non-systematic fiscal policy in the euro area. Journal of
Macroeconomics, 28, pp. 461-479.
MONACELLI, T. and R. PEROTTI (2010). Fiscal Policy, the Real Exchange Rate and Traded Goods. The Economic
Journal, 120, pp 437–461.
MOUNTFORD, A. and H. UHLIG (2009). What are the effects of fiscal policy shocks? Journal of Applied Econometrics,
24(6), pp 960-992.
OBSTFELD, M. and K. ROGOFF (1995). Exchange rate dynamics redux. Journal of Political Economy, 103, pp. 624–
660.
PAREDES, J., D. J. PEDREGAL and J. J. PÉREZ (2009). A quarterly fiscal database for the euro area based on intra-
annual fiscal indicators. ECB Working Paper Series No 1132.
PEROTTI, R. (2004). Estimating the effects of fiscal policy in OECD countries. Proceedings, Federal Reserve Bank of San
Francisco.
PEROTTI, R. (2007). In search of the transmission mechanism of fiscal policy. NBER Working Paper Series No. 15464.
RAMEY, V. (2011). Identifying Government Spending Shocks: It's all in the Timing. The Quarterly Journal of Economics,
126(1), pp. 1-50. doi: 10.1093/qje/qjq008.
RAMEY, V. and M.D. SHAPIRO (1998). Costly Capital Reallocation and the Effects of Government Spending. Carnegie
Rochester Conference Series on Public Policy 48, pp. 145-194.
RAVN, M.O., S. SCHMITT-GROHÉ and M. URIBE (2007). Explaining the effects of government spending on
consumption and the real exchange rate. NBER Working Paper Series No. 13328.
RICCI, L., G. M. MILESI-FERRETTI and J. LEE (2008). Real Exchange Rates and Fundamentals: A Cross-Country
Perspective. IMF Working Paper No. 08/13.
VAN DEN NOORD, P. (2000). The size and role of automatic fiscal stabilizers in the 1990s and beyond. OECD Working
Paper No. 230.

BANCO DE ESPAÑA PUBLICATIONS
WORKING PAPERS1
1101
1102
1103
1104
1105
1106
1107
1108
1109
1110
1111
1112
1113
1114
1115
1116
1117
1118
1119
1120
1121
1122
1123
1124
1125
1126
1127
1128
1129
1130
GIACOMO MASIER AND ERNESTO VILLANUEVA: Consumption and initial mortgage conditions: evidence from
survey data.
PABLO HERNÁNDEZ DE COS AND ENRIQUE MORAL-BENITO: Endogenous fiscal consolidations.
CÉSAR CALDERÓN, ENRIQUE MORAL-BENITO AND LUIS SERVÉN: Is infrastructure capital productive? A dynamic
heterogeneous approach.
MICHAEL DANQUAH, ENRIQUE MORAL-BENITO AND BAZOUMANA OUATTARA: TFP growth and its determinants:
nonparametrics and model averaging.
JUAN CARLOS BERGANZA AND CARMEN BROTO: Flexible inflation targets, forex interventions and exchange rate
volatility in emerging countries.
FRANCISCO DE CASTRO, JAVIER J. PÉREZ AND MARTA RODRÍGUEZ VIVES: Fiscal data revisions in Europe.
ANGEL GAVILÁN, PABLO HERNÁNDEZ DE COS, JUAN F. JIMENO AND JUAN A. ROJAS: Fiscal policy, structural
reforms and external imbalances: a quantitative evaluation for Spain.
EVA ORTEGA, MARGARITA RUBIO AND CARLOS THOMAS: House purchase versus rental in Spain.
ENRIQUE MORAL-BENITO: Dynamic panels with predetermined regressors: likelihood-based estimation and
Bayesian averaging with an application to cross-country growth.
NIKOLAI STÄHLER AND CARLOS THOMAS: FiMod – a DSGE model for fiscal policy simulations.
ÁLVARO CARTEA AND JOSÉ PENALVA: Where is the value in high frequency trading?
FILIPA SÁ AND FRANCESCA VIANI: Shifts in portfolio preferences of international investors: an application to
sovereign wealth funds.
REBECA ANGUREN MARTÍN: Credit cycles: Evidence based on a non-linear model for developed countries.
LAURA HOSPIDO: Estimating non-linear models with multiple fixed effects: A computational note.
ENRIQUE MORAL-BENITO AND CRISTIAN BARTOLUCCI: Income and democracy: Revisiting the evidence.
AGUSTÍN MARAVALL HERRERO AND DOMINGO PÉREZ CAÑETE: Applying and interpreting model-based seasonal
adjustment. The euro-area industrial production series.
JULIO CÁCERES-DELPIANO: Is there a cost associated with an increase in family size beyond child investment?
Evidence from developing countries.
DANIEL PÉREZ, VICENTE SALAS-FUMÁS AND JESÚS SAURINA: Do dynamic provisions reduce income smoothing
using loan loss provisions?
GALO NUÑO, PEDRO TEDDE AND ALESSIO MORO: Money dynamics with multiple banks of issue: evidence from
Spain 1856-1874.
RAQUEL CARRASCO, JUAN F. JIMENO AND A. CAROLINA ORTEGA: Accounting for changes in the Spanish wage
distribution: the role of employment composition effects.
FRANCISCO DE CASTRO AND LAURA FERNÁNDEZ-CABALLERO: The effects of fiscal shocks on the exchange
rate in Spain.
JAMES COSTAIN AND ANTON NAKOV: Precautionary price stickiness.
ENRIQUE MORAL-BENITO: Model averaging in economics.
GABRIEL JIMÉNEZ, ATIF MIAN, JOSÉ-LUIS PEYDRÓ AND JESÚS SAURINA: Local versus aggregate lending channels:
the effects of securitization on corporate credit supply.
ANTON NAKOV AND GALO NUÑO: A general equilibrium model of the oil market.
DANIEL C. HARDY AND MARÍA J. NIETO: Cross-border coordination of prudential supervision and deposit guarantees.
LAURA FERNÁNDEZ-CABALLERO, DIEGO J. PEDREGAL AND JAVIER J. PÉREZ: Monitoring sub-central
government spending in Spain.
CARLOS PÉREZ MONTES: Optimal capital structure and regulatory control.
JAVIER ANDRÉS, JOSÉ E. BOSCÁ AND JAVIER FERRI: Household debt and labour market fluctuations.
ANTON NAKOV AND CARLOS THOMAS: Optimal monetary policy with state-dependent pricing.
1. Previously published Working Papers are listed in the Banco de España publications catalogue.

1131
1132
1133
1201
1202
1203
1204
1205
1206
1207
1208
1209
1210
1211
1212
1213
1214
1215
1216
1217
1218
1219
1220
1221
1222
1223
1224
JUAN F. JIMENO AND CARLOS THOMAS: Collective bargaining, firm heterogeneity and unemployment.
ANTON NAKOV AND GALO NUÑO: Learning from experience in the stock market.
ALESSIO MORO AND GALO NUÑO: Does TFP drive housing prices? A growth accounting exercise for four countries.
CARLOS PÉREZ MONTES: Regulatory bias in the price structure of local telephone services.
MAXIMO CAMACHO, GABRIEL PEREZ-QUIROS AND PILAR PONCELA: Extracting non-linear signals from several
economic indicators.
MARCOS DAL BIANCO, MAXIMO CAMACHO AND GABRIEL PEREZ-QUIROS: Short-run forecasting of the euro-dollar
exchange rate with economic fundamentals.
ROCIO ALVAREZ, MAXIMO CAMACHO AND GABRIEL PEREZ-QUIROS: Finite sample performance of small versus
large scale dynamic factor models.
MAXIMO CAMACHO, GABRIEL PEREZ-QUIROS AND PILAR PONCELA: Markov-switching dynamic factor models in
real time.
IGNACIO HERNANDO AND ERNESTO VILLANUEVA: The recent slowdown of bank lending in Spain: are supply-side
factors relevant?
JAMES COSTAIN AND BEATRIZ DE BLAS: Smoothing shocks and balancing budgets in a currency union.
AITOR LACUESTA, SERGIO PUENTE AND ERNESTO VILLANUEVA: The schooling response to a sustained Increase in
low-skill wages: evidence from Spain 1989-2009.
GABOR PULA AND DANIEL SANTABÁRBARA: Is China climbing up the quality ladder?
ROBERTO BLANCO AND RICARDO GIMENO: Determinants of default ratios in the segment of loans
to households in Spain.
ENRIQUE ALBEROLA, AITOR ERCE AND JOSÉ MARÍA SERENA: International reserves and gross capital flows.
Dynamics during financial stress.
GIANCARLO CORSETTI, LUCA DEDOLA AND FRANCESCA VIANI: The international risk-sharing puzzle is at business-
cycle and lower frequency.
FRANCISCO ALVAREZ-CUADRADO, JOSE MARIA CASADO, JOSE MARIA LABEAGA AND DHANOOS
SUTTHIPHISAL: Envy and habits: panel data estimates of interdependent preferences.
JOSE MARIA CASADO: Consumption partial insurance of Spanish households.
J. ANDRÉS, J. E. BOSCÁ AND J. FERRI: Household leverage and fiscal multipliers.
JAMES COSTAIN AND BEATRIZ DE BLAS: The role of fiscal delegation in a monetary union: a survey of the political
economy issues.
ARTURO MACÍAS AND MARIANO MATILLA-GARCÍA: Net energy analysis in a Ramsey-Hotelling growth model.
ALFREDO MARTÍN-OLIVER, SONIA RUANO AND VICENTE SALAS-FUMÁS: Effects of equity capital on the interest rate
and the demand for credit. Empirical evidence from Spanish banks.
PALOMA LÓPEZ-GARCÍA, JOSÉ MANUEL MONTERO AND ENRIQUE MORAL-BENITO: Business cycles and
investment in intangibles: evidence from Spanish firms.
ENRIQUE ALBEROLA, LUIS MOLINA AND PEDRO DEL RÍO: Boom-bust cycles, imbalances and discipline in Europe.
CARLOS GONZÁLEZ-AGUADO AND ENRIQUE MORAL-BENITO: Determinants of corporate default: a BMA approach.
GALO NUÑO AND CARLOS THOMAS: Bank leverage cycles.
YUNUS AKSOY AND HENRIQUE S. BASSO: Liquidity, term spreads and monetary policy.
FRANCISCO DE CASTRO AND DANIEL GARROTE: The effects of fiscal shocks on the exchange rate in the EMU and
differences with the US.
Unidad de Servicios Auxiliares Alcalá, 48 - 28014 Madrid
Telephone +34 91 338 6360. Fax +34 91 338 6488 E-mail: [email protected]
www.bde.es


