University of New Mexico UNM Digital Repository Biomedical Sciences ETDs Electronic eses and Dissertations 12-1-2015 e effects of ketorolac and its enantiomers on breast cancer proliferation and metastasis Amanda Perei Follow this and additional works at: hps://digitalrepository.unm.edu/biom_etds Part of the Medicine and Health Sciences Commons is esis is brought to you for free and open access by the Electronic eses and Dissertations at UNM Digital Repository. It has been accepted for inclusion in Biomedical Sciences ETDs by an authorized administrator of UNM Digital Repository. For more information, please contact [email protected]. Recommended Citation Perei, Amanda. "e effects of ketorolac and its enantiomers on breast cancer proliferation and metastasis." (2015). hps://digitalrepository.unm.edu/biom_etds/100
Transcript
University of New MexicoUNM Digital Repository
Biomedical Sciences ETDs Electronic Theses and Dissertations
12-1-2015
The effects of ketorolac and its enantiomers onbreast cancer proliferation and metastasisAmanda Peretti
Follow this and additional works at: https://digitalrepository.unm.edu/biom_etds
Part of the Medicine and Health Sciences Commons
This Thesis is brought to you for free and open access by the Electronic Theses and Dissertations at UNM Digital Repository. It has been accepted forinclusion in Biomedical Sciences ETDs by an authorized administrator of UNM Digital Repository. For more information, please [email protected].
Recommended CitationPeretti, Amanda. "The effects of ketorolac and its enantiomers on breast cancer proliferation and metastasis." (2015).https://digitalrepository.unm.edu/biom_etds/100
Amanda Sheree Peretti Candidate Biomedical Sciences Department This thesis is approved, and it is acceptable in quality and form for publication: Approved by the Thesis Committee: Dr. Laurie Hudson , Chairperson Dr. Helen Hathaway Dr. Eric Prossnitz Dr. Angela Wandinger-Ness
ii
THE EFFECTS OF KETOROLAC AND ITS ENANTIOMERS ON BREAST
CANCER PROLIFERATION AND METASTASIS
by
AMANDA S. PERETTI
B.S. BIOLOGY NEW MEXICO INSTITUTE OF MINING AND TECHNOLOGY, 2008
M.S. BIOLOGY
NEW MEXICO INSTITUTE OF MINING AND TECHNOLOGY, 2012
THESIS
Submitted in Partial Fulfillment of the Requirements for the Degree of
Master of Science
Biomedical Sciences
The University of New Mexico Albuquerque, New Mexico
December, 2015
iii
DEDICATION
To Ezio. The best experiment in the “life-sciences” I’ve ever tried.
iv
ACKNOWLEDGEMENTS
First and foremost, I would like to thank my mentor Dr. Laurie Hudson. I’m
sure she wondered what she got herself into, each and every time my carefully
made plan veered off course, or I ended up in her office to talk about some life-
altering event, but she steered me through it all with the gentle but firm hand of
an amazing and caring mentor. For that, I am truly thankful. I would like to thank
my committee members, Dr. Helen Hathaway, Dr. Eric Prossnitz, and Dr. Angela
Wandinger-Ness, for their patience and guidance. A big thank you to the
Hathaway lab members, for letting me use their equipment and space, especially
Sara Alcon and Jamie Hu for teaching me about mouse dissections and Laura
Laidler for her many hours spent helping me dose and dissect mice.
Thank you to the Hudson lab members both past and present. Especially
Brenee King and Krystal Quan whose enthusiasm and cheerful demeanors let
me know I was exactly where I needed to be. Karen Cooper for being yet another
“lab mom” and keeping us all in line. Sabrina Samudio-Ruiz for being the person
to go to if I wanted someone to get really excited about what I was excited about.
Michaela Granados for her humor and ability to inject laughter into any situation.
Young Mi Cho for all the coffee and food we shared. Erica Dashner, whose drive
is overwhelming. Dayna Dominguez, with whom I formed an immediate
friendship, and without whom I would have torn my hair out over mouse studies.
And finally, my cubicle-mate Ray Kenney, with whom I’ve shared, celebrated,
and commiserated every last step of the writing process.
v
Thank you to the COP support staff, especially Jodi Perry and Mari Ann
Farrell for quickly answering my many emails. Thank you to my BSGP cohort and
the BSGP program for their continued support and encouragement. None of this
work would have been possible without my funding grant NIH 1R21CA170375-
01S.
I thank my family and friends for their many years of support. Thank you to
my Mom and Dad for their continuous love and insistence on hard work and
perseverance. Many thanks to my dear friend, Siona Curtis-Briley, for keeping
me sane when I felt less than stable. Thank you to my in-laws, Tammy and Greg,
for being intensely interested in my experiments, and for being some of the most
generous people I know.
Finally, I am infinitely grateful to my husband, Jordan Peretti. Every day he
challenges me to become a better version of myself but still loves me when I
falter. Some time ago, in not quite these exact words, I said, “I want to quit my
job and go be a broke, stressed out graduate student.” He replied, “Go for it.
You’ll be amazing.” He had the most to lose from this venture, but was, and still
is, my biggest supporter.
vi
THE EFFECTS OF KETOROLAC AND ITS ENANTIOMERS ON BREAST
CANCER PROLIFERATION AND METASTASIS
by
Amanda S. Peretti
B.S. Biology, New Mexico Institute of Mining and Technology, 2008
M.S. Biology, New Mexico Institute of Mining and Technology, 2012
M.S. Biomedical Sciences, University of New Mexico, 2015
ABSTRACT
Breast cancer is the second leading cause of cancer related deaths in
women. Advanced breast cancer can metastasize to the lungs, liver, bones and
brain becoming fatal conditions for many patients. There is a dire need for
metastasis preventing medications, however the process required for a
medication to become FDA approved for clinical use is long and arduous.
Studies have found promising benefits for breast cancer patients given
ToradolTM, or racemic ketorolac, as an NSAID during resection surgery.
However, long-term use of racemic ketorolac is not recommended. Currently
FDA-approved for use in the racemic form, ketorolac has the potential to become
a valuable off-label drug for cancer patients, and if given as a single enantiomer,
may not cause toxic effects.
vii
Recent work on ovarian cancer cell lines has shown (R)-ketorolac to have
an effect on invasion and migration abilities via interaction with small Rho-
GTPases. We hypothesized that (R)-ketorolac would likewise have the ability to
inhibit breast cancer invasion and migration by binding to Cdc42, Rac1 and
RhoA.
The activity of racemic ketorolac and its enantiomers, (S)-ketorolac and
(R)-ketorolac was studied in both in vivo and in vitro settings. In breast cancer
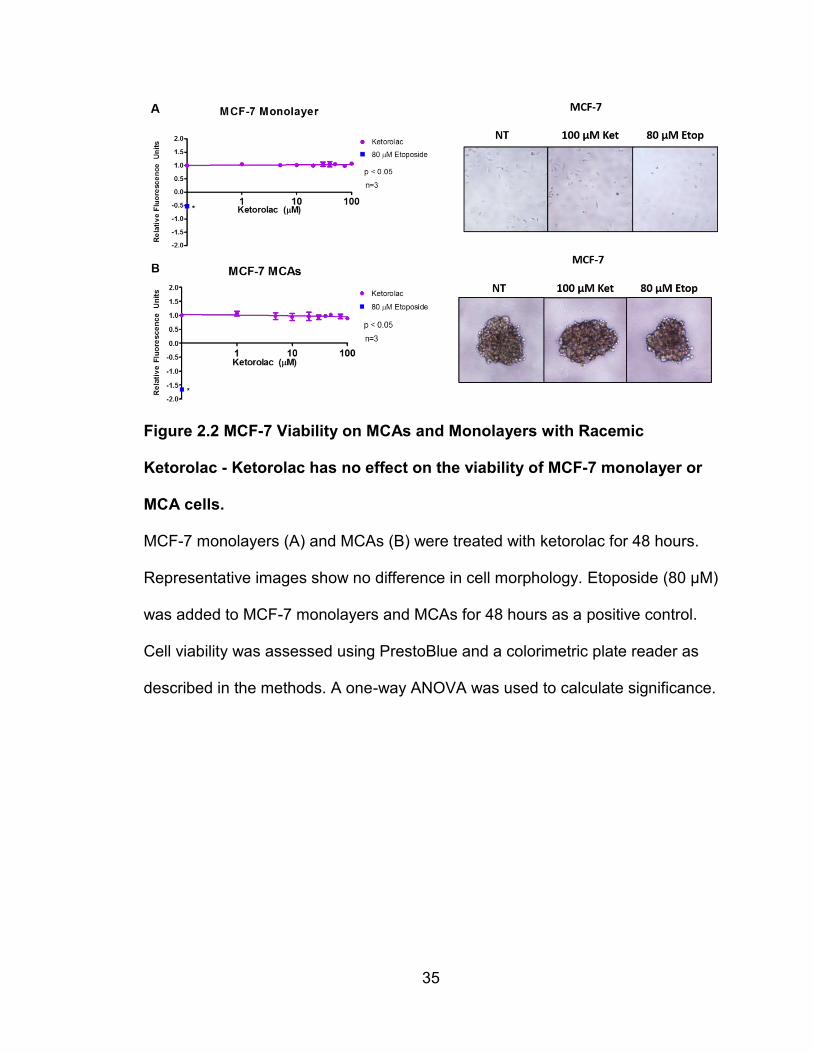
cell lines it was shown that ketorolac does not affect the viability of cells, but does
inhibit colony formation and migration. In MMTV-PyMT mouse models, ketorolac
treatment does not appear to have toxic effects on the organism, and may
prevent early mammary gland tumor growth and, in older mice, metastasis.
These studies suggest that the (R)- enantiomer of ketorolac may be useful in
preventing tumor growth and metastasis without imparting significant toxicities.
viii
TABLE OF CONTENTS DEDICATION ....................................................................................................... iii
AGA G-3’ and reverse: 5’ TCA GAA GAC TCG GCA GTC TTA-3’ (33). Fast
SYBR® Green Master Mix (Applied Biosystems, Inc. Foster City, CA) was used
to make a 1:5 master mix for each primer. Samples were loaded in triplicate in
384-well plates using 6 µL of master mix and 4 µL of sample per well. A
nuclease-free water sample was used as a negative control, and β-actin was
included as a positive control. Genes were amplified on a 7900 HT Fast Real-
Time PCR System (Applied Biosystems, Inc. Foster City, CA). Relative
expression was calculated with the ΔΔct method, using β-actin as the normalizer
and analyzing the treated samples in reference to placebo samples.
4.3 Results - 81 Day Studies
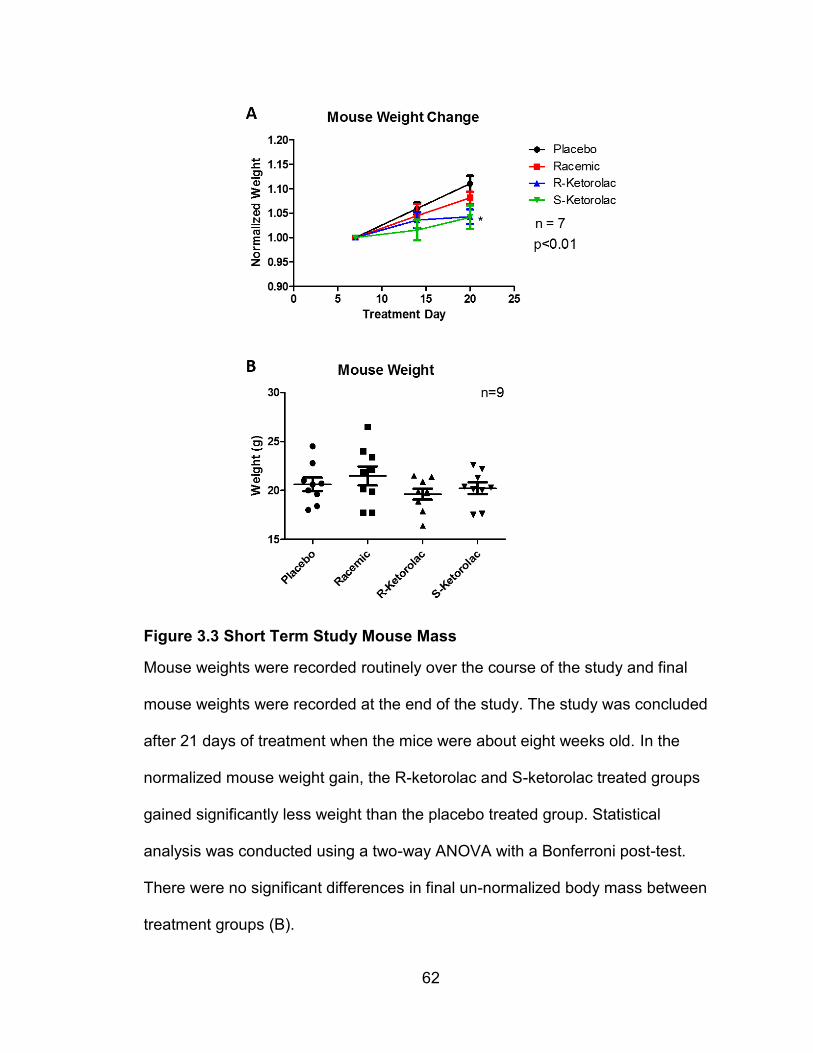
4.3.1 Weekly and Final Weights
Mice were weighed on a weekly basis. In the 12 week study, at ages 9,
10, 11 and 12 weeks, the placebo treated mice had a significantly greater overall
body mass than the (R)-ketorolac treated mice, but this significance disappeared
when the data was normalized. Each mouse’s weight was normalized to it’s
starting weight to reflect relative change in mass. In the 14 week studies, there
were no significant differences in body mass between treatment groups. Mouse
body mass at four weeks old ranged from 15-20 grams across both treatment
groups. Final mouse body mass for the mice sacrificed at 12 weeks of age was
between 24.2-29.5 grams in the placebo group and 22-26.3 grams in the (R)-
81
ketorolac group. The placebo group and (R)-ketorolac group had an n=11. Final
mouse body mass for the mice sacrificed at 14 weeks of age was between 27.2-
32.7 grams in the placebo group and 24.2-34.0 grams in the (R)-ketorolac group.
The placebo group for the 14 week treated mice had an n=6 while the R-
ketorolac group had an n=7. Three mice were dropped from the study in the 14
week old mouse group. Two mice had malocclusions and were much smaller
than other mice in the study, and one mouse was much larger than all other mice
in the study. Significance was determined using an unpaired student’s t-test.
Final mouse body weights were significantly different at 12 weeks but not
at 14 weeks. At 12 weeks, placebo treated mice had a greater average body
mass than (R)-ketorolac treated mice. Placebo treated mice had an average
mass of 26.5 grams while (R)-ketorolac mice had a final average mass of 25
grams. Significance was determined using an unpaired student’s t-test and
yielded a p < 0.05. At 14 weeks there was no significant difference in mouse
body mass, although there were only 5 mice in each treatment group. So, the
small n is likely to be the reason for no significant difference.
82
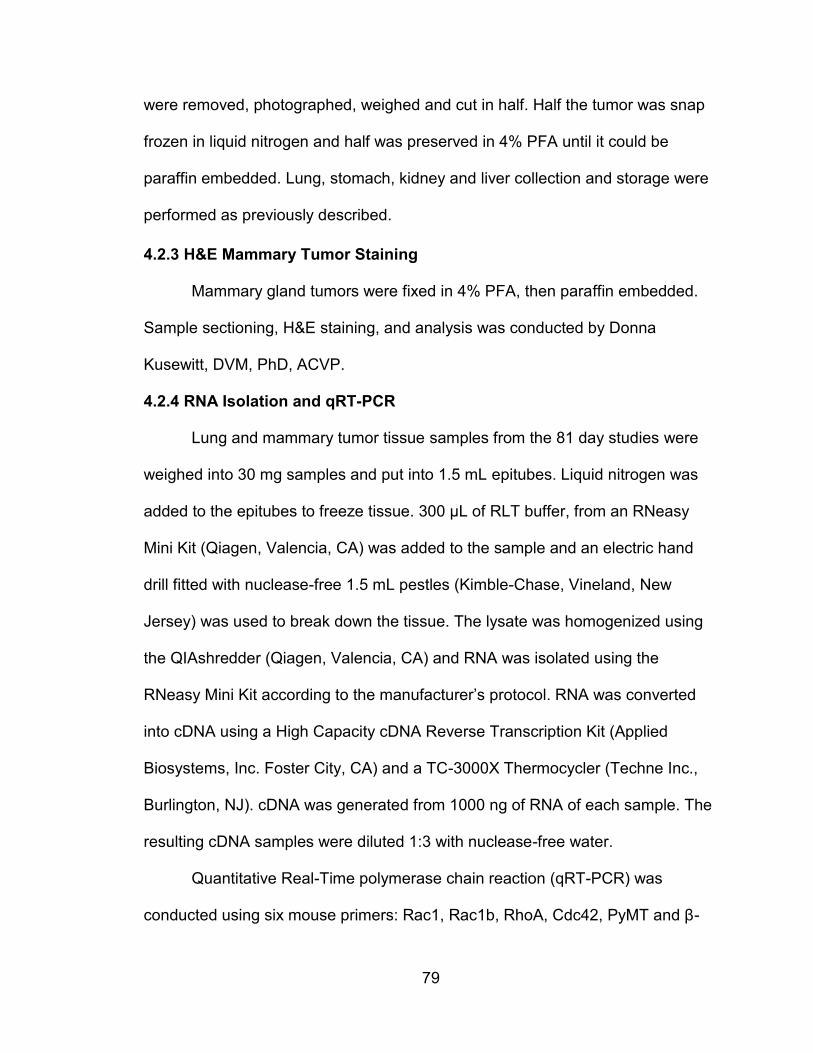
Figure 4.1 Long Term Study Weekly Weight Gain and Final Weight
Mouse mass was measured and recorded weekly. There was no significant
difference in weight gain between the two treatment groups over the course of
the study. When only the 12 week final mass was considered, there was a
significant difference between the placebo and (R)-ketorolac treated groups (B).
In the 14 week old mice, there was no significant difference in mass between
treatment groups (D). Significance was determined using an unpaired student’s t-
test (B, D).
83
4.3.2 Kidney Weights
There was no significant difference in the kidney weights between the
placebo and (R)-ketorolac treatment groups in either age group. At 12 weeks the
average kidney weight was 0.126 grams in the placebo group and 0.125 grams
for the (R)-ketorolac group. At 14 weeks the average kidney weight was 0.135
grams in the placebo group and 0.14 grams for the (R)-ketorolac group.
Additionally, there was no significant difference between the two treatment
groups when comparing the kidney weight to total weight ratios. One mouse was
excluded from the 12 week group when calculating kidney weight:total weight
ratio because its end mass was an outlier due to very large tumors. The kidney
mass in this particular mouse was comparable with the other mouse kidneys.
84
Figure 4.2 Long Term Study Kidney Weights
Kidney weight and total weight ratios were calculated. There was no significant
difference in kidney weight:total weight ratios between placebo and (R)-ketorolac
treated groups (A). There was no significant difference in kidney weights
between treatment groups in either the 12 week or the 14 week mice (B, C).
85
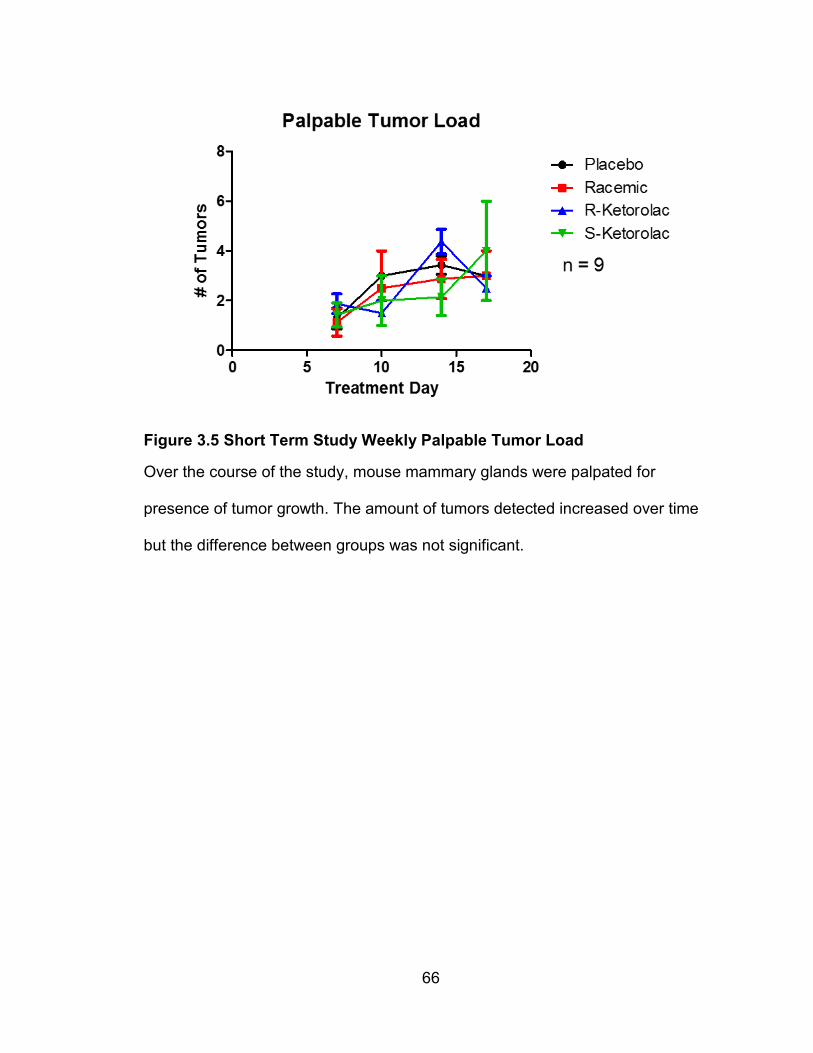
4.3.4 Weekly Tumor Growth
The number of palpable tumors increased over the course of the
experiment and with increasing mouse age. While the placebo group had slightly
more palpable tumor growth than the (R)-ketorolac treatment group over much of
the study, the difference was not significant. Additionally, palpation is a subjective
measurement that varies from session to session and cannot be considered an
exact indicator of tumor growth.
86
Figure 4.3 Long Term Study Weekly Palpable Tumor Load
Throughout the course of the study, mouse mammary glands were palpated, and
tumor growth was recorded weekly. Palpable tumors increased over the course
of the study in placebo and (R)-ketorolac treated groups. Shown are the
combined 12 and 14 week mouse experiments (A), 12 week only (B) and 14
week only (C). There was no significant difference between treatment groups in
the number of tumors felt.
87
4.3.5 Tumor Mass
Mammary tumors grew large enough to completely encompass each
mammary gland and were impossible to separate from the mammary glands.
The mass of each mammary gland/tumor was recorded. To compile the tumor
mass to total mass ratio, the total tumor mass was summed for each mouse and
compared to total mouse weight. A difference in tumor weight, while slightly
greater in the placebo treated mice, was not significant between treatment
groups. The tumor weight to total weight ratio was slightly greater in the placebo
treated mice, but not significant. At 12 weeks, the average tumor weight in the
placebo group was 3.4 grams and in the (R)-ketorolac group was 2.7 grams. At
14 weeks, the average tumor weight in the placebo group was 5.2 grams and in
the (R)-ketorolac group was 5.5 grams. One mouse was excluded from the (R)-
ketorolac group because abnormally large tumors caused it to be an outlier.
88
Figure 4.4 Long Term Study Tumor Weights
The tumor mass total:mouse mass ratio was calculated. There were no
significant differences between the two treatment groups (A). The total tumor
mass from each mouse was recorded and found to not be significantly different
between placebo and (R)-ketorolac treated mice. 14 week old mice had greater
total tumor mass than 12 week old mice (B, C).
89
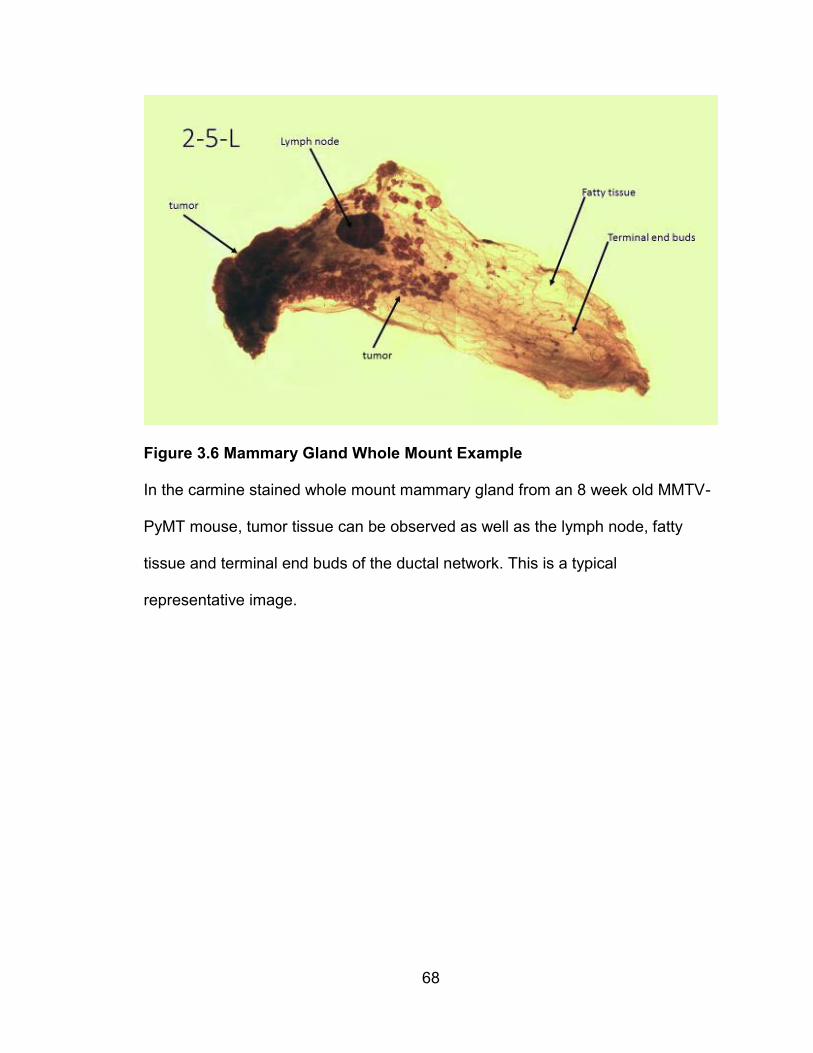
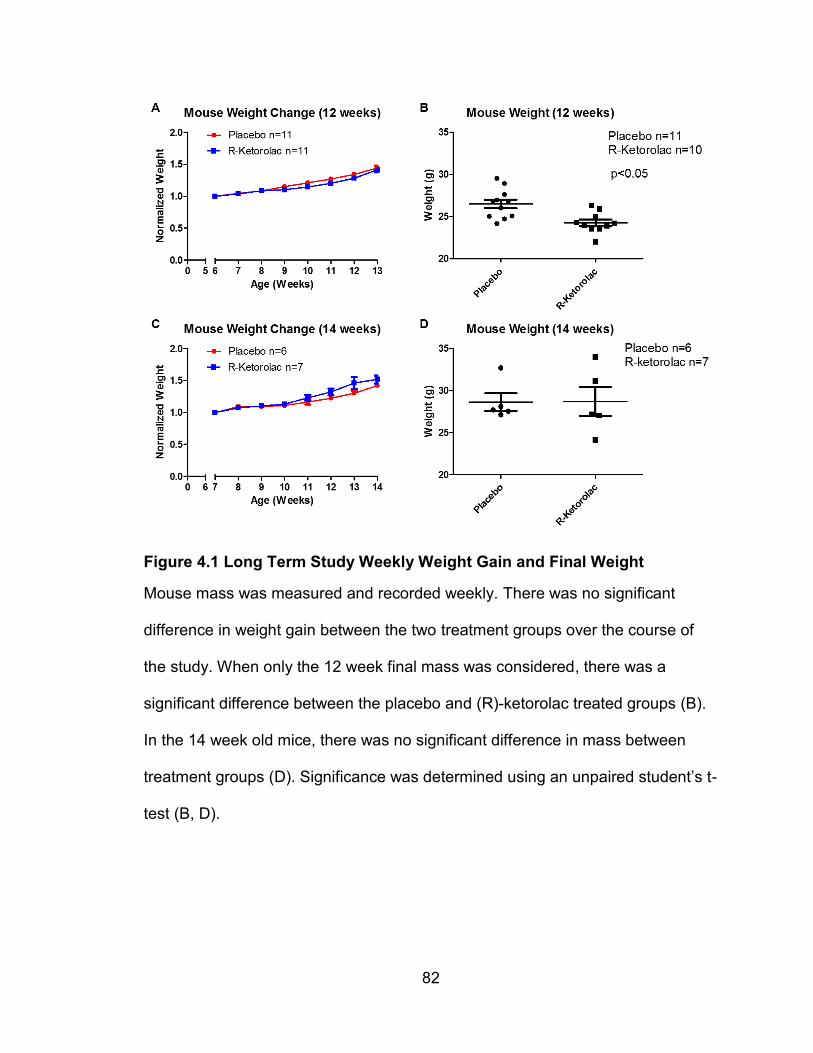
4.3.6 H&E Mammary Tumor Staining
H&E mammary tumor staining was conducted by Donna Kusewitt, DVM,
PhD, ACVP, on 12 week old mouse mammary gland tumors. There was no
significant difference in the average number of lesions per mouse. There were
fewer mice in the (R)-ketorolac treated group than the placebo control group
affected by early adenoma (Ad) and early carcinoma (Ca) suggesting that (R)-
ketorolac may help to inhibit early cancer cell proliferation, but the results were
not significantly different.
90
Figure 4.5 H&E Staining of Mouse Mammary Tumors Show No Change
Mouse mammary tumors were stained and analyzed for the presence of cell
proliferation. There were no statistically significant differences in the average
number of lesions present between the (R)-ketorolac treated mice and the
placebo control (A). There was a suggestion of a delayed early tumor
progression in the (R)-ketorolac treated mice when the percent of mice affected
was analyzed, but the differences were not significant (B).
91
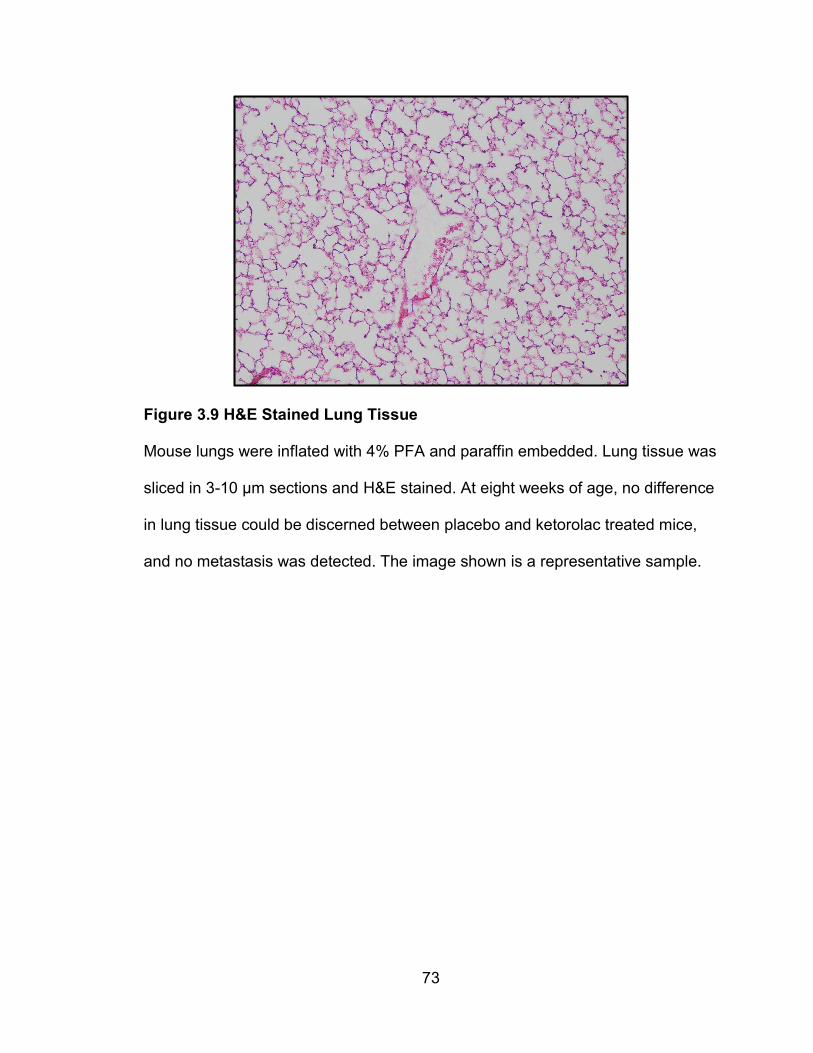
4.3.7 Lung H&E Staining
H&E stained lung tissue sections were scanned for presence of tumor
metastasis. Normal lung tissue had a lacy appearance with pink stained blood
vessels throughout. Red blood cells left behind also stained pink. Areas of
metastasis were defined as 10 or more purple stained nuclei grouped together in
a disorganized arrangement.
ImageJ was used to outline the areas of metastasis and measure the total
number of pixels within the outlined area per mouse. The total number of
metastasis sites per mouse were also counted. There was no significant
difference in the amount of lung metastasis between the (R)-ketorolac treatment
group and the placebo group in the 12 week old mice. In the 12 week old placebo
treated mice 8 out of 11 mice had less than 5 detectable metastatic sites, and in
the (R)-ketorolac treated mice 8 out of 9 mice had less than 5 detectable
metastatic sites. So, a longer study was conducted to increase the chances of
the presence of lung metastasis. In the 14 week old mice there was a slight
increase in the metastatic area and a slight increase in the total number of
metastatic sites in the placebo treated mice, when compared to the R-ketorolac
treated mice, but the increase was not significant. It is important to note, as of
this writing, the 14 week studies are not yet complete and thus, the population
size is still small. A greater population size may result in significant findings.
92
Figure 4.6 12 week old H&E Stained Lung Tissue
Mouse lungs were inflated with 4% PFA and paraffin embedded. Lung tissue was
sliced in 3-10 µm sections and H&E stained. Typical metastatic lung tissue is
represented by image A. Metastasis in lung tissue was identified and quantified
by using ImageJ to quantify the total number of metastasis foci (B) and the total
number of pixels in each metastatic area (C). There was no significant difference
in the amount of metastasis quantified in placebo and (R)-ketorolac treated mice,
at 12 weeks of age.
93
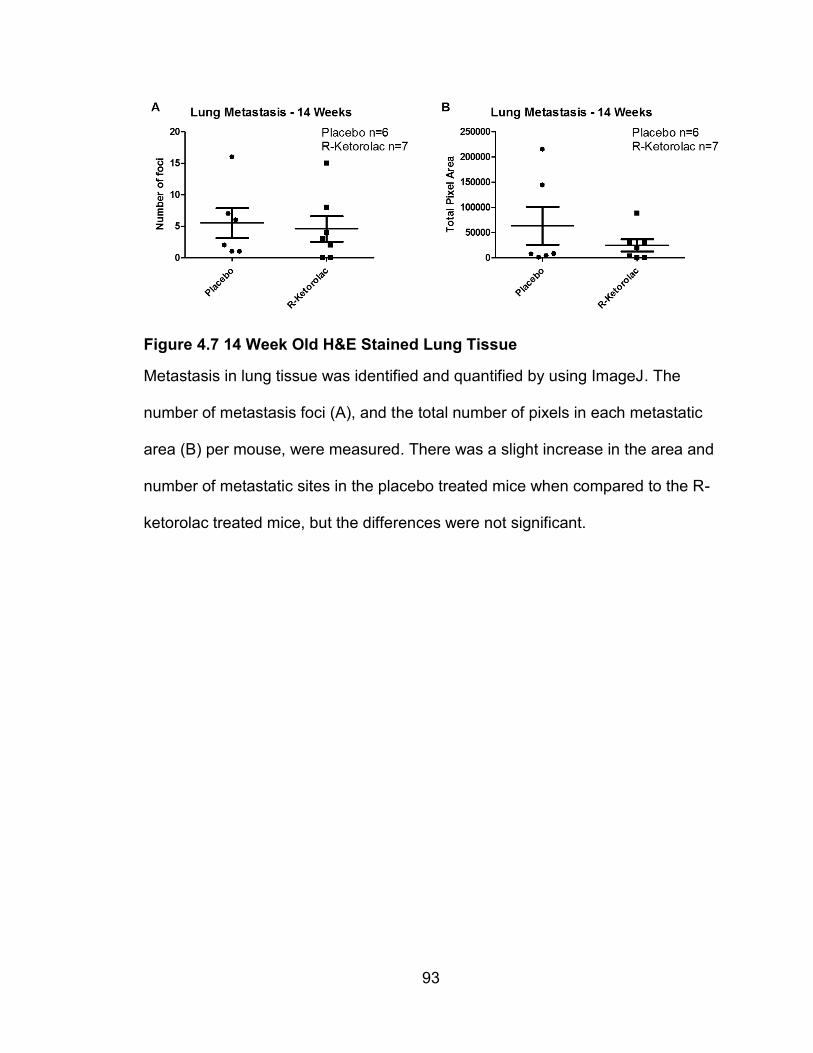
Figure 4.7 14 Week Old H&E Stained Lung Tissue
Metastasis in lung tissue was identified and quantified by using ImageJ. The
number of metastasis foci (A), and the total number of pixels in each metastatic
area (B) per mouse, were measured. There was a slight increase in the area and
number of metastatic sites in the placebo treated mice when compared to the R-
ketorolac treated mice, but the differences were not significant.
94
4.3.8 qRT-PCR – 12 Weeks
qRT-PCR was used to assess gene expression of Rho-GTPases, Rac1,
Rac1b, RhoA and Cdc42, and the mouse mammary tumor gene of interest,
PyMT. All results were corrected using β-actin controls then normalized to their
respective placebo control. A relative expression value of one, indicated no
change from the placebo control. In the tumor tissue, there was no change in
gene expression when comparing the treatment groups with the placebo control.
In the lung tissue of (R)-ketorolac treated mice, there were slight upregulations of
Rac1b and Cdc42 gene expression when compared to their respective placebo
controls but the differences were not statistically significant. There was a small
upregulation of PyMT gene expression in placebo controls when compared to the
(R)-ketorolac treated control, which is the change we were expecting to see in
the lung tissue of these animal models, but the change was not statistically
significant.
95
Figure 4.8 qPCR in Tumor Tissue – 12 Weeks
Gene expression levels in the tumors of (R)-ketorolac treated mice were not
different from the placebo control treated mice. In both treatment groups the
gene expression of Rac1 (A), Rac1b (B), RhoA (C), Cdc42 (D) and PyMT (E)
were the same.
96
Figure 4.9 qPCR in Lung Tissue – 12 Weeks
Gene expression of Rac1b (B) and Cdc42 (D) was upregulated in the (R)-
ketorolac treated mice but the difference was not significant. PyMT gene
expression in the lungs of placebo treated mice and (R)-ketorolac treated mice
was not significantly different (E). Gene expression of Rac1 (A), and RhoA (C)
was not changed.
97
4.4 Discussion
This 81 day study was conducted to examine long term effects of
ketorolac treatment on tumor growth and metastasis as well as long-term toxicity
studies. In humans, racemic ketorolac is not recommended for use longer than 5
days duration due to adverse toxic effects (42). These longer studies were
terminated earlier than the projected 81 days, due to a limiting factor of tumor
growth exceeding 15 mm in length according to IACUC guidelines. The first set
of long term experiments were terminated at 12 weeks because one mouse
exceeded the tumor growth limits. However, that particular mouse was ultimately
dropped from the study. A second, and now ongoing, set of experiments is being
conducted to 14 weeks because no lung metastasis was observed in the 12
week old mice and the majority of mice were within ethical animal treatment
limits, as set by IACUC. According to other studies conducted, the MMTV-PyMT
mice in this study are expected to have significant lung metastasis between 12
and 14 weeks of age (33,106). It has been suggested that this particular line of
MMTV-PyMT mice may have genetically drifted, resulting in tumor metastasis at
a later age. These mice require a longer time for tumor and metastasis
development. (see appendix for metastasis development)
MMTV-PyMT mouse models in this study developed palpable tumors
around 8 weeks of age and caliper measurable tumors around 10 weeks of age.
In the 12 week studies, there was a small increase in the number of palpable
tumors in the placebo treated group when compared to the (R)-ketorolac treated
group, but the difference was not significant and may have been attributed to
98
biased observation as the palpations were not conducted blindly. Overall, the
number of palpable tumors increased with age, however the number of tumors
felt is very subjective and difficult to accurately quantify from week to week.
Additionally, external measurement of tumor volume could only be estimated
because not all tumors were perfectly spherical. Some tumors grew oblong and
flattened while other tumors, particularly the 2nd and 3rd mammary gland tumors,
and later the 4th and 5th mammary gland tumors, began to grow into a single
mass as they became larger.
In this study a significant difference final in mouse mass was observed in
the 12 week study, but not in the 14 week study. When the rate of weight gain
was normalized, there was no significant difference in weight between the two
treatment groups. The differences at 12 weeks could be attributed to more than
one reason. When overall tumor mass was measured in the longer term study,
the placebo mice had a greater overall tumor mass and a greater tumor:body
mass ratio, however the differences were not significant. The placebo treated
mice may have had a greater mass due to their increased tumor burden. On the
other hand, the (R)-ketorolac treated mice may have exhibited decreased growth
due to toxic effects of the drug. Considering the lack of other toxicity indicators,
i.e. kidney mass differences, the former explanation is more likely to be true. The
differences in mouse mass between treatment groups at 14 weeks of age were
not significant. This could be an indication that the (R)-ketorolac treated mouse
tumors were delayed in growth and not contributing to overall mass until that time
99
point. It also may be due to the small number of mice in the 14 week study. A
larger population may change these final results.
In the long term studies, the mammary tumor growth was so extensive,
separation of mammary gland and tumor was deemed impossible and instead
whole tumor/mammary gland sections were removed for analysis. Tumor weight
totals per mouse were recorded and compared as whole numbers and as a ratio
of tumor weight to total mouse weight. There was no significant difference in
tumor weight totals in either the 12 week or the 14 week old mice. Although, the
14 week old mice had a greater overall tumor weight than the 12 week old mice,
which was expected. There was also no significant difference in the tumor
weight:total weight ratios between the two treatment groups. These results
indicate that (R)-ketorolac is not affecting the overall tumor growth.
Lung tissue was assessed for metastatic lesions. Between 12 and 14
weeks of age, the MMTV-PyMT mouse model exhibits mammary tumor
metastasis to the lungs (33,106). In the 12 week old mouse population, some
mice had obvious metastatic lesions, while some had possible small initial sites
that were difficult to identify, and still others exhibited no lung metastasis at all.
There was no trend observed between the presence of metastatic sites and
treatment groups. A longer study treating MMTV-PyMT mice to 14 weeks of age
is currently underway to allow adequate time for lung metastasis to develop.
Preliminary results indicate that while there is more overall lung metastasis in the
14 week old mice, the amount of metastasis is not as great as expected for this
age of PyMT mouse. Studies of lung tissue collected months earlier, from the
100
same line of MMTV-PyMT mice have shown abundant lung metastasis as early
as 13 weeks of age (see appendix). It is suspected there has been a genetic drift
in the expected phenotype of this particular line of mice and it may be prudent to
end this colony and purchase new breeding pairs, before continuing these
experiments.
Considering the lack of lung metastasis trend in the 12 week old mouse
models, a difference in Rho-GTPase and PyMT gene expression was not
expected between treatment groups. Nonetheless, PCR was conducted on both
tumor samples and lung tissue samples from the study, to examine what
changes, if any, were able to be observed in small Rho-GTPase and PyMT
expression levels. There were no significant changes in gene expression in the
tumor samples, most likely because both the (R)-ketorolac and placebo treated
mice grew tumors at nearly the same rate and had tumors of similar sizes. In the
lung tissue, there were small upregulations of Rac1b and Cdc42 gene expression
in the (R)-ketorolac treated mice but the differences were not significant. It was
expected that the (R)-ketorolac treated mice would exhibit less lung metastasis
and thus less PyMT gene expression in the lungs than the placebo treated mice
and while there was a noticeable trend, the difference was not significant. The 14
week animal studies are expected to exhibit more significant changes in gene
expression and solidify the trends observed.
While the animal experiments did not yield complete results, we were able
to observe interesting trends in ketorolac treated animal models. Therapeutic
concentrations of ketorolac did not cause toxic effects in MMTV-PyMT breast
101
cancer mouse models. There was a trend in decreased PyMT expression in the
lungs of mice treated with (R)-ketorolac, suggesting a decrease in tumor
metastasis, but more work will have to be done to confirm these results.
102
5. SIGNIFICANCE AND FUTURE DIRECTIONS
Cancer is often described as having specific hallmarks that distinguish it
from other diseases, one of those being inflammation (123). It has been
demonstrated that several NSAIDs, such as ketorolac, possess anti-cancer
properties that may be useful as part of anti-cancer therapies (40). Racemic
ketorolac is routinely used to reduce pain and inflammation in surgical cases.
However, the (S)- form of ketorolac is primarily responsible for the drug’s anti-
inflammatory properties (48). (R)-ketorolac, previously believed to be relatively
inert, has recently been shown to have an important role in decreasing tumor
metastasis and thus increasing patient survival rates (45). Work performed in our
research group has found that in ovarian cancer cells, (R)-ketorolac inhibits small
Rho-GTPases, Rac1 and Cdc42 which are vital in enabling the cell to
metastasize (50).
This study demonstrated the ability of (R)-ketorolac to inhibit early breast
tumor growth without causing significant toxic effects to surrounding cells, or the
organism as a whole. The main concern with long term use of ketorolac is the
drug’s toxic effects on the body, including gastrointestinal ulcerations and
bleeding (42). These toxic effects can be attributed to the (S)- enantiomer of
ketorolac which inhibits COX1/2, enzymes important in maintaining mucosal
linings in the stomach and intestines (52). (R)-ketorolac, when used to treat cells
in culture, was not cytotoxic at relatively high concentrations. It did not alter the
viability of breast cancer cells, nor did it alter their cell cycle behavior. In mouse
models, when (R)-ketorolac was used for durations longer than the clinically
103
recommended limit of five days, there were no immediate toxic effects. These
results indicated that (R)- enantiomer of ketorolac alone may be considered safe
for long term use.
The in vitro experiments yielded many negative, but not necessarily
inconclusive results. From these experiments, we found that (R)-ketorolac is a
relatively benign drug, not decreasing cell viability or growth but inhibiting the
cell’s ability to migrate and form colonies. We have not shown a direct interaction
between (R)-ketorolac and Rac1 and Cdc42 in breast cancer cells, so further
experiments are imperative to understanding (R)-ketorolac’s mechanism of
action in breast cancer cells. Immunoblotting to examine the activity of Rac1 and
Cdc42 in breast cancer cell lines when treated with (R)-ketorolac is one step that
could be taken.
The animal studies conducted had a few limitations that are important to
note. The ability to give each mouse an exact dose of ketorolac every 12 hours
was not feasible. The mice were given oral doses of ketorolac in the form of
bacon flavored pills. Sometimes certain mice did not eat their pills, and as the
study was not conducted by oral gavage, we could not force the mice to eat their
pills if they refused. Careful notes were taken and mice that refused their pills the
majority of the time were dropped from the study. The occasional missed dose
was noted, but not considered an absolute reason to drop the mouse from the
study. While not optimal, it is very likely that an actual human may occasionally
forget to take their medication at the exact indicated time.
104
One complication that arose with the mouse studies was lack of
knowledge of the exact duration of time necessary to run the experiment. While
the literature indicates positive lung metastasis in MMTV-PyMT mice at 14 weeks
of age, this particular group of MMTV-PyMT mice has been known in the past to
have lung metastasis at 12-13 weeks old (33). However, there was a suspected
genetic drift, because at 12 weeks old, there was little to no lung metastasis
observed in the lung sections. Briefly, lung tissue samples from untreated PyMT
mice in this same breeding group at 12, 13, 14, and 16 weeks of age were H&E
stained and examined for metastasis. It was decided that 14 weeks would be the
best age of sacrifice for examining lung metastasis. Currently, another study is
being conducted, carrying out this experiment to 14 weeks, and some of that
data has been included in the results. We hope to see a positive effect of (R)-
ketorolac treatment on lung metastasis.
Future animal experiments could involve other known breast cancer
mouse models such as a HER2 mouse models. It is important to ask the
question: Does (R)-ketorolac treatment yield significant benefits in other breast
cancer models? It would also be interesting to examine the effects of (R)-
ketorolac treatment on xenograft or allograft mouse models. Additionally,
conducting longer term experiments, modeling a chronically medicated individual,
could yield information about how long a patient may benefit from (R)-ketorolac
treatment, and answer the questions: Is there a point where (R)-ketorolac
treatment is no longer significantly beneficial? And is (R)-ketorolac treatment able
to keep metastasis at bay, long term? Finally, because (R)-ketorolac has been
105
shown to have positive results in multiple cancer forms, including ovarian, colon
and now breast cancer, testing its effectiveness on preventing metastasis of
other forms of cancer could be a logical next step.
What we know from these experiments, it is possible that the (R)-ketorolac
enantiomers may be safely used for long term treatment in an effort to decrease
breast cancer metastasis, although more evidence is needed. As FDA guidelines
become stricter, it will be important to look at pre-approved drugs in new ways.
Currently, much of the focus of cancer drug discovery is on creating new
compounds that have toxic effects on cancer cells. While some of these
compounds may be effective at killing cancer cells, they can often be so toxic
that they could never be successfully used in vivo without causing serious
damage or death. New drugs take approximately 10-15 years to advance from
invention to routine clinical use and can cost millions of dollars during the course
of development (124). Utilizing FDA approved drugs in off-label use against
cancerous cells can improve cancer treatment options and decrease the time it
takes for a therapeutic approach to move from the bench to clinical treatment.
These experiments and other evidence in the literature suggest a benefit to
administering even racemic ketorolac to cancer patients over other pain or anti-
inflammatory medications. A decrease in early breast cancer metastasis will lead
to more positive patient outcomes, enabling patients to live a longer, better
quality of life.
106
6. APPENDIX
Figure 6.1 MMTV-PyMT Mouse Lung Metastasis Time Course
MMTV-PyMT mice were sacrificed at increasing age time points and lung tissue
was H&E stained and analyzed for presence and size of metastasis lesions.
These mice were not given any drug treatments. At 12 weeks of age, almost no
mice had lung metastasis. At 13 weeks of age the numbers of lung metastasis
foci increased and remained around the same quantity at 16 weeks. This
information helped us form the decision to repeat the long term (R)-ketorolac
study to extend the sacrifice age to 14 weeks rather than 12 weeks. The total
lung metastasis area increased around 13 weeks and remained around the same
area at 16 weeks. There was a decrease in lung metastasis area at 14 weeks for
this set of data, but there were only two data points at 14 weeks. There were no
samples available for the 15 week time point.
107
7. REFERENCES
1. American Cancer Society. Cancer Facts & Figures 2015. 2015;
2. Jordan VC. Fourteenth Gaddum Memorial Lecture. A current view of tamoxifen for the treatment and prevention of breast cancer. Br J Pharmacol. 1993;110:507–17.
3. Cianfrocca M, Goldstein LJ. Prognostic and predictive factors in early-stage breast cancer. Oncologist [Internet]. 2004;9:606–16. Available from: http://www.ncbi.nlm.nih.gov/pubmed/23220842
4. Group EBCTC. Tamoxifen for early breast cancer: an overview of the randomised trials. Lance [Internet]. 1998;351:1451–67. Available from: http://www.ncbi.nlm.nih.gov/pubmed/9605801
5. Dent R, Trudeau M, Pritchard KI, Hanna WM, Kahn HK, Sawka C a., et al. Triple-negative breast cancer: Clinical features and patterns of recurrence. Clin Cancer Res. 2007;13:4429–34.
6. Haffty BG, Yang Q, Reiss M, Kearney T, Higgins S a., Weidhaas J, et al. Locoregional relapse and distant metastasis in conservatively managed triple negative early-stage breast cancer. J Clin Oncol. 2006;24:5652–7.
7. Breast Cancer Treatment (PDQ®): Treatment Option Overview [Internet]. Natl. Cancer Inst. NIH. 2015 [cited 2015 May 25]. Available from: http://www.cancer.gov/types/breast/patient/breast-treatment-pdq#section/_185
8. Types of Breast Cancer: ER Positive, HER2 Positive, and Triple Negative [Internet]. WebMD. 2012 [cited 2015 May 25]. Available from: http://www.webmd.com/breast-cancer/breast-cancer-types-er-positive-her2-positive
9. Silberman A. ER-Positive Breast Cancer: Prognosis, Life Expectancy, and More [Internet]. Healthline. 2014 [cited 2015 May 25]. Available from: http://www.healthline.com/health/breast-cancer/er-positive-prognosis-life-expectancy#Overview1
108
10. Slamon DJ, Clark GM, Wong SG, Levin WJ, Ullrich A, McGuire WL. Human breast cancer: correlation of relapse and survival with amplification of the HER-2/neu oncogene. Science. 1987;235:177–82.
11. Yarden Y. Biology of HER2 and its importance in breast cancer. Oncology. 2001;61 Suppl 2:1–13.
12. Slamon DJ, Godolphin W, Jones LA, Holt JA, Wong SG, Keith DE, et al. Studies of the HER-2/neu proto-oncogene in human breast and ovarian cancer. Science. 1989;244:707–12.
13. Mitri Z, Constantine T, O’Regan R. The HER2 Receptor in Breast Cancer: Pathophysiology, Clinical Use, and New Advances in Therapy. Chemother Res Pract [Internet]. 2012;2012:743193. Available from: http://www.pubmedcentral.nih.gov/articlerender.fcgi?artid=3539433&tool=pmcentrez&rendertype=abstract
14. Stern DF, Heffernan P a, Weinberg R a. P185, a Product of the Neu Proto-Oncogene, Is a Receptorlike Protein Associated With Tyrosine Kinase Activity. Mol Cell Biol. 1986;6:1729–40.
15. Akiyama T, Sudo C, Ogawara H, Toyoshima K, Yamamoto T. The product of the human c-erbB-2 gene: a 185-kilodalton glycoprotein with tyrosine kinase activity. Science. 1986;232:1644–6.
16. Olayioye M a, Neve RM, Lane H a, Hynes NE. The ErbB signaling network: receptor heterodimerization in development and cancer. EMBO J. 2000;19:3159–67.
17. Morgensztern D, McLeod HL. PI3K/Akt/mTOR pathway as a target for cancer therapy. Anticancer Drugs. 2005;16:797–803.
18. Borg a, Tandon a K, Sigurdsson H, Clark GM, Ferno M, Fuqua S a, et al. HER-2/neu amplification predicts poor survival in node-positive breast cancer. Cancer Res. 1990;50:4332–7.
19. Winstanley J, Cooke T, Murray GD, Platt-Higgins a, George WD, Holt S, et al. The long term prognostic significance of c-erbB-2 in primary breast cancer. Br J Cancer. 1991;63:447–50.
109
20. Clark GM, Mcguire WL. Follow-up Study of HER-2 / neu Amplification in Primary Breast Cancer. Cancer Res. 1991;51:944–8.
21. Tandon a. K, Clark GM, Chamness GC, Ullrich a., McGuire WL. HER-2/neu oncogene protein and prognosis in breast cancer. J Clin Oncol. 1989;7:1120–8.
22. Slamon DJ, Leyland-Jones B, Shak S, Fuchs H, Paton V, Bajamonde A, et al. Use of chemotherapy plus a monoclonal antibody against HER2 for metastatic breast cancer that overexpresses HER2. [Internet]. N. Engl. J. Med. 2001. Available from: http://www.nejm.org/doi/full/10.1056/NEJM200103153441101
23. Cho H-S, Mason K, Ramyar KX, Stanley AM, Gabelli SB, Denney DW, et al. Structure of the extracellular region of HER2 alone and in complex with the Herceptin Fab. Nature. 2003;421:756–60.
24. Marrazzo JM, Ramjee G, Richardson BA, Gomez K, Mgodi N, Nair G, et al. Tenofovir-based preexposure prophylaxis for HIV infection among African women. N Engl J Med [Internet]. 2015;372:509–18. Available from: http://www.ncbi.nlm.nih.gov/pubmed/25651245
25. Vogel CL, Cobleigh M a, Tripathy D, Gutheil JC, Harris LN, Fehrenbacher L, et al. Efficacy and Safety of Trastuzumab as a Single Agent in First-Lin Treatment of HER2-Overexpressing Metastatic Breast Cancer. J Clin Oncol. 2003;20:719–26.
26. Romond EH, Perez E a, Bryant J, Suman VJ, Geyer CE, Davidson NE, et al. Trastuzumab plus adjuvant chemotherapy for operable HER2-positive breast cancer. N Engl J Med. 2005;353:1673–84.
27. Cancer Drugs & Oncology Drugs [Internet]. MediLexicon. 2013. Available from: http://www.medilexicon.com/drugs-list/cancer.php
28. Wang D-Y, Fulthorpe R, Liss SN, Edwards EA. Identification of estrogen-responsive genes by complementary deoxyribonucleic acid microarray and characterization of a novel early estrogen-induced gene: EEIG1. Mol Endocrinol. 2004;18:402–11.
29. Williams GM, Iatropoulos MJ, Djordjevic M V, Kaltenberg OP. The
110
triphenylethylene drug tamoxifen is a strong liver carcinogen in the rat. Carcinogenesis. 1993;14:315–7.
30. Rutqvist LE, Johansson H, Signomklao T, Johansson U, Fornander T, Wilking N. Adjuvant tamoxifen therapy for early stage breast cancer and second primary malignancies. Stockholm Breast Cancer Study Group. J. Natl. Cancer Inst. 1995.
31. Polin S a., Ascher SM. The effect of tamoxifen on the genital tract. Cancer Imaging. 2008;8:135–45.
32. Kedar RP, Bourne TH, Powles TJ, Collins WP, Ashley SE, Cosgrove DO, et al. Effects of tamoxifen on uterus and ovaries of postmenopausal women in a randomised breast cancer prevention trial. Lancet. 1994;343:1318–21.
33. Marjon N a, Hu C, Hathaway HJ, Prossnitz ER. G protein-coupled estrogen receptor regulates mammary tumorigenesis and metastasis. Mol Cancer Res [Internet]. 2014 [cited 2014 Nov 20];12:1644–54. Available from: http://www.ncbi.nlm.nih.gov/pubmed/25030371
35. Morrison KC, Hergenrother PJ. Whole cell microtubule analysis by flow cytometry. Anal Biochem [Internet]. 2012 [cited 2015 Mar 24];420:26–32. Available from: http://www.sciencedirect.com/science/article/pii/S0003269711005409
36. Gottesman MM. Mechanisms of cancer drug resistance. Annu Rev Med. 2002;53:615–27.
37. T. T, M. N, a. T, N. F, T. M, H. S, et al. Molecular targeting therapy of cancer: Drug resistance, apoptosis and survival signal. Cancer Sci [Internet]. 2003;94:15–21. Available from: http://ovidsp.ovid.com/ovidweb.cgi?T=JS&PAGE=reference&D=emed6&NEWS=N&AN=2003198227
38. Holohan C, Van Schaeybroeck S, Longley DB, Johnston PG. Cancer drug
111
resistance: an evolving paradigm. Nat Rev Cancer [Internet]. Nature Publishing Group; 2013;13:714–26. Available from: http://www.ncbi.nlm.nih.gov/pubmed/24060863
39. Mestre-Ferrandiz, J., Sussex, J., Towse A. The R&D Cost of a New Medicine. London: Office of Health Economics; 2012.
40. Oprea TI, Bauman JE, Bologa CG, Buranda T, Chigaev A, Edwards BS, et al. Drug Repurposing from an Academic Perspective. Drug Discov Today Ther Strateg [Internet]. Elsevier Ltd; 2011 [cited 2014 Jun 19];8:61–9. Available from: http://www.pubmedcentral.nih.gov/articlerender.fcgi?artid=3285382&tool=pmcentrez&rendertype=abstract
41. Gillis JC, Brogden RN. Ketorolac. A reappraisal of its pharmacodynamic and pharmacokinetic properties and therapeutic use in pain management. Drugs. 1997;53:139–88.
42. ketorolac (Rx) - Toradol [Internet]. WebMD. 2015 [cited 2015 Jun 30]. Available from: http://reference.medscape.com/drug/ketorolac-343292
43. Retsky M, Demicheli R, Hrushesky WJM, Forget P, De Kock M, Gukas I, et al. Reduction of breast cancer relapses with perioperative non-steroidal anti-inflammatory drugs: new findings and a review. Curr Med Chem [Internet]. 2013;20:4163–76. Available from: http://www.pubmedcentral.nih.gov/articlerender.fcgi?artid=3831877&tool=pmcentrez&rendertype=abstract
44. Forget P, Machiels J-P, Coulie PG, Berliere M, Poncelet AJ, Tombal B, et al. Neutrophil:lymphocyte ratio and intraoperative use of ketorolac or diclofenac are prognostic factors in different cohorts of patients undergoing breast, lung, and kidney cancer surgery. Ann Surg Oncol [Internet]. 2013;20 Suppl 3:S650–60. Available from: http://www.ncbi.nlm.nih.gov/pubmed/23884751
45. Guo Y, Kenney SR, Cook LS, Adams SF, Rutledge T, Romero E, et al. A novel pharmacologic activity of ketorolac for therapeutic benefit in ovarian cancer patients. Clin Cancer Res [Internet]. 2015; Available from: http://clincancerres.aacrjournals.org/cgi/doi/10.1158/1078-0432.CCR-15-0461
112
46. Forget P, Vandenhende J, Berliere M, MacHiels JP, Nussbaum B, Legrand C, et al. Do intraoperative analgesics influence breast cancer recurrence after mastectomy? A retrospective analysis. Anesth Analg. 2010;110:1630–5.
47. Retsky M, Rogers R, Demicheli R, Hrushesky WJ, Gukas I, Vaidya JS, et al. NSAID analgesic ketorolac used perioperatively may suppress early breast cancer relapse: particular relevance to triple negative subgroup. Breast Cancer Res Treat [Internet]. 2012 [cited 2014 Jun 19];134:881–8. Available from: http://www.ncbi.nlm.nih.gov/pubmed/22622810
48. Handley DA, Cervoni P, McCray JE, McCullough JR. Preclinical enantioselective pharmacology of (R)- and (S)- ketorolac. J Clin Pharmacol [Internet]. 1998 [cited 2014 Jun 19];38:25S – 35S. Available from: http://www.ncbi.nlm.nih.gov/pubmed/9549656
49. Jerussi TP, Caubet JF, McCray JE, Handley D a. Clinical endoscopic evaluation of the gastroduodenal tolerance to (R)- ketoprofen, (R)- flurbiprofen, racemic ketoprofen, and paracetamol: a randomized, single-blind, placebo-controlled trial. J Clin Pharmacol. 1998;38:19S – 24S.
50. Guo Y, Kenney SR, Muller CY, Adams S, Rutledge T, Romero E, et al. R-ketorolac Targets Cdc42 and Rac1 and Alters Ovarian Cancer Cell Behaviors Critical for Invasion and Metastasis. Mol Cancer Ther [Internet]. 2015; Available from: http://mct.aacrjournals.org/cgi/doi/10.1158/1535-7163.MCT-15-0419
51. Oprea, Tudor I., Sklar, Larry A., Agola, Jacob O., Guo, Yuna, Silberberg, Melina, Roxby, Joshua et al. Novel activities of select NSAID R-enantiomers against Rac1 and Cdc42 GTPases. PLoS One. 2015;
52. Mroszczak E, Combs D, Chaplin M, Tsina I, Tarnowski T, Rocha C, et al. Chiral kinetics and dynamics of ketorolac. J Clin Pharmacol. 1996;36:521–39.
53. Dempke W, Rie C, Grothey a, Schmoll HJ. Cyclooxygenase-2: a novel target for cancer chemotherapy? J Cancer Res Clin Oncol. 2001;127:411–7.
54. Vane JR, Bakhle YS, Botting RM. Cyclooxygenases 1 and 2. Annu Rev Pharmacol Toxicol. 1998;38:97–120.
113
55. Moskowitz MA, Coughlin SR. Clinical applications of prostaglandins and their inhibitors. Stroke. 1981;12:882–6.
56. Hejna M, Raderer M, Zielinski CC. Inhibition of metastases by anticoagulants. J Natl Cancer Inst. 1999;91:22–36.
57. Leung KH, Mihich E. Prostaglandin modulation of development of cell-mediated immunity in culture. Nature. 1980;288:597–600.
58. Brunda MJ, Herberman RB, Holden HT. Inhibition of murine natural killer cell activity by prostaglandins. J Immunol. 1980;124:2682–7.
59. Milas L, Kishi K, Mason K, Jaime L, Tofilon PJ. BRIEF Enhancement of Tumor. Communication. 1999;91:1501–4.
60. Taketo MM. Cyclooxygenase-2 Inhibitors in Tumorigenesis ( Part I ). 1998;90:1529–36.
61. Fosslien E. Molecular pathology of cyclooxygenase-2 in neoplasia. Ann Clin Lab Sci [Internet]. Institute for Clinical Science; [cited 2015 Mar 25];30:3–22. Available from: http://cat.inist.fr/?aModele=afficheN&cpsidt=1292972
62. Nelson a R, Fingleton B, Rothenberg ML, Matrisian LM. Matrix metalloproteinases: biologic activity and clinical implications. J Clin Oncol. 2000;18:1135–49.
63. Pakneshan P, Birsner AE, Adini I, Becker CM, D’Amato RJ. Differential suppression of vascular permeability and corneal angiogenesis by nonsteroidal anti-inflammatory drugs. Investig Ophthalmol Vis Sci. 2008;49:3909–13.
64. Krebs MG, Hou J-M, Ward TH, Blackhall FH, Dive C. Circulating tumour cells: their utility in cancer management and predicting outcomes. Ther Adv Med Oncol. 2010;2:351–65.
65. Zhe X, Cher ML, Bonfil RD. Circulating tumor cells: finding the needle in the haystack. Am J Cancer Res [Internet]. 2011;1:740–51. Available from:
66. Tang Y, Olufemi L, Wang M-T, Nie D. Role of Rho GTPases in breast cancer. Front Biosci [Internet]. 2008 [cited 2014 Jun 25];13:759–76. Available from: http://www.bioscience.org/2008/v13/af/2718/list.htm
67. Fritz G, Just I, Kaina B. Rho GTPases are over-expressed in human tumors. Int J Cancer. 1999;81:682–7.
68. Fritz G, Brachetti C, Bahlmann F, Schmidt M, Kaina B. Rho GTPases in human breast tumours: expression and mutation analyses and correlation with clinical parameters. Br J Cancer. 2002;87:635–44.
69. Schnelzer a, Prechtel D, Knaus U, Dehne K, Gerhard M, Graeff H, et al. Rac1 in human breast cancer: overexpression, mutation analysis, and characterization of a new isoform, Rac1b. Oncogene [Internet]. 2000;19:3013–20. Available from: http://www.ncbi.nlm.nih.gov/pubmed/10871853
70. Kleer CG, van Golen KL, Zhang Y, Wu Z-F, Rubin M a, Merajver SD. Characterization of RhoC expression in benign and malignant breast disease: a potential new marker for small breast carcinomas with metastatic ability. Am J Pathol [Internet]. American Society for Investigative Pathology; 2002;160:579–84. Available from: http://dx.doi.org/10.1016/S0002-9440(10)64877-8
71. Jett MF, Ramesha CS, Brown CD, Chiu S, Emmett C, Voronin T, et al. Characterization of the analgesic and anti-inflammatory activities of ketorolac and its enantiomers in the rat. J Pharmacol Exp Ther. 1999;288:1288–97.
72. Ridley AJ, Paterson HF, Johnston CL, Diekmann D, Hall A. The small GTP-binding protein rac regulates growth factor-induced membrane ruffling. Cell [Internet]. 1992 [cited 2015 Mar 24];70:401–10. Available from: http://www.sciencedirect.com/science/article/pii/0092867492901648
73. Hall a. Rho GTPases and the Actin Cytoskeleton. Science (80- ). 1998;279:509–14.
115
74. Etienne-Manneville S, Hall A. Rho GTPases in cell biology. Nature. 2002;420:629–35.
75. Van Aelst L, D’Souza-Schorey C. Rho GTPases and signaling networks. Genes Dev. 1997;11:2295–322.
76. Pasqualucci L, Neumeister P, Goossens T, Nanjangud G, Chaganti RS, Küppers R, et al. Hypermutation of multiple proto-oncogenes in B-cell diffuse large-cell lymphomas. Nature. 2001;412:341–6.
77. Preudhomme C, Roumier C, Hildebrand MP, Dallery-Prudhomme E, Lantoine D, Laï JL, et al. Nonrandom 4p13 rearrangements of the RhoH/TTF gene, encoding a GTP-binding protein, in non-Hodgkin’s lymphoma and multiple myeloma. Oncogene. 2000;19:2023–32.
78. Jordan P, Brazåo R, Boavida MG, Gespach C, Chastre E. Cloning of a novel human Rac1b splice variant with increased expression in colorectal tumors. Oncogene [Internet]. 1999;18:6835–9. Available from: http://www.ncbi.nlm.nih.gov/pubmed/10597294
79. Katz E, Sims AH, Sproul D, Caldwell H, Dixon JM, Meehan RR, et al. Targeting of Rac GTPases blocks the spread of intact human breast cancer ABSTRACT : Oncotarget. 2012;3:608–13.
80. Kawazu M, Ueno T, Kontani K, Ogita Y, Ando M, Fukumura K, et al. Transforming mutations of RAC guanosine triphosphatases in human cancers. Proc Natl Acad Sci U S A [Internet]. 2013;110:3029–34. Available from: http://www.pubmedcentral.nih.gov/articlerender.fcgi?artid=3581941&tool=pmcentrez&rendertype=abstract
81. Alan JK, Lundquist EA. Mutationally activated Rho GTPases in cancer. Small GTPases [Internet]. 2013;4:159–63. Available from: http://www.tandfonline.com/doi/abs/10.4161/sgtp.26530
82. Ellenbroek SIJ, Collard JG. Rho GTPases: Functions and association with cancer. Clin Exp Metastasis. 2007;24:657–72.
83. Mertens AE, Roovers RC, Collard JG. Regulation of Tiam1-Rac signalling. FEBS Lett. 2003;546:11–6.
116
84. Gururaj AE, Rayala SK, Kumar R. P21-Activated Kinase Signaling in Breast Cancer. Breast Cancer Res. 2005;7:5–12.
85. Jaffe AB, Hall A. Rho GTPases: biochemistry and biology. Annu Rev Cell Dev Biol. 2005;21:247–69.
86. Nobes CD, Hall a. Rho, rac, and cdc42 GTPases regulate the assembly of multimolecular focal complexes associated with actin stress fibers, lamellipodia, and filopodia. Cell. 1995;81:53–62.
87. Kozma R, Ahmed S, Best a, Lim L. The Ras-related protein Cdc42Hs and bradykinin promote formation of peripheral actin microspikes and filopodia in Swiss 3T3 fibroblasts. Mol Cell Biol. 1995;15:1942–52.
88. Hall a. Rho GTPases and the control of cell behaviour. Biochem Soc Trans. 2005;33:891–5.
89. Baugher PJ, Krishnamoorthy L, Price JE, Dharmawardhane SF. Rac1 and Rac3 isoform activation is involved in the invasive and metastatic phenotype of human breast cancer cells. Breast Cancer Res. 2005;7:R965–74.
90. Ridley AJ, Hall A. The small GTP-binding protein rho regulates the assembly of focal adhesions and actin stress fibers in response to growth factors. Cell. 1992;70:389–99.
91. Worthylake R a., Lemoine S, Watson JM, Burridge K. RhoA is required for monocyte tail retraction during transendothelial migration. J Cell Biol. 2001;154:147–60.
92. Denoyelle C, Albanese P, Uzan G, Hong L, Vannier JP, Soria J, et al. Molecular mechanism of the anti-cancer activity of cerivastatin, an inhibitor of HMG-CoA reductase, on aggressive human breast cancer cells. Cell Signal. 2003;15:327–38.
93. Pillé JY, Denoyelle C, Varet J, Bertrand JR, Soria J, Opolon P, et al. Anti-RhoA and Anti-RhoC siRNAs inhibit the proliferation and invasiveness of MDA-MB-231 breast cancer cells in vitro and in vivo. Mol Ther.
117
2005;11:267–74.
94. Yuan B-Z, Zhou X, Durkin ME, Zimonjic DB, Gumundsdottir K, Eyfjord JE, et al. DLC-1 gene inhibits human breast cancer cell growth and in vivo tumorigenicity. Oncogene. 2003;22:445–50.
95. Durkin ME, Avner MR, Huh CG, Yuan BZ, Thorgeirsson SS, Popescu NC. DLC-1, a Rho GTPase-activating protein with tumor suppressor function, is essential for embryonic development. FEBS Lett. 2005;579:1191–6.
96. Liao YC, Lo SH. Deleted in liver cancer-1 (DLC-1): A tumor suppressor not just for liver. Int J Biochem Cell Biol. 2008;40:843–7.
97. Goodison S, Yuan J, Sloan D, Kim R, Li C, Popescu NC, et al. The RhoGAP Protein DLC-1 Functions as a Metastasis Suppressor in Breast Cancer Cells The RhoGAP Protein DLC-1 Functions as a Metastasis Suppressor in Breast Cancer Cells. 2005;6042–53.
98. Plaumann M, Seitz S, Frege R, Estevez-Schwarz L, Scherneck S. Analysis of DLC-1 expression in human breast cancer. J Cancer Res Clin Oncol. 2003;129:349–54.
99. Sander EE, Ten Klooster JP, Van Delft S, Van Der Kammen R a., Collard JG. Rac downregulates Rho activity: Reciprocal balance between both GTPases determines cellular morphology and migratory behavior. J Cell Biol. 1999;147:1009–21.
100. Michiels F, Habets GG, Stam JC, van der Kammen R a, Collard JG. A role for Rac in Tiam1-induced membrane ruffling and invasion. Nature. 1995. page 338–40.
101. Mertens a. EE, Rygiel TP, Olivo C, Van Der Kammen R, Collard JG. The Rac activator Tiam1 controls tight junction biogenesis in keratinocytes through binding to and activation of the Par polarity complex. J Cell Biol. 2005;170:1029–37.
102. Hordijk PL, ten Klooster JP, van der Kammen R a, Michiels F, Oomen LC, Collard JG. Inhibition of invasion of epithelial cells by Tiam1-Rac signaling. Science. 1997;278:1464–6.
118
103. Adam L, Vadlamudi RK, McCrea P, Kumar R. Tiam1 Overexpression Potentiates Heregulin-induced Lymphoid Enhancer Factor-1/β-Catenin Nuclear Signaling in Breast Cancer Cells by Modulating the Intercellular Stability. J Biol Chem. 2001;276:28443–50.
104. Minard ME, Kim LS, Price JE, Gallick GE. The role of the guanine nucleotide exchange factor Tiam1 in cellular migration, invasion, adhesion and tumor progression. Breast Cancer Res Treat. 2004;84:21–32.
105. Strumane K, Rygiel T, Van Der Valk M, Collard JG. Tiam1-deficiency impairs mammary tumor formation in MMTV-c-neu but not in MMTV-c-myc mice. J Cancer Res Clin Oncol. 2009;135:69–80.
106. Lin EY, Jones JG, Li P, Zhu L, Whitney KD, Muller WJ, et al. Progression to malignancy in the polyoma middle T oncoprotein mouse breast cancer model provides a reliable model for human diseases. Am J Pathol [Internet]. 2003 [cited 2015 Feb 4];163:2113–26. Available from: http://www.sciencedirect.com/science/article/pii/S0002944010635687
107. Fantozzi A, Christofori G. Mouse models of breast cancer metastasis. Breast Cancer Res. 2006;8:212.
108. Maglione JE, Moghanaki D, Young LJT, Manner CK, Ellies LG, Joseph SO, et al. Transgenic Polyoma middle-T mice model premalignant mammary disease. Cancer Res. 2001;61:8298–305.
109. Gillett C, Smith P, Gregory W, Richards M, Millis R, Peters G, et al. Cyclin D1 and Prognosis in Human Breast Cancer. 1996;99:92–9.
110. Lapidus RG, Nass SJ, Davidson NE. The loss of estrogen and progesterone receptor gene expression in human breast cancer. J Mammary Gland Biol Neoplasia. 1998;3:85–94.
111. Guy CT, Cardiff RD, Muller WJ. Induction of mammary tumors by expression of polyomavirus middle T oncogene: a transgenic mouse model for metastatic disease. Mol Cell Biol. 1992;12:954–61.
112. Rodriguez-Viciana P, Collins C, Fried M. Polyoma and SV40 proteins differentially regulate PP2A to activate distinct cellular signaling pathways involved in growth control. Proc Natl Acad Sci U S A [Internet]. 2006 [cited
119
2015 Apr 10];103:19290–5. Available from: http://www.pnas.org/cgi/content/long/103/51/19290
113. Urich M, Senften M, Shaw PE, Ballmer-Hofer K. A role for the small GTPase Rac in polyomavirus middle-T antigen-mediated activation of the serum response element and in cell transformation. Oncogene [Internet]. 1997;14:1235–41. Available from: http://www.ncbi.nlm.nih.gov/pubmed/9121774
114. Kim IS, Baek SH. Mouse models for breast cancer metastasis. Biochem Biophys Res Commun [Internet]. Elsevier Inc.; 2010 [cited 2014 Jul 2];394:443–7. Available from: http://www.ncbi.nlm.nih.gov/pubmed/20230796
115. Forget P, Bentin C, Machiels JP, Berliere M, Coulie PG, De Kock M. Intraoperative use of ketorolac or diclofenac is associated with improved disease-free survival and overall survival in conservative breast cancer surgery. Br J Anaesth. 2014;113:82–7.
116. Hande K. Etoposide: four decades of development of a topoisomerase II inhibitor. Eur J Cancer [Internet]. Elsevier Science Ltd.; 1998 [cited 2014 Jun 25];34:1514–21. Available from: http://linkinghub.elsevier.com/retrieve/pii/S0959804998002287
117. Loike JD, Horwitz SB. Effects of podophyllotoxin and VP-16-213 on microtubule assembly in vitro and nucleoside transport in HeLa cells. Biochemistry [Internet]. 1976 [cited 2014 Jun 25];15:5435–43. Available from: http://pubs.acs.org/doi/abs/10.1021/bi00670a003
118. Trevigen. Table of Contents 96 Well 3D Spheroid BME Cell Invasion Assay [Internet]. Gaithersburg: Trevigen, Inc.; 2012. Available from: http://www.trevigen.com/docs/1354634644.3500-096-k_e10-18-12v0.pdf?guid=1447177437
119. Walker MK, Boberg JR, Walsh MT, Wolf V, Trujillo A, Duke MS, et al. A less stressful alternative to oral gavage for pharmacological and toxicological studies in mice. Toxicol Appl Pharmacol [Internet]. Elsevier Inc.; 2012 [cited 2014 Jun 19];260:65–9. Available from: http://www.pubmedcentral.nih.gov/articlerender.fcgi?artid=3306547&tool=pmcentrez&rendertype=abstract
120
120. Lu J, Steeg PS, Price JE, Krishnamurthy S, Mani S a., Reuben J, et al. Breast cancer metastasis: Challenges and opportunities. Cancer Res. 2009;69:4951–3.
121. Lee YT. Breast carcinoma: pattern of metastasis at autopsy. J Surg Oncol. 1983;23:175–80.
122. Muller WJ, Sinn E, Pattengale PK, Wallace R, Leder P. Single-step induction of mammary adenocarcinoma in transgenic mice bearing the activated c-neu oncogene. Cell. 1988;54:105–15.
123. Hanahan D, Weinberg RA. Hallmarks of cancer: the next generation. Cell [Internet]. 2011 [cited 2014 Jul 9];144:646–74. Available from: http://www.sciencedirect.com/science/article/pii/S0092867411001279
124. Gavura S. What does a new drug cost? Part II: The productivity problem [Internet]. Sci. Med. 2012 [cited 2013 Apr 9]. Available from: http://www.sciencebasedmedicine.org/index.php/what-does-a-new-drug-cost-part-ii-the-productivity-problem/