The Effects of Manganese-Reducing Bacteria on Desorption of Manganese from MnOx(s) Coated Media
Lindsay Ellen Swain
Thesis submitted to the faculty of the Virginia Polytechnic Institute and State University in partial fulfillment of the requirements for the degree of
Master of Science
In
Civil Engineering
William R. Knocke
Joseph O. Falkinham, III
Amy J. Pruden
May 4, 2016
Blacksburg, Virginia
Keywords:���
manganese, manganese-reducing bacteria, desorption, in vitro reduction
The Effects of Manganese-Reducing Bacteria on Desorption of Manganese from MnOx(s) Coated Media
Lindsay Ellen Swain
ABSTRACT
In the past, water treatment plants have stopped the application of pre-filter oxidants to create a bioactive filtration process to remove soluble Mn. After the cessation of pre-filter oxidants, a Mn desorption phenomenon was seen where effluent Mn exceeds influent Mn concentrations. The reason for the sudden increase in effluent Mn was not known, but it was hypothesized that Mn-reducing bacteria on the filter media play a substantial role in this phenomenon. The primary goal of this research was to assess the role of Mn-reducing microorganisms in the desorption of MnOx(s) from coated filters once pre-filtration chlorine ceased. A secondary objective included the development of a molecular detection method for Mn-reducing microorganisms in laboratory and environmental samples. Bench-scale filter column studies were completed to investigate the impacts of Mn-reducing microbial populations on desorption of Mn from MnOx(s) coatings. Secondarily, the effects of influent carbon loading and MnOx(s) age on Mn desorption were investigated. In situ vial assays were created to gain insight into the impacts of MnOx(s) age on Mn reducing microorganism bioavailability. Lastly, a qPCR detection method was developed that targeted the mtrB gene. Results determined that microbially mediated Mn desorption was possible when sufficient numbers of Mn-reducing microorganisms were present on the MnOx(s)
surface and that those organisms contributed to the Mn desorption phenomenon. qPCR detection methods were able to show a greater number of Mn-reducing microorganisms in studies where Mn desorption was observed. Lastly, MnOx(s) age was shown to play an important, but unexplained, role in bioavailability.
iv
The Effects of Manganese-Reducing Bacteria on Desorption of Manganese from MnOx(s) Coated Media
Lindsay Ellen Swain
GENERAL AUDIENCE ABSTRACT
Previously, drinking water plants have stopped adding chemical oxidants before the filtration process in order to grow a population of microorganisms to remove Mn from the water. After the chemical oxidants were removed, a phenomenon was observed in certain water plants where the amount of Mn exiting was greater than the amount of Mn entering the plant. The reason for this phenomenon was not known, but it is thought that bacteria that are able to biologically reduce Mn play an important role. The main purpose of this research was to investigate the role of Mn-reducing bacteria in the observed increase of Mn released into the effluent. A second purpose for this research was to develop a method to detect the DNA of Mn-reducing bacteria in environmental and laboratory samples on a molecular level. Laboratory filtration columns were completed to research the effects of Mn-reducing bacteria, carbon content and filter media age on the release of Mn from the filtration media. Results showed that when a sufficient population of Mn-reducing bacteria was present, Mn released from the filter increased. Detection of Mn-reducing bacterial DNA was able to confirm these observations. The age of the filtration media was also shown to have an important but not well-understood effect on the amount of Mn released from the filter. This research is applicable to water treatment professionals that no longer desire to use chemical oxidants for drinking water treatment but need to maintain Mn removal capacity.
iv
Dedicated to my daughter, Madison Swain.
You are my strength, my constant inspiration and my world.
v
ACKNOWLEDGEMENTS
As Helen Keller once stated, “Alone we can do so little; together we can do so much.”
Research is best done in collaboration with others and I most certainly could not have completed
this research project single-handedly. Consequently, there are numerous people I would like to
thank for their expertise, time and effort. I would like to express sincere gratitude to my chair
adviser Dr. Knocke whose knowledge, patience and guidance along the often winding and
branched path of research was truly invaluable. I would like to thank Dr. Falkinham for letting
me talk through my experimental ideas and providing me a laboratory workspace, which was
always kept at California comfortable temperatures. Thank you to Dr. Pruden who provided a
truly enjoyable graduate teaching experience and offered valuable insights into the complicated
world of biotechnology.
I would also like to thank the following people and organizations: Dr. Parks who was so
accommodating when it came to use of the ICP-MS and for taking column samples for me when
I could not be on campus; Dr. Nealson for the cultures of S. oneidensis, Dr. Melville who was
gracious enough to let me use his anaerobic chamber and his graduate students who took the time
to train me on how to use it; Julie Petruska for many laughs and help in all things laboratory;
Jody Smiley for her help in troubleshooting the ICP when I would break it and help with TOC
analysis; Myra Williams for help and guidance around the microbiology lab; Anurag Marantha
for shake flask sampling when I was out of state interviewing for jobs; Dr. D’Imperio for his
assistance and expertise in completing the mtrB gene alignment and qPCR primer design; Dr.
Walke for letting me constantly borrow DNA extraction equipment that saved me an enormous
amount of time; Dr. Hochella for his direction on manganese aging and bioavailability; Randy
Hawkins and the Harwood Mills WTP for providing several rounds of media samples and Excel
sheets full of WTP plant data and lastly Beth Lucas for all of her administrative help.
Last but not least, I want to say thank you to all of my friends and family who have
supported me through my graduate school journey. To everyone who has provided words of
encouragement or watched my daughter so that I could study, maintain my columns or write my
thesis, I could never have finished this journey with out your help. Finally, to my husband and
daughter, your love and support have made it all worthwhile.
vi
TABLE OF CONTENTS
Abstract ......................................................................................................................................... iv
General audience Abstract ........................................................................................................... v
Acknowledgements ........................................................................................................................ v
Table of Contents .......................................................................................................................... vi
Table of Figures ............................................................................................................................ ix
Table of Tables ............................................................................................................................ xii
List of Abbreviations ................................................................................................................. xiii
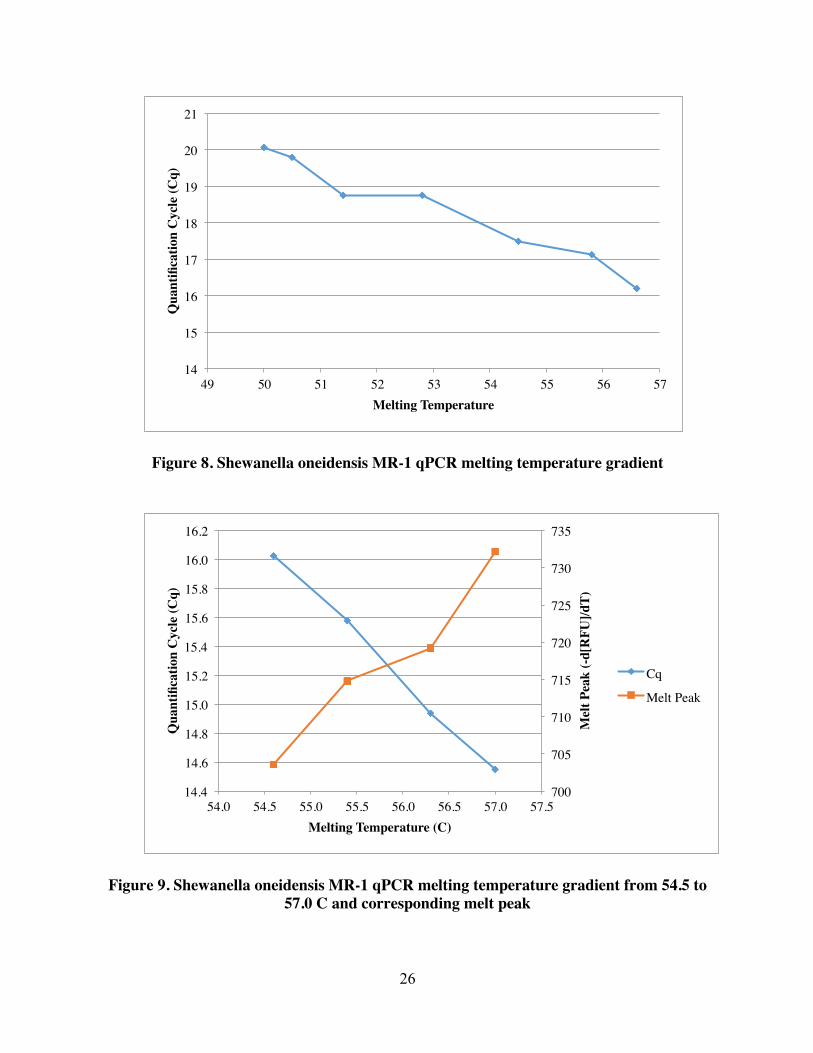
3.3 Molecular Methods Development for S. oneidensis MR-1 .......................................... 24 3.3.1 DNA Extraction ......................................................................................................... 24 3.3.2 qPCR Primers for the Detection of S. oneidensis MR-1 ........................................... 24 3.3.3 qPCR Temperature Gradient for S. oneidensis MR-1 ............................................... 25 3.3.4 S. oneidensis MR-1 Standard Curve for Absolute Quantification ............................ 27
3.4 Molecular Methods Development for Detection of the mtrB Gene ............................ 29 3.4.1 Sequence Selection .................................................................................................... 29 3.4.2 MUSCLE Gene Alignment ....................................................................................... 30 3.4.3 DNA Extraction for mtrB Primer Testing ................................................................. 31 3.4.4 Temperature Gradient ................................................................................................ 31 3.4.5 DNA Normalization .................................................................................................. 33
3.5 Shake Flask Study .......................................................................................................... 34 3.5.1 Media Preparation ..................................................................................................... 34 3.5.2 S. oneidensis MR-1 Inoculation ................................................................................ 34 3.5.3 Experimental Setup and Sampling ............................................................................ 35 3.5.4 Anthracite Media Extraction ..................................................................................... 35
4.0 Experimental Results ......................................................................................................... 36 4.1 Bench-Scale Column Performance of Coated Sand Media ........................................ 36
4.1.1 Mn Break Through During Chlorine Discontinuation of 5-day MnOx(s) Coated Virgin Sand Media ................................................................................................................ 36 4.1.2 Mn Break Through During Chlorine Discontinuation of 15-day MnOx(s) Coated Sand Media 37 4.1.3 Comparison of Mn Breakthrough for the 5-day and 15-day MnOx(s) Coated Virgin Sand Media Columns (0.2 mg/L Influent Mn) ...................................................................... 39
4.2 Bench-Scale Filter Column Performance of May 2015 Harwood Mills Anthracite Media at Different Influent pH Values .................................................................................. 40
4.2.1 Mn Break Through During Chlorine Discontinuation of Influent pH 6.3 – 6.6 (Column A) ............................................................................................................................ 40 4.2.2 Mn Breakthrough During Chlorine Discontinuation of Influent pH 7.0 – 7.3 (Column B) ............................................................................................................................ 42 4.2.3 Comparison of Manganese Break Through During Chlorine Discontinuation of Influent pH 6.3- 6.6 (Column A) and 7.0 – 7.3 (Column B) ................................................. 43
4.3 Bench-Scale Filter column Performance of March 2016 Harwood Mills Anthracite Media Inoculated with Mn Reducers .................................................................................... 45
4.3.1 S. oneidensis MR-1 Inoculum Experiment ................................................................ 45 4.3.2 MB4 and MB6 Inoculum Experiment ....................................................................... 51
7.0 Works Cited ........................................................................................................................ 84
8.0 Appendix A .......................................................................................................................... 88
ix
TABLE OF FIGURES
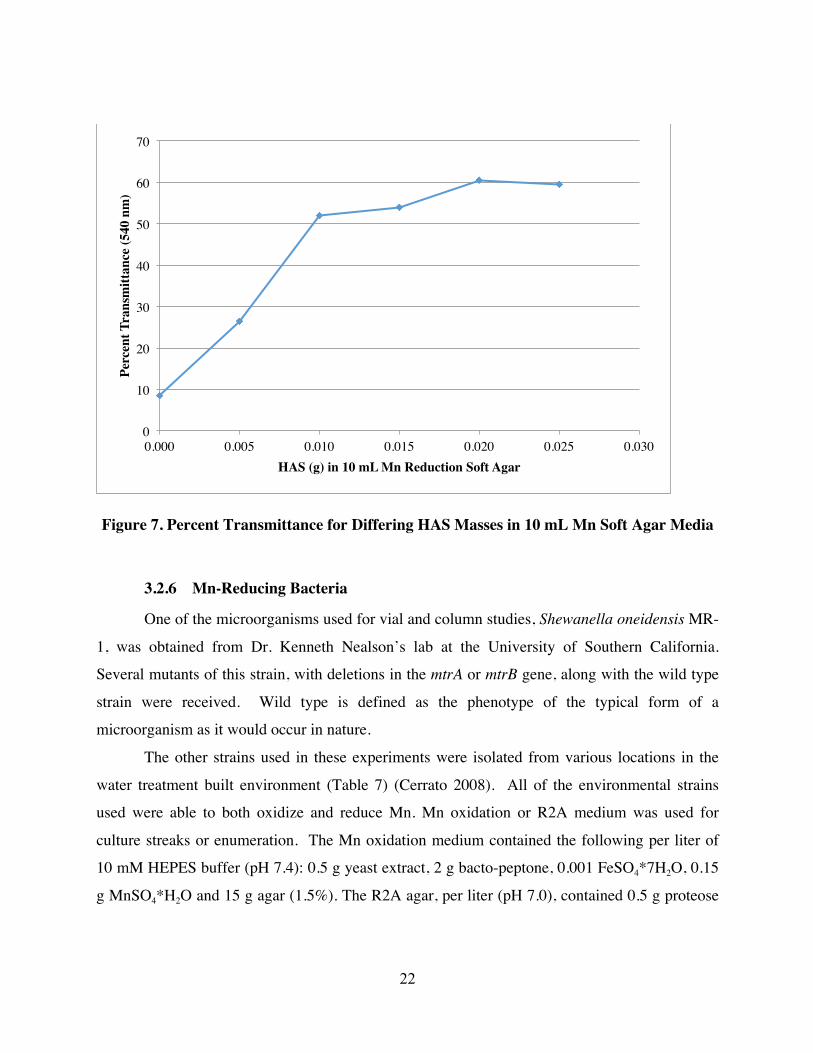
Figure 1. Proteins and mechanisms necessary in the S. oneidensis MR-1 electron transport chain for Mn Reduction (Szeinbaum 2014) .............................................................................................. 6 Figure 2. Raw and filter effluent Mn concentrations at the AWC Stamford plant before and after the cessation of pre-filter free chlorine (Tobiason 2008) ................................................................ 7 Figure 3. Schematic of Bench-Scale Column Experimental Layout without the sodium acetate feed (Hinds 2015) .......................................................................................................................... 10 Figure 4. Image of uneven (A-D) and even (E-H) distribution and aggregation of several MnOx(s)
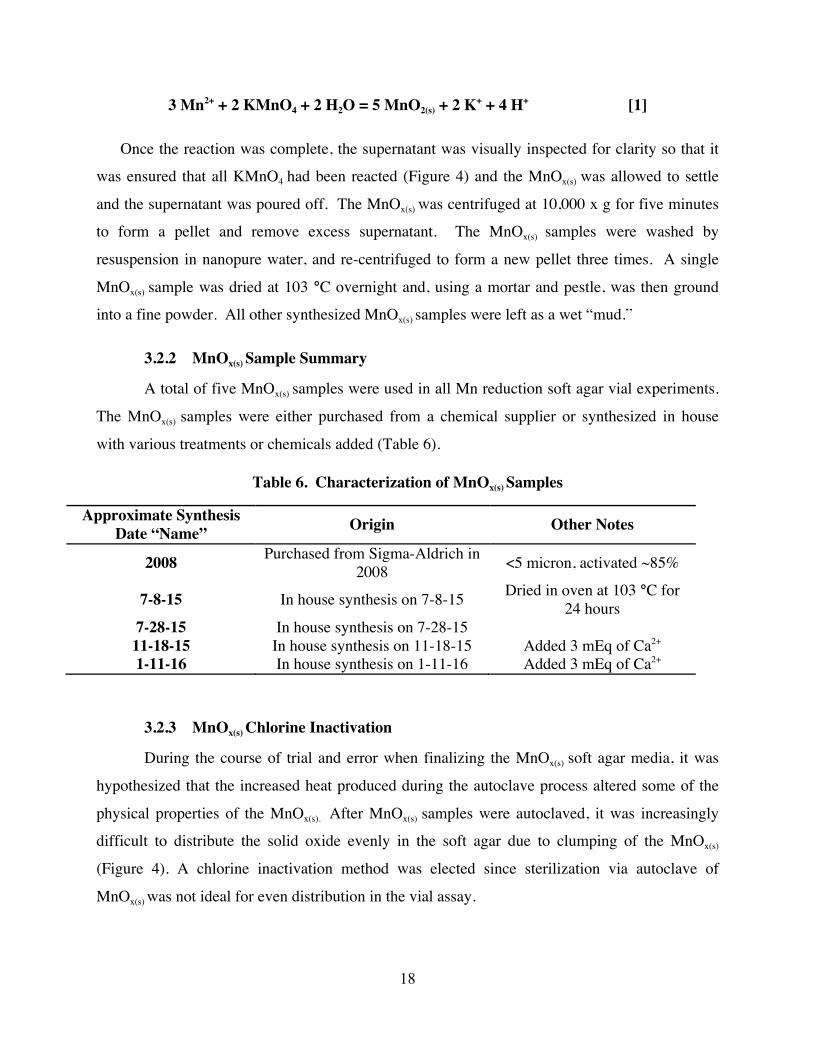
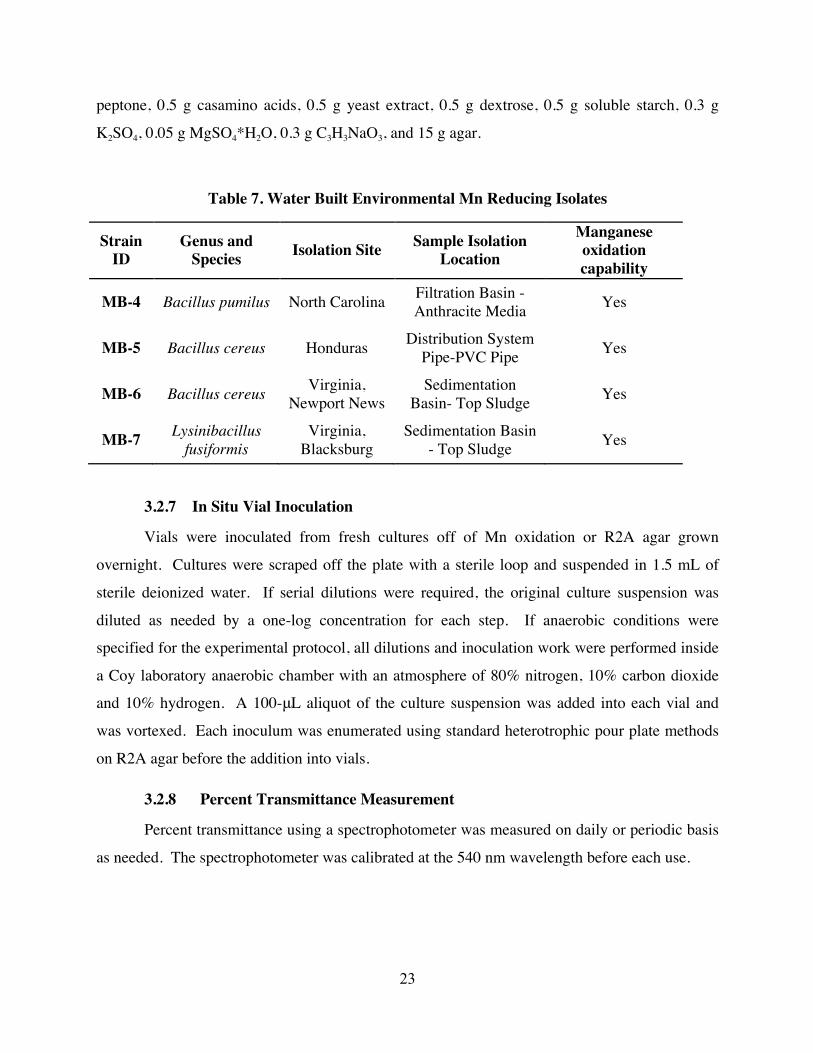
samples after autoclaving (A-D) and chlorine inactivation (E-H) ................................................ 19 Figure 5. Percent transmittance of 2008 MnOx(s) sample as a function of MnOx(s) concentration added .............................................................................................................................................. 20 Figure 6. Visual inspection of varying concentrations (g/L) of the 2008 MnOx(s) sample ............. 21 Figure 7. Percent Transmittance for Differing HAS Masses in 10 mL Mn Soft Agar Media ...... 22 Figure 8. Shewanella oneidensis MR-1 qPCR melting temperature gradient ............................... 26 Figure 9. Shewanella oneidensis MR-1 qPCR melting temperature gradient from 54.5 to 57.0 C and corresponding melt peak ......................................................................................................... 26 Figure 10. qPCR amplification RFU and quantification cycle data for standard curve samples of S. oneidensis MR-1 ........................................................................................................................ 28 Figure 11. qPCR Standard curve of S. oneidensis MR-1 correlating plate enumeration counts (cfu/mL) to quantification cycle (Cq) ............................................................................................ 29 Figure 12. Environmental isolates qPCR melting temperature gradient for 50.0 to 58.0 C for the mtrB primer set .............................................................................................................................. 32 Figure 13. Environmental isolates and S. oneidensis MR-1 qPCR melting temperature gradient for 52.0 to 48.0 °C for the mtrB primer set ................................................................................... 32 Figure 14. Environmental isolates and S. oneidensis MR-1 qPCR quantification cycle for the mtrB primer set at a 50 °C melting temperature when loaded DNA is normalized to 5-10 ng/μL ....................................................................................................................................................... 33 Figure 15. Percentage manganese removal before and after the discontinuation of chlorine of the 5 day MnOx(s) coated sand filter .................................................................................................... 37 Figure 16. Percentage manganese and aluminum removal before and after the discontinuation of chlorine of the 15-day MnOx(s) coated filter .................................................................................. 38 Figure 17. Comparison of the percentage manganese removal (0.2 mg/L influent concentration) after the discontinuation of chlorine of the 5-day and 15-day MnOx(s) coated filters ................... 39 Figure 18. Percentage of manganese through media depth in column A with an influent pH of 6.3 – 6.6 ............................................................................................................................................... 41 Figure 19. Percentage of manganese through media depth in column B with an influent pH of 7.0 – 7.3 ............................................................................................................................................... 43 Figure 20. Comparison of percentage manganese through media depth in columns A and B . 44 Figure 21. Percentage of Mn through the media depth for column A (S. oneidensis MR-1) and B (no inoculum); Dashed line indicates an increase in influent TOC from 0.5 mg/L to 12 mg/L ... 46
x
Figure 22. Comparative quantification cycle number for the top, middle and top two inch depths of Column A (S. oneidensis MR-1 inoculated) and Column B (non-inoculated) for microorganisms that contain the mtrB gene .................................................................................. 49 Figure 23. S. oneidensis MR-1 concentration in the top, middle and top two inch depths of Column A (S. oneidensis MR-1 inoculated) and Column B (non-inoculated) .............................. 49 Figure 24. Average concentration of extractable Mn (mg) per gram of anthracite media from Column A (inoculated with S. oneidensis MR-1) and Column B (non-inoculated) ..................... 50 Figure 25. Percentage of Mn through the media depth for column A (MB4 and MB6 inoculated) and B (no inoculum); Dashed line indicates an increase in influent TOC from 0.5 mg/L to 12 mg/L .............................................................................................................................................. 51 Figure 26. Comparative quantification cycle number for the top, middle and top two inch depths of Column A (MB4 and MB6 inoculated) and Column B (non-inoculated) for microorganisms that contain the mtrB gene ............................................................................................................. 53 Figure 27. Average concentration of extractable Mn (mg) per gram of anthracite media from Column A (inoculated with MB4 and MB6) and Column B (non-inoculated) ............................. 54 Figure 28. Visual inspection of Mn reduction anaerobic vial assay results from differing concentrations of S. oneidensis MR-1 inoculum after 7 days of incubation ................................. 55 Figure 29. Correlation of S. oneidensis MR-1 inoculum concentration to percent light transmittance at 540 nm in the Mn vial assay after 7 days of incubation ..................................... 56 Figure 30. Percent light transmittance in anaerobic vial assay for MB4 based on inoculum concentration (CFU) ...................................................................................................................... 57 Figure 31. Percent light transmittance in anaerobic vial assay for MB5 based on inoculum concentration (CFU) ...................................................................................................................... 58 Figure 32. Percent light transmittance in anaerobic vial assay for MB6 based on inoculum concentration (CFU) ...................................................................................................................... 59 Figure 33. Percent light transmittance in vial assay for MB7 based on inoculum concentration (CFU) ............................................................................................................................................. 60 Figure 34. Percent light transmittance in anaerobic vial assay for S. oneidensis MR-1 based on inoculum concentration (CFU) ...................................................................................................... 61 Figure 35. Percent light transmittance in aerobic vial assay for inoculated Mn reducing bacteria ....................................................................................................................................................... 62 Figure 36. Percent transmittance at 540 nm of different MnOx(s) samples over time with S. oneidensis inoculum ...................................................................................................................... 64 Figure 37. Percent transmittance data normalized to 1 g/L of different MnOx(s) samples over time with S. oneidensis inoculum .......................................................................................................... 65 Figure 38. Percent transmittance negative control data normalized to 1 g/L of different MnOx(s)
samples .......................................................................................................................................... 65 Figure 39. Average S. oneidensis MR-1 count (CFU/mL) of triplicate vials via qPCR analysis . 66 Figure 40. Percent transmittance at 540 nm of different MnOx(s) samples over time with MB4 inoculum ........................................................................................................................................ 68 Figure 41. Percent transmittance data normalized to 1 g/L of different MnOx(s) samples over time with MB4 inoculum ....................................................................................................................... 68
xi
Figure 42. Percent transmittance at 540 nm of different MnOx(s) samples over time with MB6 inoculum ........................................................................................................................................ 69 Figure 43. Percent transmittance data normalized to 1 g/L of different MnOx(s) samples over time with MB6 inoculum ............................................................................................................... 70 Figure 44. Visual inspection of clearing zones at the top of the Mn reduction vials ................... 71 Figure 45. Soluble Mn mass release (sized 0.45 μm or less) as a fraction of Harwood Mills WTP accumulated Mn anthracite coating ............................................................................................... 72 Figure 46. Alignment Sequences for the mtrB gene qPCR primers .............................................. 88
xii
TABLE OF TABLES
Table 1. Combined Feed Characteristic Ranges for Column Influent .......................................... 12 Table 2. FilterSil 0.50 Virgin Filter Sand Characteristics ............................................................. 14 Table 3. Experimental Conditions for Coated Virgin Sand Media Experiment ............................ 14 Table 4. Experimental Conditions for Harwood Mills Anthracite Media Experiment ................. 15 Table 5. Experimental Conditions for Harwood Mills Anthracite Media Experiment ................. 16 Table 6. Characterization of MnOx(s) Samples .............................................................................. 18 Table 7. Water Built Environmental Mn Reducing Isolates ......................................................... 23 Table 8. S. oneidensis MR-1 Forward and Reverse qPCR Primers .............................................. 25 Table 9. S. oneidensis MR-1 qPCR Mastermix Components ....................................................... 25 Table 10. S. oneidensis MR-1 qPCR Program .............................................................................. 27 Table 11. S. oneidensis MR-1 Melt Curve qPCR Program ........................................................... 27 Table 12. Descriptions of Selected Protein Sequences for MtrB MUSCLE Alignment ............... 30 Table 13. mtrB Forward and Reverse qPCR Primers .................................................................... 30 Table 14. S. mtrB qPCR Program .................................................................................................. 33 Table 15. Shake Flask Components and Conditions ..................................................................... 34 Table 16. Manganese Reducing Bacteria Vial Inoculum Count ................................................... 62 Table 17. Maximum Light Transmittance for Anaerobic and Aerobic Mn Reduction Vial Assays ....................................................................................................................................................... 63 Table 18. Inoculum Concentrations for Shake Flask Study .......................................................... 72
xiii
LIST OF ABBREVIATIONS
BDOC Biodegradable Dissolved Organic Carbon
C Carbon
CFU Colony Forming Unit
Cq Quantification Cycle
DOC Dissolved Organic Carbon
EPA Environmental Protection Agency
gpm Gallons Per Minute
HAS Hydroxylamine Sulfate
ICP-MS Inductively Coupled Plasma Mass Spectroscopy
ID Inner Diameter
MCL Maximum Contaminant Level
Mn Manganese
NOM Natural Organic Matter
PCR Polymerase Chain Reaction
POC Particulate Organic Carbon
ppm Parts Per Million
qPCR Quantitative Polymerase Chain Reaction
WTP Water Treatment Plant
1
1.0 INTRODUCTION
Excess manganese (Mn) exposure in drinking water has been linked to a variety of health
problems including impaired neurological development and neural tube defects in fetuses
(Haynes 2015). Therefore, adequate removal of Mn to a concentration of 0.05 mg/L (EPA 1979)
is often accomplished through conventional oxidation and filtration methods during the water
treatment process. Often, water treatment plants (WTP) will desire to make their filtration
process biologically active as to allow Mn oxidation from active site adsorption and naturally
occurring microbial population of manganese oxidizing bacteria that live on the MnOx(s) surface
(Hoyland 2014). Microbially mediated and surface catalyzed Mn oxidation becomes the primary
method for Mn removal when the application of a pre-filter oxidant such as chlorine is stopped.
The decline in chlorine usage results in a cost savings as well as a decrease in generated
disinfection by-products (Womba 2000).
For various WTPs, when pre-filter free chlorine is removed, Mn will actually desorb
from the MnOx(s) surface so that effluent Mn will exceed influent Mn concentrations for a certain
period of time (Gabelich 2006). After that time, effluent Mn levels typically decrease below
influent levels and reach a steady state for Mn release. The increase in effluent Mn is of concern
to WTP due to the aesthetic and health effects of Mn detailed above. The Mn desorption
phenomenon has not been widely observed, documented or studied. Mechanisms thought to
cause or contribute to the Mn desorption phenomenon are biologically mediated reduction (Islam
2010), reduction catalyzed by contact with organic matter (Lovley 1988) or an unknown
chemical mechanism (Gabelich 2006).
The goal of this research was to assess the role of Mn reducing microorganisms in
desorption of MnOx(s) coated filters after free-filter chlorination had ceased. The main objectives
of this research were:
1. Attempt to quantify what proportion of Mn desorption from the laboratory filter
columns is attributed to Mn-reducing microorganism activity
2. Develop a molecular probe for the detection and quantification of Mn-reducing
microorganisms
2
3. Determine a method to eliminate or greatly reduce Mn desorption from MnOx(s)
coated media by inhibiting or inactivating Mn-reducing microorganisms present
on bench-scale filters
4. Extrapolate the method for eliminating or decreasing Mn desorption to find
operational modifications that are applicable and practical for full scale treatment
plants
3
2.0 LITERATURE REVIEW
2.1 Manganese Background
Manganese (Mn) is a transition metal that is used in countless biological systems and
industrial applications. Mn is a required trace metal in biological organisms that helps in
processes such as the production of enzyme cofactors that aid in detoxification of superoxide free
radicals and in photosynthesis for plant species (Costa 2015). In natural systems, Mn is a large
component of sediments and soils and is found primarily in three oxidation states: Mn(II),
Mn(III) and Mn(IV). Insoluble Mn(IV) can be reduced into the soluble form, Mn(II), either
chemically (abiotic) or by microbially mediated (biotic) reduction (Burdige 1993).
2.2 Health and Aesthetic Concerns Associated with Manganese
Health and aesthetic concerns are the two main reasons why Mn removal during the
water treatment process is important. It is well known that Mn is critical to many essential
biological processes necessary for life such as growth, development, oxidative defense and
enzymatic activity (Costa 2015). Paradoxically, exposure of too much Mn can lead to a variety
of health problems and neurological diseases. Excessive acute or long-term Mn exposure has
been linked to impaired neurological development, the early onset of puberty in females and
neural tube defects in fetuses (Haynes 2015). The EPA has established a Secondary Maximum
Contaminant Level (SMCL) of 0.05 mg/L Mn (EPA 1979).
The inclusion of excess reduced Mn in water traveling through the distribution system
into a consumer’s home can also cause aesthetic concerns. Mn is oxidized through the addition
of an oxidizing agent such as chlorine bleach and during water transmission to the consumer’s
home (Cerrato 2006). Upon entering the consumer’s home, water that contains oxidized Mn
would have a black-brown color, which often leads to water discoloration complaints (Sly 1990).
Excess Mn in consumer’s drinking water can also cause an undesirable metallic taste (Sain
2014).
2.3 Biogeochemical Cycling
Mn reduction in sediments, defined as the conversion of Mn(IV) to Mn(II), has been
shown to be both chemically and microbially mediated in natural systems. Mn oxides found in
sediments are most often referred to as MnOx(s) as to generalize the average oxidation state,
4
between Mn(II) and Mn(IV), in which it is usually found (Burdige 1993). Mn oxides in
sediments are considered to be mostly amorphous in nature and are found in close proximity to
iron oxides. Many times these compounds are complexed with other cations and have formed
crystalline lattices. Mn(III) is generally assumed to be present, but is thermodynamically
unstable and is, therefore, a temporary intermediate in the Mn reduction pathway (Lin 2012).
Mn reduction reactions lead to water gradients across the redox boundary where the
reduced form is found. This leads to an upward diffusion of reduced Mn where it is ultimately
re-oxidized (Madison 2012). The newly formed Mn oxides settle and contribute to the cycle of
burial and reduction in the redox cycle. In steady-state conditions and under low turbulence, this
leads to a well-defined fixed zone of solid Mn just above the redox boundary (Burdige 1993).
For a compound, such as MnOx(s), to be able to be utilized through a redox reaction, the
electron acceptor must have an appropriate redox potential (Johnson 2006). The electron
potential must be low enough to not be toxic but high enough to be energetically favorable. The
redox potential of Mn (IV), characterized as the change in Gibbs free energy, is just below the
reaction for denitrification (NO2- to N2) and above sulfate reduction (HSO3
- to HS-). In bodies of
water that contain stratified reduction zones, the order of preferential redox reactions is
maintained. Denitrification occurred above Mn reduction zones, where sulfate reduction
occurred below (Burnes 2000).
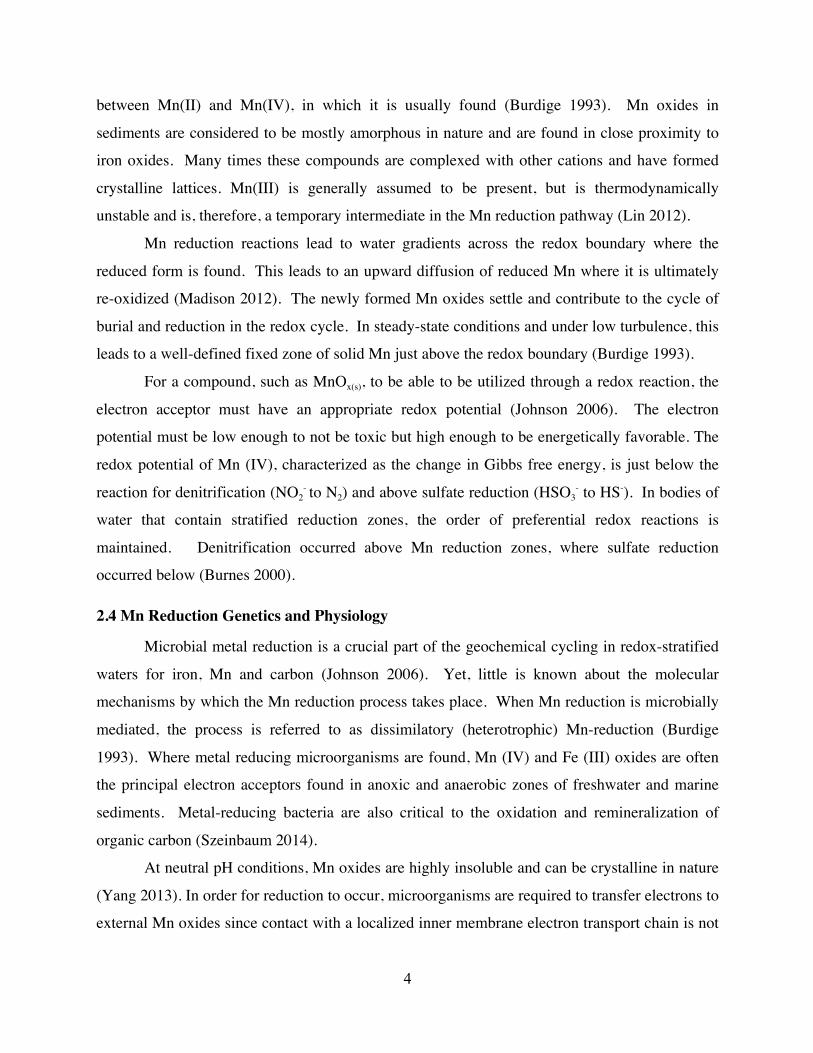
2.4 Mn Reduction Genetics and Physiology
Microbial metal reduction is a crucial part of the geochemical cycling in redox-stratified
waters for iron, Mn and carbon (Johnson 2006). Yet, little is known about the molecular
mechanisms by which the Mn reduction process takes place. When Mn reduction is microbially
mediated, the process is referred to as dissimilatory (heterotrophic) Mn-reduction (Burdige
1993). Where metal reducing microorganisms are found, Mn (IV) and Fe (III) oxides are often
the principal electron acceptors found in anoxic and anaerobic zones of freshwater and marine
sediments. Metal-reducing bacteria are also critical to the oxidation and remineralization of
organic carbon (Szeinbaum 2014).
At neutral pH conditions, Mn oxides are highly insoluble and can be crystalline in nature
(Yang 2013). In order for reduction to occur, microorganisms are required to transfer electrons to
external Mn oxides since contact with a localized inner membrane electron transport chain is not
5
possible (Lovley 2004). There have been three novel respiratory mechanisms identified in metal
reducing bacteria to which electrons are transferred to Mn oxides. Those mechanisms have been
identified as direct enzymatic reduction via metal reducing c-type cytochromes on the cell
surface, reductive oxide solubilization with electron transfer from metal-organic ligands and a
two-step indirect enzymatic reduction by endogenous or exogenous electron shuttles (Szeinbaum
2014). It is generally accepted that Mn(IV) reduction occurs directly at the outer membrane via
single two-electron successive transfers, resulting in Mn(II) as the final product (Thamdrup
2000). The first electron transfer forms soluble Mn(III) as a temporary intermediate before a
final electron transfer and reduction to Mn(II). The first electron transfer step increases the
bioavailability of Mn by reductive solubilization while the second step is coupled to the
production of inorganic carbon (Lin 2012).
In a majority of the peer-reviewed published studies regarding microbially mediated Mn
reduction, Shewanella species have been used as the model organism. This is because
Shewanella is easily grown and studied under laboratory conditions (Szeinbaum 2014).
Shewanella is able to use a wide variety of electron acceptors, including the capacity to transfer
electrons to many solid metal oxide compounds (Osterman 2008).
The electron transport chain of S. oneidensis, shown in Figure 1, is made up of many
different types of interacting proteins and allows the utilization of extracellular electron
acceptors for Mn reduction (Szeinbaum 2014). The main outer membrane protein complex is
MtrCBA, which is an electron channel that allows the passage of electrons to extracellular metal
hydroxide complexes (Burnes 2000). MtrCBA is mainly associated with the reduction of
Mn(IV) but not Mn(III). Inside the cell, dehydrogenases oxidize electron donors, pump protons
to the periplasmic space and then transfer electrons to the menaquinone. The reduced
menaquinone then transfers electrons to a c-type cytochrome CymA. CymA transfers electrons
to the periplasmic c-type cytochrome MtrA. An outer membrane β-barrel protein, MtrB, allows
interaction and electron transfer between MtrA and MtrC. The type II protein secretion system
produces MtrC and c-type cytochrome OmcA, which is associated with the reduction of Mn(III)
(Szeinbaum 2014). Type II secretion systems are responsible for the translocation of proteins to
the outer membrane which is essential for microorganisms that reduce insoluble metal complexes
(Ross 2009). It has been shown that MtrB and GspD, an outer membrane porin, as well as the
terminal reductase MtrC and OmcA are required for Mn(IV) and Mn(III) reduction (Lin 2012).
6
Figure 1. Proteins and mechanisms necessary in the S. oneidensis MR-1 electron transport chain for Mn Reduction (Szeinbaum 2014)
2.5 Mn Removal Through Filtration
One of the more common methods of dissolved Mn removal in water treatment facilities
is through chemical oxidation and active site adsorption onto filtration media (Tobiason 2008).
Oxidants such as free chlorine or potassium permanganate are added prior to filtration, which
drives the oxidation of soluble Mn (II) into an insoluble amorphous MnOx(s) form (Carlson 1999).
Through the chemical oxidation process, the filtration media physically removes insoluble Mn.
Once an MnOx(s) coating begins to form on the filtration media from chemical oxidation, Mn
adsorption onto active sites is able to occur. MnOx(s) strongly absorbs to Mn(II) so that reduced
Mn from the filtration influent adsorbs to the oxidant formed Mn oxide coating (Knocke 1991,
Carlson 1999). This process has been referred to as the natural greensand effect and is a self-
regenerating process that removes additional Mn (Bierlein 2012).
7
2.6 Mn Desorption Phenomenon
In some water treatment plants where adsorption of soluble Mn to oxide coated filtration
media is the main method utilized for Mn removal, Mn desorption phenomenons have been
observed when pre-filter free chlorination is stopped (Islam 2010). In these cases, the effluent
Mn can exceed influent concentrations for extended periods of time after chlorine application
ceases (Gabelich 2006). This desorption phenomenon has been documented at the Aquarion
Water Company (AWC) Stamford WTP (Stamford, CT) (Tobiason 2008) and at the Henry J.
in an attempt to create a biologically active filtration process. Figure 2 demonstrates effluent Mn
levels exceeding influent concentrations at the Stamford WTP for several months until chlorine
was reapplied to the filters. The desorption phenomenon was also observed in a laboratory
setting using filtration media from the AWC Lantern Hill WTP (Stonington, CT). Investigations
into the origin of additional released Mn seen in filter effluent waters indicated Mn release was
due to desorption primarily from anthracite filtration media (Islam 2010).
Figure 2. Raw and filter effluent Mn concentrations at the AWC Stamford plant before and after the cessation of pre-filter free chlorine (Tobiason 2008)
8
Mn desorption has been documented in relatively few water treatment facilities and,
therefore, minimal research to investigate the cause for this phenomenon has been completed. In
general, there are three main hypotheses as to the cause of Mn desorption. These hypotheses
included: (1) biologically mediated reduction (Islam 2010), (2) reduction through contact with
organic matter (Lovley 1988) and (3) other undefined chemical reduction mechanisms (Gabelich
2006). In a study using media from the Henry J. Mills WTP, biologically mediated Mn
desorption was discounted as a likely reason for elevated concentrations of effluent Mn
(Gabelich 2006).
Islam et, al. completed a study with Lantern Hill WTP anthracite filtration media, using
16s rRNA to evaluate the types and abundance of microorganisms present on greensand media.
On the Lantern Hill media, approximately 45% of the total microbial population had the ability
to utilize MnO2(s) as their terminal electron acceptor. Mn-reducing microbes were also found in
the Lantern Hill WTP source ground water based off of 16s DNA analysis, but at less than half
of the numbers seen on the greensand media. From this study, results indicated that Mn-
reducing microbes accumulated on the oxide coating of the filtration media and remained
present, even during the application of pre-filtration free chlorine. Researchers from this study
hypothesized that Mn-reducing populations increased in activity and number in the absence of
free chlorine. To further support this hypothesis, results from these experiments demonstrated
that the population of Mn reducing microbes decreased on the Lantern Hill WTP greensand
media by 40% when pre-filtration chlorine resumed. This study concluded that biological
activity was a likely contributor for Mn desorption seen at the Lantern Hill WTP and in
laboratory studies (Islam 2010).
9
3.0 EXPERIMENTAL METHODS AND MATERIALS
In the context of ion exchange systems, breakthrough is typically defined as the amount
of a substance that passes through a system when media exhaustion has occurred. Breakthrough
occurs in Mn-coated media when active sites have adsorbed as much soluble Mn as possible. In
the context of this research, Mn release will be defined as actual desorption off of the MnOx(s)
surface, which is then passed through the system. Because the MnOx(s) surface, in many of the
column studies completed for this research will be experiencing both breakthrough and release
simultaneously, the term breakthrough will be mostly used through this document to describe
both processes during the explanation and discussion of results.
3.1 Bench-Scale Filter Column Experiments
Bench-scale filter columns were set up to produce Mn breakthrough curves as well as
replicate manganese removal and desorption trends intermittently seen in full-scale water
treatment plants (Figure 3).
3.1.1 General Filter Column Setup
Two glass columns of 7/16 inch ID were used for this experiment. Preceding the
experiment, columns were cleaned with a mixture containing 10 g/L of a strong reducing agent,
hydroxylamine sulfate (HAS), to remove any accumulations of MnOx(s). Columns were then
triple rinsed with deionized water prior to use. Using a burette clamp, the columns were secured
onto a metal rod stand. A ½ x ¼ inch plastic coupling was inserted into a ½ inch ID piece of
plastic tubing approximately 2 inches in length, followed by a small piece of glass wool to keep
the media in the column. To direct the effluent flow, ¼ inch ID plastic tubing was attached to
the other side of the coupling and directed into a funnel. The effluent tubing was attached to a
separate metal rod at a height above the media depth to maintain a positive hydraulic head.
Effluent flow from the funnel was discharged into a sink.
10
Figure 3. Schematic of Bench-Scale Column Experimental Layout without the sodium acetate feed (Hinds 2015)
Two peristaltic pumps were used to supply the main influent components to the columns.
The hydraulic loading rate (HLR) for each of the columns was 4 gpm/ft2. The total flow (16
mL/min) for each column was split between two influent feed solutions to equal the desired
HLR. The main influent feed solution containing soluble Mn, aluminum, and alkalinity was
11
pumped into the column at a rate of 13 mL/min. The second influent solution contained either
alkalinity and chlorine, or alkalinity only (when chlorine application ceased) and was fed at a
rate of 3 mL/min. If needed, according to experimental setup, a third pump calibrated to a flow
of 1 mL/min was used for the addition of sodium acetate when the columns were inoculated with
Mn-reducing microorganisms. The pumps were calibrated to the desired flow before the start of
each experiment. All columns and peristaltic pumps were placed inside a plastic tub for security
against accidental overflow.
Influent flow solutions were drawn from the plastic reservoirs and delivered to the
column through ¼ inch ID plastic tubing. The flows were then combined using a plastic tee that
was placed in the top of the columns. This allowed the influent feed solutions to combine at the
desired flow rates, 13 and 3 mL/min, and drip down to the filter sand media for a combined flow
of 16 mL/min.
3.1.2 Column Influent Solution Preparation
Influent feed solutions were prepared with deionized water in five-gallon increments and
stored in larger plastic reservoirs (Table 1). A 100x stock solution of soluble Mn was prepared
weekly by dissolving 0.16 g of manganese chloride tetrahydrate (MnCl2*4H2O) into 100 mL of
deionized water. A 100x Al stock solution was also prepared weekly by dissolving 1.09 g of
aluminum sulfate octadecahydrate (Al2(SO4)3*18H2O) into 100 mL of deionized water. A
volume of 2.5 or 10 mL of the 100x solutions (Mn2+ and Al3+) along with 1.52 g of sodium
bicarbonate (NaHCO3) were combined with five gallons of deionized water as the working
feedstock.
During times when protocol dictated that free chlorine was to be fed to the column at 2.0
mg/L, 0.47 mL of concentrated household chlorine bleach (Clorox, 8.25% available free
chlorine) was added to 5 gallons of deionized water. This chlorine concentration provided an
effluent concentration of approximately 1.0 mg/L. Chlorine demand across the column at a 0.2
mg/L soluble influent Mn concentration was 1.0 mg/L. When free chlorine was being fed to the
column at 1.1 mg/L, which resulted in an effluent concentration of 0.1 mg/L, 0.24 mL of
concentrated household chlorine bleach was added to 5 gallons of deionized water. Alkalinity
was also added at a mass of 1.52 g NaHCO3 for an additional 1 meq of alkalinity. Total
combined influent feed characteristics can be viewed in Table 1.
12
A mass of 0.8 or 20 g/L of sodium acetate was dissolved in nanopure water to prepare the
sodium acetate feed. A five-gallon volume was prepared every other day. Spare feed lines, of
the same length, were made in order to allow for bleaching of tubing as needed. Using a syringe,
a 50:50 Clorox bleach (8.25%) solution was pushed through the tubing to decrease biofilm
growth and carbon consumption before column entry.
Table 1. Combined Feed Characteristic Ranges for Column Influent
Influent Characteristic Value Alkalinity (meq/L) 2.0
pH 7.15 ± 0.15 Duration of MnOx(s) Coating (days) 5 or 14
15
3.1.10 Experimental Conditions for the Mn Desorption Study with Harwood Mills Anthracite Media (May 2015)
Anthracite coal media was obtained in May 2015 from Filter 1 of the Harwood Mills
Water Treatment Plant (Newport News, VA). The filter had been in service for approximately
28 years and had been backwashed immediately before sample collection. Study details
followed the experimental set up detailed in Table 4. The columns contained a six-inch bed depth
of the collected anthracite coal. Influent Mn and Al were decreased from 200 µg/L to 50 µg/L
after 8 days of column operation. Experimental conditions were identical in duplicate columns,
with the exception of pH. Column A had a pH range of 6.3 - 6.6 and Column B had a pH range
of 7.0 – 7.3 for the duration of the experiment.
Table 4. Experimental Conditions for Harwood Mills Anthracite Media Experiment
Influent Characteristic Value Influent Alkalinity (meq/L) 2.0
Influent Free Chlorine (mg/L as Cl2) 1.5-2.0 Influent Manganese (µg/L) 50 or 200 Influent Aluminum (µg/L) 50 or 200
pH 6.3 – 6.6 or 7.0 – 7.3 Duration of MnOx(s) Coating (days) 3
3.1.11 Experimental Conditions for the Mn Desorption Study with Mn Reducer Inoculated Harwood Mills (Newport News, VA) Anthracite Media (February 2016)
Anthracite coal media from the upper filter layers of the Harwood Mills Water Treatment
Plant (Newport News, VA), was collected in February 2016 from Filter 1. The filter had been
online approximately 5.5 hours after the last backwash cycle when the media was collected.
Table 5 details the experimental conditions for this column study.
16
Table 5. Experimental Conditions for Harwood Mills Anthracite Media Experiment
Influent Characteristic Value Influent Alkalinity (meq/L) 2.0
Once the reaction was complete, the supernatant was visually inspected for clarity so that it
was ensured that all KMnO4 had been reacted (Figure 4) and the MnOx(s) was allowed to settle
and the supernatant was poured off. The MnOx(s) was centrifuged at 10,000 x g for five minutes
to form a pellet and remove excess supernatant. The MnOx(s) samples were washed by
resuspension in nanopure water, and re-centrifuged to form a new pellet three times. A single
MnOx(s) sample was dried at 103 °C overnight and, using a mortar and pestle, was then ground
into a fine powder. All other synthesized MnOx(s) samples were left as a wet “mud.”
3.2.2 MnOx(s) Sample Summary
A total of five MnOx(s) samples were used in all Mn reduction soft agar vial experiments.
The MnOx(s) samples were either purchased from a chemical supplier or synthesized in house
with various treatments or chemicals added (Table 6).
Table 6. Characterization of MnOx(s) Samples
Approximate Synthesis Date “Name” Origin Other Notes
2008 Purchased from Sigma-Aldrich in 2008 <5 micron, activated ~85%
7-8-15 In house synthesis on 7-8-15 Dried in oven at 103 °C for 24 hours
7-28-15 In house synthesis on 7-28-15 11-18-15 In house synthesis on 11-18-15 Added 3 mEq of Ca2+ 1-11-16 In house synthesis on 1-11-16 Added 3 mEq of Ca2+
3.2.3 MnOx(s) Chlorine Inactivation
During the course of trial and error when finalizing the MnOx(s) soft agar media, it was
hypothesized that the increased heat produced during the autoclave process altered some of the
physical properties of the MnOx(s). After MnOx(s) samples were autoclaved, it was increasingly
difficult to distribute the solid oxide evenly in the soft agar due to clumping of the MnOx(s)
(Figure 4). A chlorine inactivation method was elected since sterilization via autoclave of
MnOx(s) was not ideal for even distribution in the vial assay.
19
Figure 4. Image of uneven (A-D) and even (E-H) distribution of several MnOx(s) samples
after autoclaving (A-D) and chlorine inactivation (E-H)
A goal of 10,000 mg/L*min Ct was targeted for inactivation of any microorganisms that
may have been present on the MnOx(s) samples. A 10-ppm free chlorine solution was made using
Clorox bleach (8.25% sodium hypochlorite) and deionized water. The desired mass of each
MnOx(s) sample being tested was weighed and placed into a sterile 15 mL Falcon tube. A volume
of 10 mL of the 10-ppm chlorine solution was added into each tube and the samples were
vigorously vortexed. Samples were allowed to maintain chlorine contact for approximately 17
hours overnight to inactivate the microorganisms present. Free chlorine for each sample was
measured using HACH DPD methods (Hach 2016c) before and after microorganism inactivation
was completed.
3.2.4 Media Composition
A manganese reduction contained the following per liter of 10 mM HEPES buffer (pH
7.4): 0.2 g yeast extract, 2 g sodium acetate and 3 g agar (0.3%). The media was autoclaved on a
20-minute liquid cycle and was allowed to cool before the addition of MnOx(s). MnOx(s) was
added, following chlorine inactivation, at a concentration of 0.35 or 0.7 g/L, depending on the
color and properties of the oxide. This was done in order to target a starting transmittance of
around 4-8%.
MnOx(s) samples that air dried over an extended amount of time or in an oven, were
typically darker in color than those left as a wet mud. Because of this, different amounts of the
2008 and 7-8-15 MnOx(s) samples were added into 10 mL of the MnOx(s) reduction soft agar and
20
transmittance at 540 nm was measured (Figures 5 and 6). Again, the optimal concentration of
MnOx(s) for each sample was determined to be concentrations that fell with in the 4-8%
transmittance range. The 2008 and 7-8-15 MnOx(s) samples were added into the media at a 0.35
g/L concentration. All other MnOx(s) samples were added at a concentration of 0.7 g/L.
Figure 5. Percent transmittance of 2008 MnOx(s) sample as a function of MnOx(s) concentration added
Cycle Temperature Cycle Duration Number of Cycles 98.0 °C 2 minutes 1 98.0 °C 5 seconds 40 50.0 °C 10 seconds 40
3.4.5 DNA Normalization
DNA was diluted and added into the wells at approximately the same concentration in
order to normalize DNA and check for PCR inhibition. Extraction efficiency of the Ultra Clean
kit was lower than that of the PowerSoil kit, so extracted samples had a lower starting
concentration of DNA. All samples analyzed in this test were obtained from a pure colony, and
were diluted with in the range of 5-15 ng/μL DNA. Taking into account dilution in the plate,
final DNA concentrations in each qPCR reaction were between 0.5 and 1.5 ng at the start of the
program (Figure 14).
Figure 14. Environmental isolates and S. oneidensis MR-1 qPCR quantification cycle for the mtrB primer set at a 50 °C melting temperature when loaded DNA is normalized to 5-
10 ng/μL
0
5
10
15
20
25
30
35
40
45
MB4 MB5 MB6 MB7 MR-1 Water Blank
Qua
ntifi
catio
n C
ycle
(Cq)
34
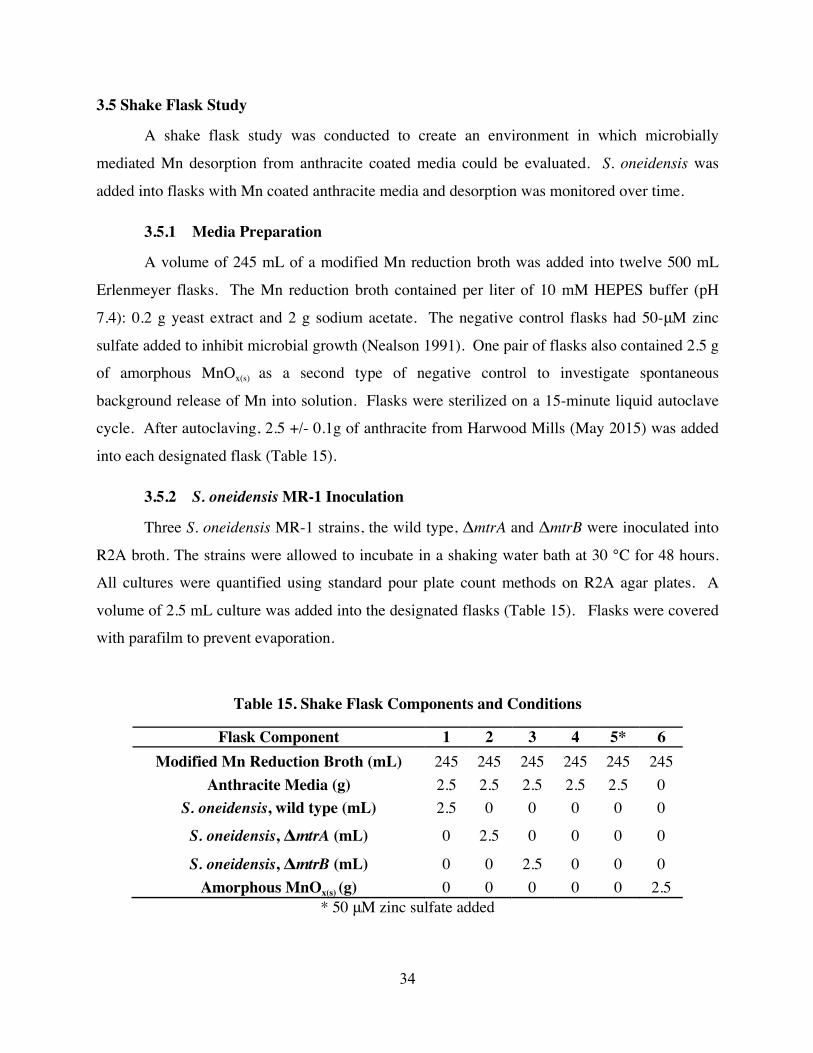
3.5 Shake Flask Study
A shake flask study was conducted to create an environment in which microbially
mediated Mn desorption from anthracite coated media could be evaluated. S. oneidensis was
added into flasks with Mn coated anthracite media and desorption was monitored over time.
3.5.1 Media Preparation
A volume of 245 mL of a modified Mn reduction broth was added into twelve 500 mL
Erlenmeyer flasks. The Mn reduction broth contained per liter of 10 mM HEPES buffer (pH
7.4): 0.2 g yeast extract and 2 g sodium acetate. The negative control flasks had 50-μM zinc
sulfate added to inhibit microbial growth (Nealson 1991). One pair of flasks also contained 2.5 g
of amorphous MnOx(s) as a second type of negative control to investigate spontaneous
background release of Mn into solution. Flasks were sterilized on a 15-minute liquid autoclave
cycle. After autoclaving, 2.5 +/- 0.1g of anthracite from Harwood Mills (May 2015) was added
into each designated flask (Table 15).
3.5.2 S. oneidensis MR-1 Inoculation
Three S. oneidensis MR-1 strains, the wild type, ΔmtrA and ΔmtrB were inoculated into
R2A broth. The strains were allowed to incubate in a shaking water bath at 30 °C for 48 hours.
All cultures were quantified using standard pour plate count methods on R2A agar plates. A
volume of 2.5 mL culture was added into the designated flasks (Table 15). Flasks were covered
Medium, anthracite or MnOx(s) and cultures were combined in flasks and secured on a
tabletop shaker and rotated at 50 RPM. Samples were withdrawn on days 0, 2, 5, 7, 9, 12 and 20
in 5 mL aliquots using 10 mL luer-lock syringes. The samples were filtered through a 0.45 μm
Wheaton glass microfiber fiber filter to remove any solid phase or colloidal Mn that may have
been sheared off during the shaking process. The filtered samples were preserved using 2%
nitric acid for Mn analysis using the ICP.
3.5.4 Anthracite Media Extraction
Measurement of the amount of MnOx(s) coating on the anthracite media was completed
following HAS extraction methods described by Knocke et al. (1991). Adaptations and
modifications detailed below were conducted as needed for optimal performance and results.
Three aluminum pans were weighed and 1 gram of anthracite media (collected from the
Harwood Mills WTP (Newport News, VA)), was placed in each. The media was dried for 24
hours at 103-105 °C and the dry weight of the media was recorded. The media was placed in
250 mL of 2% nitric acid deionized water with 300 mg HAS. After 10 hours, 10 mL samples
were withdrawn from each of the triplicates and were diluted 1/50 and 1/100 to fit with in the
ICP standard curve. Samples were analyzed via the ICP for Mn. Dissolved Mn was back
calculated by using Equation 3.
[3] mg metal
g dry media =Concentration in Extraction Solution × Volume Extraction Solution
Dry Weight Media
36
4.0 EXPERIMENTAL RESULTS This chapter details results from the experiments that were described in Chapter 3. Mn
breakthrough trends are discussed from bench-scale filtration studies that evaluated the effects of
influent pH, the duration of MnOx(s) coating and Mn-reducing microbial populations on the
media. Then, aerobic and anaerobic vial assay results for five Mn-reducing bacterial strains are
described, along with discussion of experimental results for bioavailability of varying MnOx(s)
samples. Finally, Mn desorption data from an aerobic shake flask study, inoculated with S.
oneidensis MR-1, are presented.
4.1 Bench-Scale Column Performance of Coated Sand Media
This section provides results from a filter column test conducted at nearly neutral pH
values of 7.0 to 7.3, exposing uncoated sand media to free chlorine for a period of 5 or 15-days
to develop a MnOx(s) coating. After the desired exposure time, free chlorine was removed from
the filter influent and the potential for Mn breakthrough were measured by comparing soluble
influent Mn to effluent Mn concentrations. Mn breakthrough trends for the 5-day and 15-day
MnOx(s) coated filters were then compared on the basis of maximum values of Mn through the
media bed and how quickly maximum breakthrough values were reached.
4.1.1 Mn Break Through During Chlorine Discontinuation of 5-day MnOx(s) Coated Virgin Sand Media
After five days, free chlorine was removed from the influent and the potential for Mn
breakthrough was evaluated by comparing soluble influent Mn to effluent concentrations (Figure
15). An increase in effluent Mn concentration began within one hour of free chlorine removal.
The increase continued for approximately 8.4 hours and reached a maximum value of 74% of the
influent concentration. Manganese breakthrough values remained around 73-75%, representing
steady state conditions within 8.4 hours after chlorine was removed from the filter.
The remaining 27% of the influent Mn that was not passing through the filter represented
soluble Mn that was most likely adsorbed onto the MnOx(s) surface, where surface catalyzed
oxidation then occurred. At neutral influent pH values (7.0 to 7.3), any appreciable amount of
Mn oxidation due to contact with molecular oxygen found in the influent waters was highly
improbable (Morgan 1964). A majority of the soluble Mn removed by the column was most
37
likely adsorbed onto active sites of the filter media and subsequently oxidized. As stated above,
MnOx(s) coating on the sand media for this experiment was allowed to develop in the presence of
free chlorine for a total of five days before chlorine application ceased. During chlorine
application, MnOx(s) active sites were being continuously created and regenerated (Knocke 1991).
Once chlorine application stopped, the available active sites continued to adsorb some of the
influent Mn and then surface oxidize the soluble Mn.
Figure 15. Percentage manganese removal before and after the discontinuation of chlorine
of the 5 day MnOx(s) coated sand filter
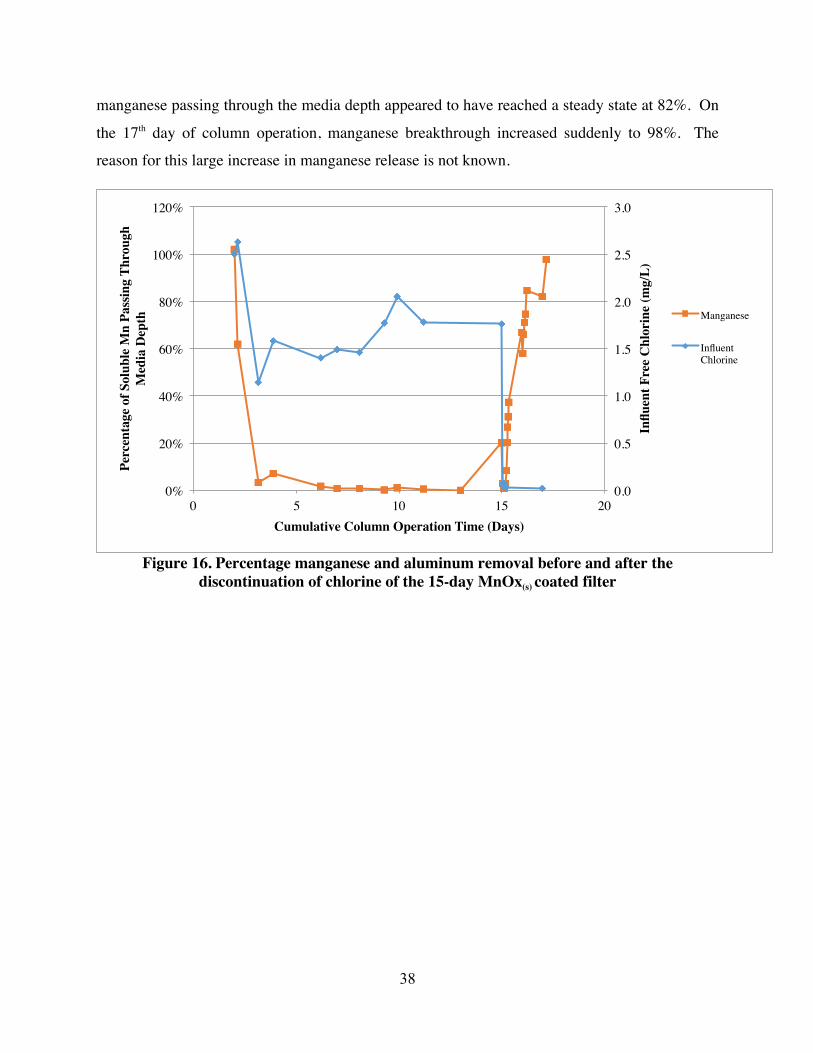
4.1.2 Mn Break Through During Chlorine Discontinuation of 15-day MnOx(s) Coated Sand Media
After 15 days, free chlorine was removed from the influent and Mn breakthrough was
measured by comparing soluble influent Mn to effluent concentrations. Figure 16 shows
manganese breakthrough concentrations in the column effluent as a percentage of the influent.
After chlorine was removed, effluent Mn concentrations began to rise within one hour.
Manganese effluent concentrations increased steadily for 29.5 hours until the percent of
0.0
0.5
1.0
1.5
2.0
2.5
0%
10%
20%
30%
40%
50%
60%
70%
80%
0.0 1.0 2.0 3.0 4.0 5.0 6.0 7.0In
fluen
t Fre
e C
hlor
ine
(mg/
L)
Perc
enta
ge o
f Sol
uble
Mn
Pass
ing
Thro
ugh
Med
ia
Dep
th
Cumulative Column Operation Time (Days)
Manganese
Influent Chlorine
38
manganese passing through the media depth appeared to have reached a steady state at 82%. On
the 17th day of column operation, manganese breakthrough increased suddenly to 98%. The
reason for this large increase in manganese release is not known.
Figure 16. Percentage manganese and aluminum removal before and after the
discontinuation of chlorine of the 15-day MnOx(s) coated filter
0.0
0.5
1.0
1.5
2.0
2.5
3.0
0%
20%
40%
60%
80%
100%
120%
0 5 10 15 20
Influ
ent F
ree
Chl
orin
e (m
g/L)
Perc
enta
ge o
f Sol
uble
Mn
Pass
ing
Thro
ugh
Med
ia D
epth
Cumulative Column Operation Time (Days)
Manganese
Influent Chlorine
39
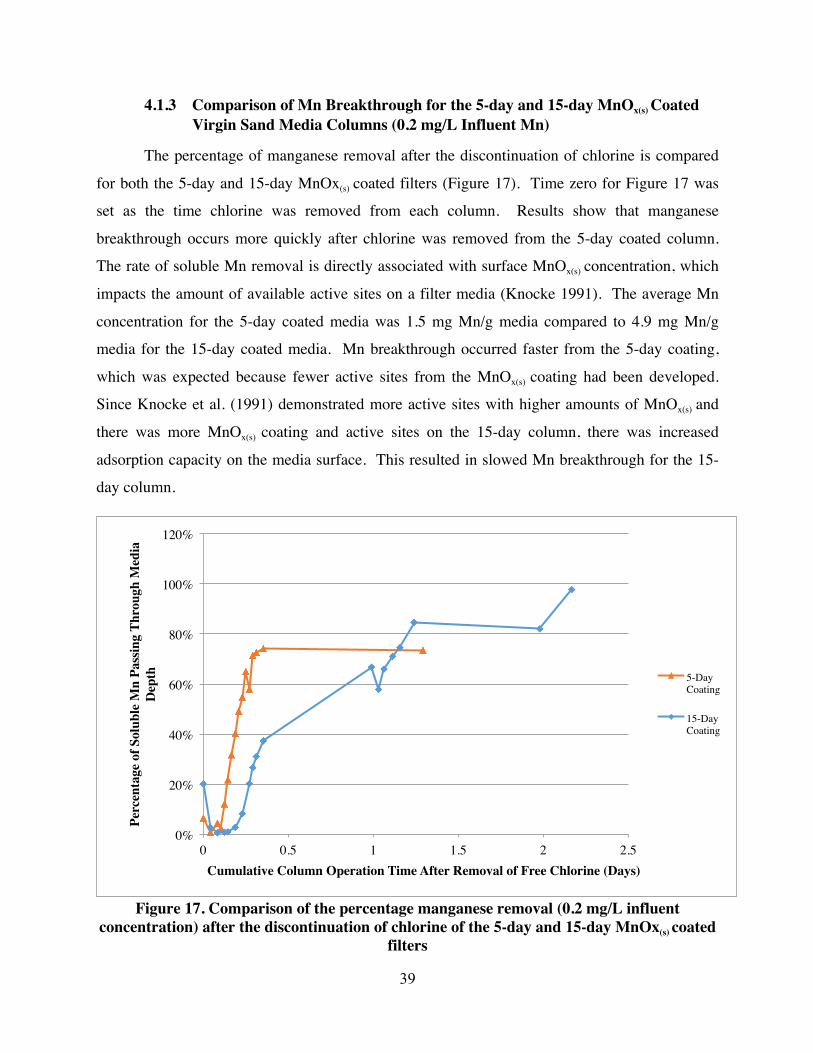
4.1.3 Comparison of Mn Breakthrough for the 5-day and 15-day MnOx(s) Coated Virgin Sand Media Columns (0.2 mg/L Influent Mn)
The percentage of manganese removal after the discontinuation of chlorine is compared
for both the 5-day and 15-day MnOx(s) coated filters (Figure 17). Time zero for Figure 17 was
set as the time chlorine was removed from each column. Results show that manganese
breakthrough occurs more quickly after chlorine was removed from the 5-day coated column.
The rate of soluble Mn removal is directly associated with surface MnOx(s) concentration, which
impacts the amount of available active sites on a filter media (Knocke 1991). The average Mn
concentration for the 5-day coated media was 1.5 mg Mn/g media compared to 4.9 mg Mn/g
media for the 15-day coated media. Mn breakthrough occurred faster from the 5-day coating,
which was expected because fewer active sites from the MnOx(s) coating had been developed.
Since Knocke et al. (1991) demonstrated more active sites with higher amounts of MnOx(s) and
there was more MnOx(s) coating and active sites on the 15-day column, there was increased
adsorption capacity on the media surface. This resulted in slowed Mn breakthrough for the 15-
day column.
Figure 17. Comparison of the percentage manganese removal (0.2 mg/L influent
concentration) after the discontinuation of chlorine of the 5-day and 15-day MnOx(s) coated filters
0%
20%
40%
60%
80%
100%
120%
0 0.5 1 1.5 2 2.5
Perc
enta
ge o
f Sol
uble
Mn
Pass
ing
Thro
ugh
Med
ia
Dep
th
Cumulative Column Operation Time After Removal of Free Chlorine (Days)
5-Day Coating
15-Day Coating
40
It is important to note that the percentage of Mn passing through the media depth never
exceeded 100% for either the 5-day or 15-day coated columns. The cessation of free chlorine to
filters in some full-scale WTP (Gabelich 2006) and laboratory studies (Islam 2010) have shown
Mn desorption that results in effluent Mn concentrations exceeding the influent for a period of
time. The cause for this Mn release phenomenon has not definitively been determined, but it has
been proposed that Mn release is in part facilitated by Mn-reducing microorganisms living on
filtration media (Islam 2010). It was critical to demonstrate that Mn breakthrough did not exceed
100% in sand media that had been sterilized before MnOx(s) coating as the current hypothesis was
that Mn release might be attributed to microbial activity.
4.2 Bench-Scale Filter Column Performance of May 2015 Harwood Mills Anthracite Media at Different Influent pH Values
This section provides results from parallel filter column experiments conducted at
influent pH values of 6.3 - 6.6 or 7.0 - 7.3. The Harwood Mills anthracite media was collected in
May 2015 and was exposed to free chlorine for a period of four days. This exposure resulted in a
small amount of new MnOx(s) coating. After four days, free chlorine was removed from the
influent and Mn breakthrough was measured by comparing soluble influent to effluent Mn
concentrations. Mn breakthrough trends for the two different influent pH ranges were then
compared on the basis of maximum values of Mn through the media bed and steady state Mn
breakthrough percentages.
4.2.1 Mn Break Through During Chlorine Discontinuation of Influent pH 6.3 – 6.6 (Column A)
Percentage Mn coming through the Harwood Mills anthracite media depth for column A
(pH of 6.3 – 6.6) was plotted over time (Figure 18). As expected, a sharp increase in effluent
manganese was seen after free chlorine was removed on day four. Initially, soluble influent Mn
was fed to the column at a concentration of 0.2 mg/L. During this time, Mn breakthrough
reached a peak of 80%. After eight days of column operation and four days after the cessation of
the free chlorine feed, influent Mn concentration was decreased to 0.05 mg/L. With in 13 hours
of decreasing influent Mn, effluent Mn exceeded influent concentrations for several hours,
41
reaching a maximum value of 109%. Mn breakthrough, after the initial period of Mn
breakthrough increase, stayed below 100% for the remainder of the experiment.
A natural microbial population had been established on the media since the anthracite
media had been taken directly from the Harwood Mills treatment plant filters while they were
been actively in service. The increased Mn breakthrough of 109% could be definitively
attributed to a Mn reducing microbial population. When Mn breakthrough has occurred in a full-
scale water treatment plant, elevated levels of effluent Mn have been sustained for days or weeks
due to stopping the application of free chlorine to filters (Gabelich 2006). When the Mn
desorption phenomenon has been observed in a full-scale WTP, Mn release occurs for weeks or
months at a time (Figure 2). Elevated effluent Mn levels only lasted for 2.5 hours and then
decreased below 100% breakthrough, therefore microbial activity was most likely not the sole
reason for the increase seen.
Figure 18. Percentage of manganese through media depth in column A with an influent pH of 6.3 – 6.6
0.0
0.5
1.0
1.5
2.0
2.5
3.0
0%
20%
40%
60%
80%
100%
120%
0 2 4 6 8 10 12
Influ
ent F
ree
Chl
orin
e (m
g/L)
Perc
enta
ge o
f Sol
uble
Mn
Pass
ing
Thro
ugh
Med
ia
Dep
th
Cumulative Column Operation Time (Days)
Manganese
Influent Chlorine
Flow off 65h
Influent Mn decreased to 0.05 mg/L
42
Flow to this column was interrupted on days four and five of operation for 65 hours.
Large increases in the amount of effluent Mn were seen immediately after influent flow returned
after a period of no flow. Effluent Mn levels returned to expected breakthrough values after a
few hours of continuous flow. The reason for the increase in effluent Mn was probably due to
reductive dissolution of bioavailable MnOx(s) by Mn-reducing microorganisms living on the
media. MnOx(s) on the media surface was reduced and released into the pore waters in soluble
form. The increase in Mn released into the pore waters was detected in the effluent once flow
was returned.
4.2.2 Mn Breakthrough During Chlorine Discontinuation of Influent pH 7.0 – 7.3 (Column B)
Percentage Mn coming through the Harwood Mills anthracite media depth for column B
(pH of 7.0 – 7.3) was plotted over time (Figure 19). As previously noted, a sharp increase in
effluent manganese was seen after free chlorine was removed on day four. Corresponding to
column A (pH 6.3 - 6.6), soluble influent Mn was initially fed to the column at a concentration of
200 ppb for eight days. During this time, Mn breakthrough reached a peak of 66%. On the 8th
day of column operation, influent Mn concentration was decreased to 0.05 mg/L. Within 13
hours of decreasing the influent Mn, breakthrough reached a maximum value of 99%. Effluent
Mn concentrations never exceeded influent concentrations after the application of free chlorine
had ceased for four days and when the influent Mn concentration was lowered to 0.05 mg/L.
Flow to this column was also interrupted on days four and five of operation for 65 hours. Large
decreases in the amount of Mn breakthrough were seen when flow was turned off for the same
reason of reductive dissolution, which was detailed in section 4.2.1.
43
Figure 19. Percentage of manganese through media depth in column B with an influent pH
of 7.0 – 7.3
4.2.3 Comparison of Manganese Break Through During Chlorine Discontinuation of Influent pH 6.3- 6.6 (Column A) and 7.0 – 7.3 (Column B)
Figure 20 compares the percentage Mn coming through media depth in columns A (pH
6.3 – 6.6) and B (pH 7.0 – 7.3). Both columns had the highest percentage breakthrough values
with the lower influent manganese loading concentration of 0.05 mg/L. Mn breakthrough trends
for both columns were similar for the first 24 hours after free chlorine removal. However, large
differences in Mn breakthrough can be seen after six days of column operation, where column A
demonstrated 14% more manganese breakthrough than column B.
Several mechanisms including surface regeneration by molecular oxygen, MnOx(s)
concentration and Mn oxidation kinetics are mediated by pH and, therefore, directly affected Mn
breakthrough in column studies. Increases in pH have been shown to improve Mn oxidation
(Morgan 1964). Knocke et al. (1991) were able to demonstrate that the absorptive capacity of
the MnOx(s) surface increases with pH as well. Molecular oxygen in the influent waters is able to
better regenerate active sites on the MnOx(s) surface as the pH increases, which also helps
promote the uptake of Mn (Knocke 1991).
0.0
0.5
1.0
1.5
2.0
2.5
3.0
3.5
0%
20%
40%
60%
80%
100%
120%
0 2 4 6 8 10 12
Influ
ent F
ree
Chl
orin
e (m
g/L)
Perc
enta
ge o
f Sol
uble
Mn
Pass
ing
Thro
ugh
Med
ia
Dep
th
Cumulative Column Operation Time (Days)
Manganese
Influent Chlorine
Flow off 65h
Influent Mn decreased to 0.05 mg/L
44
Figure 20. Comparison of percentage manganese through media depth in Columns A and B
Laboratory studies have shown that manganese oxide coatings on media increase as the
pH increases from 6.0 to 8.0 (Tilak 2013). Column A, at an influent pH of 6.3 - 6.6, would have
formed less of a coating during the application of free chlorine than column B with an influent
pH 7.0 – 7.3. As already stated, there is a direct correlation to soluble Mn absorption and the
amount of MnOx(s) coating that has been formed. Because column B had a higher pH, the amount
of coating and active sites formed would be greater and the soluble Mn absorptive capacity
would also be greater. This would also result in a lower percentage of Mn breakthrough
occurring through the filter, which supports the results from this column experiment.
0.00
0.50
1.00
1.50
2.00
2.50
3.00
0%
20%
40%
60%
80%
100%
120%
0 2 4 6 8 10 12
Influ
ent F
ree
Chl
orin
e (m
g/L)
Perc
enta
ge o
f Sol
uble
Mn
Pass
ing
Thro
ugh
Med
ia D
epth
Cumulative Column Operation Time (Days)
Column A (pH 6.3-6.6)
Column B (pH 7.0-7.3)
Influent Chlorine
Flow off 65h
Influent Mn decreased to 0.05 mg/L
45
4.3 Bench-Scale Filter column Performance of March 2016 Harwood Mills Anthracite Media Inoculated with Mn Reducers
This section provides results from parallel filter column experiments, with an influent pH
range from 6.3 – 6.6, that had one Mn-reducing microorganism inoculated and one non-
inoculated column. The Harwood Mills anthracite media (collected in February 2016) was
exposed to 0.3 – 0.4 mg/L free chlorine for a period of 5 days. After 5 days, free chlorine was
removed from the influent and Mn breakthrough was measured by comparing soluble influent
Mn to effluent concentrations. TOC was also applied to the column at a concentration of 0.5
mg/L as C for the first 17 days and increased to 12 mg/L after day 18. Mn breakthrough trends
for the inoculated and non-inoculated columns were compared on the basis of maximum values
of Mn through the media bed and average steady state Mn breakthrough. Patterns of Mn
breakthrough are also discussed in relation to TOC entering the column.
4.3.1 S. oneidensis MR-1 Inoculum Experiment
Percentage of Mn through the anthracite media filter depth for both column A (S.
oneidensis MR-1 inoculum) and B (no inoculum) is represented in Figure 21. During the initial
5 days when free chlorine was applied, a consistent difference in Mn breakthrough was seen in
column A when compared to column B. Column A had a maximum difference of 23% from
column B in Mn passing through the filter media while chlorine was applied. Experimental
conditions between columns A and B remained the same through the duration of the experiment.
The difference in Mn breakthrough can be attributed to the Mn reduction activity of the S.
oneidensis MR-1 inoculum. S. oneidensis MR-1 was exposed to a Ct value of 4,400 mg/L*min.
46
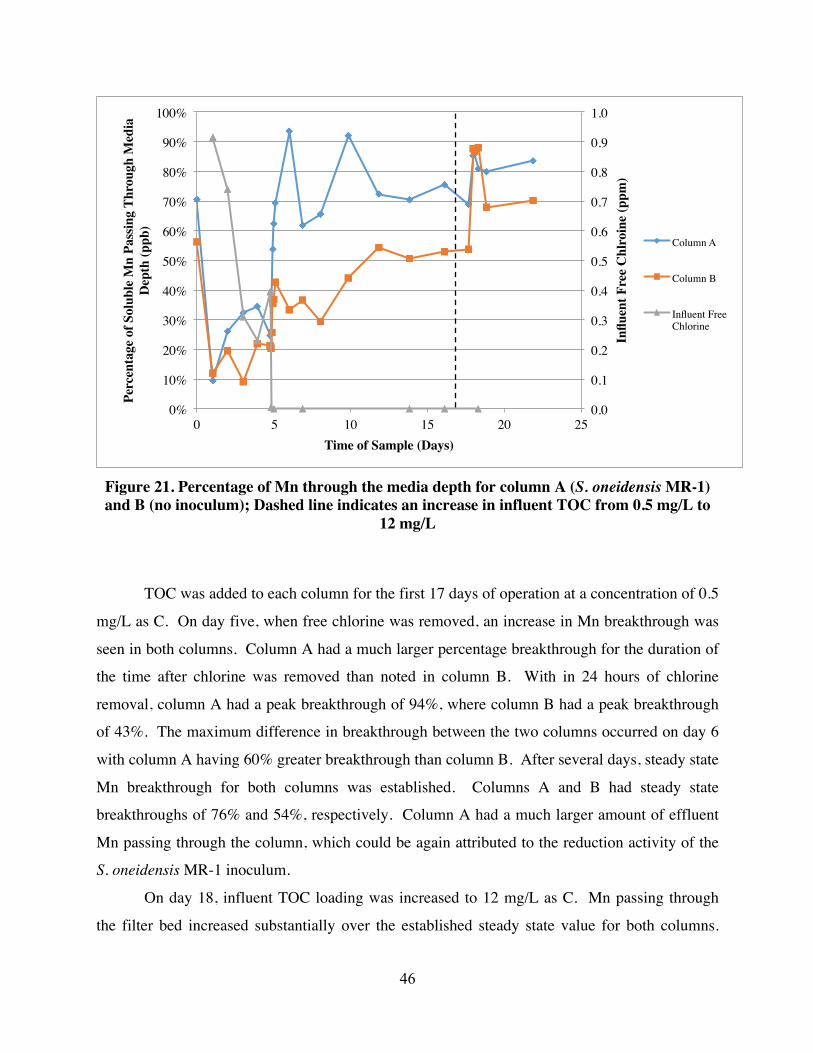
Figure 21. Percentage of Mn through the media depth for column A (S. oneidensis MR-1) and B (no inoculum); Dashed line indicates an increase in influent TOC from 0.5 mg/L to
12 mg/L
TOC was added to each column for the first 17 days of operation at a concentration of 0.5
mg/L as C. On day five, when free chlorine was removed, an increase in Mn breakthrough was
seen in both columns. Column A had a much larger percentage breakthrough for the duration of
the time after chlorine was removed than noted in column B. With in 24 hours of chlorine
removal, column A had a peak breakthrough of 94%, where column B had a peak breakthrough
of 43%. The maximum difference in breakthrough between the two columns occurred on day 6
with column A having 60% greater breakthrough than column B. After several days, steady state
Mn breakthrough for both columns was established. Columns A and B had steady state
breakthroughs of 76% and 54%, respectively. Column A had a much larger amount of effluent
Mn passing through the column, which could be again attributed to the reduction activity of the
S. oneidensis MR-1 inoculum.
On day 18, influent TOC loading was increased to 12 mg/L as C. Mn passing through
the filter bed increased substantially over the established steady state value for both columns.
0.0
0.1
0.2
0.3
0.4
0.5
0.6
0.7
0.8
0.9
1.0
0%
10%
20%
30%
40%
50%
60%
70%
80%
90%
100%
0 5 10 15 20 25
Influ
ent F
ree
Chl
roin
e (p
pm)
Perc
enta
ge o
f Sol
uble
Mn
Pass
ing
Thro
ugh
Med
ia
Dep
th (p
pb)
Time of Sample (Days)
Column A
Column B
Influent Free Chlorine
47
Column A had a maximum breakthrough of 86%, while column B had a value of 87% of influent
Mn reaching the effluent. Both columns had similar maximum breakthrough values, with a 1%
difference in percentage of Mn passing through the filter media after the addition of additional
influent carbon. Column B had the largest increase in Mn breakthrough when TOC was
increased from 0.5 mg/L to 12 mg/L as C. When TOC was increased in column B, 32% more
Mn release over steady state conditions occurred within eight hours. After the TOC
concentration increased, Mn breakthrough in column A only increased by 10%. The exact
reason as to why the increase of TOC loading into the filter columns increased the amount of Mn
seen in the effluent is unclear. The reason why the addition of TOC into column B created such
a large increase in the amount of Mn in the effluent is also unclear. Islam (2010) demonstrated
that the addition of 4-μL sodium acetate to filter columns facilitated Mn release. When the
sodium acetate was no longer fed into the columns, Mn release ceased (Islam 2010).
A differing steady state condition occurred after the increase in TOC for both columns.
Mn breakthrough for column A appeared to remain around 84% for several days after the
increase in TOC. Column B Mn breakthrough remained around 70% after the initial increase in
TOC. These new steady state values were higher than the steady state values achieved before
with the lower TOC concentration.
Since both of the columns contained anthracite media, which had an active natural
microbial population, it appeared that some unknown microbiological mechanisms were
occurring during column operation. Column A had additional Mn-reducing microorganisms (S.
oneidensis MR-1) added onto the media in addition to the existing natural microbial population.
This could explain the differences in Mn removal for the first 17 days of the experiment when
TOC was loaded at 0.5 mg/L. The presence of S. oneidensis MR-1 in column A could also
explain the elevated and sustained Mn breakthrough after the influent TOC concentration was
increased. Additional carbon, above the initial TOC of 0.5 mg/L, may have been required for the
naturally existing population of Mn-reducing microorganisms to begin to actively reduce more of
the accumulated MnOx(s) present on the anthracite.
The columns that were inoculated with S. oneidensis MR-1 showed a greater percentage
in Mn breakthrough for the duration of the experiment when compared to the column that did not
have any additional inoculum. Lovely and Philips (1988) showed that S. oneidensis MR-1
coupled the oxidation of electron donors, similar to the acetate supplied in the columns, to Mn
48
reduction. This is the probable reason for why Mn release in both columns increased when TOC
was increased. The oxidation of TOC was coupled to and promoted the reduction of MnOx(s)
from the media surface by the Mn-reducing microorganisms. The types and quantity of naturally
occurring Mn-reducing microorganisms residing on the Harwood Mills WTP were not known.
Studies have shown that microorganisms have preferences for one carbon source over another
(Jones 2009). S. oneidensis MR-1 may have had a competitive advantage over the naturally
occurring Mn-reducing microorganisms for acetate as the carbon source in filter studies.
Mn reduction kinetics and Mn-reducing microbial populations may also have played
roles in the differences in Mn reduction seen between the inoculated and non-inoculated
columns. Differences in Mn reduction kinetics are seen between differing microorganisms, with
some organisms able to reduce faster than others (Cerrato 2008). S. oneidensis MR-1 Mn
reduction kinetics could have been faster than the naturally occurring Mn-reducing
microorganisms on Harwood Mills WTP media. Figure 22 shows the mtrB gene qPCR
quantification cycle values for the top, middle and bottom two-inch sections of the S. oneidensis
MR-1 inoculated (Column A) and non-inoculated columns (Column B). Results show that the S.
oneidensis MR-1 inoculated columns contained more microbes that possessed the mtrB gene,
therefore, the column contained more Mn-reducing microorganisms. The increase in the number
of Mn-reducing microorganisms is likely an additional reason why increased Mn release was
seen from this Column A. It is not known which of the above discussed factors (TOC
concentration, Mn reduction kinetics or Mn-reducing microorganism population) has the greatest
effect on Mn release or what combination of these conditions would be necessary to see Mn
release in a full-scale WTP. Detection of S. oneidensis MR-1 was confirmed at all depths in
Column A at an average density of 3.9x10² CFU/mL and was not detected at any depth in
Column B (Figure 23). The density of S. oneidensis MR-1 in Column A appears to increase as
the depth increases in the column.
49
Figure 22. Comparative quantification cycle number for the top, middle and top two inch depths of Column A (S. oneidensis MR-1 inoculated) and Column B (non-inoculated) for
microorganisms that contain the mtrB gene
Figure 23. S. oneidensis MR-1 concentration in the top, middle and top two inch depths of
Column A (S. oneidensis MR-1 inoculated) and Column B (non-inoculated)
27.2 26.8 26.8
37.2 37.5 38.4
0
5
10
15
20
25
30
35
40
Column A Top
Column A Middle
Column A Bottom
Column B Top
Column B Middle
Column B Bottom
Negative Control
Qua
ntifi
catio
n C
ycle
(Cq)
2.40E+023.56E+02
5.73E+02
1.00E+00
1.00E+01
1.00E+02
1.00E+03
Column A Top
Column A Middle
Column A Bottom
Column B Top
Column B Middle
Column B Bottom
CFU
/mL
of S
. one
iden
sis M
R-1
in F
ilter
Dep
th
50
Figure 24 compares the average concentration of extractable Mn in mg per gram of the
anthracite media in the top and bottom two inches of Column A (inoculated with S. oneidensis
MR-1) and Column B (non-inoculated). Results show that there is a possibly significant
difference in the amount of Mn coating in the top and bottom sections in Column A. The
amount of extractable Mn was 9 mg Mn lower in the top 2-inch section compared to the bottom
section for Column A. This results in a percent difference for Column A of 23%. In a study by
Tobiason et al. (2008), natural variability of the concentration of Mn coatings had a standard
variation of +/- 20% Mn content. The differences in Mn coating seen in Column A between the
top and bottom depths could represent real world variability in Mn coatings. Since the difference
in Mn coating between the top and bottom of the column was larger than 20% for Column A, the
difference could be considered small to moderate but significant. For Column B, the amount of
Mn coated on the anthracite media is approximately the same at the top and bottom sections of
the column.
Figure 24. Average concentration of extractable Mn (mg) per gram of anthracite media from Column A (inoculated with S. oneidensis MR-1) and Column B (non-inoculated)
0
5
10
15
20
25
30
35
40
45
Column A, Top Column A, BoDom Column B, Top Column B, BoDom
Average Extractable mg Mn/g An
thracite
51
4.3.2 MB4 and MB6 Inoculum Experiment
Figure 25 shows the percentage of Mn through the anthracite media filter depth for both
column A (MB4 and MB6 inoculum) and B (no inoculum). For the five days when free chlorine
was applied, on average, 10% more Mn breakthrough was seen in column A when compared to
column B. Influent free chlorine was removed on day five and, as expected, effluent Mn levels
increased steadily in both columns.
Figure 25. Percentage of Mn through the media depth for column A (MB4 and MB6 inoculated) and B (no inoculum); Dashed line indicates an increase in influent TOC from
0.5 mg/L to 12 mg/L
On day seven, effluent Mn levels for both columns stopped increasing and began to reach
a steady state for Mn release. After chlorine was removed (TOC was 0.5 mg/L as C), the steady
state Mn breakthrough values were 38% and 34% for columns A and B, respectively. On day
eight, TOC was increased from 0.5 mg/L to 12 mg/L as C. Again, Mn passing through the filter
bed increased substantially over the established steady state value for both columns. Mn
breakthrough for both columns continued to increase until day 14 when Mn release started to
0
0.1
0.2
0.3
0.4
0.5
0.6
0.7
0.8
0.9
1
0%
10%
20%
30%
40%
50%
60%
70%
80%
90%
100%
0 5 10 15 20 25
Influ
ent F
ree
Chl
orin
e (m
g/L)
Perc
ent M
n Pa
ssin
g Th
roug
h M
edia
Dep
th
Time of Data Sample (Days)
Column A
Column B
Influent Free Chlorine
52
slow and level off. On average, column A had a 5% greater Mn breakthrough than column B for
the duration of the experiment. Column A had a small but consistently greater amount of Mn
breakthrough than column B, with the exception of days 16 through 23. From days 17 to 23, the
percentage of Mn breakthrough in column B exceeded column A.
After the influent TOC was increased to 12 mg/L as C, the maximum Mn breakthrough
value for both columns was 84%. The Mn breakthrough percentage for column A increased
38% after the increase in TOC, where column B Mn breakthrough increased 43%. After day 16,
Mn breakthrough for column B began to exceed column A for the remainder of the experiment
(six days). The MB4 and MB6 inoculum was exposed to a Ct of 3,400 mg/L*min.
Again, both columns contained anthracite media collected from the Harwood Mills WTP
(February 2016) with an active native microbial population. Column A had additional Mn
reducing organisms, MB4 and MB6, inoculated onto the media in addition to the native
microbial population. The small increase in Mn breakthrough seen for most of this column
experiment could be contributed to the presence of the additional inoculated Mn-reducing
microorganisms. Although, the amount of sustained Mn breakthrough compared to the column
study with S. oneidensis MR-1 inoculum was much lower. The average increase in Mn
breakthrough over the non-inoculated column for the S. oneidensis MR-1 study was 21%
compared to a 5% increase in Mn breakthrough over the non-inoculated column for the
MB4/MB6 column experiment. The lower amount of Mn breakthrough seen in the MB4/MB6
columns was somewhat expected as these Mn-reducing microorganisms were repeatedly shown
to reduce Mn at a much slower rate than S. oneidensis MR-1 in the in situ vial assays.
The relative presence of the mtrB gene was also quantified from the bottom, middle and
top two-inch sections of the anthracite media in the inoculated (Column A) and non-inoculated
columns (Column B) (Figure 26). There were insignificant differences seen between Cq values
for either column, which suggests at first glance that the amount of microorganisms that
possessed the mtrB gene were similar between the columns. Figure 14 demonstrates the Cq
values for each of the built environment Mn-reducing microorganisms. MB4 and MB6 both had
average Cq values of 40 when the mtrB primer set was used. This result demonstrated that the
designed mtrB primer set was able to weakly bind to the extracted mtrB gene of MB4 and MB6
during qPCR. It is plausible that the MB4 and MB6 strains were completing reductive Mn
dissolution and reducing the bioavailable fraction of the MnOx(s) surface. This reductive
53
dissolution resulted in the average 5% increase in Mn breakthrough seen during the experiment
compared to the non-inoculated column. Since DNA from MB4 and MB6 did not bind strongly
to the mtrB primer set, qPCR results did not show an increase in the presence of the mtrB gene
for the inoculated column.
Figure 26. Comparative quantification cycle number for the top, middle and top two inch depths of Column A (MB4 and MB6 inoculated) and Column B (non-inoculated) for
microorganisms that contain the mtrB gene
Figure 27 compares the average concentration of extractable Mn in mg per gram of the
anthracite media in the top and bottom two inches of Column A (inoculated with MB4 and MB6)
and Column B (non-inoculated). Comparable to extractable Mn concentrations from the S.
oneidensis MR-1 inoculated column, results show that there is a difference in the amount of Mn
coating in the top and bottom sections in Column A (MB4 and MB6 inoculum). The amount of
extractable Mn was 6 mg Mn lower in the top 2-inch section compared to the bottom section for
Column A. This difference amounts to 16% less Mn coating on the top of the media depth.
Again, in the study by Tobiason et al. (2008), real world variability of Mn coatings for media at
37.23 38.41 38.37 36.65 37.26 37.84
0
5
10
15
20
25
30
35
40
45
Column A Top Column A Middle
Column A BoDom
Column B Top Column B Middle
Column B BoDom
NegaKve Control
Qua
n=fica=
on Cycle (C
q)
54
the same depth was +/- 20%. The difference in the Mn coating seen in Column A for this
experiment may or may not be significant due to the measured variability by Tobiason et al
(2008). For Column B, the amount of Mn coated on the anthracite media is approximately the
same at the top and bottom sections of the column.
Figure 27. Average concentration of extractable Mn (mg) per gram of anthracite media from Column A (inoculated with MB4 and MB6) and Column B (non-inoculated)
4.4 In Situ Mn Reduction Vial Assay Results
Vial assays were completed that confirmed and evaluated anaerobic and aerobic Mn
reduction capability of five different Mn reducing strains (MB4, MB5, MB6, MB7 and S.
oneidensis MR-1). MnOx(s) reduction and bioavailability experiments using five different MnOx(s)
samples of various dates of synthesis were also completed. Corresponding inoculum was added
into semi-solid agar vials with MnOx(s) samples and light transmittance at 540 nm was measured
over time. Percent transmittance was used as a measurement tool in the vial assays for
evaluating the extent of observed Mn reduction.
0
5
10
15
20
25
30
35
40
45
Column A, Top Column A, BoDom Column B, Top Column B, BoDom
Average Extractable mg Mn/g An
thracite
55
4.4.1 S. oneidensis MR-1 Inoculum Concentration Correlation
The purpose of this study was to determine relationships between Mn reduction and Mn-
reducing microorganism concentration. S. oneidensis MR-1 inoculum was added into the Mn
reduction agar vials and incubated anaerobically at 30 °C for 7 days before light transmittance
was measured. The starting inoculum was quantified by plate count methods and was 50.5x10⁷
CFU/mL. This inoculum was serially diluted as needed and the desired CFU/mL added into
each vial was back calculated from the undiluted inoculum value. The final cell counts for the S.
oneidensis MR-1 inoculum added into vials was 50.5x10⁵, 50.5x10⁴, 50.5x10², 50.5, and 0
CFU/mL. Mn reduction in the vial resulted in MnOx(s) clearing, which increased light
transmission. Visually, an increase in MnOx(s) clearing was seen as the inoculum concentration
increased (Figure 28).
Figure 28. Visual inspection of Mn reduction anaerobic vial assay results from differing concentrations of S. oneidensis MR-1 inoculum after 7 days of incubation
S. oneidensis MR-1 inoculum concentrations in each vial were graphed against the
percent light transmittance measured at 540 nm in Figure 29. A direct correlation between the
concentration of the S. oneidensis MR-1 inoculum and apparent extent of Mn reduction was
seen.
Positive
Control
50.5x10⁵
CFU/mL
50.5x10⁴
CFU/mL
50.5x10²
CFU/mL
50.5
CFU/mL
Negative Control
56
Figure 29. Correlation of S. oneidensis MR-1 inoculum concentration to percent light transmittance at 540 nm in the Mn vial assay after 7 days of incubation
differences in Mn reduction can be seen, even though S. oneidensis MR-1 counts are similar in
all vials (Figure 3-22). For the 2008 and 7-8-15 MnOx(s) samples, even though the S. oneidensis
MR-1 count increases over time, Mn reduction is much slower than the other samples. The 7-28-
15, 11-18-15 and 1-11-16 MnOx(s) samples have the same concentration of S. oneidensis MR-1
but are able to reduce more MnOx(s). Because the 2008 and 7-8-15 vials have similar S.
oneidensis MR-1 counts but lower Mn reduction, this points to a lack of bioavailability of the
more aged MnOx(s) samples.
Figure 39. Average S. oneidensis MR-1 count (CFU/mL) of triplicate vials via qPCR analysis
1.00E+05
1.00E+06
1.00E+07
0 50 100 150 200 250
Shew
anel
la M
R-1
Cou
nt (c
fu/m
L)
Time of Data Point (Hours)
2008
7/8/15
7/28/15
11/18/15
1/11/16
67
4.4.6 Aerobic MB4 and MB6 MnOx(s) Age Study Results
The purpose of this study was to investigate bioavailability of MnOx(s) samples for Mn-
reducing microorganisms isolated from the water treatment built environment. MB4 and MB6
were inoculated into Mn reduction vials that contained the 2008, 7-28-15 and 1-11-16 MnOx(s)
samples. To measure Mn reduction, the percent light transmittance was measured over time.
Figure 40 shows the raw percent light transmittance data for three different MnOx(s) samples with
MB4 inoculum. For the initial 7 hours, Mn reduction for all of the samples are similar. After 30
days, the 1-11-16 sample had the greatest percent light transmittance value at 14%. The 7-28-15
sample had the next highest light transmittance at 10% and the 2008 sample had the lowest value
at 8%.
The percent transmittance data was normalized to the equivalent transmittance for a 1 g/L
MnOx(s) sample vial (Figure 41). When the data was normalized, a greater difference in Mn
reduction was seen between the three samples. The 2008 sample consistently had the lowest
amount of Mn reduction for the duration of the study, while the 1-11-16 sample had the highest
amount of Mn reduction for the entire study. The 7-28-16 sample had been dried at 103 °C for
24 hours, which promoted aging. A decrease in MB4 Mn reduction capability was seen due to
aging that occurred due to the heating process. These results help to support the hypothesis that
aged MnOx(s) samples have lower bioavailability and directly affect the Mn reduction capability
of microorganisms.
68
Figure 40. Percent transmittance at 540 nm of different MnOx(s) samples over time with MB4 inoculum
Figure 41. Percent transmittance data normalized to 1 g/L of different MnOx(s) samples over time with MB4 inoculum
0
2
4
6
8
10
12
14
16
0 5 10 15 20 25 30 35
Perc
ent T
rans
mitt
ance
(540
nm
)
Time of Data Point (Days)
2008
7/28/15
1/11/16
0
2
4
6
8
10
12
0 5 10 15 20 25 30 35
Perc
ent T
rans
mitt
ance
(540
nm
) N
orm
aliz
ed to
1 g
/L M
nOx(
s)
Time of Data Point (Days)
2008
7/28/15
1/11/16
69
The raw percent light transmittance data was graphed for three different MnOx(s) samples
with MB6 inoculum (Figure 42). After 30 days, the 1-11-16 sample had the greatest percent light
transmittance value at 11%. The 7-28-15 sample had the next highest light transmittance at 8%
and the 2008 sample had the lowest value at 7%. Figure 43 normalizes the percent transmittance
data to the equivalent transmittance for a 1 g/L MnOx(s) sample vial. As with the MB4 sample
vials, when the data was normalized, a larger difference in Mn reduction was seen between the
three samples. Again, the 7-28-15 sample was dried, which promoted aging, therefore a lower
Mn reduction was seen in the vials. The 2008 sample consistently had the lowest amount of Mn
reduction while the 1-11-16 sample had the highest amount of Mn reduction for the entire study.
The MB6 results further supported the hypothesis that the aged samples had low bioavailability
and affected the Mn reduction capability of microorganisms.
Figure 42. Percent transmittance at 540 nm of different MnOx(s) samples over time with
MB6 inoculum
0
2
4
6
8
10
12
0 5 10 15 20 25 30 35
Perc
ent T
rans
mitt
ance
(540
nm
)
Time of Data Point (Days)
2008
7/28/15
1/11/16
70
Figure 43. Percent transmittance data normalized to 1 g/L of different MnOx(s) samples over time with MB6 inoculum
It can also be noted that MB6 was able to reduce less MnOx(s) than MB4 in this study. For
the normalized percent transmittance trials, the MB4 vials reached a maximum percent light
transmittance of 10% compared to 8% for MB6.
Before each time point was measured on the spectrophotometer, each vial was visually
inspected. Clearing zones formed on the top of the 7-28-15 and 1-11-16 Mn reduction vials that
were inoculated with MB4 (Figure 44) and MB6 (not shown). From these results, it appeared
that MB4 and MB6 prefer to reduce Mn at the top of the vial. Semi-solid agar forms a dissolved
oxygen air gradient and the highest concentration of dissolved oxygen is found at the surface of
the agar (Claus 1989). Because the agar used was very fluid in nature, MB4 and MB6 were able
to locate to preferential areas with higher oxygen content with in the vial. There is no immediate
explanation as to why these microorganisms would prefer to reduce Mn in an area where higher
oxygen concentrations are probable. Since previous results showed a lower amount of aerobic
Mn reduction when compared to anaerobic Mn reduction (Table 17), these findings seem to be
contradictory to previous experiments.
0
1
2
3
4
5
6
7
8
0 5 10 15 20 25 30 35
Perc
ent T
rans
mitt
ance
(540
nm
) Nor
mal
ized
to
1 g/
L M
nOx(
s)
Time of Data Point (Days)
2008
7/28/15
1/11/16
71
Figure 44. Visual inspection of clearing zones at the top of the Mn reduction vials
4.5 Shake Flask Study
This study evaluated microbially mediated Mn desorption from anthracite media in an
aerobic environment using shake flasks inoculated with S. oneidensis MR-1 and two S.
oneidensis strains with mutations in genes (mtrA and mtrB) required for Mn reduction. Soluble
Mn release was monitored from the anthracite media in the bulk liquid. Mn extraction results of
the May 2015 Harwood Mills anthracite media showed that 36.5 mg Mn/mg anthracite was
previously coated onto the media at the water treatment plant. 2.5 g of the anthracite media was
added into each flask, resulting in a total of 91.1 mg Mn/mg anthracite available for biological
Mn reduction. The amount of inoculum added into each flask, enumerated from the plate count
method, is represented in Table 18. The volume removed for each sampling point was recorded
so the total volume in the flask would be known at all times and was considered mass balanced
related to soluble Mn released.
2008 MnOx(s)
Negative
Control
2008 MnOx(s)
MB4
7-28-15 MnOx(s)
Negative
Control
7-28-15 MnOx(s)
MB4
1-11-16 MnOx(s)
Negative
Control
1-11-6 MnOx(s)
MB4
72
Table 18. Inoculum Concentrations for Shake Flask Study
Inoculum Counts Final CFU in Flask
S. oneidensis MR-1 2.12x10⁶
S. oneidensis MR-1 ΔmtrA 1.9x10⁵
S. oneidensis MR-1 ΔmtrB 3.6x10⁶
The amount of Mn released during the shake flask study from the May 2015 Harwood
Mills anthracite media is presented in Figure 45. Data was analyzed as a percentage of Mn
released from the anthracite media as soluble Mn in the bulk liquid. The y-axis for Figure 41
was scaled to have a maximum value of 0.5% desorption to depict the negligible release and took
place in the shake flask study.
Figure 45. Soluble Mn mass release (sized 0.45 μm or less) as a fraction of Harwood Mills WTP accumulated Mn anthracite coating
0.0%
0.1%
0.2%
0.3%
0.4%
0.5%
0 5 10 15 20 25Perc
enta
ge M
n D
esor
ptio
n fr
om A
nthr
acite
Mn
Coa
ting
Time of sampling point (days)
MR-1
ΔmtrA
ΔmtrB
Anthracite only
73
5.0 DISCUSSION The main objective of this research was to examine the role of Mn-reducing
microorganisms in desorption of soluble Mn from MnOx(s) -coated filters once free chlorine had
been removed from the filter influent. This was accomplished through the completion of bench-
scale filter column studies along with development of a qPCR detection method for Mn-reducing
organisms. In addition to bench-scale laboratory filter studies, in situ Mn reduction vial assays
were completed to investigate Mn reduction capacity of several strains in aerobic and anaerobic
conditions. Vial assays were also used to determine the effects of Mn-reducing microorganism
populations on the kinetics of Mn reduction and to investigate the bioavailability of various
MnOx(s) samples.
The beginning of the discussion chapter will detail the pieces of research that most
appropriately relate to examining the role of Mn-reducing microorganisms in bench-scale filter
studies. Other noteworthy experimental outcomes that tangentially relate to microbially related
Mn reduction will then be discussed towards the end of the chapter.
5.1 Evidence for Microbially Mediated Reductive Dissolution of Mn in Bench-Scale Filter Column Studies
5.1.1 S. oneidensis MR-1 Inoculated Bench-Scale Column Studies
Evidence of reductive Mn dissolution was seen in the bench-scale filter column
experiment where the Harwood Mills anthracite media (collected March 2016) was inoculated
with S. oneidensis MR-1 (Figure 21). For example, a 10% increase in effluent Mn was seen in
the S. oneidensis MR-1 inoculated column over the non-inoculated column even while free
chlorine was applied to the filter. After free chlorine was removed from the column, the average
concentration of effluent Mn seen in the S. oneidensis MR-1 column was 20% greater than the
non-inoculated column. The observed Mn breakthrough for the non-inoculated column could
have been due to exhaustion of active sites on the media combined with a low amount of Mn
reduction from the native Mn-reducing microorganism present on the media. The differences in
Mn release between the inoculated and non-inoculated release can be attributed to the true
reductive Mn dissolution of the MnOx(s) surface by S. oneidensis MR-1.
74
From qPCR analysis, qualitatively there were more organisms that contained the mtrB
gene on the columns inoculated with S. oneidensis MR-1 than on the non-inoculated column.
The average Cq value for the S. oneidensis MR-1 inoculated columns was 27 compared to non-
inoculated column, which had an average Cq value of 38 (Figure 22). These findings
demonstrated that there were more microorganisms that had the ability to reduce Mn on the
inoculated column. S. oneidensis MR-1 was also recovered and quantified from all sections of
the anthracite media in the laboratory-scale columns and was not detected via qPCR methods
from the non-inoculated media (Figure 32). These findings verified the presence of S. oneidensis
MR-1 on the inoculated filter media for the duration of the experiment. Therefore, the increase
in Mn breakthrough can be attributed to the presence of S. oneidensis MR-1, a Mn reducing
organism.
The correlation of increased Mn in the column effluent and demonstration that S.
oneidensis MR-1 was present on the MnOx(s) surface at the end of experiment indicated that Mn-
reducing microorganisms were most likely responsible for the additional Mn desorption. Results
are in agreement with the study by Islam (2010), which concluded that Mn release from filter
media was caused by microbial activity. This research provided additional evidence that the
presence of Mn-reducing microorganisms on MnOx(s) media in a full-scale WTP could likely be
contributing to the observed Mn desorption phenomenon when free chlorine is removed.
5.1.2 MB4 and MB6 Inoculated Bench-Scale Column
For the column that was inoculated with MB4 and MB6 cultures, a small amount of
increased Mn breakthrough compared to the non-inoculated column was seen (Figure 25). This
increase in Mn breakthrough again demonstrates true reductive Mn dissolution caused by the
presence of Mn-reducing microorganisms. The percent differences in Mn breakthrough were not
as large when compared to the S. oneidensis MR-1 inoculum study (Figure 21). On average, the
inoculated column with MB4 and MB6 had a 5% greater Mn breakthrough percentage when
compared to the non-inoculated column when free chlorine was being applied. When the
application of free chlorine stopped, an average increase of 4% Mn breakthrough was seen in the
MB4/MB6 inoculated column compared to the non-inoculated column. Similar to the S.
oneidensis MR-1 inoculated column experiment, the observed Mn breakthrough for the non-
inoculated column was likely due to exhaustion of active sites on the media combined with a low
75
amount of Mn reduction from the native Mn reducing microorganism present on the media.
Event though differences in Mn release between the inoculated and non-inoculated columns were
small, the increase in Mn breakthrough was attributed to the true reductive Mn dissolution of the
MnOx(s) surface by MB4 and MB6.
The qPCR analysis for this column study was less conclusive when compared to
molecular results from the S. oneidensis MR-1 study. Evidence of increased concentrations of
the mtrB gene (Mn reducing microorganisms) was not seen. The Cq values for both columns at
all three depths were very similar in value. This result could either demonstrate that the amount
of Mn-reducing microorganisms were the same in both columns or that the mtrB primer set was
not able to adequately bind to the mtrB gene sequence of MB4 and MB6. It is more probable
that that the latter is true based off of prior qPCR analyses (Figure 14), where the Cq values for
both MB4 and MB6 were low. Experimental evidence of an increase in reductive Mn
dissolution in the columns inoculated with MB4 and MB6 helps to support this hypothesis.
It is also noteworthy to comment on the fact that MB4 and MB6 both have Mn oxidation
capability in addition to the capacity to reduce Mn. The environmental conditions, mechanisms
and reasons behind whether a microorganism chooses to oxidize or reduce Mn are not known.
During the MB4 and MB6 inoculated column experiment, for the last five days the non-
inoculated column had consistently greater Mn breakthrough values. The possibility that the
inoculated MB4 and MB6 microorganisms began to oxidize influent Mn or Mn adsorbed to the
MnOx(s) surface should not be ruled out.
5.1.3 Kinetic Differences in Bench-Scale Column Reductive Dissolution
The reasons for the large differences seen in Mn breakthrough results between the S.
oneidensis MR-1 and MB4/MB6 inoculated columns are unclear (Figures 21 and 25). Sizeable
differences in the amount of Mn reduction between S. oneidensis MR-1, MB4 and MB6 were
also observed in the in situ vial assays (Table 17). S. oneidensis MR-1 reduced a much larger
amount of Mn (both aerobically and anaerobically) and in a shorter time frame when compared
to MB4 and MB6. The dissimilatory Mn reduction mechanisms of MB4 and MB6 have yet to be
studied and it could be possible that those mechanisms are distinctive from that of S. oneidensis
MR-1. Organic carbon oxidation is often linked to Mn reduction (Lovley 1988) and some
microorganisms may prefer one carbon source over another. S. oneidensis MR-1 may have had a
76
competitive advantage or preference over MB4 and MB6 for acetate as the carbon source in filter
studies. More research is needed to discern why and under what conditions that certain
microorganisms are able to reduce MnOx(s) from filter media.
5.1.4 Mn-Reducing Microorganism Viability in the Presence of Chlorine
For the column study with S. oneidensis MR-1 inoculum, the inoculum and any
organisms present on the media were exposed to a free chlorine Ct of 4,400 mg/L*min.
Shewanella species are Gram negative and are therefore non-spore-forming (Venkateswaran
1999). This is in contrast to MB4 and MB6, which are gram-positive Bacillus sp. that are spore-
formers. There was a 5-log reduction in qPCR detectable cell counts of S. oneidensis MR-1 from
the time of inoculation until the end of the study. Only 3.9x10² CFU/mL of S. oneidensis MR-1
remained on the MnOx(s) surface at the end of that study even though large differences in Mn
breakthrough are still seen when compared to the column with no additional inoculum. This
leads to the conclusion that small numbers of Mn-reducing microorganisms, even if not able to
form spores, are able to remain viable on the MnOx(s) surface and reduce a detectable amount of
Mn in the presence of free chlorine. It should be noted that the average amount of pre-filter free
chlorine typically applied to the Harwood Mills WTP filters is 2.9 mg/L (Hawkins 2016). This
concentration of free chlorine is about five times greater than the amount of free chlorine applied
to the filter in the bench-scale filter column studies with added Mn reducer inoculum. The
presence of Mn-reducing microorganisms on the Harwood Mills WTP MnOx(s) media coating
was confirmed with a low level of detection of the mtrB gene via qPCR. It is notable that the
Mn-reducing microbes present on the MnOx(s) surface were able to remain viable while the filter
was in service in the presence of much higher chlorine Ct values. The formation of biofilms
protects microorganisms from the effects of chlorine (LeChevallier 1988). The formation of a
biofilm on the surface of the anthracite media could have helped to promote the viability of some
of the inoculated S. oneidensis MR-1 organisms.
5.2 Factors that Affected Mn Breakthrough in Bench-Scale Filter Column Studies
5.2.1 MnOx(s) Coating Age and Bioavailability
Much is still unknown about the forms and phases of MnOx(s) that are present in filter
media coatings; further this might affect the bioavailability of Mn for reductive dissolution.
77
Typical anthracite or sand filtration media beds have a long service life due to media durability
(Edzwald 2011), which allows for a large amount of MnOx(s) coating to form during many years
of operation. MnOx(s) coatings on anthracite media have been shown to form a tree-ring-like
structure (Tobiason 2008). Little is known about the differing characteristics of the MnOx(s)
coating layers, as aging inevitably occurs through in service use. As in the Harwood Mills WTP,
the anthracite media from Filter 1 had been in operation and accumulating an MnOx(s) coating for
28 years. Differing rates of Mn reactivity have been seen in laboratory testing because of
variations in MnOx(s) crystalline structure and surface area (Stone 1987). Burdige et al. (1992)
showed that S. oneidensis MR-1 was able to reduce a greater amount of two less “aged”
crystalline forms of Mn oxide (birnessite and 6-MnO2(s)) when compared to a highly crystalline
form MnO2(s), pyrolusite. The conclusion from the Burdige et al. (1992) study was that
mineralogy, crystalline structure and surface area all play an important role in the bioavailability
of Mn oxides and the rate of biotic Mn reduction.
When the Mn desorption phenomenon has been observed in a full-scale WTP, typically
there is a period of effluent Mn concentrations exceeding influent Mn. Over time, the amount of
Mn released in the effluent ceases to exceed the influent and evidence of outright Mn release
from the media is no longer evident. In comparison to this trend, the column studies that utilized
the Harwood Mills WTP filter media did experience a periodic increase in effluent Mn and an
eventual return to a steady state condition of Mn release. Even though, effluent Mn never
exceeded the influent concentration, microbially mediated Mn reduction of bioavailable MnOx(s)
from the anthracite media was taking place. An acceptable working hypothesis is that the MnOx(s)
layers present on the coating had undergone changes in chemistry such that progression towards
a more crystalline structure was seen the longer that the coating had been present in the system.
The Mn-reducing microorganisms were potentially able to reduce the less crystalline or less
“aged” forms of MnOx(s) on the media surface, which caused the initial rise of effluent Mn. This
result is supported by the demonstration that Mn reduction of the more aged 2008 MnOx(s)
sample was substantially lower in the in situ vial assays (Figures 36 and 37). Once the
bioavailable forms of MnOx(s) had been exhausted, the MnOx(s) that was left on the surface was
hypothetically more crystalline in nature and was less bioavailable. Effluent Mn levels then
decreased from a decline in microbially mediated Mn reduction of the MnOx(s) surface due to lack
of bioavailability.
78
It is possible that the concentration of Mn-reducing microorganisms and forms of
bioavailable MnOx(s) that were present during the inoculated filter column studies were not
suitable for the observation of the Mn desorption phenomenon where the effluent Mn exceeds
influent Mn concentration. The kinetics or concentration of Mn-reducing bacteria may not have
been high enough to establish conditions where effluent Mn exceeded the influent.
It is notable that the amount of extractable Mn was significantly lower in the top 2-inches
of the anthracite media for both the S. oneidensis MR-1 and MB4/MB6 inoculated columns. As
noted in Chapter 4, natural variability of Mn coating concentration can be as great as +/- 20%
(Tobiason 2008). It is known MnOx(s) deposition is a function of depth, with the greatest MnOx(s)
concentrations being found at the top of a column depth (Tobiason 2008). This presumably
means that the MnOx(s) formed there is less aged and would be more bioavailable. Since this
trend was seen in both column studies, it could be hypothesized that the Mn reducing
microorganisms were able to readily reduce the less aged MnOx(s) formed at the top of the
column. This resulted the decrease in extractable Mn at the top of the S. oneidensis MR-1 and
MB4/MB6 inoculated columns. The decrease in extractable Mn at the top of the column was not
observed in either of the non-inoculated columns for both S. oneidensis MR-1 and MB4/MB6
experiments.
5.2.2 pH
MnOx(s) surface regeneration by molecular oxygen (in the absence of free chlorine) and
microbial processes are both affected by pH. Some of the changes in abiotic release of Mn from
the media can be attributed to the effects of pH on the regeneration of active sites. The impact of
pH dependence on microbially mediated Mn reduction is not known and should be considered in
evaluation of observed increases or decreases in Mn release. The behavior of Mn oxidizing
microorganisms that are present on filtration media have been shown to be effected by pH
(Hoyland 2014). The authors showed that Mn oxidizing microorganisms were able to begin to
oxidize Mn earlier at pH conditions between 6.3 - 6.7 when compared to 7.0 – 7.3, which
demonstrated that pH was directly tied to microbial Mn oxidation mechanisms and possible
enzymatic activity. Therefore, the possibility of increased or decreased Mn reduction due to pH
conditions should not be ruled out.
79
5.2.3 TOC
Bioavailable DOC loading into a filtration process is typically around 0.5 – 2.0 mg/L
(Yapsakli 2010). All of the carbon loading (acetate) for experiments in this research for column
studies was considered 100% BDOC. For the Harwood Mills WTP, the average TOC demand
across Filter 1 was 0.59 mg/L TOC (Hawkins 2016). Consequently, the initial TOC loading of
0.5 mg/L as C was considered a representative BDOC across a WTP filter during operation.
When 0.5 mg/L as C was added into the inoculated filter, maximum Mn breakthrough values of
54% were seen. A large increase in Mn breakthrough in the inoculated column to 86% was seen
when TOC loading was increased to 12 mg/L as C. The surge in Mn breakthrough, which
correlated to the increase in TOC, could be credited to the increased reductive Mn dissolution
activity of S. oneidensis MR-1 on the media. Simple carbon containing compounds, like sugars
or amino acids, can be fully oxidized by Mn-reducing microorganisms in a reducing environment
(Lovley 2004). Lovely and Philips showed that S. oneidensis MR-1 coupled the oxidation of
electron donors, similar to the acetate supplied in the columns, to Mn reduction. It should be
noted that the environment with in the column would probably not be considered reducing since
oxygen entrained in the influent waters would be present. Additionally, a large majority of
organic matter that is oxidized in sedimentary environments is directly linked to Fe or Mn
reduction (Burdige 1992). The columns that were inoculated with S. oneidensis MR-1 showed a
greater percentage in Mn breakthrough for the duration of the experiment when compared to the
column that did not have any additional inoculum.
It is plausible that the influent concentration of 0.5 mg/ and 11 mg/L TOC as C were not
at high enough carbon concentrations to see evidence of effluent Mn exceeding influent Mn
concentrations. In the bench scale laboratory study by Islam (2010) where Mn desorption was
seen, carbon dosing was 4-μM sodium acetate (56 mg/L as C). As stated above, typical influent
TOC loading in a treatment plant is 25 to 100 times lower than the carbon concentration used in
Islam’s laboratory study. True Mn desorption was seen in the study by Islam, but application of
the results in a full scale WTP could be questioned. Interestingly in Islam’s study, when carbon
was removed from the filter, Mn desorption ceased.
It is apparent that some amount of bioavailable carbon is required for Mn desorption to
be seen in laboratory experiments and full-scale treatment facilities. Effluent concentrations of
Mn did not exceed influent concentrations in research conducted for this thesis where 0.5 or 11
80
mg/L as C was added into the columns. This leads to the assumption that bioavailable carbon
may be incorporated into observed Mn desorption phenomenons but the nature and role of
carbon concentration and Mn bioavailability is unclear.
5.2.4 Mn Reducing Microorganisms and Required MnOx(s) Contact
Results from the shake flask study failed to demonstrate reductive Mn dissolution from
MnOx(s) coated Harwood Mills’ anthracite filter media (Figure 45). The shake flask environment
into which the S. oneidensis MR-1 were placed did not force the organism to attach to the
MnOx(s) media surface. In contrast for in bench-scale laboratory filter column studies, the
naturally occurring microbes or added inoculum (S. oneidensis MR1 or MB4/MB6) were forced
to adhere to the MnOx(s) surface or be washed out through downflow or upflow hydraulics. For S.
oneidensis MR-1 to reduce Mn, the organism must be in direct contact with the oxide surface
(Meyers 1988). This experiment most likely did not succeed because S. oneidensis MR-1 was
not required to stay attached to the surface of the anthracite media and could reside in the bulk
liquid media.
5.3 Molecular Detection Methods
A qPCR detection method was created to qualitatively compare amounts of the mtrB
gene in laboratory and environmental samples. Overall, this detection method was able to
relatively compare the amount of microorganisms in a sample that contained the mtrB gene
(Figures 23 and 26). Consequently, this qPCR method was able to compare samples to
determine which contained higher quantities of Mn reducing microorganisms. This method
appeared to detect certain Mn-reducing organisms at greater levels than others. The mtrB
primers demonstrated strong detection for S. oneidensis MR-1 and MB5 (Bacillus cereus). The
mtrB primers did not detect MB4 (Bacillus pumilus), MB6 (Bacillus cereus) or MB7
(Lysinibacillus fusiformis) well. The reason for the preferential binding of primers for certain
microorganisms, even when identified as the same genus and species (MB5 and MB6), is not
known. The most likely reason for this would be due to sequence dissimilarities in the mtrB gene
for those organisms. Sequences for the mtrB gene from the NCBI GenBank database contained
a moderate level of variability, which could demonstrate low conservation of that gene or
uncertainty in gene sequence. None of the sequences found from the NCBI GenBank were
Bacillus sp. which could be another reason why detection for some Bacillus sp. is low. A much
81
larger subset of mtrB gene sequences would be required for additional MUSCLE alignments to
strengthen the binding of the mtrB primers to Bacillus sp. and others.
5.4 Mn Desorption Prevention for Full-Scale WTP
This research demonstrates that the Mn-reducing microorganism population residing on
the MnOx(s) surface play an important role in desorption of Mn from filter media. If a WTP
desires to cease pre-filter chlorination and maintain a biologically active filter process instead,
the occurrence of the Mn desorption phenomenon could be of concern. The application of a
sustained high dose of chlorine as a shock treatment to the filter media could help to reduce
viability of the Mn-reducing microorganisms on the media. Outright replacement of the filter
media could also be an option. The cost of the replacement of the media would have to be
considered in lieu of a shock chlorine treatment, which would be the most cost effective option.
82
6.0 CONCLUSIONS
6.1 Conclusions
Bench-scale filter column studies have demonstrated the potential of Mn reducing
microorganisms to contribute to the Mn desorption phenomenon seen in WTPs when pre-
filtration free chlorine is removed. The exact conditions under which effluent will Mn exceed
influent Mn concentrations are not known but the following conclusions can be made from the
experimental results:
1. Microbially mediated desorption is possible when sufficient Mn-reducing
microbial populations are present on MnOx(s) surfaces in column setups
2. Microbially mediated desorption is likely a major contributor to the Mn
desorption phenomenon seen in full-scale WTPs
3. Mn-reducing microorganism population and reduction kinetics affect how MnOx(s)
is desorbed from filter media
4. Both gram positive and gram negative Mn-reducing microorganisms residing on
the MnOx(s) surface are able to remain viable and reduce Mn after contact with free
chlorine
5. MnOx(s) age and crystalline structure plays an important role in bioavailability to
Mn-reducing organisms
6. MnOx(s) bioavailability could affect the duration of elevated effluent Mn during
times of observed Mn desorption
6.2 Future Research
This research provided evidence that Mn-reducing microorganisms do play an important,
but undefined role, in the Mn desorption phenomenon. The operational and plant conditions that
causes the Mn desorption to occur are still not known. Investigation into these following areas
would help to further understand the causes of Mn desorption seen in WTPs when pre-filter free
chlorine is removed:
1. Isolation of a variety of Mn-reducing microorganisms in order to collect
numerous mtrB sequences for a more complete and encompassing MUSCLE
alignment
2. Development of molecular methods for detecting the expression of the mtrB gene
83
3. Further investigation of the roles that pH, carbon loading and Mn-reducing
bacteria concentration play in microbially mediated MnOx(s) reduction
4. Advanced analysis and identification of the structure and bioavailability of coated
MnOx(s) on a media as to predict Mn desorption patterns
84
7.0 WORKS CITED
Bierlein, K. A. (2012). Modeling manganese sorption and surface oxidation during filtration. Blacksburg, Va University Libraries, Virginia Polytechnic Institute and State University. Burdige, D. D., Surya; Nealson, Kenneth (1992). "Effects of manganese oxide mineralogy on microbial and chemical manganese reduction." Geomicrobiology Journal 10(1): 27-48. Burdige, D. J. (1993). "The biogeochemistry of manganese and iron reduction in marine sediments." Earth-Science Reviews 35: 249-284. Burnes, B. S. (2000). Identification and Characterization of Genes Required for Mn(IV) Reduction by Shewanella putrefaciens, Georgia Institute of Technology. Doctor of Philosophy. Carlson, K. H. K., William R. (1999). "Modeling Manganese Oxidation with KMnO4 for Drinking Water Treatment." Journal of Environmental Engineering 125(10): 892-896. Cerrato, J. M. F., Joseph O.; Dietrich, Andrea M., Knocke, William R.; McKinney, Chad W.; Pruden, Amy (2008). "Manganese-oxidizing and reducing microorganisms isolated from biofilms in chlorinated drinking water systems." Water Research 44: 3935-3945. Cerrato, J. M. R., Lourdes P.; Alvarado, Carmen N.; Dietrich, Andrea M. (2006). "Effect of PVC and iron materials on Mn(II) deposition in drinking water distribution systems." Water Research 40(14): 2720-2726. Claus, W. (1989). Understanding Microbes: A Laboratory Textbook for Microbiology. New York, NY, W. H. Freeman and Company. Costa, L. G. A., Michael (2015). Manganese in health and disease. Cambridge, The Royal Society of Chemistry. Edgar, R. C. (2004). "MUSCLE: multiple sequence alignment with high accuracy and high throughput." Nucleic Acids Research 32(5): 1792-1797. Edzwald, J. (2011). Water Quality and Treatment: A Handbook of Drinking Water. EPA (1979). National Secondary Drinking Water Regulations. 143.3. Gabelich, C. G., Fredrick W; Knocke,William R.; Connie C. Lee (2006). "Sequential Manganese Desorption and Sequestration in Anthracite Coal and Silica Sand Filter Media." American Water Works Association 98(5): 116-127. Hach (2016a). "Determination of Low Range Manganese by the PAN method." from http://www.hach.com/manganese-reagent-set-lr-pan-10-ml/product?id=7640180304.
85
Hach (2016b). "Aluminum by the Eriochrome Cyanine R (ECR) Method." from http://www.hach.com/aluminum-reagent-set-eriochrome-cyanine-r-ecr-method-50-ml/product?id=7640178472. Hach (2016c). "Free chlorine determination by the DPD Free Chlorine method." from http://www.hach.com/dpd-free-chlorine-reagent-powder-pillows-10-ml-pk-300/product?id=7640187689&callback=qs. Hawkins, R. (2016). L. Swain. Haynes, E. N. S., Heidi; Kuhnell, Pierce; Alden, Jody; Barnas, Mary; Wright, Robert O.; Parsons, Patrick J.; Aldous, Kenneth M.; Praamsma, Meredith L.; Beidler, Caroline (2015). "Manganese Exposure and Neurocognitive Outcomes in Rural School-Age Children: The Communities Actively Researching Exposure Study (Ohio, USA)." Environmental health perspectives 123(10): 1066-1071. Hinds, G. (2015). The Impact of Aluminum on the Initiation and Development of MnOx(s) Coatings for Manganese Removal. Virginia Polytechnic Institute and State University Master of Science, Environmental Engineering. Hoyland, V. K., William; Falkinham, Joseph III; Pruden, Amy; Singha, Gargi (2014). "Effect of drinking water treatment process parameters on biological removal of manganese from surface water " Water Research 66: 31-39. Islam, A. A. (2010). Manganese removal by media filtration: Release and Complexation. Civil and Environmental Engineering, University of Massachusets. Doctor of Philosophy. Johnson, K. S. (2006). "Manganese Redox Chemistry Revisited." Science 313(5795): 1896-1897. Jones, S. N., Ryan; McMahon, Katherine (2009). "Evidence for structuring of bacterial community composition by organic carbon source in temperate lakes." Environmental Microbiology 11(9): 2463-2472. Knocke, W. R., Occiano, Suzanne C., Hungate, Robert (1991). "Removal of Soluble Manganese by Oxide-coated Filter Media: Sorption Rate and Removal Mechanism Issues." Journal (American Water Works Association) 83(8): 64-69. Knocke, W. R. O., Suzanne C.; Hungate, Robert (1991). "Removal of Soluble Manganese by Oxide-coated Filter Media: Sorption Rate and Removal Mechanism Issues." American Water Works Association 83(8): 64-69. Kristoffersen, S. M. R., Solveig; Tourasse, Nicolas J.; Økstad, Ole Andreas; Kolstø, Anne-Brit; Davies, William (2007). "Low concentrations of bile salts induce stress responses and reduce motility in Bacillus cereus ATCC 14579 [corrected]." Journal of Bacteriology 189(14): 5302-5313.
86
LeChevallier, M. C., C; Lee, R (1988). "Factors promoting survival of bacteria in chlorinated water supplies." Applied and Environmental Microbiology 54(3): 649-654. Lin, H. S., Nadia H.; DiChristina, Thomas J. ; Taillefert, Martial (2012). "Microbial Mn(IV) reduction requires an initial one-electron reductive solubilization step." Geochimica et Cosmochimica 99: 179-192. Lovley, D. H., Dawn.; Nevin, Kelly (2004). Dissimilatory Fe(III) and Mn(IV) Reduction. England, Elsevier Science & Technology. 49: 219-286. Lovley, D. P., E. (1988). "Novel mode of microbial energy metabolism: organic carbon oxidation coupled to dissimilatory reuction of iron or manganese." Applied Environmental Microbiology 51: 683-689. Madison, A. S. (2012). Biogeochemical cycling of soluble manganese(III) in marine (pore)waters. University of Delaware. Doctor of Philopsophy. Meyers, C. a. N., K. (1988). "Bacterial manganese reduction and growth with manganese oxide as the sole electron acceptor." Science 240: 1319-1321. MoBio Laboratories, I. (2016). "PowerSoil DNA Isolation Kit." from https://mobio.com/powersoil-dna-isolation-kit.html. Morgan, J. S., Werner (1964). "Colloid-Chemical Properties of Manganese Dioxide." Journal of Colloid Science 19: 347-359. Nealson, K. H. M., C. R. ; Wimpee, B. B. (1991). "Isolation and identification of manganese-reducing bacteria and estimates of microbial Mn(IV)-reducing potential in the Black Sea." Deep-Sea Research 38(2): S907-S920. Osterman, A. L. R., Jennifer L; Beliaev, Alexander S; Zhulin, Igor B; Auchtung, Jennifer M; Driscoll, Michael E; Tiedje, James M; Pinchuk, Grigoriy; Romine, Margaret F; Serres, Margrethe H; Rodionov, Dmitry A; Saffarini, Daad A; Spormann, Alfred M; Gardner, Timothy S; Rodrigues, Jorge L. M; Nealson, Kenneth H; Fredrickson, James K (2008). "Towards environmental systems biology of Shewanella." Nature Reviews Microbiology 6(8): 592 - 603. Ross, D. E. (2009). Kinetic and biochemical analysis of electron transfer in dissimilatory metal reduction by Shewanella oneidensis MR-1. Biochemistry and Molecular Biology, Pennsylvania State University. Doctor of Philosophy. Sain, A. G., Ashley; Dietrich, Andrea M. (2014). "Assessing taste and visual perception of Mn(II) and Mn(IV)." Journal of the American Water Works Association 106(1): E32-E32. Schicklberger, M. B., Clemens; Schuetz, Bjoern; Heide, Heinrich; Gescher, Johannes (2011). "Involvement of the Shewanella oneidensis Decaheme Cytochrome MtrA in the Periplasmic
87
Stability of the Alpha-Barrel Protein MtrB." Applied and Environmental Microbiology 77(4): 1520-1523. Sly, L. I., M. C. Hodgekinson and V. Arunpairojana (1990). "Deposition of manganese in a drinking water distribution system." Applied and Environmental Microbiology 56(3): 628-639. Stone, A. (1987). "Microbial metabolites and the reductive dissolution of manganese oxides: Oxalate and pyruvate." Geochimica et Cosmochimica Acta 51(4): 919-925. Sun, L. D., Yangyang; Shi, Miaomiao; Jin, Miao; Zhou, Qing; Luo, Zhao-Qing; Gao, Haichun (2014). "Two residues predominantly dictate functional difference in motility between Shewanella oneidensis flagellins FlaA and FlaB." The Journal of biological chemistry 289(21): 14547-14559. Szeinbaum, N. J. L. B. a. T. J. D. (2014). "Electron transport and protein secretion pathways involved in Mn(III) reduction by Shewanella oneidensis." Environmental Microbiology Reports 6(5): 490-500. Thamdrup, B. (2000). "Bacterial manganese and iron reduction in aquatic sediments." Advances in Microbial Ecology 16: 41 - 84. Tilak, A. S. O., S.; Williford, C. W.; Fox, G. A.; Sobecki, T. M.; Larson, S. L. (2013). "Formation of Manganese Oxide Coatings onto Sand for Adsorption of Trace Metals from Groundwater." JOURNAL OF ENVIRONMENTAL QUALITY 42(6): 1743-1751. Tobiason, J. E. I., A.A.; W..R. Knocke; J. Goodwill; P. Hargette; R. Bouchard; and L. Zuravnsky (2008). "Characterization and Performance of Filter Media for Manganese Control." Water Research Foundation. Venkateswaran, K. M., Duane; Dollhopf, Michael; Lies, Douglas; Saffarini, Daad; MacGregor, Barbara; Ringelberg, David; White, David; Nishijima, Miyuki; Sano, Hiroshi; Burghardt, Jutta; Stackebrandt, Erko; Nealson, Kenneth (1999). "Polyphasic taxonomy of the genus Shewanella and description of Shewanella oneidensis sp. ." International Journal of Systematic Bacteriology 49: 705-724. Womba, P. P., David; Bellamy, Bill; Kjartanson, Kelly (2000). "Biological Filtration for Ozone and Chlorine DBP Removal." Ozone: Science & Engineering: The Journal of the International Ozone Association 22(4): 393-413. Yang, W. Z., Zhen; Zhang, Zhongming; Chen, Hong; Liu, Jin; Ali, Muhammad; Liu, Fan; Li, Lin (2013). "Population Structure of Manganese-Oxidizing Bacteria in Stratified Soils and Properties of Manganese Oxide Aggregates under Manganese-Complex Medium Enrichment." PLoS One 8(9). Yapsakli, K. C., Ferhan (2010). "Effect of type of granular activated carbon on DOC biodegradation in biological activated carbon filters." Process Biochemistry 45(3): 355-362.