The Effects of Money Growth on Inflation and Interest Rates Across Spectral Frequency Bands Mark A. Thoma Journal of Money, Credit and Banking, Vol. 26, No. 2. (May, 1994), pp. 218-231. Stable URL: http://links.jstor.org/sici?sici=0022-2879%28199405%2926%3A2%3C218%3ATEOMGO%3E2.0.CO%3B2-7 Journal of Money, Credit and Banking is currently published by Ohio State University Press. Your use of the JSTOR archive indicates your acceptance of JSTOR's Terms and Conditions of Use, available at http://www.jstor.org/about/terms.html. JSTOR's Terms and Conditions of Use provides, in part, that unless you have obtained prior permission, you may not download an entire issue of a journal or multiple copies of articles, and you may use content in the JSTOR archive only for your personal, non-commercial use. Please contact the publisher regarding any further use of this work. Publisher contact information may be obtained at http://www.jstor.org/journals/ohio.press.html. Each copy of any part of a JSTOR transmission must contain the same copyright notice that appears on the screen or printed page of such transmission. JSTOR is an independent not-for-profit organization dedicated to and preserving a digital archive of scholarly journals. For more information regarding JSTOR, please contact [email protected]. http://www.jstor.org Tue May 1 18:19:16 2007
Transcript
The Effects of Money Growth on Inflation and Interest Rates Across SpectralFrequency Bands
Mark A. Thoma
Journal of Money, Credit and Banking, Vol. 26, No. 2. (May, 1994), pp. 218-231.
Journal of Money, Credit and Banking is currently published by Ohio State University Press.
Your use of the JSTOR archive indicates your acceptance of JSTOR's Terms and Conditions of Use, available athttp://www.jstor.org/about/terms.html. JSTOR's Terms and Conditions of Use provides, in part, that unless you have obtainedprior permission, you may not download an entire issue of a journal or multiple copies of articles, and you may use content inthe JSTOR archive only for your personal, non-commercial use.
Please contact the publisher regarding any further use of this work. Publisher contact information may be obtained athttp://www.jstor.org/journals/ohio.press.html.
Each copy of any part of a JSTOR transmission must contain the same copyright notice that appears on the screen or printedpage of such transmission.
JSTOR is an independent not-for-profit organization dedicated to and preserving a digital archive of scholarly journals. Formore information regarding JSTOR, please contact [email protected].
THE EXISTENCE OF A CAUSAL RELATIONSHIP between changes in money growth and changes in both the inflation rate and the nominal interest rate is generally acknowledged. However, less agreement exists on the tim- ing and magnitude of the response of inflation and the nominal interest rate to mon- ey shocks. Many economists believe that a positive shock to money growth brings about two opposing effects on the nominal interest rate. The first, known as the li- quidity effect, is the fall in the nominal interest rate necessary to induce agents to hold additional real money balances. The second, known as the anticipated inflation effect, is the rise in the nominal interest rate due to the increase in expected inflation brought about by the increase in money growth. In the short run, it is often argued that the liquidity effect dominates the anticipated inflation effect. There is less agreement on the long-run effect of money shocks on interest rates. The time period required for the inflation resulting from money growth shocks to be fully realized, and whether the nominal interest rate moves one to one with expected inflation, are both unsettled questions that have stimulated a considerable body of research.'
The effect of money shocks on prices is less controversial than the effect of mon- ey on interest rates. An increase in money growth increases aggregate demand and brings about an increase in inflation. However, the magnitude and timing of the ef- fects is open to question. Models featuring errors in forecasting prices or inflation typically assume that money growth shocks have a fairly immediate effect on prices,
1. Notable papers include Fisher (1930), Friedman (1968), Cagan (1963, 1972), Friedman and Schwartz (1963), Gibson and Kaufman (1968), Cagan and Gandolfi (1969), Gibson (1970), Stokes and Neuberger (1979), Summers (1983), Melvin (1983), Mishkin (1983), Stokes (1983), Geweke (1984), Cochran (1989), Romer and Romer (1989). and Christian0 (1991).
MARKA. THOMAis assistantprofessor of economics at the University of Oregon.
Journal of Money, Credit, and Banking, Vol. 26, No. 2 (May 1994) Copyright 1994 by The Ohio State University Press
M A R K A . THOMA : 219
while Keynesian and New Keynesian models assume that the effects of money growth shocks on inflation take much longer to be fully realized, particularly mod- els where prices adjust sluggishly due to menu costs, S-s pricing rules, the PAYM insight, time dependent pricing rules, or imperfect c~mpet i t ion .~
Though work on the relationship between money growth, inflation, and the nomi- nal interest rate is generally conducted in the time domain, some authors have used frequency domain techniques to examine these relationships. Lucas (1980) and Summers (1983) use spectral filtering procedures to examine the neutrality of mon- ey and the Fisher hypothesis. Whiteman (1984) demonstrates that the frequency do- main procedures used by Lucas and Summers can outperform time domain tests involving sums of distributed lag coefficients. Geweke (1982, 1984) expands upon the notion of Granger causality and shows how to measure the short-term or long- term relationship between time series by their feedback within a frequency band. Cochran (1989) shows that the liquidity effect dominates the anticipated inflation effect in the short run, that money growth and interest rates are negatively related in the short run, and provides a compelling argument for the use of band spectral filter- ing procedures to examine the relationship between money, prices, and interest rates.
The papers discussed in the preceding paragraph document the usefulness of spectral filtering procedures for examining the dynamic relationship between time series. This paper uses band spectral regression techniques to examine the dynamic properties of the responses of inflation and interest rates to money shocks. The pro- cedure identifies the frequency movements that are most important in the relation- ships between money growth and inflation, and between money growth and nominal interest rates. In doing so, it provides answers to questions about whether high- or low-frequency movements in money growth cause movements in inflation and the nominal interest rate, and whether the movements caused are themselves of high or low frequency.
In an earlier paper, Thoma (1992) examines the dynamic response of output to money shocks and finds that relatively low- (eighteen months or longer) frequency movements in money growth cause similarly low-frequency movements in indus- trial production. This result is inconsistent with the new classical view that rela- tively high-frequency temporary shocks to money growth are the source of lower- frequency cyclical movements in output. This paper extends the investigation to in- flation and the nominal interest rate. The techniques used in this paper reveal that cycles in the growth rate of M1 from one to two years long produce higher- frequency cycles in inflation, and two distinct sets of higher-frequency cycles in changes in the nominal interest rate.3 The timing of these cycles corresponds closely to the timing of the liquidity effect and the anticipated inflation effect identified in
2. For a discussion of these models, see the survey by Fischer (1988). Empirical and theoretical refer- ences on these issues are extensive. Notable papers and sources of additional references include Cagan (1963), Lucas (1972), Barro (1978), Barro and Rush (1980), Okun (1981), Geweke (1982), Blanchard (1988), and Friedman and Kuttner (1992).
3. The change in the nominal interest rate rather than the level is used in the empirical model because, as Stock and Watson (1989) show, the level of the nominal interest rate contains a unit root.
220 : MONEY, CREDIT, AND BANKING
previous research. This result, which is derived from a vector autoregressive (VAR) model incorporating reduced-form relationships, is consistent with a variety of Keynesian and new Keynesian models capable of producing the liquidity and antici- pated inflation effects. However, the result that relatively low-frequency movements in money growth, movements that Lucas (1980)terms predictable, cause the move- ments in the interest rate appears inconsistent with models where forecast errors are the source of the liquidity and anticipated idat ion effects. This conclusion is robust to dropping output from the empirical model and to measuring money as M2.
The paper begins by obtaining baseline money-inflation and money-interest rate causality results. Then, band spectrum regression techniques similar to Engle (1974, 1978) are used to remove particular frequencies from money growth, infla- tion, and the change in the interest rate. After removing the frequencies, money- inflation and money-interest rate causality tests are repeated and any changes in the money-inflation and money-interest rate causality statistics relative to the baseline results are noted. If the excluded frequencies are responsible for the baseline results, there should be a drop in significance relative to the baseline results. Conversely, if the excluded frequencies are unrelated to the causality results, then removing this noise from the system through the filtering of particular frequencies should strength- en the estimated causal structure. Thus, comparing the F-statistics for causality from the filtered and unfiltered models gives information on how important the ex- cluded frequencies are in the baseline results.
1. THE BASELINE CAUSALITY RESULTS
Obtaining baseline results is relatively straightforward. The data used is monthly and covers the sample period 1959:1 to 1989: 12, with appropriate allowances made for differencing and lags. The measure of aggregate activity used is industrial pro- duction. Money is measured as MI , the interest rate is the three-month T-bill rate, and the price level is the CPI. All data are from the Citibase Data Bank.
As in Stock and Watson (1989),unit roots are removed from the logs of money, output, and the price level and from the level of the interest rate. Thus, the basic model is
where Z , = [Y,,M,,P,,R,]T, Y , is the growth rate of industrial production, M , is mon- ey growth, P, is the inflation rate, and R, is the change in the nominal interest rate. Three separate models of the trend component f ( t ) are examined, no trend ( f ( t )=
c,), a linear trend ( f ( t )= c, + c,t), and a quadratic trend ( f ( t )= c, + c l t + c2t2). The A, are coefficient matrices, u, is the column vector of disturbances, and J, the lag length of the VAR, is 12.
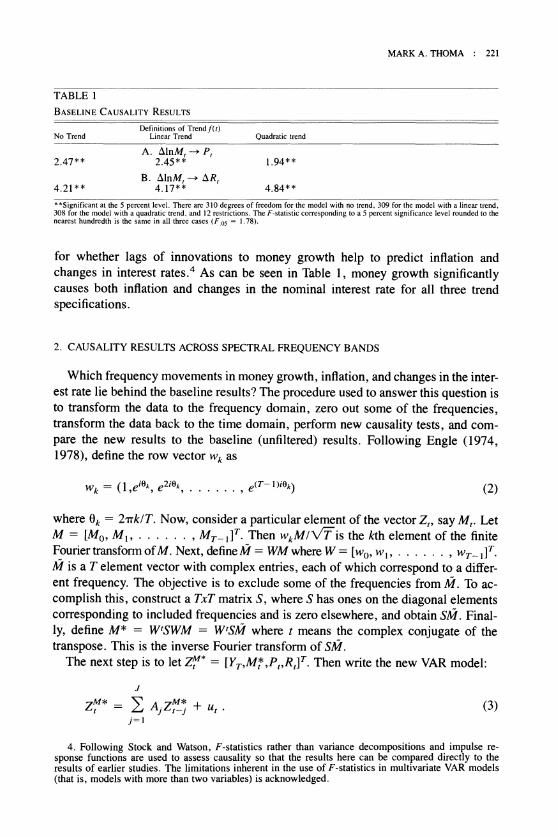
Table 1 summarizes the baseline causality results. The table contains F-statistics
MARKA. THOMA : 221
TABLE 1
BASELINECAUSALITYRESULTS
Defln~t~onsof Trend f ( r ) No Trend L~near Trend Ouadratlc trend
A. AlnM, --, P, 2.47** 2.45** 1.94**
B. AlnM,+ AR, 4.21"" 4.17** 4.84**
"Slgnlf~canl at the 5 percent level There are 3 10 degrees of freedom for the model with no trend. 309 for the model wlth a llnear trend, 308 for the model with a quadratic trend, and 12 restr~clions. The F-stat~stlc corresponding to a 5 percent slgnlflcance level rounded to the nearest hundredth 1s the same In all three cases ( F ,,= I 78).
for whether lags of innovations to money growth help to predict inflation and changes in interest rates.4 As can be seen in Table 1, money growth significantly causes both inflation and changes in the nominal interest rate for all three trend specifications.
2. CAUSALITY RESULTS ACROSS SPECTRAL FREQUENCY BANDS
Which frequency movements in money growth, inflation, and changes in the inter- est rate lie behind the baseline results? The procedure used to answer this question is to transform the data to the frequency domain, zero out some of the frequencies, transform the data back to the time domain, perform new causality tests, and com- pare the new results to the baseline (unfiltered) results. Following Engle (1974, 1978), define the row vector w, as
where 0, = 2~rk lT .NOW, consider a particular element of the vector Zt, say M,. Let M = [M,, M I , . . . . . . , MT- , I T . Then w , ~ l f l i sthe kth element of the finite Fourier transform of M . Next, define M = WM where W = [w,, w , , . . . . . . , wT- ,] T . M is a T element vector with complex entries, each of which correspond to a differ- ent frequency. The objective is to exclude some of the frequencies from M . To ac- complish this, construct a TxT matrix S , where S has ones on the diagonal elements corresponding to included frequencies and is zero elsewhere, and obtain SM. Final-ly, define M* = WtSWM = W'SM where t means the complex conjugate of the transpose. This is the inverse Fourier transform of SM.
The next step is to let Z y * = [YT,M,*,Pt,RtIT.Then write the new VAR model:
4. Following Stock and Watson, F-statistics rather than variance decompositions and impulse re- sponse functions are used to assess causality so that the results here can be compared directly to the results of earlier studies. The limitations inherent in the use of F-statistics in multivariate VAR models (that is, models with more than two variables) is acknowledged.
222 : MONEY, CREDIT, AND BANKING
This is the VAR model with designated frequencies removed from one of the vari- ables, in this case from M. This model is estimated and the F-statistics for causality are compared to the baseline results from model (I). If the excluded frequencies are responsible for the causality results, the F-statistics from model (3) should drop be- low the baseline results from model (1).
The approach to excluding frequencies used here is to successively and cu- mulatively remove particular frequencies from the data. Consider causality from money growth to inflation. First, two-month cycles are removed from the data on money growth, and a causality test is performed. Next, all frequencies less than or equal to three months are removed, and again a causality test is performed. Then, all cycles less than or equal to four months are removed from the data, and a causali- ty test is performed. This procedure is continued until all cycles less than or equal to thirty months are removed from the data prior to performing the causality test. When the procedure is completed, there are twenty-nine test statistics corresponding to cumulatively removing cycles from two to thirty months from the data on money growth. The results are then plotted with the F-statistics for causality on the vertical axis, and the period of the cycle removed on the horizontal axis.5 The effects of cumulatively removing cycles from money growth can then be assessed by compar- ing the F-statistics in the diagram to the baseline r e ~ u l t . ~
To ascertain which frequency movements in inflation are the most important in producing the baseline results, the causality tests are repeated with cycles from two to thirty months cumulatively removed from the data on inflation and the results are plotted as described in the previous paragraph. From the two diagrams, the frequen- cies in money growth and inflation that are responsible for the baseline money- inflation causality results are identified. A similar procedure is used for causality from money growth to the change in the interest rate. Cycles are removed from money growth and the change in the interest rate separately and the results are plot- ted relative to the baseline, unfiltered model.
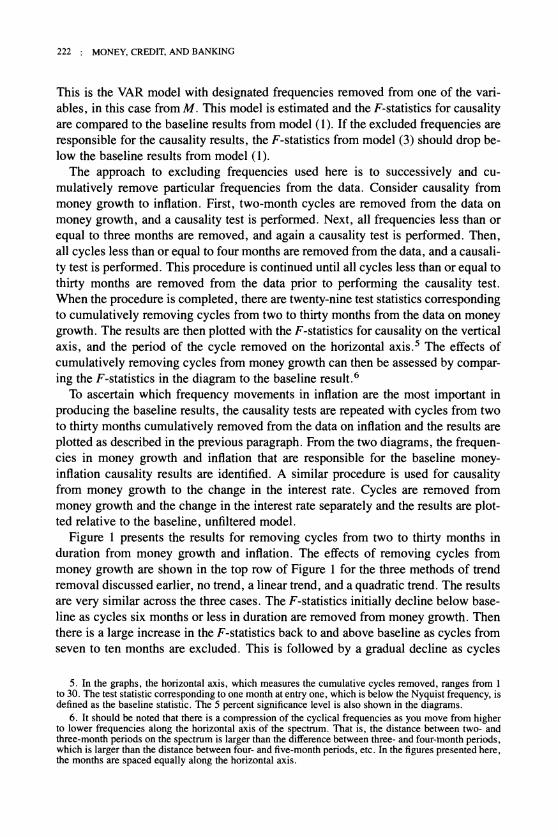
Figure 1 presents the results for removing cycles from two to thirty months in duration from money growth and inflation. The effects of removing cycles from money growth are shown in the top row of Figure 1 for the three methods of trend removal discussed earlier, no trend, a linear trend, and a quadratic trend. The results are very similar across the three cases. The F-statistics initially decline below base- line as cycles six months or less in duration are removed from money growth. Then there is a large increase in the F-statistics back to and above baseline as cycles from seven to ten months are excluded. This is followed by a gradual decline as cycles
5. In the graphs, the horizontal axis, which measures the cumulative cycles removed, ranges from 1 to 30. The test statistic corresponding to one month at entry one, which is below the Nyquist frequency, is defined as the baseline statistic. The 5 percent significance level is also shown in the diagrams.
6 . It should be noted that there is a compression of the cyclical frequencies as you move from higher to lower frequencies along the horizontal axis of the spectrum. That is, the distance between two- and three-month periods on the spectrum is larger than the difference between three- and four-month periods, which is larger than the distance between four- and five-month periods, etc. In the figures presented here, the months are spaced equally along the horizontal axis.
MARKA. THOMA : 223
Cycles Filtered from Money Growth
No Trend Linear Trend Quadratic Trend
Cycles Filtered from Inflation
No Trend Linear Trend Quadratic Trend
----- Horizontal line showing the baseline F-Statistic. , . . . . . .. . Horizontal line showing the 5% Significance Level (F.,,).
The horizontal axis measures the cumulative monthly period of the filtered cycles, and the vertical axis is the corresponding F-statistic.
FIG. 1. Causality from Money Growth to Inflation for the Model Y-MI-P-R
from eleven to twenty-four months are removed, and a leveling off from twenty-five to thirty months. These results indicate that money-inflation causality is due primari- ly to cycles in money from eleven to twenty-four months in duration, although there is some contribution from cycles two to six months long.
The results for the removal of cycles from inflation for the three trend specifica- tions are shown in the bottom row of Figure 1. The F-statistics decline slightly be- low baseline when three-month cycles are removed, increase back to and above
-----
224 : MONEY, CREDIT, AND BANKING
baseline for the removal of four-month cycles, and then decline rapidly when cycles of five to six months are removed. Thus, money growth appears to cause three- month cycles in inflation, which explain a small part of the baseline results, and cycles from five to six months, which are the main contributor to the baseline results.
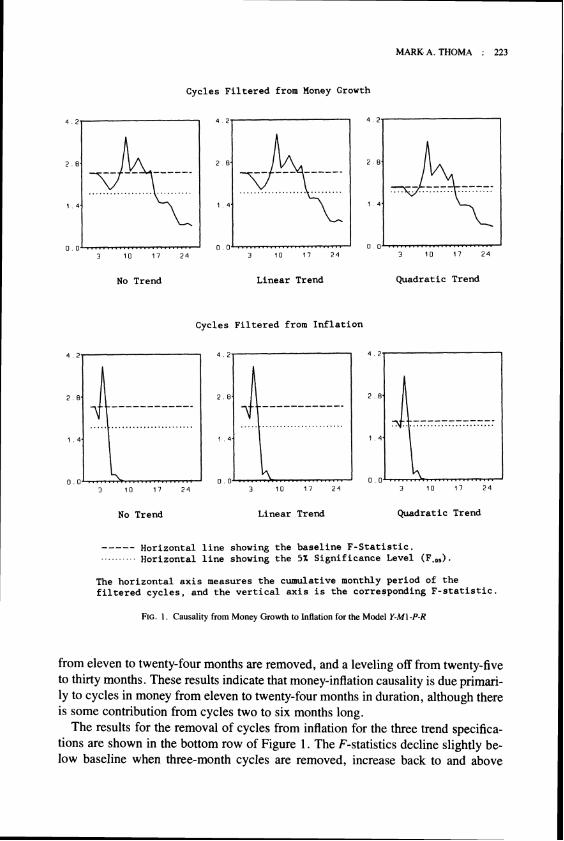
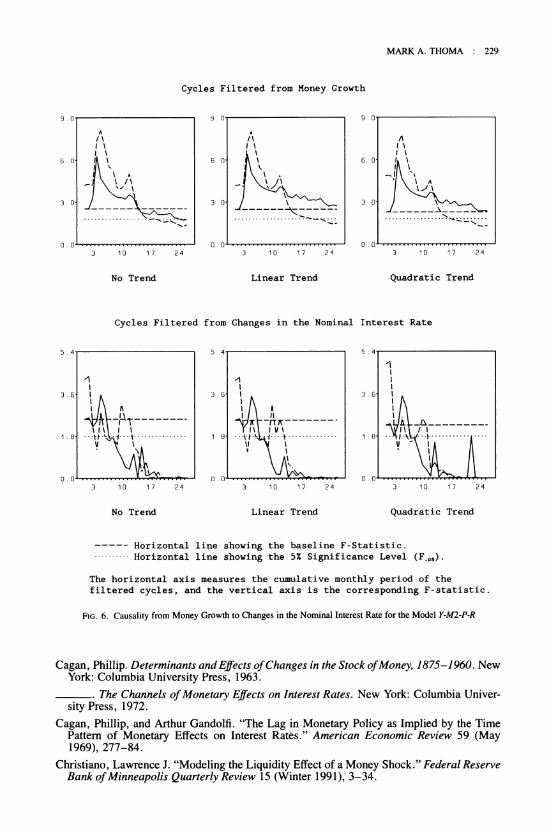
Figure 2 shows the results for money-interest rate causality. In the top row, which shows the effects of filtering cycles from money growth, the F-statistics increase
Cycles Filtered from Money Growth
No Trend Linear Trend Quadratic Trend
Cycles Filtered from Changes in the Nominal Interest Rate
No Trend Linear Trend Quadratic Trend
Horizontal line showing the baseline F-Statistic. . . . . . . . Horizontal line showing the 5% Significance Level (F.,,).
The horizontal axis measures the cumulative monthly period of the filtered cycles, and the vertical axis is the corresponding F-statistic.
FIG.2. Causality from Money Growth to Changes in the Nominal Interest Rate for the Model Y-M1-P-R
MARKA. THOMA : 225
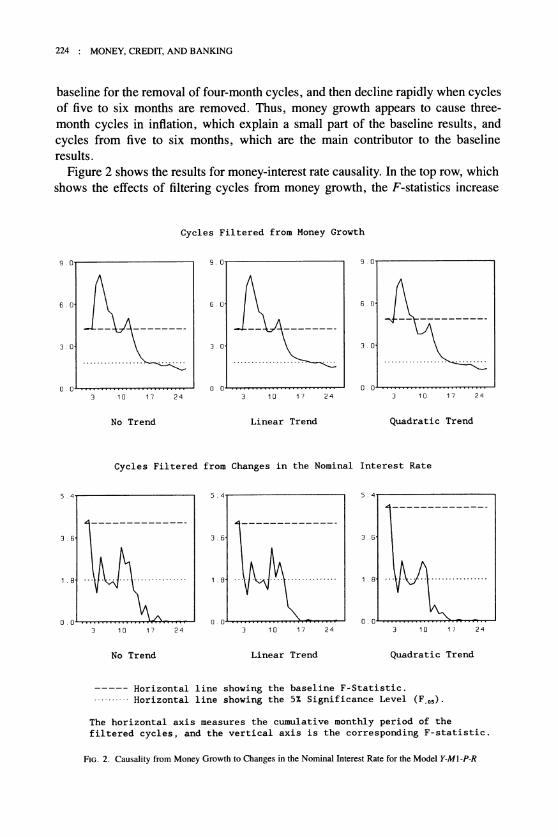
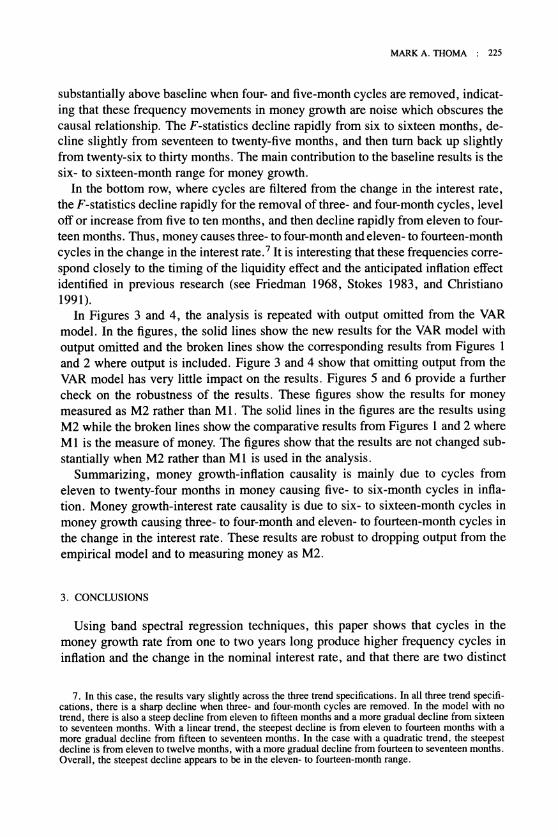
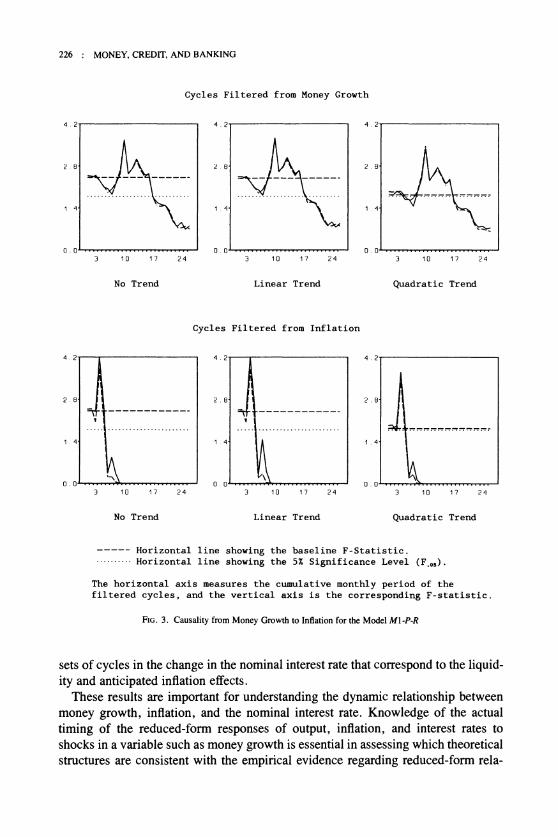
substantially above baseline when four- and five-month cycles are removed, indicat- ing that these frequency movements in money growth are noise which obscures the causal relationship. The F-statistics decline rapidly from six to sixteen months, de- cline slightly from seventeen to twenty-five months, and then turn back up slightly from twenty-six to thirty months. The main contribution to the baseline results is the six- to sixteen-month range for money growth.
In the bottom row, where cycles are filtered from the change in the interest rate, the F-statistics decline rapidly for the removal of three- and four-month cycles, level off or increase from five to ten months, and then decline rapidly from eleven to four- teen months. Thus, money causes three- to four-month and eleven- to fourteen-month cycles in the change in the interest rate.' It is interesting that these frequencies corre- spond closely to the timing of the liquidity effect and the anticipated inflation effect identified in previous research (see Friedman 1968, Stokes 1983, and Christian0 1991).
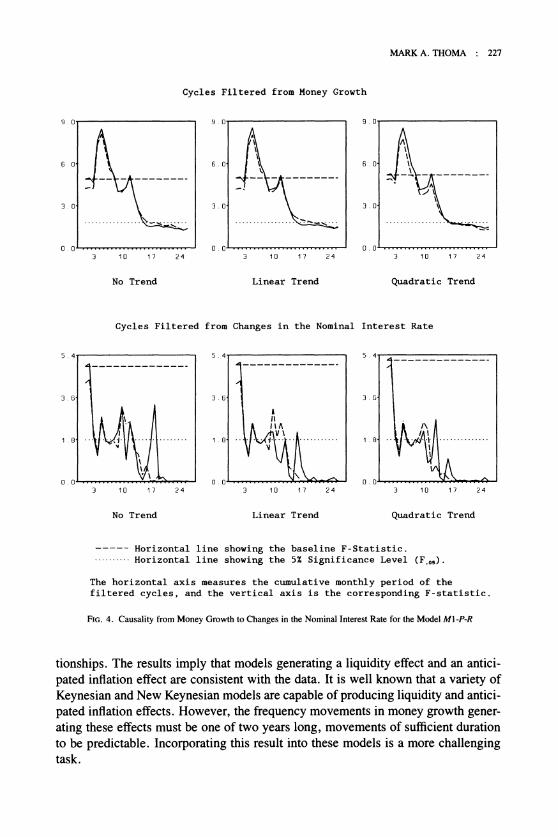
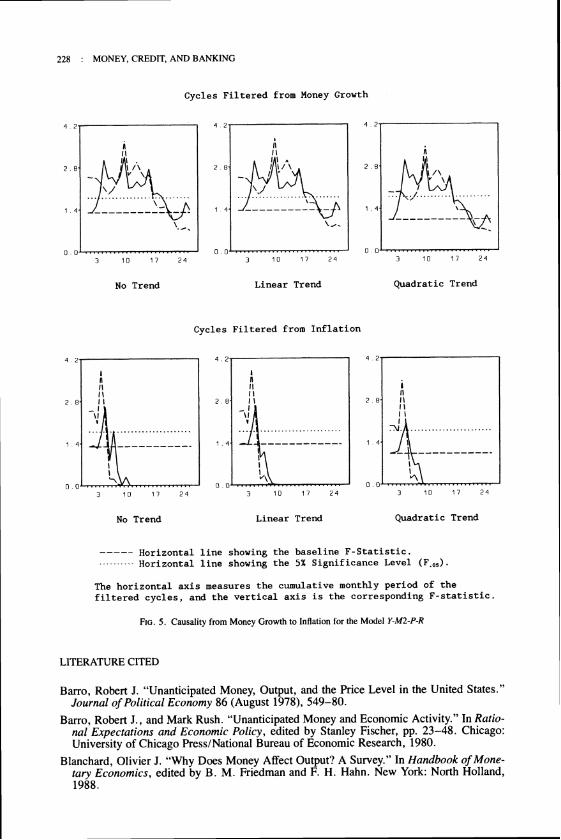
In Figures 3 and 4, the analysis is repeated with output omitted from the VAR model. In the figures, the solid lines show the new results for the VAR model with output omitted and the broken lines show the corresponding results from Figures 1 and 2 where output is included. Figure 3 and 4 show that omitting output from the VAR model has very little impact on the results. Figures 5 and 6 provide a further check on the robustness of the results. These figures show the results for money measured as M2 rather than M1. The solid lines in the figures are the results using M2 while the broken lines show the comparative results from Figures 1 and 2 where M 1 is the measure of money. The figures show that the results are not changed sub- stantially when M2 rather than M1 is used in the analysis.
Summarizing, money growth-inflation causality is mainly due to cycles from eleven to twenty-four months in money causing five- to six-month cycles in infla- tion. Money growth-interest rate causality is due to six- to sixteen-month cycles in money growth causing three- to four-month and eleven- to fourteen-month cycles in the change in the interest rate. These results are robust to dropping output from the empirical model and to measuring money as M2.
3. CONCLUSIONS
Using band spectral regression techniques, this paper shows that cycles in the money growth rate from one to two years long produce higher frequency cycles in inflation and the change in the nominal interest rate, and that there are two distinct
7. In this case, the results vary slightly across the three trend specifications. In all three trend specifi- cations, there is a sharp decline when three- and four-month cycles are removed. In the model with no trend, there is also a steep decline from eleven to fifteen months and a more gradual decline from sixteen to seventeen months. With a linear trend, the steepest decline is from eleven to fourteen months with a more gradual decline from fifteen to seventeen months. In the case with a quadratic trend, the steepest decline is from eleven to twelve months, with a more gradual decline from fourteen to seventeen months. Overall, the steepest decline appears to be in the eleven- to fourteen-month range.
-----
226 : MONEY, CREDIT, AND BANKING
Cycles Filtered from Money Growth
No Trend Linear Trend Quadratic Trend
Cycles Filtered from Inflation
No Trend Linear Trend Quadratic Trend
Horizontal line showing the baseline F-Statistic. . . . . .. . . Horizontal line showing the 5% Significance Level (F,,,).
The horizontal axis measures the cumulative monthly period of the filtered cycles, and the vertical axis is the corresponding F-statistic
FIG.3. Causality from Money Growth to Inflation for the Model M1-P-R
sets of cycles in the change in the nominal interest rate that correspond to the liquid- ity and anticipated inflation effects.
These results are important for understanding the dynamic relationship between money growth, inflation, and the nominal interest rate. Knowledge of the actual timing of the reduced-form responses of output, inflation, and interest rates to shocks in a variable such as money growth is essential in assessing which theoretical structures are consistent with the empirical evidence regarding reduced-form rela-
MARKA. THOMA : 227
Cycles Filtered from Money Growth
No Trend Linear Trend Quadratic Trend
Cycles Filtered from Changes in the Nominal Interest Rate
No Trend Linear Trend Quadratic Trend
----- Horizontal line showing the baseline F-Statistic.
- - - - - Horizontal line showing the 5% Significance Level (F,,,)
The horizontal axis measures the cumulative monthly period of the filtered cycles, and the vertical axis is the corresponding F-statistic.
FIG.4. Causality from Money Growth to Changes in the Nominal Interest Rate for the Model MI-P-R
tionships. The results imply that models generating a liquidity effect and an antici- pated inflation effect are consistent with the data. It is well known that a variety of Keynesian and New Keynesian models are capable of producing liquidity and antici- pated inflation effects. However, the frequency movements in money growth gener- ating these effects must be one of two years long, movements of sufficient duration to be predictable. Incorporating this result into these models is a more challenging task.
228 : MONEY.CREDIT,AND BANKING
Cycles Filtered from Money Growth
No Trend Linear Trend Quadratic Trend
Cycles Filtered from Inflation
No Trend Linear Trend Quadratic Trend
----- Horizontal line showing the baseline F-Statistic. .. .. . . .. Horizontal line showing the 5% Significance Level (F.,,).
The horizontal axis measures the cumulative monthly period of the filtered cycles, and the vertical axis is the corresponding F-statistic.
FIG.5. Causality from Money Growth to Inflation for the Model Y-M2-P-R
LITERATURE CITED
Barro, Robert J. "Unanticipated Money, Output, and the Price Level in the United States." Journal of Political Economy 86 (August 1978), 549-80.
Barro, Robert J., and Mark Rush. "Unanticipated Money and Economic Activity." In Ratio-nal Expectations and Economic Policy, edited by Stanley Fischer, pp. 23-48. Chicago: University of Chicago PressINational Bureau of Economic Research, 1980.
Blanchard, Olivier J. "Why Does Money Affect Output? A Survey." In Handbook of Mone- tary Economics, edited by B. M. Friedman and F. H. Hahn. New York: North Holland, 1988.
-----
MARKA. THOMA : 229
Cycles Filtered from Money Growth
No Trend Linear Trend Quadratic Trend
Cycles Filtered from Changes in the Nominal Interest Rate
No Trend Linear Trend Quadratic Trend
Horizontal line showing the baseline F-Statistic. . . . . . - - Horizontal line showing the 5% Significance Level (F.,,)
The horizontal axis measures the cumulative monthly period of the filtered cycles, and the vertical axis is the corresponding F-statistic
FIG.6.Causality from Money Growth to Changes in the Nominal Interest Rate for the Model Y-M2-P-R
Cagan, Phillip. Determinants and Effects of Changes in the Stock of Money, 1875-1960. New York: Columbia University Press, 1963.
. The Channels of Monetary Effects on Interest Rates. New York: Columbia Univer- sity Press, 1972.
Cagan, Phillip, and Arthur Gandolfi. "The Lag in Monetary Policy as Implied by the Time Pattern of Monetary Effects on Interest Rates." American Economic Review 59 (May 1969), 277-84.
Christiano, Lawrence J. "Modeling the Liquidity Effect of a Money Shock." Federal Reserve Bank of Minneapolis Quarterly Review 15 (Winter 1991), 3-34.
230 : MONEY, CREDIT, AND BANKING
Cochrane, John H. "The Return of the Liquidity Effect: A Study of the Short-Run Relation between Money Growth and Interest Rates." Journal of Business and Economic Statistics 7 (January 1989), 75-83.
Engle, Robert F. "Band Spectrum Regression." International Economic Review 15 (February 1974), 1-11.
. "Testing Price Equations for Stability across Spectral Frequency Bands." Economet-r i c ~46 (July 1978), 869-8 1.
Fischer, Stanley. "Recent Developments in Macroeconomics." The Economic Journal 98 (June 1988) 294-339.
Fisher, Irving (1930). The Theory of Interest, New York: Macmillan.
Friedman, Benjamin M., and Kenneth N. Kuttner. "Money, Income Prices, and Interest Rates." American Economic Review 82 (June 1992), 472-92.
Friedman, Milton. "The Role of Monetary Policy." American Economic Review 58 (March 1968), 1-17.
Friedman, Milton, and Anna J. Schwartz. A Monetary History of the United States, 1867- 1960, Princeton: Princeton University Press, 1963.
Geweke, John F. "Measurement of Linear Dependence and Feedback between Multiple Time Series." Journal of the American Statistical Association 77 (June 1982), 304-24.
. "Measures of Conditional Linear Dependence and Feedback between Time Series." Journal of the American Statistical Association 79 (December 1984), 907- 15.
Gibson, William E. "Interest Rates and Monetary Policy." Journal of Political Economy 78 (MayiJune 1970), 431-55.
Gibson, William E., and George G. Kaufman. "The Sensitivity of the Interest Rate to Changes in Money and Income." Journal of Political Economy 76 (MayIJune 1968), 472- 78.
Lucas, Robert E., Jr. "Expectations and the Neutrality of Money." Journal of Economic The- ory 4 (April 1972), 103-24.
. "Two Illustrations of the Quantity Theory of Money." American Economic Review 70 (1980), 1005-14.
Melvin, Michael. "The Vanishing Liquidity Effect of Money on Interest: Analysis and Impli- cations for Policy." Economic Inquiry 21 (April 1983), 188-202.
Mishkin, Frederic S. A Rational Expectations Approach to Macroeconomics: Testing Pol- icy Ineffectiveness and E@cient-Markets Models, Chicago: University of Chicago Press1 National Bureau of Economic Research, 1983.
Okun, Arthur. Prices and Quantities: A Macroeconomic Analysis, Washington D.C.: Brook- i n g ~ Institution, 1981.
Romer, Christina D., and David H. Romer. "Does Monetary Policy Matter? A New Test in the Spirit of Friedman and Schwartz." In NBER Macroeconomics Annual 1989, edited by Olivier Jean Blanchard and Stanley Fischer, pp. 12 1-70. Cambridge, Mass. : MIT PresslNational Bureau of Economic Research, 1989.
Stock, James H., and Mark W. Watson. "Interpreting the Evidence of Money-Income Causal- ity." Journal of Econometrics 40 (January 1989), 161-81.
Stokes, Houston H. "The Relationship between Money, Interest Rates, and Prices 1867-1933: A Vector Model Approach." In Time Series Analysis: Theory and Practice 3 , edited by 0 . D. Anderson, pp. 231-50, New York: North Holland, 1983.
Stokes, Houston H., and Hugh Neuberger. "The Effects of Money on Interest Rates: A Box- Jenkins Approach." Review of Economics and Statistics 61 (November 1979), 534-48.
Summers, Lawrence H. "The Non-Adjustment of Nominal Interest Rates: A Study of the
MARK A. THOMA : 231
Fisher Effect." In Macroeconomics, Prices, and Quantities, edited by J. Tobin, Washing- ton. D.C.: Brookings Institution. 1983.
Thoma, Mark A. "The Effects of Inside and Outside Money on Industrial Production across Spectral Frequency Bands." The Review of Economics and Statistics 74 (November 1992), 737-41.
Whiteman, Charles H. "Lucas on the Quantity Theory: Hypothesis Testing without Theory." American Economic Review 74 (1984), 742-9.
You have printed the following article:
The Effects of Money Growth on Inflation and Interest Rates Across Spectral FrequencyBandsMark A. ThomaJournal of Money, Credit and Banking, Vol. 26, No. 2. (May, 1994), pp. 218-231.Stable URL:
This article references the following linked citations. If you are trying to access articles from anoff-campus location, you may be required to first logon via your library web site to access JSTOR. Pleasevisit your library's website or contact a librarian to learn about options for remote access to JSTOR.
[Footnotes]
1 The Role of Monetary PolicyMilton FriedmanThe American Economic Review, Vol. 58, No. 1. (Mar., 1968), pp. 1-17.Stable URL:
1 The Sensitivity of Interest Rates to Changes in Money and IncomeWilliam E. Gibson; George G. KaufmanThe Journal of Political Economy, Vol. 76, No. 3. (May - Jun., 1968), pp. 472-478.Stable URL:
1 The Lag in Monetary Policy as Implied by the Time Pattern of Monetary Effects on InterestRatesPhillip Cagan; Arthur GandolfiThe American Economic Review, Vol. 59, No. 2, Papers and Proceedings of the Eighty-first AnnualMeeting of the American Economic Association. (May, 1969), pp. 277-284.Stable URL:
1 The Effect of Monetary Changes on Interest Rates: Box-Jenkins ApproachHouston H. Stokes; Hugh NeuburgerThe Review of Economics and Statistics, Vol. 61, No. 4. (Nov., 1979), pp. 534-548.Stable URL:
1 Measures of Conditional Linear Dependence and Feedback Between Time SeriesJohn F. GewekeJournal of the American Statistical Association, Vol. 79, No. 388. (Dec., 1984), pp. 907-915.Stable URL:
1 The Return of the Liquidity Effect: A Study of the Short-Run Relation between MoneyGrowth and Interest RatesJohn H. CochraneJournal of Business & Economic Statistics, Vol. 7, No. 1. (Jan., 1989), pp. 75-83.Stable URL:
2 Unanticipated Money, Output, and the Price Level in the United StatesRobert J. BarroThe Journal of Political Economy, Vol. 86, No. 4. (Aug., 1978), pp. 549-580.Stable URL:
2 Measurement of Linear Dependence and Feedback Between Multiple Time SeriesJohn GewekeJournal of the American Statistical Association, Vol. 77, No. 378. (Jun., 1982), pp. 304-313.Stable URL:
2 Money, Income, Prices, and Interest RatesBenjamin M. Friedman; Kenneth N. KuttnerThe American Economic Review, Vol. 82, No. 3. (Jun., 1992), pp. 472-492.Stable URL:
Unanticipated Money, Output, and the Price Level in the United StatesRobert J. BarroThe Journal of Political Economy, Vol. 86, No. 4. (Aug., 1978), pp. 549-580.Stable URL:
The Lag in Monetary Policy as Implied by the Time Pattern of Monetary Effects on InterestRatesPhillip Cagan; Arthur GandolfiThe American Economic Review, Vol. 59, No. 2, Papers and Proceedings of the Eighty-first AnnualMeeting of the American Economic Association. (May, 1969), pp. 277-284.Stable URL:
The Return of the Liquidity Effect: A Study of the Short-Run Relation between MoneyGrowth and Interest RatesJohn H. CochraneJournal of Business & Economic Statistics, Vol. 7, No. 1. (Jan., 1989), pp. 75-83.Stable URL:
Testing Price Equations for Stability Across Spectral Frequency BandsRobert F. EngleEconometrica, Vol. 46, No. 4. (Jul., 1978), pp. 869-881.Stable URL:
Money, Income, Prices, and Interest RatesBenjamin M. Friedman; Kenneth N. KuttnerThe American Economic Review, Vol. 82, No. 3. (Jun., 1992), pp. 472-492.Stable URL:
Measurement of Linear Dependence and Feedback Between Multiple Time SeriesJohn GewekeJournal of the American Statistical Association, Vol. 77, No. 378. (Jun., 1982), pp. 304-313.Stable URL:
Measures of Conditional Linear Dependence and Feedback Between Time SeriesJohn F. GewekeJournal of the American Statistical Association, Vol. 79, No. 388. (Dec., 1984), pp. 907-915.Stable URL:
The Sensitivity of Interest Rates to Changes in Money and IncomeWilliam E. Gibson; George G. KaufmanThe Journal of Political Economy, Vol. 76, No. 3. (May - Jun., 1968), pp. 472-478.Stable URL:
Two Illustrations of the Quantity Theory of MoneyRobert E. Lucas, Jr.The American Economic Review, Vol. 70, No. 5. (Dec., 1980), pp. 1005-1014.Stable URL:
The Effect of Monetary Changes on Interest Rates: Box-Jenkins ApproachHouston H. Stokes; Hugh NeuburgerThe Review of Economics and Statistics, Vol. 61, No. 4. (Nov., 1979), pp. 534-548.Stable URL:
The Effects of Inside and Outside Money on Industrial Production Across Spectral FrequencyBandsMark A. ThomaThe Review of Economics and Statistics, Vol. 74, No. 4. (Nov., 1992), pp. 737-741.Stable URL:
Lucas on the Quantity Theory: Hypothesis Testing without TheoryCharles H. WhitemanThe American Economic Review, Vol. 74, No. 4. (Sep., 1984), pp. 742-749.Stable URL: