THE EFFECTS OF OWNERSHIP, BOARD SIZE AND BOARD COMPOSITION ON THE PERFORMANCE OF ITALIAN WATER UTILITIES Paper published on Utilities Policy Giulia Romano (University of Pisa) Andrea Guerrini (University of Verona)
Transcript
THE EFFECTS OF OWNERSHIP, BOARD SIZE AND BOARD COMPOSITION ON THEPERFORMANCE OF ITALIAN WATER UTILITIESPaper published on Utilities Policy
Giulia Romano (University of Pisa)Andrea Guerrini (University of Verona)
• Gli intrecci azionari di Roma:• http://www.lavoce.info/archives/17902/partecipate-roma-
Il settore idrico italiano• In base ai dati AEEG: 1235 operatori• 75% sono Comuni e altri enti pubblici che gestiscono in
proprio il servizio idrico (distribuzione, depurazione, fognaturaetc)• 79% sono localizzati al nord, soprattutto Lombardia e
Trentino• 25% sono aziende (304), la più «antica» delle quali è la
Società Acque Potabili di Torino (1852)• Ci sono Regioni con un solo gestore (Puglia, Basilicata) o
due (Sardegna); altre con numerosi gestori (Lombardia,Trentino and Sicilia: 403, 320 e 77)
• In alcune Regioni i gestori sono solo enti pubblici (Molise eValle d’Aosta) mentre in altre solo società privatistiche(Basilicata, Friuli, Puglia, Sardegna, Umbria e Veneto)
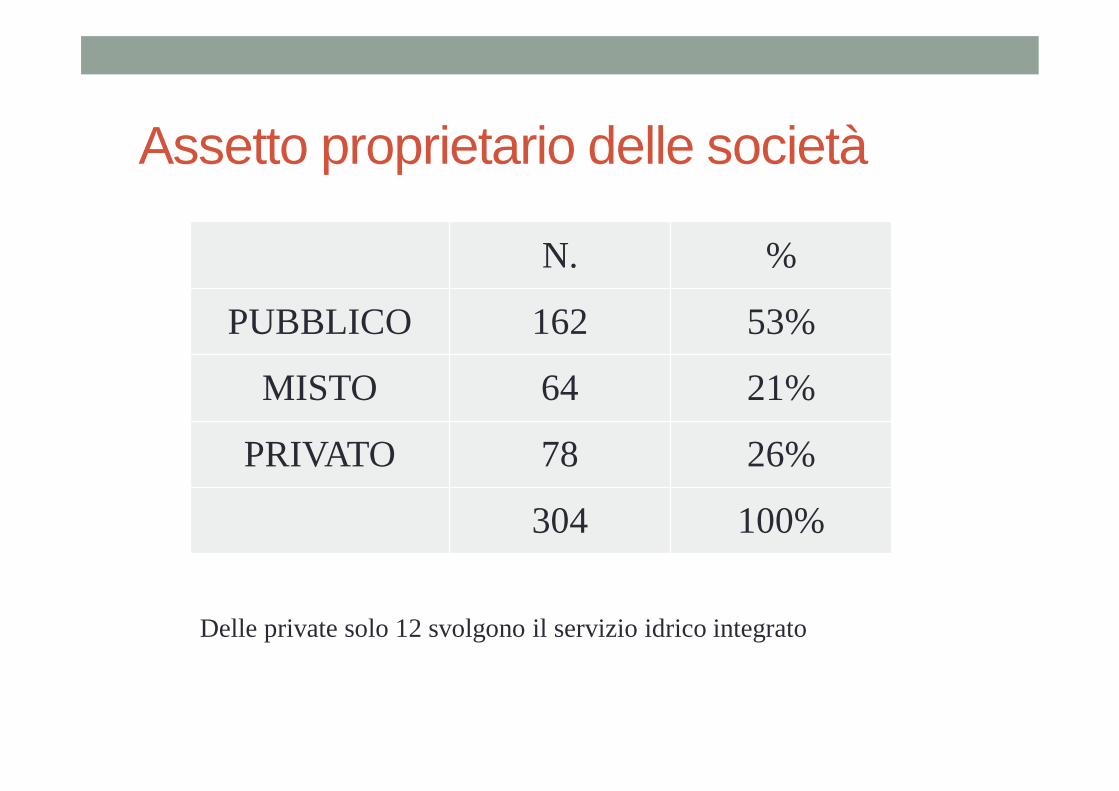
Assetto proprietario delle società
N. %
PUBBLICO 162 53%
MISTO 64 21%
PRIVATO 78 26%
304 100%
Delle private solo 12 svolgono il servizio idrico integrato
Numero di soci• Minimo di 1 solo socio (es. società municipalizzate, MM a
Milano)
• Massimo nelle società quotate• Acegas-APS (ora Hera a seguito di OPAS)• Hera• Società Acque Potabili (Gruppo Iren)
• A2A ciclo idrico, ACEA ato 2 e ato 5, Iren Acqua Gas
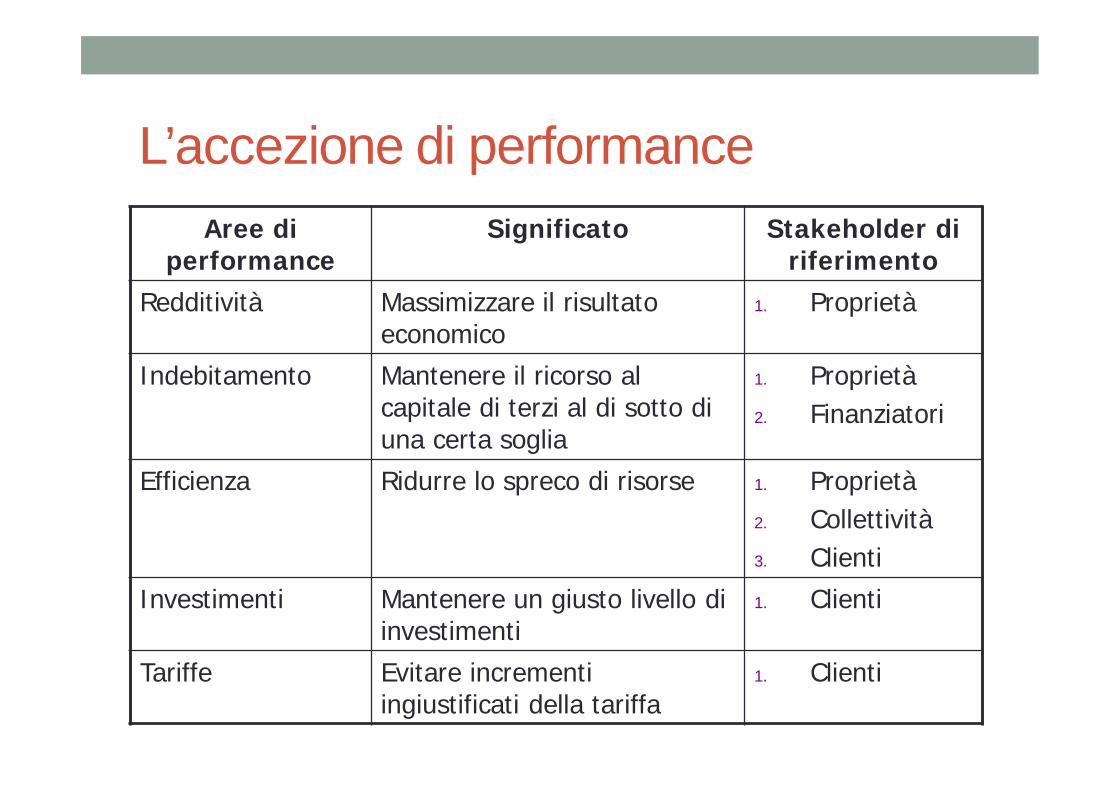
L’accezione di performanceAree di
performanceSignificato Stakeholder di
riferimentoRedditività Massimizzare il risultato
economico1. Proprietà
Indebitamento Mantenere il ricorso al capitale di terzi al di sotto di una certa soglia
1. Proprietà2. Finanziatori
Efficienza Ridurre lo spreco di risorse 1. Proprietà2. Collettività3. Clienti
Investimenti Mantenere un giusto livello di investimenti
1. Clienti
Tariffe Evitare incrementi ingiustificati della tariffa
1. Clienti
Introduction• Over the last 25 years the global water industry has been the
focus of debate regarding how best to improve the economicperformance, organizational efficiency and financial viability ofwater utilities.
• Water services have accordingly been privatized in severalcountries, notwithstanding conflicts between the profit-seeking behavior of private partners and the publicobjectives of a water service (Hall 2001).
• Within Europe the UK, France, Portugal, Spain and Italy haveall been involved in privatization processes, with diverse results(for a literature review see Abbott and Cohen 2009, Berg andMarques 2011).• In Italy both the performance and the characteristics of
water utilities’ boards are conditioned by specific legal provisions.
The Italian water industry: utilities board• Fully publicly-owned utilities can appoint no more than 5
board members, according to law 78/2010• Mixed owned utilities have no limitations concerning
board size: a restriction is provided only for the number ofmembers appointed by the public shareholders, whichmust be no more than 5
• The law banned the appointment of any politicians whooperated in the previous three years as administrators ofthe local government owning the utility
• The close connection between Italian utilities (water,electricity and gas) and local government causes thedominance of politically connected directors on the boardsof Italian utilities, who exert a negative effect on the firms’performance (Menozzi et al., 2011).
Main goals• Building on agency theory (Jensen and Meckling 1976),
this paper seeks to add to the existing literature on waterutility management by investigating whether the boardsize and composition and the ownership of Italianwater utilities do affect firms’ decisions, and how theyultimately impact on performance.
Despite the relevance of this issue, the water industry literature to date has focused mainly on the
ownership/performance linkage and lacks empirical studies investigating the relationship between performance and
board size and composition.
Data collection• Latest report published in 2011 by Co.N.Vi.R.I., the former Italian
national water authority: 163 Italian water utilities• Excluded companies that operate in just one of the two subsectors
identified (water supply and wastewater) or that are multi-utilities (e.g.providing gas, waste management and energy)
• The reduced list was cross-checked with the AIDA (AnalisiInformatizzata delle Aziende Italiane) database of Bureau Van Dyck• Data on: board size, percentage of women on the board of directors, age of
• Internet, and in particular the firms’ websites, local newspaperwebsites and the main web search engines were used to identify ifeach director on the board had a degree and held or had held politicalassignments, candidacies in national and local elections, and/ormembership of a political party (“politically connected”). Thesesources have been used also to collect data on population served byeach firm
Data collection• AIDA database was used to collect the most well-known and
commonly used economic and financial items referred to 2011:• DEPENDENT VARIABLES
1. return on investment (ROI)2. return on equity (ROE)3. return on assets (ROA)4. return on sales (ROS)5. debt to equity ratio (D/E)6. financial autonomy (Fin.Aut.) measured as the net asset to total
asset7. net financial position (NFP) measured as financial liabilities minus
cash and cash equivalents
8. total assets9. total revenues, and 10. number of employees
Data collection• The final panel obtained includes 72 water utilities that operate
only in the water and wastewater industry, serving around 31million customers, for which we collected information about their335 board members (2011)
• Ownership: the majority of utilities are fully publicly-owned,while mixed and privately-owned firms account for only 27% ofthe panel selected.
• Size: Based on EU parameters, the utilities are mainly small andmedium-sized enterprises from the point of view of theirnumbers of employees and turnover; however, 63.9% of themare large if we consider their annual balance sheet totals
• Geographical location: 60% of the utilities are located in thenorth, 21% are located in the center and 19% in the south ofItaly
Descriptive statistics
Method: OLS regression
Robust check• Spearman’s correlation analysis was performed and a
Variance Inflation Factor (VIF) was used• Since we found a VIF of above 5 for both TR and TA in all
the functions, one of these variables had to be removedfrom the regression model. To determine the best one toremove, each one was removed individually and then theregression equation that explained the most variance (R2of the highest) was selected. In all cases we removed TR
• The robustness of the model was then evaluated throughresidual analysis. The residuals’ normality was verified withdiagnostic plot analysis and the Shapiro-Wilk test
• After the outliers detection, we also try to apply theMaximum Likelihood Robust Regression
Results• For ROA the Shapiro-Wilk test allowed us to reject the
null hypothesis• With reference to ROE, ROI, D/E and NFP, neither the
outlier detection through diagnostic plot analysis norrobust regression rejected the null hypothesis. Thus, wewere not able to infer anything from the results.
• Considering ROS and Fin.Aut. the diagnostic plotanalysis highlighted the presence of three anomalousdata. Consequently, we first eliminated the outliers andthen ran the complete model again. The Shapiro-Wilk testallowed us to reject the null hypothesis
Board size• Board size slightly influences the profitability of Italian
water utilities from the point of view of ROA (10%significance level), ROI (10%) and ROE (1%).
• Thus, the empirical evidence suggests that larger boardspositively affect performance. Firms can consequentlystructure their boards with more members, to acquire abroader range of knowledge and experience, within theregulatory constraints.
• However, the results are not robust, so further empiricaltests are necessary to confirm these findings
Ownership structure• Privately-owned firms show higher profitability when ROS
(1%) is considered, but are more debt-dependent than fullypublicly-owned firms, since their Fin. Aut. is negatively affectedby the presence of private shareholders (5%).
• This result confirms evidence from previous studies on Italianwater utilities (Guerrini et al., 2011)
• Guerrini et al. (2011) and Romano et al. (2013) demonstratethat the good performance of private firms could be explainedby their higher tariffs and lower amounts of investments. At thesame time, the greater solvency and financial autonomy ofpublicly-owned companies lead them to pay lower interestrates.
• Our results partially confirm the findings of Dewenter andMalatesta (2001), since they show that SOEs are significantlyless profitable than privately-owned firms but use moreleverage than them.
Board composition: political connectedness• The boards of Italian water utilities are dominated by politically
connected directors, who account for the great majority of boardmembers.
• There is no significant correlation between the ownership structure andthe percentage of politically connected directors on the board.
• The presence of politically connected directors boosts access tofinance but negatively affects firms’ financial structures, in terms ofdecreasing their financial autonomy (1%) and increasing their debt toequity ratio (1%)
• Politically experienced directors might help the firm gain access tofinance from banks, as highlighted by Claessens et al. (2008), Khwajaand Mian (2005) and Li et al. (2007).
• Yet, in contrast to the existing literature (Faccio 2006, 2010, Goldman etal. 2009, Niessen and Ruenzi 2010, Menozzi et al. 2011), our researchhighlights that politically connected directors do not exert a negativeimpact on profitability in Italian water utilities, in terms of theprofitability ratios analyzed.
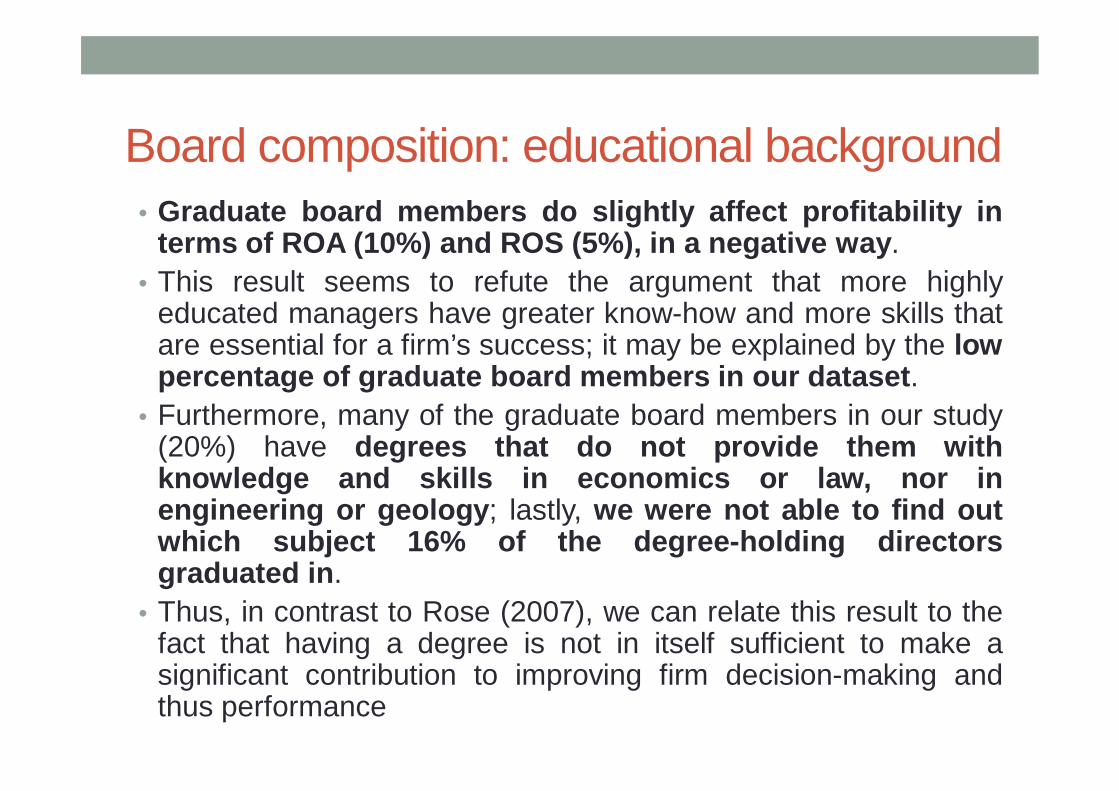
Board composition: educational background• Graduate board members do slightly affect profitability in
terms of ROA (10%) and ROS (5%), in a negative way.• This result seems to refute the argument that more highly
educated managers have greater know-how and more skills thatare essential for a firm’s success; it may be explained by the lowpercentage of graduate board members in our dataset.
• Furthermore, many of the graduate board members in our study(20%) have degrees that do not provide them withknowledge and skills in economics or law, nor inengineering or geology; lastly, we were not able to find outwhich subject 16% of the degree-holding directorsgraduated in.
• Thus, in contrast to Rose (2007), we can relate this result to thefact that having a degree is not in itself sufficient to make asignificant contribution to improving firm decision-making andthus performance
Board composition: age• Our empirical findings seem to partially confirm that
demographic variables, such as the age of board members,can help understand the values and cognitive bases thatultimately affect firm performance (Hambrick and Mason1984, Erhardt et al. 2003).
• As a matter of fact, the age of board members negativelyaffects both profitability (in terms of ROS – 10%) andfinancial structure (considering both Fin.Aut. and NFP –both 5%).
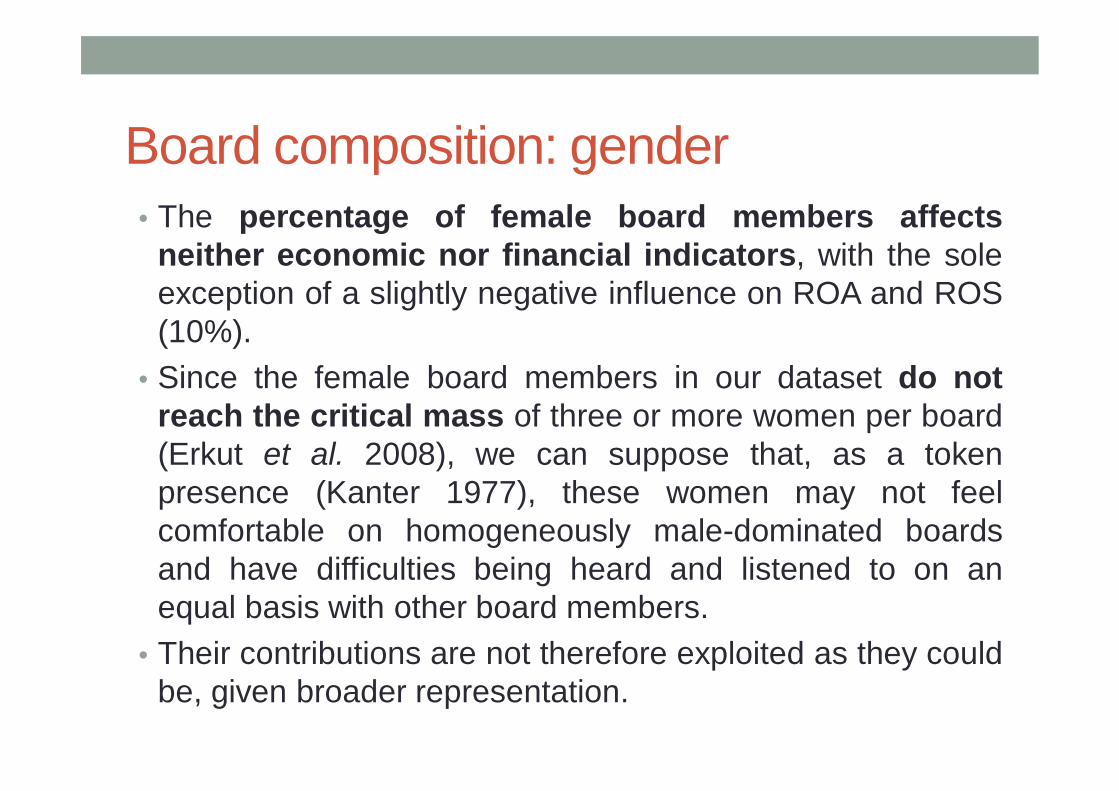
Board composition: gender• The percentage of female board members affects
neither economic nor financial indicators, with the soleexception of a slightly negative influence on ROA and ROS(10%).
• Since the female board members in our dataset do notreach the critical mass of three or more women per board(Erkut et al. 2008), we can suppose that, as a tokenpresence (Kanter 1977), these women may not feelcomfortable on homogeneously male-dominated boardsand have difficulties being heard and listened to on anequal basis with other board members.
• Their contributions are not therefore exploited as they couldbe, given broader representation.
Limitations• Further research is needed in order to overcome the limitations
of this study.• First of all, it may be interesting to add other measures of
performance, for example efficiency estimates obtained withother methods such as Data Envelopment Analysis, or to usethe tariff charged to customers as a dependent variable.
• Moreover, it may be interesting to extend the dataset to includemulti-year data and to add information about multi-utilitiesoffering more than one public service, considering the scope ofoperation as a control variable to explain firms’ performance.
• Finally, another limitation is the endogeneity problem, whichimpacts much of the board related literature (Hermalin andWeisbach, 2000). Board composition may influence firmperformance, but the latter may in turn influence the selectionof board members.
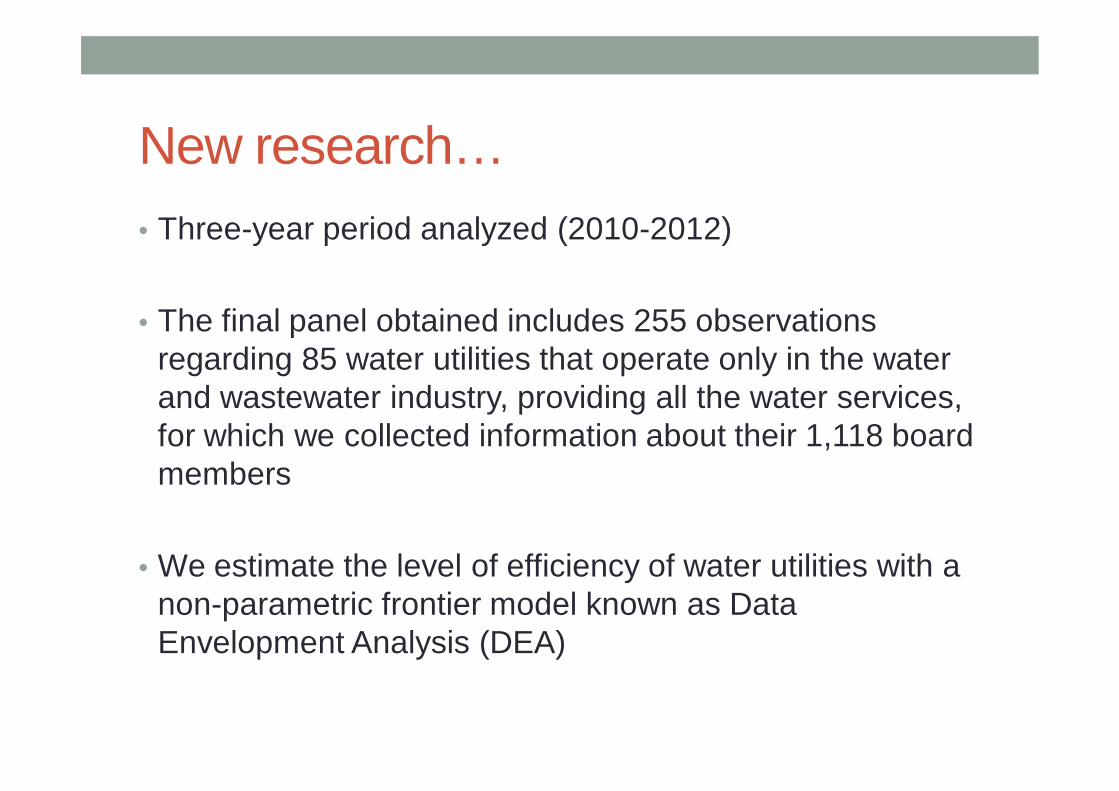
New research…• Three-year period analyzed (2010-2012)
• The final panel obtained includes 255 observations regarding 85 water utilities that operate only in the water and wastewater industry, providing all the water services, for which we collected information about their 1,118 board members
• We estimate the level of efficiency of water utilities with a non-parametric frontier model known as Data Envelopment Analysis (DEA)