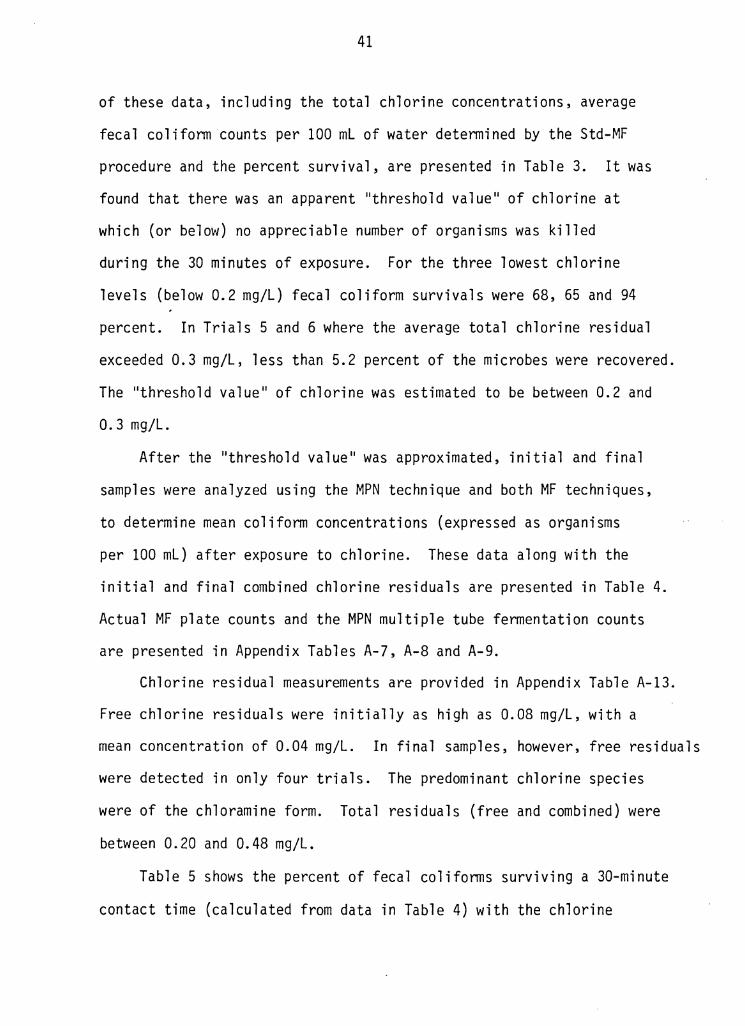
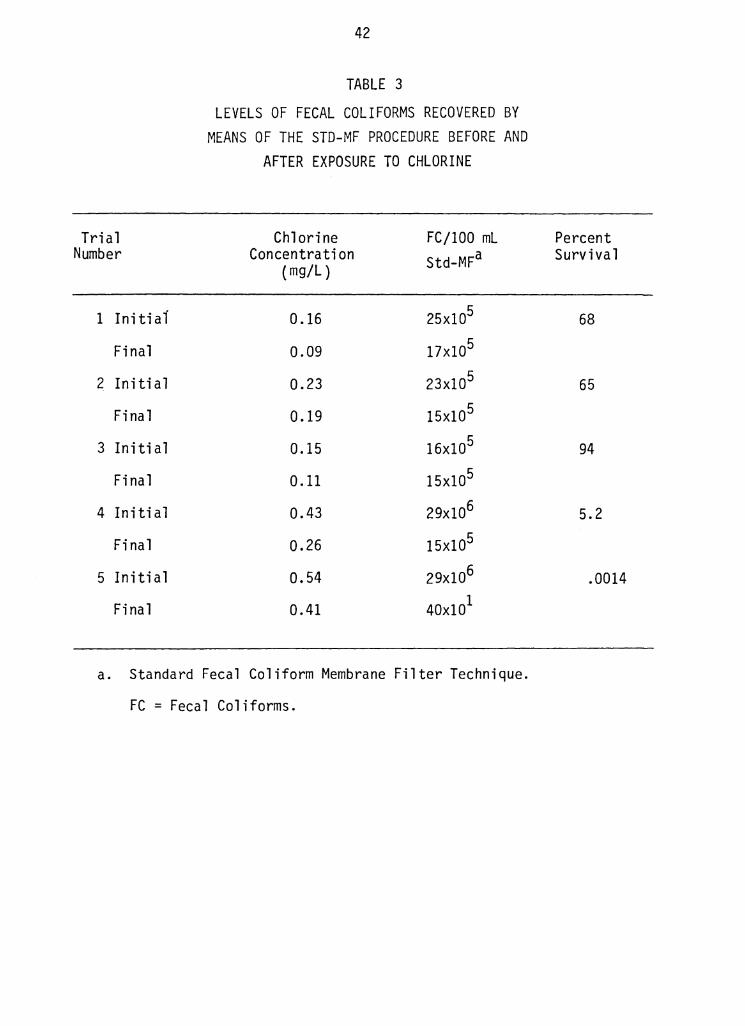
THE EFFECTS OF RHODAMINE WT AND CHLORINE ON THE RECOVERY OF FECAL COLIFORMS BY KENNETH E. VINSON Thesis submitted to the Graduate Faculty of the Virginia Polytechnic Institute and State University in partial fulfillment of the requirements for the degree of APPROVED: Robert C. Hoehn MASTER OF SCIENCE in Sanitary Engineering Gregory D. Boardman, Chairman December 1982 Blacksburg, Virginia Robert C. Bates
Transcript
THE EFFECTS OF RHODAMINE WT AND
CHLORINE ON THE RECOVERY OF FECAL COLIFORMS
BY
KENNETH E. VINSON
Thesis submitted to the Graduate Faculty of the
Virginia Polytechnic Institute and State University
in partial fulfillment of the requirements for the degree of
APPROVED:
Robert C. Hoehn
MASTER OF SCIENCE
in
Sanitary Engineering
Gregory D. Boardman, Chairman
December 1982
Blacksburg, Virginia
Robert C. Bates
ACKNOWLEDGEMENTS
The author wishes to extend his sincere appreciation to
Dr. Gregory D. Boardman for his service as Graduate Committee
Chairman and his invaluable guidance, suggestions, and editing of
this manuscript. Further appreciation is extended to Dr. Robert
C. Hoehn and Dr. Robert C. Bates for their service on the Graduate
Committee.
This research was funded by an Environmental Protection Agency
Traineeship. The author would like_ to thank Dr. Paul H. King for his
role in providing that funding.
Appreciation is also extended to Mrs. Joyce Chomko for her expert
and patient typing of this manuscript.
ii
I.
II.
III.
IV.
TABLE OF CONTENTS
ACKNOWLEDGEMENTS
LIST OF TABLES .
LIST OF FIGURES . . . . LIST OF APPENDIX TABLES
INTRODUCTION ...
LITERATURE REVIEW
Historical Aspects of Waterborne Pathogens Significance of Coliforms Coliform Physiology Fecal Coliform Recovery Methods Chlorine Chemistry and Disinfection The Use of Fluorescent Tracers Toxicology of Dyes
MATERIALS AND METHODS
Fecal Coliform Isolation Stream Water Fecal Coliform Enumerations Dye Investigations Chlorine Investigations Chlorine With Dye Investigations Statistical Analysis of Data
RESULTS OF STUDY
Overview Characterization of Stream Water Dye Investigations Chlorine Investigations Chlorine With Dye Investigations Comparison of Enumeration Techniques Measurement of Organism Stress
; ; i
Page
i
iv
V
vii
1
4
27
36
V.
VI.
VI I.
DISCUSSION OF RESULTS .
Dye Investigations Chlorine Investigations Chlorine With Dye Investigations Comparison of Enumeration Techniques
SUMMARY AND CONCLUSIONS.
LITERATURE CITED
APPENDICES
VITA ..
ABSTRACT
iv
Page
. 66
78
• . 79
83
. . 111
LIST OF TABLES
Table Page
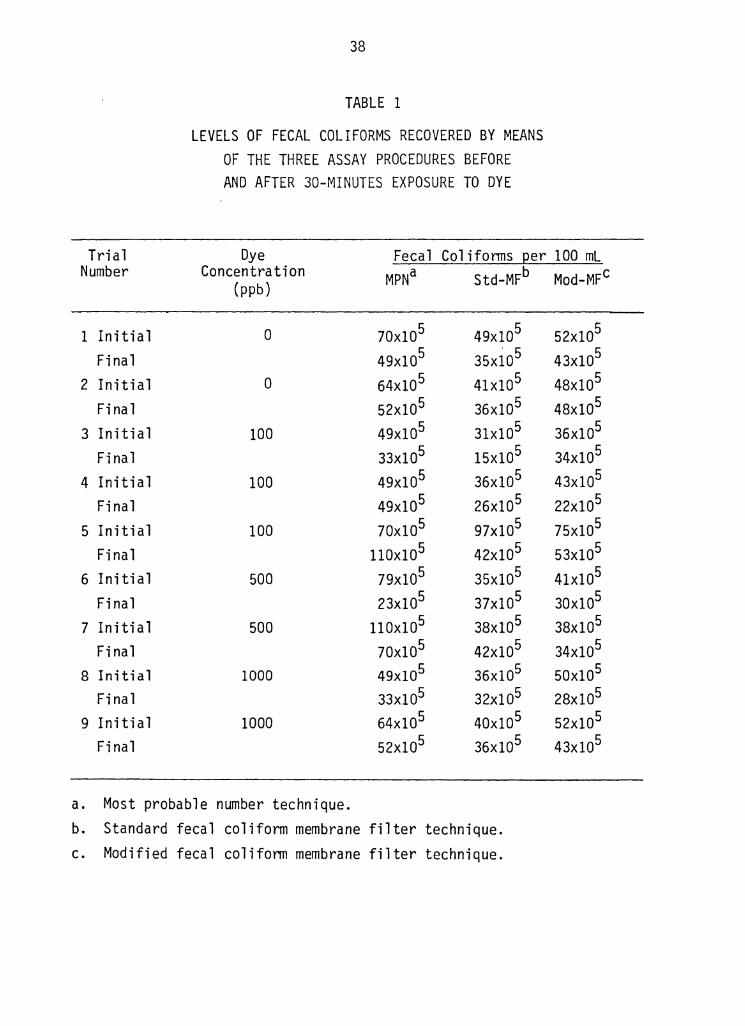
1 Levels of Fecal Coliforms Recovered by 38 Means of the Three Assay Procedures Before and After 30 Minutes Exposure to Dye
2 Percent Fecal Coliforms Surviving 30 39 Minutes Contact at Various Levels of Dye
3 Levels of Fecal Coliforms Recovered by 42 Means of the Std-MF Procedure Before and After Exposure to Chlorine
4 Levels of Fecal Coliforms Recovered by 43 Means of the Three Assay Procedures Before and After Exposure to Chlorine
5 Percent of Fecal Coliforms Surviving 30 44 Minutes Contact at Various Levels of Chlorine Concentrations
6 Levels of Fecal Coliforms Recovered by 49 Means of the Three Assay Procedures Before and After Exposure to Chlorine With Dye
7 Percent Fecal Coliforms Surviving 30 50 Minutes Contact With Various Levels of Chlorine and Dye
8 Statistical Comparisons of the Three 60 Testing Procedures for Fecal Coliform Recovery
9 Ratios of Results From the Three Fecal 62 Coliform Enumeration Techniques at Various Dye Concentrations
10 Ratios of Results From the Three Fecal 63 Coliforms Recovery Techniques at Various Chlorine Concentrations
11 Ratios of Results From Fecal Coliform 64 Recovery Procedures at Various Chlorine and Dye Concentrations
V
LIST OF FIGURES
Table Page
1 Processes for Fecal Colifonn Enumerations 29 Using the Std-MF, Mod-MF and MPN Procedures.
2 Membrane Filter Apparatus. 31
3 Comparisons of Percent of Fecal Coliforms 40 Surviving 30 Minutes of Contact With Dye, to the Dye Concentraton.
4 Relationship of Colifonns Recovered 46 Following Chlorination to the Level of Chlorine, When the MPN Assay Method Was Used.
5 Relationship of Colifonns Recovered 47 Following Chlorination to the Level of Chlorine When the Std-MF Procedure Was Used.
6 Relationship of Colifonns Recovered 48 Following Chlorination to the Level of Chlorine When the Mod-MF Technique Was Used.
7 Relationship of Colifonns Recovered 52 Following Contact With Chlorine and Dye, to the Level of Chlorine When the MPN Assay Method Was Used.
8 Relationship Between Coliforms Recovered 53 Following Exposure to Chlorine and Dye to the Level of Chlorine When the Std-MF Procedure Was Used.
9 Relationship Between Coliforms Recovered 54 Following Contact With Chlorine and Dye to the Level of Chlorine When the Mod-MF Assay Method Was Used.
10 Comparison of Fecal Coliforms Recovered 56 Using the Std-MF Procedure and the MPN Procedure.
11 Comparison of Fecal Coliforms Recovered 58 Using the Mod-MF Procedure and the MPN Procedure.
vi
LIST OF FIGURES
Table
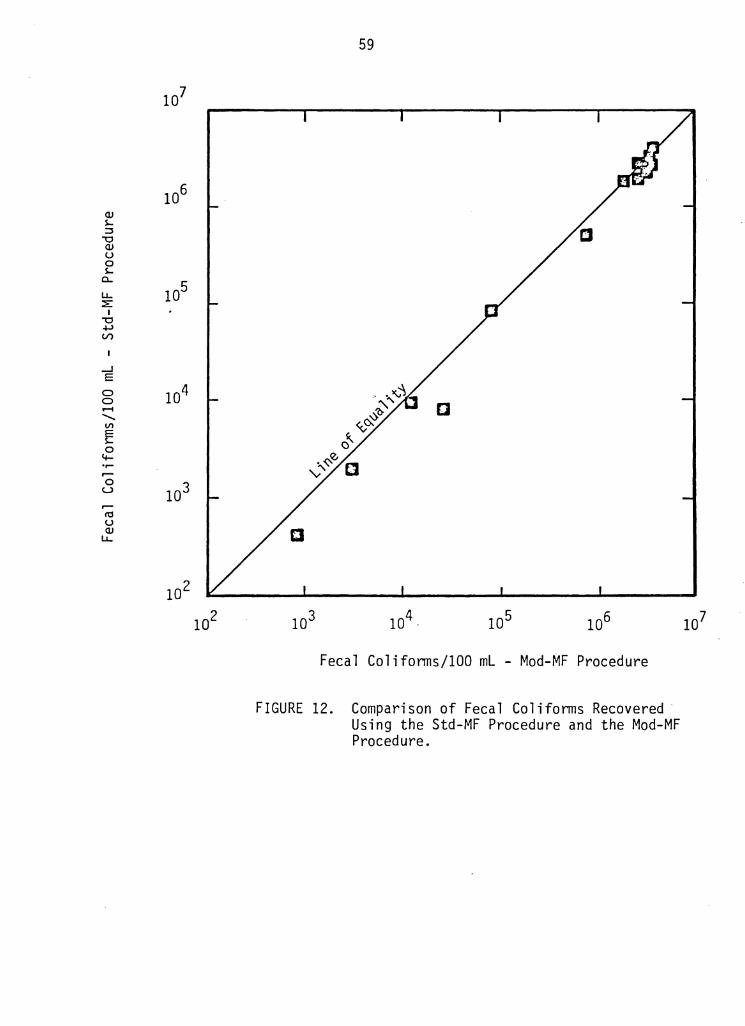
12 Comparison of Fecal Coliforms Recovered 59 Using the Std-MF Procedure and the Mod-MF Procedure.
vii
LIST OF APPENDIX TABLES
Number
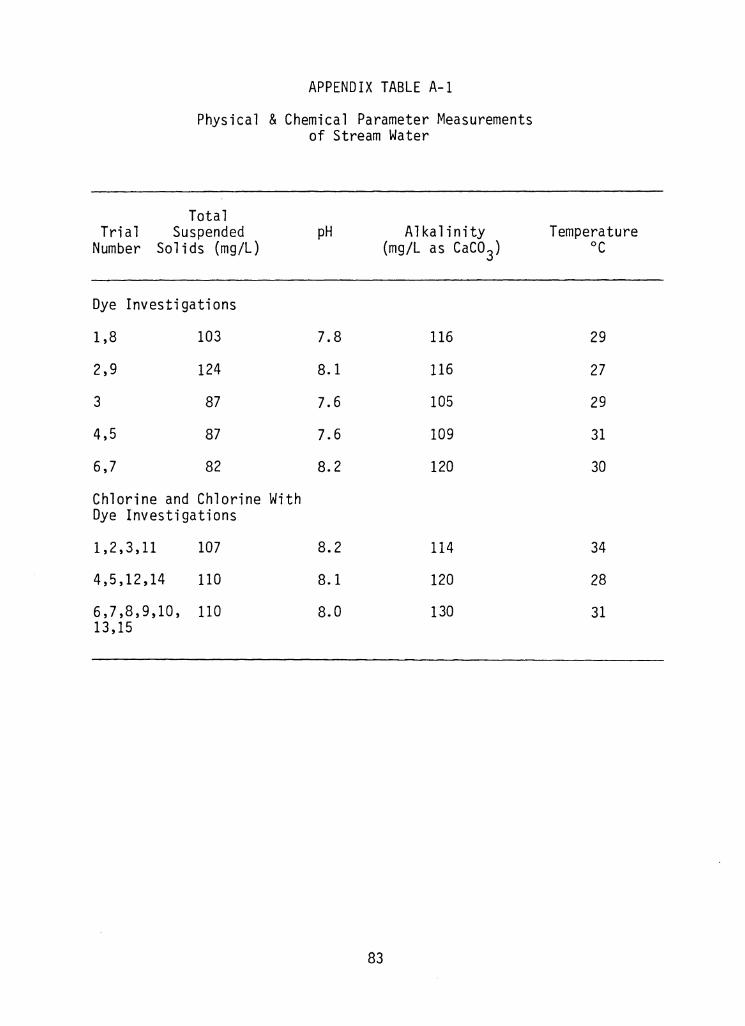
A-1 Physical and Chemical Parameter Measurements of 83 Stream Water
A-2 MPN Determinations 84
A-3 Standard MF Plate Counts 85
A-4 Modified MF Plate Counts 86
A-5 Standard Plate Counts 87
A-6 Chlorine Concentration Measurements 88
A-7 MPN Determinations 89
A-8 Standard MF Plate Counts 90
A-9 Modified MF Plate Counts 91
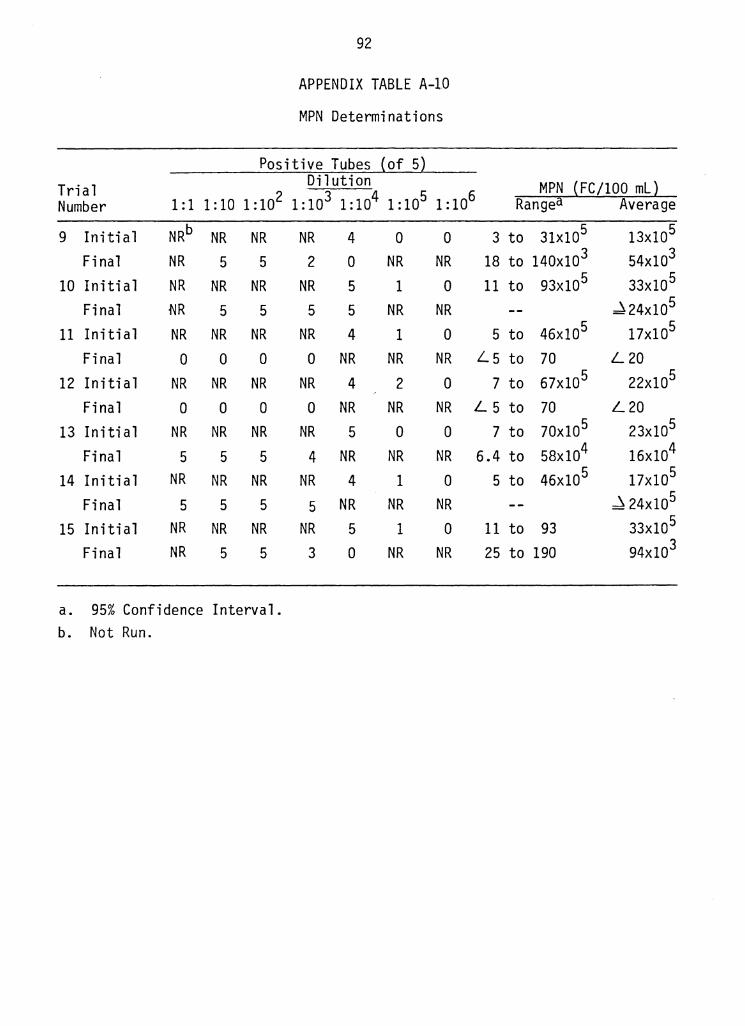
A-10 MPN Determinations 92
A-11 Standard MF Plate Counts 93
A-12 Modified MF Plate Counts 94
A-13 Chlorine Concentration Measurements 95
8-1 Linear Regression Analysis for -log Percent 96 Survival of Fecal Coliforms Versus Average Chlorine Concentration Using Std-MF Technique
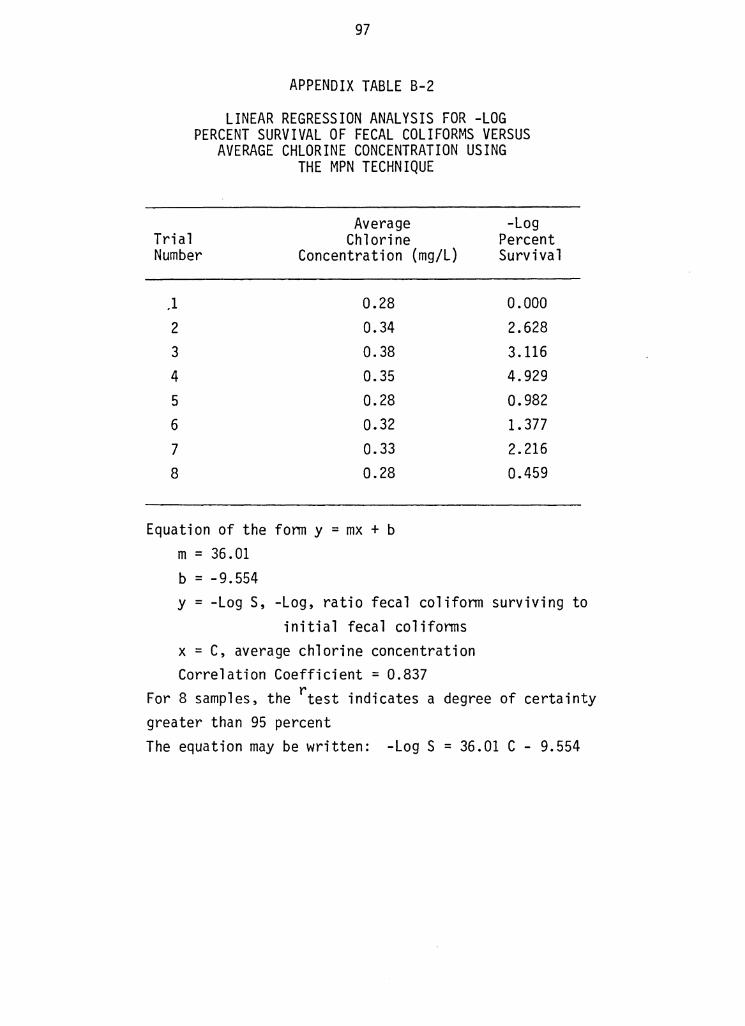
B-2 Linear Regression Analysis for -1og Percent 97 Survival of Fecal Coliforms Versus Average Chlorine Concentration Using the MPN Technique
8-3 Linear Regression Analysis for -log Percent 98 Survival of Fecal Coliforms Versus Average Chlorine Concentration Using the Mod-MF Technique
B-4 Linear Regression Analysis for -Jog Percent 99 Survival of Fecal Coliforms Versus Average Chlorine Concentration {With Dye) Using the Std-MF Technique
8-5 Linear Regression Analysis for -log Percent 100 Survival of Fecal Coliforms Versus Average Chlorine Concentration (With Dye) Using the MPN Technique
viii
Number
B-6
B-7
B-8
B-9
B-10
B-11
B-12
B-13
B-14
LIST OF APPENDIX TABLES
Linear Regression Analysis for -log Percent Survival of Fecal Coliforms Versus Average Chlorine Concentration {With Dye) Using the Mod-MF Technique
Statistical Analysis of Coliform Survival for Chlorine Contact Versus Chlorine and Dye Contact Using the Mod-MF Technique
Statistical Analysis of Coliform Survival From Chlorine and Dye Contact Versus Predicted Survival From Chlorine Contact Using the Std-MF Technique
Statistical Analysis of MPN and Std-MF Techniques for Chlorine Investigations
Statistical Analysis of MPN and Mod-MF Techniques for Chlorine Investigations
Statistical Analysis of Mod-MF and Std-MF Techniques for Chlorine Investigations
Statistical Analysis of Ratios of MPN/Std-MF Technique for Initial Samples Versus Final Samples With Dye Stress
Statistical Analysis of Ratios of MPN/Std-MF Technique for Initial Samples Versus Final Samples With Chlorine Stress
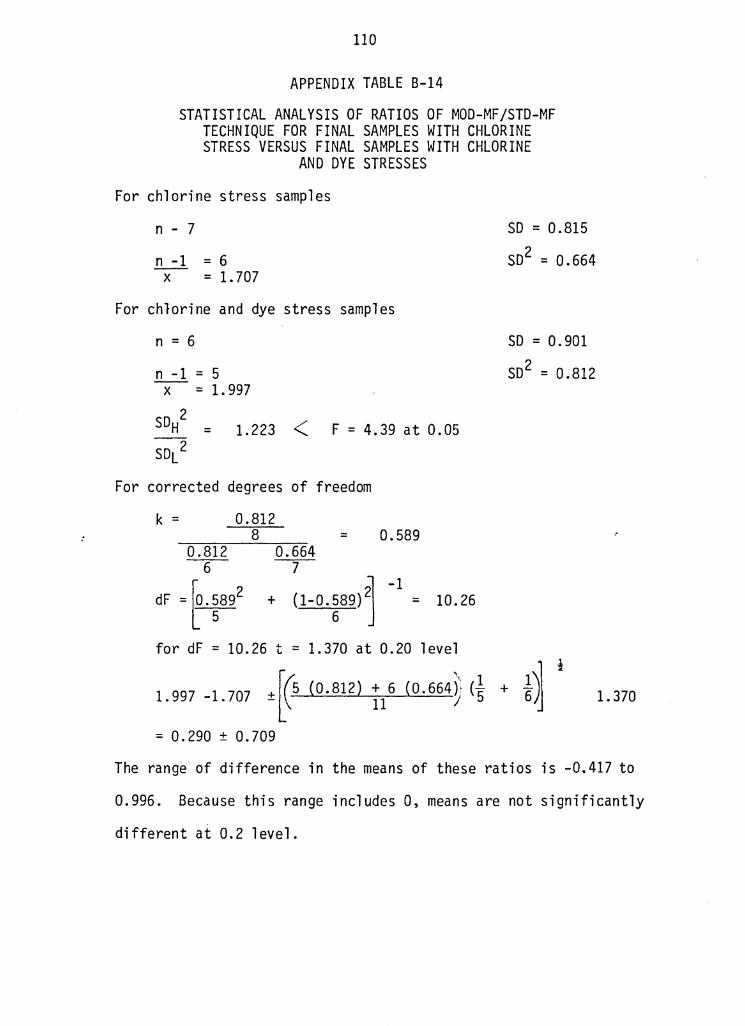
Statistical Analysis of Ratios of Mod-MF/ Std-MF Technique for Final Samples With Chlorine Stress Versus Final Samples With Chlorine and Dye Stress
ix
Page
101
102
103
104
105
106
107
108
109
I. INTRODUCTION
The need for maintaining large, safe water supplies to serve ever
growing urban population centers has been a concern of community leaders
for centuries. Contamination of these supplies by pollutants from
industrial and domestic discharges as well as nonpoint sources has
threatened public health. Of particular importance is the degradation
of water sources by contamination with disease causing-organisms. Water
has been long recognized as a vector in the transmittance of pathogenic
diseases including cholera, polio, dysentery, hepatitis, and typhoid, To
reduce the possibility of transmitting these diseases via the water
route, the practice of disinfecting wastewaters prior to discharge
has been in common use over the last century. The most frequently used
method of inactivating disease causing organisms in the U. s. is
disinfection with chlorine.
Because the methods of detection and enumeration of enteric pathogens
are far too cumbersome and costly for routine use, the bacteriological
quality of water is based on testing for non-pathogenic indicator
organisms, principally the fecal coliform group. These bacteria reside
in the intestinal tract of man and are excreted in large numbers in feces
of man and other wann-blooded animals. Detection of fecal coliforms in
water suggests that viable pathogens are present,
The two widely accepted techniques for the enumeration of fecal
coliforms in water and wastewater samples are the multiple-tube fermentation
method and the membrane filter method as outlined in Standard Methods for the
Examination of Water and Wastewater (1). The multiple-tube fermentation
technique, known as the Most Probable Number (MPN) technique, is based
on a statistical analysis of inoculated fermentation tubes from multiple
1
2
dilutions. The membrane filter technique is a direct colony count of
organisms on a membrane. Both of these methods involve the use of a
selective media and elevated incubation temperatures to encourage growth
of fecal coliforms and attenuate the growth of interfering organisms.
Many researchers have expressed concern in recent years that indicator
organisms may be stressed by numerous environmental factors including:
irradiation by sunlight, wide ranges in pH, toxic substances, high and
low temperatures and exposure to disinfectants. Stress makes the organisms
more difficult to recover than they normally would have been. As a result,
the bacteriological quality of a water may not be accurately predicted by
using conventional techniques. Several methods have been developed for
the purpose of eliminating or minimizing the number of organisms that
go undetected in the presently used methods (1).
Investigators have examined the movement of bacteria and other pollutants
in water bodies with the aid of fluorescent tracers (27). Coliform die-off
and dispersion and dilution of wastewater effluents have been studied
extensively by such methods (34). In some cases, it is not clear what
effects the tracers or chlorine and other waste-stream constituents may
have on coliform survival. It has been shown that chlorine and other
wastewater pollutants (e.g., heavy metals) stress coliforms, so under
these conditions it would seem appropriate to use stressed organism
recovery techniques.
The objectives of this study were to evaluate the effects of a
fluorescent dye and of chlorine on the enumeration of fecql coliforms and
the effectiveness of various methods for fecal coliform recovery, In
order to accomplish these objectives, this investigation was divided
into three phases. In the first phase, fecal coliforms were exposed
3
to a fluorescent tracer, rhodamine WT, to determine if it was toxic
to the organisms and created stress which would inhibit recovery of
the organisms by standard methods. In the second phase, fecal
coliforms were exposed to chlorine, to again quantify any toxic
effects and evaluate the stress caused by the chlorine. In the
third phase, fecal coliforms were subjected to rhodamine WT and
chlorine at the same time to evaluate the possibility that the two
compounds might synergistically affect the recovery of fecal
coli forms.
Organisms levels were measured by means of three methods: the
MPN technique and the standard and modified membrane filtration
procedures (Std-MF and Mod-MF). The MPN method is widely recognized
as a good procedure for recovering stressed organisms, whereas
stressed organisms are frequently undetected by means of the Std-MF
method. The Mod-MF procedure provides values more similar, if not
equal to MPN results. By using the relationships among the results
obtained by the three techniques, it was possible to quantify the
toxic and stressful effects of the dye and chlorine on fecal coli-
forms. The results also provide the basis for an important state-
ment about the suitability of the three methods for recovering stressed
organisms.
II. LITERATURE REVIEW
Topics that have been reviewed in the literature, which are presented
in the following sections include: historical aspects of waterborne
pathogens, the significance and physiology of fecal coliforms, standard
and modified tests for coliform enumeration, bactericidal effects of
chlorine, the use of fluorescent dyes and the toxicology of fluorescent
dyes.
Historical Aspects of Waterborne Pathogens
With the development of the industrial revolution, people were
attracted to urban areas in larger numbers and forced to live under more
crowded conditions. As the population density increased, so did the
frequency of epidemics. Although many theories were developed as to
the transmission of disease, it was not apparent that a major vector of
communicable diseases was water, until 1854 when a localized epidemic
of Asiatic Cholera broke out in London (2). John Show and John York,
through careful investigations, demonstrated that the Broad Street Pump
was the source of the infection; and furthermore, the water was being
contaminated by sewage leaking from a damaged sewer nearby. The
sewer served the home of someone suffering from the disease. This
event established, without a doubt, that water was a m~jor vehicle for
the spread of one of the greatest plagues afflicting mankind, Asiatic
Cholera (2).
The successful growth in pure culture of the anthrax-causing
bacterium, by Robert Koch in 1875, is considered by many to be a major
event in the origin of bacteriology. In 1883, the pathogens causing
4
5
Asiatic cholera were isolated, followed by the culturing of the causative
organism of typhoid in 1884. These discoveries provided the means to
prove that water was a major medium for disease transmission {2).
Chlorination of water supplies was practiced on an emergency basis
after 1850, but not until 1912 when equipment for feeding gaseous chlorine
was developed, did chlorine disinfection become almost universally practiced.
Since that time, the incidence of waterborne diseases has been sub-
stantially reduced (2).
Waterborne disease outbreaks have been reported extensiveJy from the
19201 s to the present. The incidences of outbreaks were summarized by
Craun and McCabe (4). The number of outbreaks steadily declined from
1938 until 1955, from 45 per year to 10 per year. From 1955 through
1970, the data indicate a slight increase in the average number of
outbreaks. However, it was suggested that this increase might be
attributed to more active surveillance and differences in reporting.
More recently,Craun {5) examined the outbreaks of waterborne
diseases in the U.S. reported during the period 1971 to 1978. A total
of 224 outbreaks, affecting 48,193 persons and resulting in two deaths
were reported during this period, Outbreaks in municipal and community
water systems resulted in the most number of illnesses. The most fre~
quent cause of outbreaks was contamination of the water distribution
system by cross connections and backsiphonage, while the second most
frequent cause resulted from treatment deficiencies, Etiologic agents
were identified in only 45 percent of the outbreaks. The remainder
of the cases were classified as acute gastrointestinal illness characterized
by the symptoms; abdominal cramps, nausea, vomiting and diarrhea.
6
Waterborne etiological agents identified included chemical poisoning,
a. Most probable number techniques. b. Standard fecal coliform membrane filter technique. c. Modified fecal colifonn membrane filter technique. d. Average combined chlorine concentration.
Surviving Mod-MFc
0.88
49.
0.0024
0
8.0
16.
1. 2
51
with chlorine and dye at various concentrations were calculated and
are presented in Table 7. The MPN recoveries clearly show the
"threshold value". In Trials 10 and 13, 70 percent of the fecal
coliforms survived an average chlorine residual of 0.28 mg/L. At
0.34 mg/L of chlorine nearly 99.999 percent of the microbes were
killed. Figures 7, 8 and 9 show comparisons of the percent of fecal
coliforms surviving 30 minutes of contact with dye and chlorine versus
the average combined residual chlorine concentration for each of the
three fecal coliform enumeration techniques. The relationship is
shown as the least squares lines for each enumeration technique. The
degree of certainty for the correlations of data from Tables 9, 10,
and 11 were 90, 90 and 95 percent, respectively. The calculations
of the linear regressions and correlations are presented in Appendix
Tables B-4, B-5 and B-6.
One method of comparison was to pair samples subjected to chlorine
and dye, to samples of similar chlorine concentrations from the chlorine
tests. This comparison shows that the average recoveries from the
chlorine with dye trials was higher. The log-t test for the Mod-MF
results is included in Appendix Table B-7. The same comparison using
the Std-MF and MPN techniques indicates that recoveries from chlorine
and dye trials were greater than in the chlorine trials.
From the data generated in chlorine investigations, using the
Std-MF method, an equation for the percent fecal coliforms surviving
30 minutes of contact versus the average chlorine concentration was
mathematically determined. This equation was:
-log S = 36.25 C - 9.165
Where, S = percent fecal colifonns surviving
C = average chlorine concentration, mg/L
1/1 QJ
+l ::::, s:: .....
L 0 (V)
~ QJ +l 4-~
en s:: ..... >
•r-> ~ ::::,
V)
1/1
!;: 0
4-.,.... ,-0 u
,-co u QJ
w... 4-0
+l s:: QJ u ~ QJ
0..
100
10
1.0
0.1
0.01
0.001
0.0001 0
52
C
[J
Equation of Line: -Log S = 42.03C - 10. 96 Degree of Certainty= 90% S = Percent of Fecal Colifonns
C Surviving
= Average Total Chlorine {} Residual (mg/L)
0.1 0.2 o.3 o.4 Average Chlorine Residual (mg/L)
FIGURE 7. Relationship of Coliforms Recovered Following Contact With Chlorine and Dye, to the Level of Chlorine When the MPN Assay Method Was Used.
0.5
V) a., .µ ::::, C: ....
0 M
s.. a., .µ 4-~
0) C: .... > .... > s.. ::::,
V'l
V) c 0
4-•r-
100
10
1. 0
0 0.1 u ,--~ u a.,
LL..
4-0 .µ C: a., u s.. a.,
0..
0.01
0.001
0.0001 0
53
Chlorine -chlorine and Dye---
Equation of Line: -Log S = 38.17C - 9.365 Degree of Certainty= 90% S = Percent of Fecal Colifonns
Surviving C = Average Total Chlorine
Residual (mg/L)
0 .1 0.2 0.3
(See Figure 5)
0
0.4 Average Chlorine Residual (mg/L)
FIGURE 8. Relationship Between Colifonns Recovered Following Exposure to Chlorine and Dye to the Level of Chlorine When the Std-MF Procedure Was Used
0.5
V) a,
. .µ :, C
0 M
s... a,
.µ 4-.:x: O'> C ..... > .... > s... :,
(/)
V)
E 0
4-.... ...... 0 u
,--ttl u a,
l..1.-
4-0 .µ C a, u s... a,
0..
100
10
1. 0
0.1
0.01
0.001
0.0001 0
54
Equation of Line: -Log S = 39.88C - 19.20 Degree of Certainty= 95% S = Percent of Fecal Coliforms
Surviving C = Average Total Chlorine
Residua 1 (mg/L)
0.1 0.2
A
0.3 Average Chlorine Residual (mg/L)
0,4
FIGURE 9. Relatiorship Between Coliforms Recovered Following Contact With Chlorine and Dye to the Level of Chlorine When the Mod-MF Assay Method Was Used.
0.5
55
By substituting selected chlorine concentrations into the equation,
one can predict a percentage of coliforms surviving at that chlorine
level. The chlorine concentrations selected were the measured values
from the investigations of chlorine with dye (0.26, 0.28, 0.31, 0.34
and 0.35 mg/L). By solving the equation the percent survivals were
predicted (55, 10, 0.85, 0.69 and 0.03 percent). Each predicted percent
survival was compared with a value measured in the laboratory for
coliforms exposed to chlorine and dye. Although the measured percent
colifonn survival derived from exposing the microbes to both agents
averaged less than 40 percent of the predicted survival, no statistically
significant difference between the two data groups was detected. The
statistical analysis for this comparison is presented in Appendix Table B-8.
The data obtained from perfonning the other two enumeration techniques
were used to compare predicted coliform survivals after chlorine exposure
to survival rates for exposure of the microbes to chlorine and dye. The
computations for this comparison are not included herein, but no
statistically significant difference between the data groups was found.
Comparison of Enumeration Techniques
Figure 10 compares fecal colifonn recoveries by the standard
membrane filter procedure and the MPN procedure. Data plotted above
the line of equality indicate higher recoveries by the assay technique
given on the ordinate axis. Points below this line signify higher
recoveries by the technique labeled along the abscissa. It can be
seen from this graph that except where microbe levels were greater
than 106 per 100 ml, recoveries with the Std-MF procedure were lower
than the MPN values.
Q.) 106 s... ::::,
"O Q.) u 0 s...
CL
Li.. ::E:
105 I "O .µ V)
_J E
0 0
104 -........ (./)
!:: 0 ~ ..... ..... 0 u ..... 103 tO u (lJ
Li..
56
0 • "v~
:\" 0 .:::,.1> <-v~
of<.. 0 • <::-e, 0
'v"
0 0
0
Fecal Coliforms/100 ml - MPN Procedure
FIGURE 10. Comparison of Fecal Coliforms Recovered Using the Std-MF Procedure and the MPN Procedure.
57
Figure 11 is a graphical comparison of fecal colifonn recoveries
using the Mod-MF procedure and the MPN procedure. Between the values of
105 and 107 colifonns per 100 ml. The data appear evenly distributed
on both sides of the line of equality. Below 105 per 100 ml, most
data points are below the line, suggesting higher recoveries were obtained
by the MPN method in this range. Because the points plotted are closer
to the line of equality than those in Figure 10, it can be concluded
that the.Mod-MF procedure more closely approximated the MPN technique
than the Std-MF method.
Figure 12 presents a comparison of fecal colifonn recoveries using
the Std-MF procedure and the Mod-MF technique. Again between 105 and
107 colifonns per 100 ml, the two assay methods gave similar results. It
can also be seen in this figure that below 105 colifonns per 100 ml, the
Mod-MF technique gave slightly higher recovery values than the Std-MF method.
The recovery techniques were compared to one another by using the
data from Table 4. It was found that initial samples the MPN method
yielded larger recoveries of fecal colifonns than the Std-MF method at
the 0.12 level of significance; MPN results were greater than the Mod-MF
results at a 0.39 level of significance; and, Mod-MF survivals exceeded
Std-MF values at a 0.10 level of significance. Including both initial
and final coliform titers from Table 4 (after exposure to chlorine),
the recovery techniques were compared. It was found that MPN results
exceed Mod-MF results which were greater than Std-MF values at a level
of significance of 0.05. A summary of these comparisons is presented
in Table 8, and the statistical calculations are provided in Appendix
Tables B-9, B-10 and B-11.
106 Q) s.. :::,
-0 Q) u 0 s..
Q.
105 LL ~
I -0 0 ~
...J E
0 104 0 ..... ....... VI
E 0
4-•.-,.... 0
103 u ,.... n:s u Q)
LL
58
• A
. ,,_,"\ ':-.."'
~1> A <v~ . A of<. A
.~e ""'
A
Fecal Colifonns/100 ml - MPN Procedure
FIGURE 11. Comparison of Fecal Colifonns Recovered Using the Mod-MF Procedure and the MPN Procedure.
106 Q) s... ::,
"'O Q) u 0 s...
a.. 105 LL
::E I
"'O +' V)
...J E
0 104 0 ...-I ....... 1/)
E 0
4-•r-,.... 0
103 u ,.... n:, u a,
LL
59
. ~"""\ ~ []
~~ of<..
e ·"' a v" .
Fecal Colifonns/100 ml - Mod-MF Procedure
FIGURE 12. Comparison of Fecal Colifonns Recovered· Using the Std-MF Procedure and the Mod-MF Procedure.
60
TABLE 8
STATISTICAL COMPARISONS OF THE THREE TESTING PROCEDURES FOR FECAL COLIFORM RECOVERY*
Number of Comparison Samples
Compared
Initial Samples Only
MPN with Std-MF 8
MPN with Mod-MF 8
Mod-MF with Std-MF 6
Initial and Final Samples
MPN with Std-MF
MPN with Mod-MF
16
16
Mod-MF with Std-MF 12
Statistical Comparison
MPN > Std-MF
MPN > Mod-MF
Mod-MF > Std-MF
MPN > Std-MF
MPN > Mod-MF
Mod-MF> Std-MF
Level of Significance at or Less Than
0.12
0.39
0.10
0.05
0.05
0.05
* Comparison of results for fecal coliform recovery for results found in Table 4.
61
Measurement of Organisms Stress
By comparing the results qf the enumeration techniques, one observes
that when the organisms were not exposed to stress-causing agents, there
was little difference in the recovery values obtained by each technique.
However, when the coliforms were exposed to chlorine the enumeration
techniques gave less similar results. In an effort to determine if
any correlation existed between the stress on the coliforms and the
presence of chlorine, ratios between the coliforms recovered by each
enumeration procedure were calculated. These data are presented in
Table 10. For initial samples, the mean MPN/Std-MF ratio was 1.24.
For final samples, the mean ratio increased to 2.79. This is a
statistically significant increase at the 0.01 level of significance.
When the initial samples were compared to the final samples of the chlorine
trials, the MPN/Mod-MF and the Mod-MF/Std-MF ratios also showed appreciable
increases. The level of significance for this comparison of ratios was
0.01 for MPN/Mod-MF and 0.10 for Mod-MF/Std-MF. Statistical analysis
for the MPN/Std-MF ratios is presented in Appendix Table B-13.
The ratios for initial and final samples of the dye investigations
are provided in Table 9. The supposition was that if dye, like chlorine,
stressed the coliforrns, a significant change in the recovery ratios would
result. There was no significant change in the mean of the ratios. The
mean Mod-MF/Std-MF ratio increased from 1.13 to 1.18. This was not a
statistically significant change. The other two ratios decreased. A
statistical analysis of the initial and sample ratios for the dye
investigations is shown in Appendix Table 8-12.
62
TABLE 9
RATIOS OF RESULTS FROM THE THREE FECAL COLIFORM ENUMERATION TECHNIQUES AT VARIOUS DYE CONCENTRATIONS
Trial Concentration Ratio Number of MPNa/Std-MFb MPNa/Mod-MFc Mod-MFc/Std-MFb Dye (ppb)
1 Initial 0 1.43 1.35 1.06 Final 1.40 1.14 1. 23
2 Initial 0 1.56 1.33 1.17 Final 1.44 1.08 1. 33
3 Initial 100 1.58 1.36 1.16 Final 2.20 0.97 2.27
4 Initial 100 o. 72 0.93 0. 77 Final 2.62 2.08 1.26
From the results of these preliminary trials, it was clear that
chlorine (above the "threshold value") was lethal to the microbes. In
Trial 5 only 400 FC/100 ml survived exposure to 0.48 mg/l of chlorine.
The minimum number of organisms that could be accurately enumerated was
approximately 200 FC/100 ml. For this reason, it was decided that the
chlorine level in the reactors should approach this level, so as to kill
approximately from 99 to 99.9 percent of the organisms.
After the chlorine "threshold value" was established, Trials 1
through 8 were performed using all three fecal coliform enumeration
procedures. Although the average combined residuals varied no more than
0.1 mg/l, the percent of organisms surviving the exposure varied from
100 percent to less than 0.0001 percent (See Table 5). As a result,
when the correlations between chlorine residuals and percent fecal coli-
fonn survivals are examined, it should be noted that the relationship is
70
very sensitive to the measured chlorine residual. The linear regressions
for the data in Table 5, have correlations of 95 percent (see Appendix
Table B-1, B-2 and 8-3). The linear regression equations were of the
form:
Where:
y = mx + b
y = -log S = The negative logarithm of the ratio of the
final number of fecal coliforms per 100 ml
to the initial number of fecal coliforms
per 100 ml
x = C = Average total chlorine residual (mg/l)
m = Slope of the line
b = y-intercept value
For the purpose of this study, the equation was used in the following
form:
-log X = mC + b
From the data in Table 4, the coefficients m and b were calculated
for each enumeration technique and are shown on each respective figure.
In sentence form, the equation says, the logarithm of the ratio of the
organisms surviving 30 minutes of contact to the original number of
organisms present in the reactor is inversely proportional to the
concentration of total chlorine present. This equation applies only
when the average total chlorine residual is above the "threshold value"
and when the total chlorine residuals have little or no free available
chlorine.
Free and total chlorine residuals were measured initially and at the end
of the experiments. In the analysis of the data, the initial and final
71
total residuals were averaged to produce a single number for ease of
comparison. As can be seen from the results, in Table 4, the chlorine
residuals dissipated approximately the same amount throughout each
trial.
A clarification of the word initial might be in order. In all
three investigations, the initial sample was taken after the coliforms
were briefly exposed to the chemical agent under consideration. For
example, 1n the dye investigations, the dye was injected into the
reactor, then the coliforms were introduced, the reactor was stirred
rapidly, and then the coliform sample with withdrawn. Coliforms, there-
fore, were exposed to the dye for a period of 15 to 20 seconds in initial
samples. The chlorine investigations and chlorine with dye investigations
were conducted in the same manner. By comparing the coliform concentration
in initial samples of the dye, chlorine and chlorine with dye investigations
(See Tables 1, 4 and 6), one find that approximately the same number of
organisms were present regardless of the chemical agent. Therefore, it
is not likely that a significant number of fecal coliforms were killed
during the first 15 to 20 seconds of exposure.
The disinfecting power of chlorine can be neutralized by sodium
thiosulfate; however, for several reasons thiosulfate was not used in
these tests. It was not clear what effect thiosulfate might have had
on the stressed organisms, organism recovery, or on the chemical nature
of the dye used in these studies. The chlorine levels in the reactors
were very low and the coliform samples were diluted into peptone water
and immediately enumerated. With these considerations in mind, it was
decided that the use of thiosulfate would only reduce the reliability
of the results.
72
Not all of the data plotted in Figures 4, 5 and 6 fell along the
best-fit line. This could be attributed to several variables in the
testing arrangement. These variables included the suspended solids
in the reactor, the pH of the stream water, the free available chlorine
to which the coliform were subjected, and the number of organisms
injected into the reactor initially.
Other researchers have also shown that suspended solids in water
will tend·to reduce the disinfecting power of chlorine (3). The two
mechanisms by which this occurs are, a shielding effect of the
organisms by the solids and the chlorine demand of the solids.
It is well known that the pH of water affects the relative distribution
of hypochlorous acid and hypochlorite ion, the two forms of free chlorine.
Lower pH values favor the formation of hypochlorous acid, the more effective
disinfectant. It is obvious that changes in the pH of the stream water
would affect the distribution of hypochlorous acid and hypochlorite ion
in the reactor and, as a result, coliform survival. The pH values varied
between 8.0 and 8.2. It is not likely that this small change in pH
would have seriously altered the disinfecting efficiency of the chlorine.
When chlorine is added to water containing ammonia (a natural
stream water in this case), the hypochlorous acid reacts with ammonia
to form monochloramine and dichloramine. The rate of reaction and the
relative amounts of chloramines formed is dependent upon the pH and
temperature. Free chlorine residuals in water have a far greater
disinfecting power than combined residuals. Many of the initial samples
contained a small amount of free chlorine. It is likely that its superior
disinfecting capacity would reduce the percent of organisms surviving
below that which would have been predicted based on combined residuals
73
alone. This shortcoming was recognized prior to conducting these experiments,
and an attempt was made to alleviate this inequality. The reactors were
agitated for 30 minutes after chlorine addition to allow the free available
chlorine to stabilize and react with the ammonia present.
The chlorine investigations provide an example of how the ratios
of enumeration techniques can be used to detect stress (See Table 10).
The mean ratio of MPN results to Std-MF results for the initial samples,
prior to chlorine exposure, was 1.24. This means the MPN results
exceeded the Std-MF results by an average of 24 percent. When organisms
were exposed to chlorine, the mean ratio increased to 2.79, thus
indicating MPN values were greater than Std-MF values by 179 percent.
The range of difference between the means was calculated using the
corrected degrees of freedom. The means were found to be significantly
different at the 0.99 level of confidence. This ratio analysis can be
used to detect stress in fecal colifonn populations.
The ratios of MPN/Mod-MF and Mod-MF/Std-MF results were analyzed
by the same statistical technique, and the mean ratios for the initial
samples were found to be significantly different than the ratios obtained
from the chlorine studies at the 0.99 level of certainty.
Chlorine With Dye Investigations
The objectives of the chlorine and dye studies were as follows:
1) to evaluate the possible synergistic effects of chlorine and
rhodamine dye on fecal coliforms; and 2) to investigate organism
stress and compare this stress to that of previous studies.
It was concluded earlier that the percent survival of coliforms
subjected to dye did not appear to be related to the dye concentration.
On the other hand, the inference of the chlorine studies was that the
74
logarithm of the ratio of survivors to the original population was
inversely proportional to the concentration of chlorine in the reactor.
Therefore, it would seem logical that the chlorine with dye investigations
would produce mortality plots similar to those of the chlorine results.
Figures 7, 8 and 9 show the relationship between fecal coliforms sur-
viving contact with chlorine and dye, and the level of chlorine. These
survival curves appear to be very similar to Figures 5, 6 and 7.
Figur.e 8 shows survival lines for chlorine alone and chlorine with
dye. It has been shown that dye alone did not affect coliform recoveries,
but Figure 8 would seem inconsistent with this conclusion. The chlorine
with dye line is shifted to the left, indicating that the chlorine residual
"threshold value" at which logarithmic death begins was lowered when dye
was added to the reactors. The shifted line would also suggest that fewer
coliforms survived at any given chlorine concentration when dye was present.
This incongruity in the data was tested by the following methods.
The first method of comparing the two sets of results was to pair
trials from the chlorine studies with trials from the chlorine and dye
investigations. Trials with similar chlorine residuals were paired. A
logarithmic paired-t test was used to statistically compare the two data
sets. In three of the seven trials, the survivals were higher from the
chlorinated reactor than the reactors with chlorine and dye. The stati-
stical analysis indicated practically no difference existed between re-
coveries after chlorine exposure and the recovery of organisms after
exposure to chlorine and dye.
A second method of comparing chlorine results with chlorine and
dye survivals was used. The linear regressions equation for the percent
of fecal coliforms surviving versus the average chlorine concentration
75
was calculated from the recoveries measured by the Std-MF method
(See Appendix Table B-4). The measured levels of chlorine (0.26, 0.28,
0.31, 0.34 and 0.35 mg/L) for Trials 9 through 15 were substituted into the
equation. Solving the equation, the percentage of coliforms at the above
chlorine levels were predicted to be 55, 10, 0.85, 0.69 and 0.03. The
paired-t test was used to compare these predicted survival values to
the measured survival levels in the chlorine with dye investigations
(7.3, 4.0, ·o.89, 0.001 and 1.2 percent). In most cases the actual
survivals from exposure to the two agents together were lower than the
predicted survivals. Because the standard deviation was large, the
sample t score (ts) was well below the value at the 0.20 confidence level.
It can be concluded by this analysis that there was no significant
difference in the survival curves for the chlorine investigations and
those of the chlorine with dye investigations.
The chlorine with dye trials were analyzed in the same manner as the
chlorine data. It was detennined that the enumeration ratios Vqried
similarly in each study. If the dye had caused stress, the enumeration
ratios of final samples from the chlorine with dye studies would have
been greater than the enumeration ratios of final samples in the chlorine
trials. The mean Mod-MF/Std-MF ratio for 15 initial samples was 1.13,
after chlorine exposure. This ratio increased to 1.71 whereas the
average ratio for final samples taken in the chlorine with dye investi-
gations was 2.00. However, when the range of the difference in ratio
means was calculated, with corrected degrees of freedom, the range
included zero, at the 0.20 level. Thus, one can only be less than 80
percent certain that dye caused an increase in the Mod/Std-MF values
for chlorinated samples.
76
The mean ratio of MPN/Std-MF values for chlorine alone was 2.79.
The average ratio for chlorine with dye exposure increased to 2.91.
At an 80 percent confidence level, zero is within the range of
difference in the means. For chlorine with dye trials, the MPN/Mod-MF
ratio decreased to 1.58 from 1.94 in the chlorine trials, It was
expected that all three of these ratios would increase significantly
if the dye caused stress on the coliforms in addition to that created
by chlorine alone. These data clearly do not indicate this expected
result. It may, therefore, be concluded that rhodamine WT and
chlorine did not stress fecal coliforms more than chlorine aJone.
Comparison of Enumeration Techniques
The results of the MPN work is compared to Std-MF results in
Figure 10. It can be seen from the graph that below l06 fecal coliforms
(FC)/100 ml, recoveries using the MPN method were greater than those
using the Std-MF technique, When microbe counts were above 106 FC/100 ml,
it was not apparent which technique gave improved recoveries. The data
points above 106 FC/100 ml, are primarily initial-sample results (without
toxic agent exposure) whereas the points at the Jower concentrations
are final sample results. The two enumeration procedures, therefore,
yielded simiJar results when the coliforms were in a non-hostile
environment. When chemical agents were added, the MPN results exceeded
the Std~MF results,
This concept is statistically verified in Appendix Table B-9 and
summarized in Table 8. For the chlorine investigation trials, the
initial sample coliform enumerations were compared using the logarithmic
paired-t test. It was found that the MPN results exceeded Std-MF
results at a significance level of 0.12. When both initial and final samples
77
were included in the analysis the level of significance was less than 0.05.
It can therefore be concluded that when fecal coliforms are enumerated with-
out being exposed to stress-causing agents, one can be 88 percent certain
that MPN results will exceed Std-MF values. In the presence of chlorine
one can be greater than or equal to 95 percent certain that MPN values
will be larger than Std-MF values.
Figure 11 provides a comparison of MPN values to Mod-MF values.
In the range 105 to 107 FC/100 ml, the two methods produced similar
coliform recoveries. As in Figure 10, the data points above 105 represent
the initial samples, whereas the lower concentrations were obtained after
the survivor microbes were exposed to chlorine. One deduces that for
coliforms exposed to chlorine, the MPN counts will consistently be higher
than coliform counts derived from the Mod-MF procedure. This deduction
is statistically proven in Appendix Table B-10 and summarized in Table 8.
For samples without stress-causing agents, one can only be 61 percent certain
that MPN levels will exceed Mod-MF plate counts. When coliforms are
exposed to chlorine, one can be 95 percent certain that Mod-MF results
will be less than MPN values,
Graphical and statistical comparison of the Mod-MF and Std-MF results
were similar in nature to the previous comparisons. Figure 13 shows
that, when the coliforms were in contact with chlorine, the Mod-MF
test produced greater values than the Std-MF. For samples without
chlorine exposure, the difference in recovery methods was not obvious.
However, statistical analysis indicated that the Mod-MF survivals were
greater than the Std-MF counts at the 0.10 level of significance. For
the chlorine exposure group, Mod-MF va]ues exceeded Std-MF results at
the 0,05 JeveJ of significance,
VI. SUMMARY AND CONCLUSIONS
A study was conducted to determine the effects of rhodamine WT dye
and chlorine on the recovery of fecal coliforms in stream water under
various conditions. Three different techniques were used for fecal
coliform enumeration: the MPN, Std-MF and Mod-MF procedures. Based
on the results of this study, the following conclusions can be made:
1. For non-chlorinated samples, MPN values exceeded Std-MF values
by an average of 24 percent. The MPN results were approximately
10 percent higher than the Mod-MF values. The paired-ttest was
used to analyze the differences in the data groups. The degree of
certainty that MPN values exceeded Mod-MF and Std-MF results
was only 60 and 88 percent, respectively.
2. The number of fecal coliforms recovered from chlorinated
samples by the Std-MF procedure was 75 percent less than those
recovered by the MPN method. The Mod-MF values were 48 percent
less than the number of organisms recovered by the MPN technique.
A statistical analysis of the data indicated that the degree
of certainty that MPN values exceeded Mod-MF and Std-MF results
was 95 percent.
3. Exposing fecal coliforms in stream water to 100 to 1,000 ppb
of rhodamine WT dye for 30 minutes did not inhibit the recovery
or enumeration of the organisms by any of the assay methods.
4. The number of coliforms that survived exposure to chlorine
and dye was not significantly different from the number surviving
contact with chlorine alone.
78
VII. LITERATURE CITED
1. Standard Methods for the Examination of Water and Wastewater, 14th Edition, American Public Health Association, Washington, D. C. (1975).
2. Sawyer, C. N. and McCarty, P. L., Chemistr For Sanitar McGraw-Hill Book Company, New York, N. Y., 2nd Edition
3. Metcalf and Eddy, Inc., Wastewater Engineering Collection, Treat-ment, Disposal, McGraw-Hill Book Company, New York, N. Y. (1972).
4. Craun, G. F. and McCabe, L. J., "Review of the Causes of Waterborne Disease Outbreaks, 11 Jour. Am. Water Works Assn., _§i, 74-83 {1973).
5. Craun, G. F., "Outbreaks of Waterborne Disease in the United States: 1971-1978,11 Jour. Am. Water Works Assn., 73, 360-369 (1981).
6. Clark, H. F. and Kabler, P. W., "Re-evaluation of the Significance of the Coliform Bacteria," Jour. Am. Water Works Assn., 56, 931-935 (1964). ~
7. Geldreich, E. E., Bordner, R. H., Huff, C. B., Clark, H. F,, and Kabler, P. W., 11Type Distribution of Coliform Bacteria in the Feces of Warm-Blooded Animals,11 Jour. Water Poll. Control Fed., 34, 295-300 (1962).
8. Geldreich, E. E., 11Detection and Significance of fecal Coliform Bacteria in Stream Pollution Sutides, 11 Jour. Water Poll. Control Fed., 37 1722-1725 (1965).
9. McFeters, G. A,, Bissonnette, G. K., Jezeski, J. J., Thompson, C. A., and Stuart, D. G., 11Comparative Survival of Indicator Bacteria and Enteric Pathogens in Well Water,11 Appl. Microbial., 27, 823-829 (1974). ~
10. Mara, D. D., Bacteriolo for Sanitar En ineers, Churchill Livingstone, Edinburgh, England (1974.
11. Anderson, D. A., Introduction to Microbiology, C. V. Mosby Co., St. Louis, Mo. (1973).
12. Hoffman, D. A., Kuhns, J. G., Stewart, R. C., and Crossley, E. I., 11A Comparison of Membrane Filter Counts and Most Probable Numbers of Coliform in San Diego's Sewage and Receiving Waters, 11 Jour. Water Poll. Control Fed., 36, 109 (1964).
13. Mowat, A., "Most Probable Number Versus Membrane Filter on Chlorinated Effluents, 11 Jour. Water Poll. Control Fed., 48, 724-728 {1976). ~
79
80
14. McKee, J. E., McLaughlin, R. T., and Lesgourges, P., "Application of Molecular Filter Techniques to the Bacterial Assay of Sewage," Sewage and Industrial Wastes, 30, 245-252 (1958).
15. Lin, S., "Membrane Filter Method for Recovery of Fecal Coli forms in Chlorinated Sewage Effluents," Appl. Microbial., 32, 544-552 (1976).
16. Lin, S., "Evaluation of Coliform Tests for Chlorinated Secondary Effluents," Jour. Water Poll. Control Fed., 45, 498-505 (1973).
17. Green, B. L., Clausen, E. M., and Litsky, W., "Two-Temperature Membrane Filter Method for Enumerating Fecal Coliform Bacteria from-Chlorinated Effluents," Appl. Microbial., 33, 1259-1264 (1977).
18. Bissonnette, G. K., Jezeski, J. J., McFeters, G. A., and Stuart, D. G., "Influence of Environmental Stress on Enumeration of Indicator Bacteria from Natural Waters," Appl. Microbial., 29, 186-194 (1975).
19. Bissonnette, G. K., Jezeski, J. J., McFeters, G. A., and Stuart, D. G., "Evaluation of Recovery Methods to Detect Coli forms in Water," Appl. and Envt. Microbial., 33, 590-595 (1977).
20. Rose, R. E., Geldreich, E. E., and Litsky, W., "Improved Membrane Filter Method for Fecal Coliform Analysis," Appl. Microbial., 29, 532-536 (1975).
21. Stuart, D. G., McFeters, G. A., and Schillinger, J.E., "Membrane Filter Techniques for the Quantification of Stressed Fecal Coliforms in the Aquatic Environment," App. and Envt. Microbial., 34 42-48 (1977).
22. Presswood, W. G., and Strong, D., "Modification of M-FC Medium by Eliminating Rosalie Acid,," Paper presented at the annual meeting of the Amer. Soc. Micro., New Orleans, La., June, 1977.
23. Butterfield, C. T. et _tl_., "Influence of pH and Temperature on the, Survival of Coliforms and Enteric Pathogens when Exposed to Free Chlorine," Pub. Health Rept., 58, 1837-1866 (1943).
24. Butterfield, C. T., and Wattie, F., "Influence of pH and Temperature on the Survival of Coliforms and Enteric Pathogens when Exposed to Chloramine," Pub. Health Rept., .§1_, 157-192 (1946).
25. Turner, G. K. and Associates, "Fluorometry in Studies of Pollution and Movement of Fluids," Fluorometry Reviews, Palo Alto, California, No. 99418 (1971).
81
26. Dale, R. B., 11Use of Fl uorescei n in the Study of Underground Waters, 11 United States Geological Survey Water Supply Paper, 160, 73-85 {1906).
27. Carpenter, J. H., 11The Chesapeake Bay Institute Study of Baltimore Harbor, 11 Maryland-Delaware Water and Sewage Assoc., Proc. 33rd Annual Conf.: 62-78 (1960).
28. Buchanan, T. J,, "Time of Travel of Soluble Contaminants in Streams, 11 J. San. Eng. Div., ASCE, 90: SA 3: 1-12 (1964).
29. Story, A. H., McPhearson, R. M. and Gaines, J, L., 11Use of Fluorescent Dye Tracers in Mobile Bay," Jour. Water Poll. Control Fed.~ 46, 657-665 {1974).
30. Kilpatrick, F. A., "Flow Calibration by Dye-Dilution Methods," Civ. Eng., ASCE, 74-76 (1968).
31. O'Connel, R. L. and Walter, C. M., "Hydraulic Model Tests of Estuarial Waste Dispersion.," J. San. Eng. Div., ASCE, 89, 51-65 (1964). - -
32. Murthy, G. R., 11Simulated Outfall Diffusion Experiments in Coastal Currents of a Lake, 11 Water Res.,.§_, 961-967 {1974).
33. Deaner, D. G., "A Procedure for Conducting Dye Tracer Studies in Chlorine Contact Chambers to Determine Detention Times and Flow Characteristics," G. K. Turner Associates No. 11269 (1970).
34. Zanoni, A. E., Katz, W. J., Carter, H. H., and Whaley, - R. C., "An ins itu Determination of the Disappearance of Coli forms in Lake Michigan," Jour. Water Poll. Control Fed., 50, 321-330 (1978).
35. Churchman, J. W., "The Selective Bactericidal Action of Gentian Violet," J. Exp. Med.,.!§_, 221-247 (1912).
36. Kline, E. K., "Toxicology of Brilliant Green for Certain Bacteria," Amer. J. Pub. Health, 24, 314-318 (1935).
37. Fung, Daniel Y. C., and Miller, R. D., "Effects of Dyes on Bacterial Growth," Appl. Microbial., n._, 793-799 (1973).
38. Acher, A. J., and Juven, B. J., "Destruction of Coliforms in Water and Sewage Water by Dye-Sensitized Photooxidation, 11 Appl. Microbial., 33, 1019-1022 (1977).
82 39. Takahashi, P. K., Toups, H. J., Greenberg, D. B., Dimopoullos, G. T.,
and Rusoff, L. L., "Irradiation of Escherichia coli in the Visible Spectrum with a Tunable Organic-Dye laser Energy Source, 11 Appl. Microbial.,~. 63-67 (1975).
40. Department of Health, Education and Welfare, "Policy Statement on Use of Rhodamine B Dye as a Tracer in Water Flow Studies, 11 Public Health Service, Division of Environmental Engineering and Food Protection, Washington, D. C. {1966).
41. Webb, J, M., Hansen, W. H., Desmond, A., and Fitzhugh, 0. G., "Biochemical and Toxicologic Studies of Rhodamine Band 3.6 -Diaminofluoran, 11 Toxicology and Applied Pharmacology, 1, 696 .. 706 (1961) .
. 42. Prichard, D. W. and Carpenter, J. H., "Measurements of Turbulent
Diffusion in Estuarine and Inshore Waters, 11 Bull. Internat. Assoc. Sci. Hydrol., 20, 37-50 {1960).
43. Panciera, M., "The Toxicity of .Rhodamine B to Eggs and Larvae of Crassostrea virginica, 11 Natl. Shellfisheries Assoc. Proc., 58, 7-8 (1967). ~
44. Donaldson, D., "On the Taxi c Effects of Severa 1 Fl uorscent Dyes, 11
(in the process of publication by the United States Geological Survey).
45. Wilson, J. F., Techni ues of Water Resources Investi ations of the U. S. Geological Survey, Govt. Printing Office 1967 .
46. Parker, G, G., "Tests of Rhodamine WT Dye for Toxicity to Oysters and Fish," Jour. Research U. S. Geol. Survey, _1, 499 {1973),
47. Webb, J. M., and Hansen, W, H., "Studies of the Metabolism of Rhodamine B, 11 Toxicology and Applied Pharmacology, l, 86-95 {1961).
48. Deaner, D. G., "Effects of Chlorine on Fluorescent Dyes, 11 Jour. Water Poll. Control Fed., 45, 507-514 (1973).
49. Brown, E. R., 11A Study of a Modified Membrane Filter Technique for the Enumeration of Stressed Fecal Coliforms in Urban Runoff," Master's Thesis, Virginia Polytechnic Institute and State University (1977).
50. Foxworthy, J. E., and Kneeling, H. R., "Eddy Diffusion and Bacteria) Reduction in Waste Fields in the Ocean," University of Southern California, Allan Hancock foundation, Report 69.1 (1969),
APPENDIX TABLE A-1
Physical & Chemical Parameter Measurements of Stream Water
Total Trial Suspended pH Alkalinity
Number Solids (mg/L) (mg/Las CaC03)
Dye Investigations
1,8 103 7.8 116
2,9 124 8.1 116
3 87 7.6 105
4,5 87 7.6 109
6,7 82 8.2 120
Chlorine and Chlorine With Dye Investigations
1,2,3,11 107 8.2 114
4,5,12,14 110 8.1 120
6,7,8,9,10, 110 8.0 130 13,15
83
Temperature oc
29
27
29
31
30
34
28
31
84
APPENDIX TABLE A-2
MPN Determinations
Positive Tubes (of 5) Trial Oil uti on MPN (FC/100 ml) Number 1 :104 l :10 5 1:10 6 Rangea Average
1 Initial 5 2 1 23 to l 70xl0 5 70xl0 5
Final 5 2 a 17 to 130x105 49xl0 5
2 Initial 5 3 0 25 to 190x105 79xl0 5
Initi a 1 5 2 0 17 to 130xl0 5 49xl0 5
Final 5 0 l 11 to 89x105 3lxl0 5
Final 5 l a 11 to 93xl0 5 33xl0 5
3 Initial 5 2 0 17 to 130x105 49xl0 5
Final 5 l 0 11 to 93xl0 5 33xl0 5
4 Initial 5 2 0 17 to 130xl0 5 49xto 5
Final 5 2 0 17 to 130xl0 5 49xl0 5
5 Initial 5 2 l 23 to 170xl0 5 70xl0 5
Final 5 3 1 31 to 250xl0 5 110x105
6 Initial 5 3 a 25 to l 90x 105 79x105
Final 5 0 0 7 to 70x105 23xl0 5
7 Initial 5 3 ,1 31 to 250x105 110x105
Final 5 2 l 23 to 170x105 70xl0 5
8 Initial 5 2 0 17 to 130x105 49x105
Final 5 l 0 11 to 93x105 33x105
9 Initial 5 2 0 17 to 130xl0 5 49x105 Initial 5 3 0 25 to 190xl0 5 79xl0 5
Equation should be a straight line of the form y = Mx + b y = -Log S, -Log ratio of average fecal coliforms surviving
to initial fecal coliforms m = Slope of the line x = c, average chlorine concentration (mg/L) b = y - intercept value Using a programmable Texas Instruments Tl-55 the linear regression analysis yields the values
M = 36.25 b = -9.165 with a correlation coefficient= 0.798
For 8 samples, the rtest indicates a degree of certainty greater than 95 percent. The equation may be written: -Log S = 36.25 C - 9.165
96
97
APPENDIX TABLE B-2
LINEAR REGRESSION ANALYSIS FOR -LOG PERCENT SURVIVAL OF FECAL COLIFORMS VERSUS
AVERAGE CHLORINE CONCENTRATION USING THE MPN TECHNIQUE
Average Trial Chlorine Number Concentration (mg/L)
Equation of the form y = mx + b m = 35.96 b = -9.185
-Log Percent Survival
0.000 2.985 3.605 5.255 1. 967 1.612 2.468 0.681
y = -Log S, -Log, ratio fecal coliform surviving to initial fecal colifonns
x = C, average chlorine concentration Correlation Coefficient= 0.808 For 8 samples, the rtest indicates a degree of certainty greater than 95 percent The equation may be written: -Log S = 35.96 C - 9.185
Trial Number
9 10 11 12 13 14 15
99
APPENDIX TABLE B-4
LINEAR REGRESSION ANALYSIS FOR -LOG PERCENT SURVIVAL OF FECAL COLIFORMS VERSUS AVERAGE CHLORINE CONCENTRATION (WITH DYE)
Equation of the form: y = mx + b m = 38.17 b = -9.365
-Log Percent Survival
1.924 0.338 5.000 5.041 1.398 1.138 2.050
y = -Log S, -Log, ratio of fecal coliforms surviving to initial fecal coliforms
x = C, average chlorine concentration Correlation Coefficient= 0.731 For 7 samples, the rtest indicates a degree of certainty greater than 90 percent. The equation may be written: -Log S = 38.17 C - 9.365
Trial Number
9 10 11 12 13 14 15
100
APPENDIX TABLE B-5
LINEAR REGRESSION ANALYSIS FOR -LOG PERCENT SURVIVAL OF FECAL COLIFORMS VERSUS AVERAGE CHLORINE CONCENTRATION (WITH DYE)
Equation of the fonn: y = mx + b m = 39.88 b = -10. 20 y = -Log S X = C Correlation Coefficient= 0.754 For 7 samples, the rtest indicates a degree of certainty of 95 percent. The equation may be written: -Log S = 39.88 C - 10.20
-Log Percent Survival
2.056 o. 311 4.623 4.903 1.100 0.803 0.925
102
APPENDIX TABLE 8-7
STATISTICAL ANALYSIS OF COLIFORM SURVIVAL FOR CHLORINE CONTACT VERSUS CHLORINE AND DYE CONTACT
USING THE MOD-MF TECHNIQUE
Trial Chlorine -Log Trial Chlorine Dye -Log Number Concentration% Survival Number Concentration Concentration% Survival