Page 1
The Effects of Superstition as Destination Attractiveness on Behavioral Intention
Yunzhou Zhang
Thesis submitted to the faculty of the Virginia Polytechnic Institute and State University in
partial fulfillment of the requirements for the degree of
Master of Science
In
Hospitality and Tourism Management
Muzaffer Uysal, Committee Chair
Ken McCleary
Vincent P. Magnini
May 2, 2012
Blacksburg, VA
Keywords: destination attractiveness, superstition attitude, behavioral intention, superstition as
destination attractiveness (SADA)
Page 2
The Effects of Superstition as Destination Attractiveness on Behavioral Intention
Yunzhou Zhang
ABSTRACT
Superstitious beliefs date back thousands of years and continue to the present, and research suggests that
superstitious beliefs have a robust influence on product satisfaction and decision making under risk. The
study therefore examines how superstition attitude will impact potential tourists’ intention to visit a
destination so that relevant organizations (e.g. destination management/marketing organizations) could
better understand potential tourists’ behaviors, identify a niche market encompassing those prone to
superstition, and tailor the tourism products to the needs and beliefs of potential tourists.
The study used a survey instrument which consists of four components: the scale of Superstition as
Destination Attractiveness (SADA), the revised Paranormal Belief Scale, the measurement of Intention to
Visit, and respondents’ demographics and travel experiences. A mixed-method data collection procedure
was adopted to populate the sample. A total of 323 questionnaires were collected from Virginia Tech
students, at both undergraduate and graduate level.
A multiple regression analysis method was employed for hypothesis testing. The result of the data
analysis supported both hypotheses, and the study finds that the more positive potential tourists’ attitude
is about superstition, the more likely they are to visit a destination with superstition as its attractiveness,
and the more trait of superstition a potential tourist bears, the stronger the relationship between potential
tourists’ attitude about superstition and their intention to visit a destination with superstition as its
attractiveness. Implications and future studies were suggested based on the findings of the study.
Page 3
iii
Dedication
To my beloved parents, Mr. Zhiyu Zhang and Ms. Xinjuan Xu, who give me unconditional
support, love, and care
Page 4
iv
Acknowledgement
Finally I have come to the very point that I can proudly hand this little piece of work to my beloved ones
in this world. I am very fortunate to have the support and help from my advisor, advisory committee
members, the professors in the Department of Hospitality and Tourism Management at Virginia Tech, my
family, friends, and colleagues, in the past two years, without whom I would not even have imagined the
completion of this study.
My deep gratitude goes to my advisor, Dr. Muzaffer Uysal, who guided my courageous exploration of the
incredible beauty of research in my master studies with his best support, extensive research experience,
and professional opinions. To me, he is not only an advisor, but also a mentor and a great example in my
pursuit of genuine knowledge about this world.
My special thanks go to the supervisor of my teaching assistantship with the Department of Hospitality
and Tourism Management at Virginia Tech and my friend, Mr. Pierre Couture, from whom I learned
many things, the most important among which is the tool of learning. He shed some light into my life
with his wisdom and humor. To have him as my friend is the best thing that ever happened to me in my
master studies at Virginia Tech.
I would like to thank my committee members, Dr. Ken McCleary and Dr. Vincent P. Magnini, for their
patience and professional suggestions to my thesis. I would like to acknowledge and extend my gratitude
to Dr. Pamela Weaver, who gave me enormous help and guidance in developing the scale of superstition
as destination attractiveness, which is an indispensable part of this study. Additionally, I would like to
thank Mark Seiss and Katie Griffin, two collaborators of my statistics consulting service with the
Laboratory for Interdisciplinary Statistical Analysis at Virginia Tech, who helped me better understand
my data structure and the statistical analysis techniques I adopted in this study.
Page 5
v
I want to express my great appreciation for Dr. Suzanne K. Murrmann and Dr. Manisha Singal, whose
contributions were not directly related to this study, but both of them taught me how to strive for
excellence and to explore and be my best self.
I am very grateful to have strong support from my family and my friends in China, the United States and
some other parts of the world, who held faith in me and trusted me with all of their heart. Special thanks
go to my parents, my grandmother, Yu Eunice Yi, Liang Tao, Dr. Yingzhi Guo, Ying Yu, Xiu Grace Guo
and Seung-ah Yoo.
I feel fortunate to have Virginia Tech as the destination for my master studies. Therefore, my last piece of
thank-you note goes to Virginia Tech. Wherever I go, I would always bear the motto of Virginia Tech, Ut
Prosim (That I May Serve), with me and remember to give to the society, and to help make this a better
world. Whatever happens to me, I would have faith and feel the light even if the dawn is dark. Because
we are Virginia Tech, we will prevail!
Page 6
vi
Table of Contents
Chapter 1: Introduction ............................................................................................................................. 1
Background ............................................................................................................................................... 1
Definition of Terms ................................................................................................................................... 3
Statement of Problem ................................................................................................................................ 4
Research Objectives and Questions .......................................................................................................... 5
Summary ................................................................................................................................................... 5
Chapter 2: Literature Review .................................................................................................................... 7
Superstition ............................................................................................................................................... 7
Destination Attractiveness ....................................................................................................................... 11
Behavioral Intention ................................................................................................................................ 15
Attitude as an Antecedent of Behavior and Behavioral Intention ....................................................... 20
Personality as a Moderator .................................................................................................................. 24
Proposed Model ...................................................................................................................................... 29
Summary ................................................................................................................................................. 29
Chapter 3: Methodology ........................................................................................................................... 30
Research Questions and Hypotheses ....................................................................................................... 30
Research Design ...................................................................................................................................... 30
Sample ................................................................................................................................................. 31
Questionnaire Development ................................................................................................................ 33
Data Analysis ....................................................................................................................................... 44
Summary ................................................................................................................................................. 45
Chapter 4: Results ..................................................................................................................................... 47
Descriptive Statistics ............................................................................................................................... 47
Demographics and Travel Experiences ............................................................................................... 47
Page 7
vii
The Scales of the Study: Descriptive Results ...................................................................................... 49
Dimensions of the Scale of SADA ......................................................................................................... 51
Dimensions of the R-PBS ....................................................................................................................... 53
Reliability of the Measurement for Intention to Visit ............................................................................. 55
Model Testing.......................................................................................................................................... 56
Summary ................................................................................................................................................. 74
Chapter 5: Discussion ............................................................................................................................... 75
Conclusion .............................................................................................................................................. 75
Implications ............................................................................................................................................. 76
Limitations .............................................................................................................................................. 78
Future Study ............................................................................................................................................ 79
Summary ................................................................................................................................................. 79
Reference ................................................................................................................................................... 81
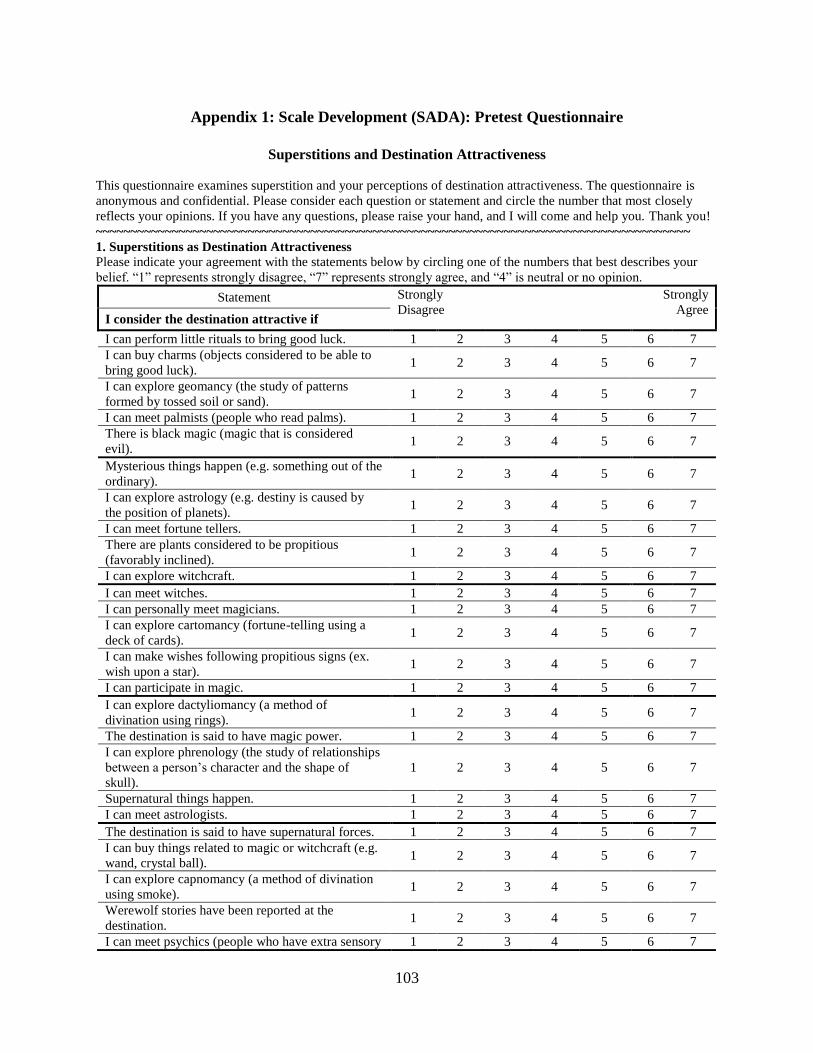
Appendix 1: Scale Development (SADA): Pretest Questionnaire....................................................... 103
Appendix 2: Scale Development (SADA): Final Questionnaire.......................................................... 105
Appendix 3: Pretest Questionnaire ........................................................................................................ 107
Appendix 4: Formal Questionnaire ....................................................................................................... 111
Appendix 5: IRB Approval Letter ......................................................................................................... 115
Page 8
viii
List of Tables
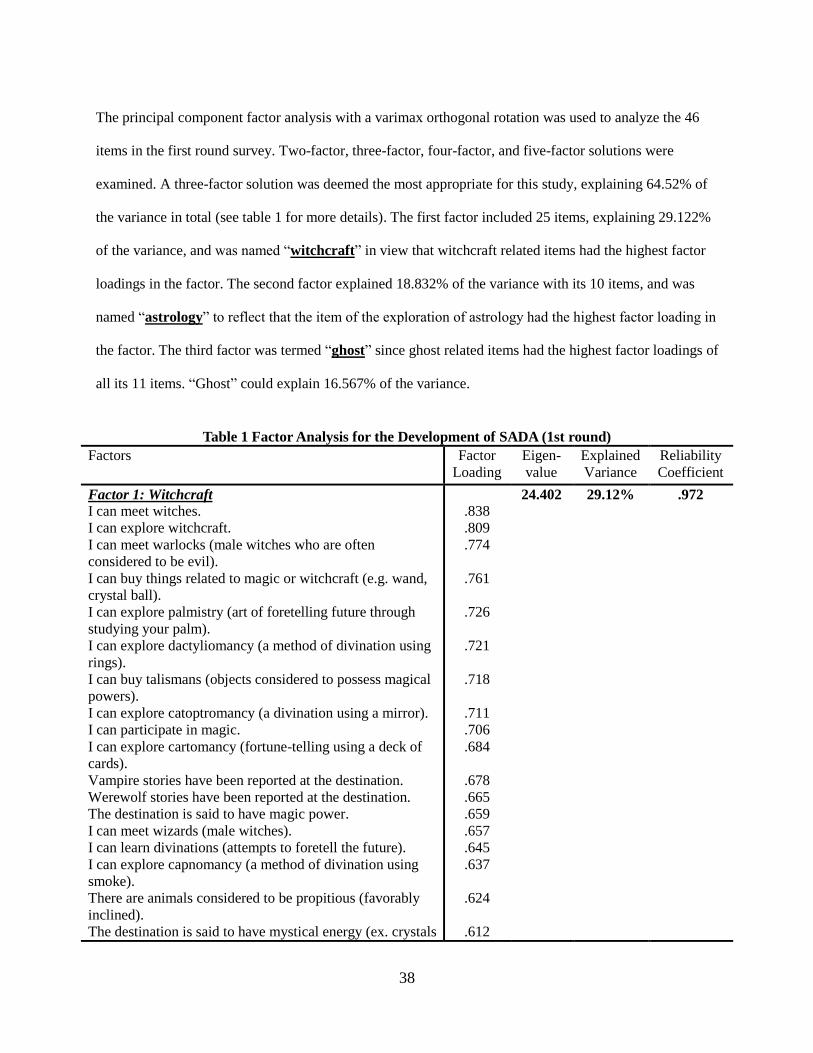
Table 1 Factor Analysis for the Development of SADA (1st round) ........................................................... 38
Table 2 Factor Analysis for the Development of SADA (2nd
round) .......................................................... 40
Table 3 Measurement for Intention to Visit ................................................................................................ 42
Table 4 Summary of Demographics and Travel Experience ....................................................................... 48
Table 5 Descriptive Statistics of the Revised Paranormal Belief Scale ...................................................... 49
Table 6 Descriptive Statistics of the Scale of Superstition as Destination Attractiveness (SADA) ............ 50
Table 7 Descriptive Statistics of the Scale of Intention to Visit .................................................................. 51
Table 8 Factor Analysis of the scale of SADA ........................................................................................... 52
Table 9 Factor Analysis of the R-PBS ........................................................................................................ 54
Table 10 Reliability Statistics ..................................................................................................................... 55
Table 11 Regression Analysis Testing H1 (DV: Intention to Visit; IV: SADA) ......................................................... 57
Table 12 Regression Analysis Testing H1 (DV: S1; IV: SADA1, SADA2, SADA3) .................................................. 60
Table 13 Regression Analysis Testing H1 (DV: S2; IV: SADA1, SADA2, SADA3) .................................................. 61
Table 14 Regression Analysis Testing H1 (DV: S3; IV: SADA1, SADA2, SADA3) .................................................. 61
Table 15 Regression Model Summary (DV: Intention to Visit; IV: SADA, PBS) ........................................................ 63
Table 16 Regression Analysis Testing H2 (DV: Intention to Visit; IV: SADA, PBS) .................................................. 63
Table 17 Regression Model Summary (DV: Intention to Visit; IV: SADA, PBS1, PBS2, PBS3, PBS4, PBS5) ...................... 64
Table 18 Regression Analysis Testing H2 (DV: Intention to Visit; IV: SADA, PBS1, PBS2, PBS3, PBS4, PBS5) ................. 64
Table 19 Regression Model Summary (DV: S1; IV: SADA1, SADA2, SADA3, PBS) ................................................. 65
Table 20 Regression Analysis Testing H2 (DV: S1; IV: SADA1, SADA2, SADA3, PBS) ............................................ 66
Table 21 Regression Model Summary (DV: S2; IV: SADA1, SADA2, SADA3, PBS) ................................................. 66
Table 22 Regression Analysis Testing H2 (DV: S2; IV: SADA1, SADA2, SADA3, PBS) ............................................ 67
Table 23 Regression Model Summary (DV: S3; IV: SADA1, SADA2, SADA3, PBS) ................................................. 67
Table 24 Regression Analysis Testing H2 (DV: S3; IV: SADA1, SADA2, SADA3, PBS) ............................................ 68
Page 9
ix
Table 25 Regression Model Summary (DV: S1; IV: SADA1, SADA2, SADA3, PBS1, PBS2, PBS3, PBS4, PBS5) ............... 69
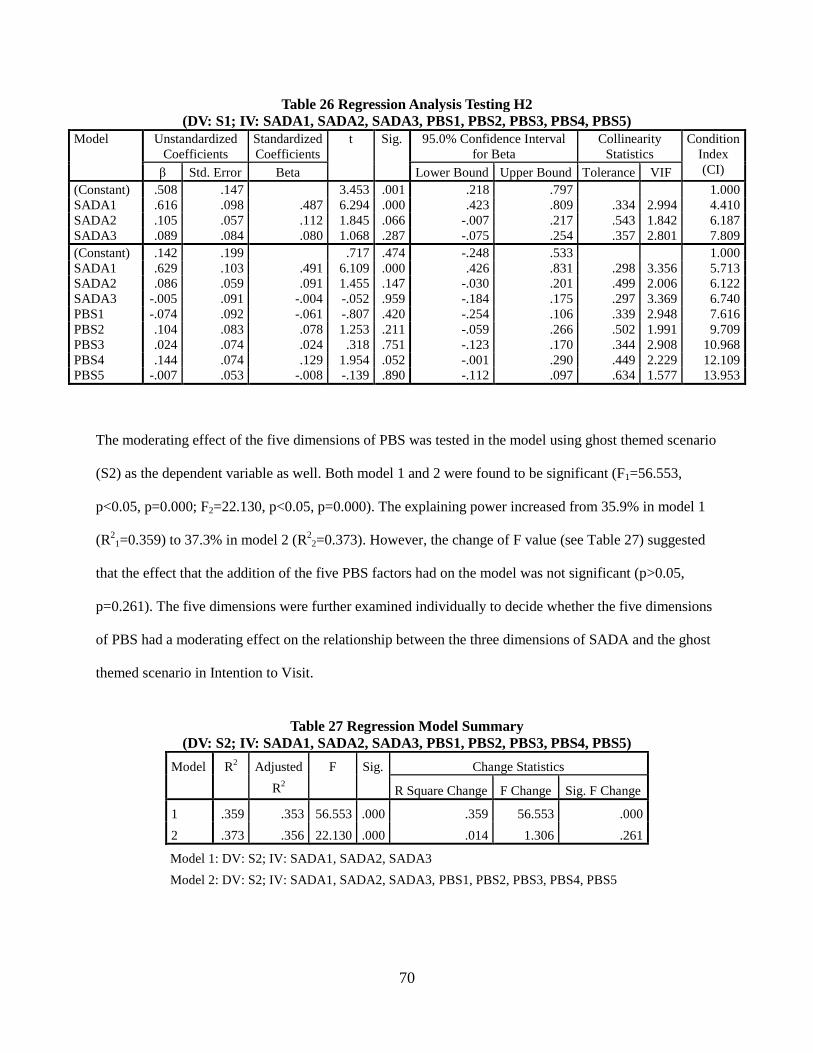
Table 26 Regression Analysis Testing H2 (DV: S1; IV: SADA1, SADA2, SADA3, PBS1, PBS2, PBS3, PBS4, PBS5) .......... 70
Table 27 Regression Model Summary (DV: S2; IV: SADA1, SADA2, SADA3, PBS1, PBS2, PBS3, PBS4, PBS5) ............... 70
Table 28 Regression Analysis Testing H2 (DV: S2; IV: SADA1, SADA2, SADA3, PBS1, PBS2, PBS3, PBS4, PBS5) .......... 71
Table 29 Regression Model Summary (DV: S3; IV: SADA1, SADA2, SADA3, PBS1, PBS2, PBS3, PBS4, PBS5) ............... 72
Table 30 Regression Analysis Testing H2 (DV: S3; IV: SADA1, SADA2, SADA3, PBS1, PBS2, PBS3, PBS4, PBS5) .......... 73
Table 31 Result of Hypothesis Testing ........................................................................................................ 74
Page 10
x
List of Figures
Figure 1 Theory of Planned Behavior ......................................................................................................... 18
Figure 2 Proposed Model of the Research .................................................................................................. 29
Figure 3 Extended Model Proposed for the Study (1st version) .................................................................. 56
Figure 4 Normal P-P Plot of Regression Standardized Residual (DV: LogS) ............................................ 58
Figure 5 Scatterplot of Responses for Intention to Visit (DV: LogS) ......................................................... 59
Figure 6 Extended Model Proposed for the Study (2nd
version) ................................................................. 62
Figure 7 Extended Model Proposed for the Study (3rd
version) ................................................................. 73
Page 11
1
Chapter 1: Introduction
BACKGROUND
The past few decades have witnessed the emergence of an ever increasing number of destinations around
the globe, and mass tourism has been a key driver for socio-economic progress through the creation of
jobs and enterprises, infrastructure development and the export revenues earned (UNWTO, 2008). It is
proposed that destinations’ success lies in the wise augmentation of supply resources to match demand
and meet traveler expectations (Uysal et al., 2000; Chen & Uysal, 2002).
On the demand side, researchers have consistently contributed to the knowledge accumulation in topic
areas such as tourist/visitor studies (studies about behaviors, preferences and perspectives of
tourists/visitors), tourism planning (tourism development, strategies, predicting and forecasting), and
marketing (marketing, segmentation and promotion), to name a few (Ballantyne et al., 2009).
The push-pull theory has been widely recognized in the explanation of tourists’ motivations (Crompton,
1979; Dann, 1981; Uysal et al., 2008). Besides motivation, many other facets of tourists have been
investigated including tourist attitude (e.g. Um & Crompton, 1990; Baloglu, 1998; Huang, 2007; Phillips
& Jang, 2008), expectation (e.g. Hsu et al., 2010), past experience (e.g. Huang, 2007), satisfaction (e.g.
Pizam et al., 1978; Kozak & Rimmington, 2000; Akama & Kieti, 2003), loyalty (e.g. Yoon & Uysal,
2005; Campo & Yagüe, 2008), personality (e.g. Hoxter & Lester, 1988), revisit/repurchase intention (e.g.
Caneen, 2003; Huang, 2007), and information search behavior (e.g. Fodness & Murray, 1997; Fodness &
Murray, 1998; Fodness & Murray, 1999; Gursoy & Umbreit, 2004). Studies of tourists’ personality
adopted some of the generic dimensions (e.g., those in Myers-Briggs Type Indicator, see literature review
for details) to determine tourists’ personality type. Dimensions that have also been investigated other than
those in MBTI are psychocentrism – allocentrism (Plog, 2001) and neuroticism (Hoxter & Lester, 1988).
However, there are few studies that have explored tourists’ traits of superstition.
Page 12
2
In terms of tourism supply, academics have researched many aspects of destinations including destination
image (e.g. Echtner & Ritchie, 1993; Baloglu & McCleary, 1999; Chen & Uysal, 2002; Gallarza et al.,
2002; Pike, 2002; Beerli & Martín, 2004; Sirgy & Su, 2000; Chen & Tsai, 2007), competitiveness (e.g.
Kozak & Rimmington, 1999a; Mihalič, 2000; D’Hauteserre, 2000; Enright & Newton, 2004; Enright &
Newton, 2005), branding (e.g. D’Hauteserre, 2001; Blain et al., 2005; Marzano & Scott, 2009),
attractiveness (e.g. Hu & Ritchie, 1993; Kozak & Rimmington, 1998; Formica, 2000; Formica & Uysal,
2006), and personality (e.g. Ekinci & Hosany, 2006; Hosany et al., 2007; Ekinci et al., 2007). With
regards to destination attractiveness, academics have also explored some generic attractiveness factors
that can apply to most of destinations, such as attractions (Ferrario, 1979; Gartner, 1989; Crouch &
Ritchie, 1999), facilities, prices of venues, and transport networks (Middleton, 1989; Vengesayi et al.,
2009). The contribution of some factors such as superstition to destination attractiveness has largely been
neglected.
Viewing the importance of the success of destinations, researchers and practitioners are wondering what
they can do to create/sustain the attractiveness of destinations to visitors in view of the fact that
destinations are seen with similar attributes such as scenery, history, and culture. It is proposed that
differentiation is the core concept of destination branding together with identification (Ritchie & Ritchie,
1998). Effective destination branding requires a sustainable, believable, and relevant selling proposition
(Blain et al., 2005) and that “the competition wants and is maybe able to copy but which they cannot
surpass or usurp” (Morgan et al., 2002: pp. 21). Differentiation is the key not only to destination branding,
but also to the overall success of a destination; therefore, it is essential for destination management
organizations to find how to differentiate their products (i.e. destinations) from others.
Page 13
3
Intrigued by the thought that superstition might be one of the factors that can lead to differentiation and
further the success of a destination, this study might be able to contribute to the scholarly tourism
literature by exploring tourists’ traits of superstition and understanding the potential contribution of
superstition to destination attractiveness by investigating the effect of superstition as a salient aspect of
destination attractiveness on behavioral intention.
DEFINITION OF TERMS
Superstition: an attitude, or attitudes, individually held by people which relate their existence to the
general order of the cosmos but which are not based upon empirical evidence nor incorporated within the
institutionalized belief systems of a society as defined by leading representatives of these systems at any
given time (Jarvis, 1980).
Destination Attractiveness: the drawing force existing in a given place at a certain time including
dimensions like attractions, recreational opportunities, food and accommodation, cultural/historical
richness, natural beauty, and various other amenities, and in the same time, tourists’ perceived ability to
meet the expectation of tourists and further satisfy their needs.
Superstition as Destination Attractiveness (SADA): This refers to the notion that a destination attracts
visitors using its superstition features or resources.
Behavioral Intention: the indications of how hard people are willing to try, of how much of an effort they
are planning to exert, in order to perform the behavior (Ajzen & Driver, 1992).
Page 14
4
STATEMENT OF PROBLEM
In recent years, specific forms of tourism such as dark tourism, have gained much attention from
academics. It is also a phenomenon that over the last century as part of specific tourism forms, dark
tourism has become both widespread and diverse (Stone & Sharpley, 2008). Within this realm, dark
tourism is defined as tourism whose attraction is related to death, disaster, and the macabre (Stone, 2006).
Stone (2006) contended that the premise of the human condition that “as we shall live so we shall die”
lies at the crux of the dark tourism concept, and human beings “have always held a fascination with death,
whether our own or others, through a combination of respect and reverence or morbid curiosity and
superstition”. The study thus suggests that SADA does not necessarily fall within the category of dark
tourism; however, superstition may be a precursor of the attractiveness of some form of dark tourism.
Superstitious beliefs date back thousands of years and continue to the present (Jahoda, 1969; Vyse, 1997;
Kramer & Block, 2008). The phenomenal success of the Harry Potter series and vampire legends (such as
the Vampire Dairies and the Twilight Series) proved the commercial value in utilizing superstition to
attract consumers. One of the most noteworthy events in the hospitality and tourism field with regards to
SADA is that “The Wizarding World of Harry Potter” was introduced into Universal Studio in Orlando in
June 2010, which has been a huge success since it opened (Plowright, 2010). Despite all the evidence that
using superstition for business purposes has gained attention from the public, no comparable attention has
been gained from academics as to how superstition would affect potential tourists’ intended purchase of a
tourism product. One of the exceptions is the research conducted by Kramer and Block (2008) who
demonstrated that superstitious beliefs have a robust influence on product satisfaction and decision
making under risk.
This study tries to fill the gap by examining how superstition attitude will impact potential tourists’
intention to visit a destination so that relevant organizations (e.g. destination management/marketing
Page 15
5
organizations) could better understand potential tourists’ behaviors, identify a niche market encompassing
those prone to superstition, and tailor the tourism products to the needs and beliefs of potential tourists.
RESEARCH OBJECTIVES AND QUESTIONS
The general objective of the study is to investigate the effect of SADA on behavioral intention.
Specifically, the research has the following objectives:
1. Develop a scale that measures the underlying dimensions of superstitions as they relate to destination
attractiveness;
2. Identify whether potential tourists attracted by superstitions as they relate to destination attractiveness
will have higher intention to visit a destination whose attractiveness is based on superstition;
3. Identify the role of potential tourists’ traits of superstition in the relationship between potential tourists’
attitude about superstition and their intention to visit a destination whose attractiveness is based on
superstition.
The study will address the following questions:
1. Do potential tourists’ attitudes about superstition impact their visiting intention?
2. Do potential tourists’ traits of superstition moderate the relationship between potential tourists’ attitude
about superstition and their intention to visit a destination whose attractiveness is based on superstition?
Summary
This chapter starts with a general background of the research from the perspectives of both academics and
business. The popularity of some of the most successful series and books in recent years has drawn the
attention of the study to the attractiveness of superstition in the hospitality and tourism industry. The
Page 16
6
study further puts forward the research objectives and questions, and defines some of the commonly-used
terms in the study.
Page 17
7
Chapter 2: Literature Review
SUPERSTITION
Superstition is a complicated phenomenon in human society. To date, the majority of theories accounting
for both superstitious beliefs and practices have been psychological in nature (Campbell, 1996).
Meanwhile, superstition has also gained considerable attention in fields such as general psychology
(Shermer, 1997; Vyse, 2000; Wheen, 2004), philosophy (Scheibe & Sarbin, 1965), abnormal psychology
(Devenport, 1979; Brugger et al., 1994; Shaner, 1999; Nayha, 2002) and medicine (Hira et al., 1998;
Diamond, 2001). Within the realm of abnormal psychology and medicine, superstitions have been framed
as irrational mistakes in cognition (Foster & Kokko, 2009). Levitt (1952) suggested the following
characteristics for the concept of superstition: (1) superstition should be fundamentally irrational; (2)
superstition should be popularly accepted; (3) superstition usually influences the behavior of the holder;
(4) superstition may be a belief in supernatural phenomena in the conventional sense; (5) superstition has
no sound evidence of personal experience to support it; and (6) superstition may have arisen
spontaneously and spread without ever having had the sanction of authority. For the second characteristic
that “superstition should be popularly accepted”, academics have long held that superstition is a cultural
phenomenon with relativity. Specific superstitions differ across cultures (Carlson et al., 2009). The
relativity of superstition is illustrated in the comment of Lesser (1931) that the same belief or practice
“can be superstitious to one person, non-superstitious to another; non-superstitious to one person at one
time, superstitious to the same person at a different time; superstitious to some men at one time, non-
superstitious to other men at the same time; non-superstitious to all men at one time, superstitious to all
men at a different time”. Wagner (1928) found that superstition is not correlated with intelligence, nor
with rural or city community life, nor with religious belief, nor with immigrant groups, and suggested that
youth is slightly more susceptible to superstitions though the difference is not distinct, while both sexes
are superstitious, women being somewhat more so than men.
Page 18
8
It is proposed in literature that superstitions are adopted as a heuristic device and that they influence a
variety of consumer behaviors (Carlson et al., 2009). Researchers have documented events centered on
superstitions and oftentimes consumers “pay” for their superstitious beliefs (Ng et al., 2010). Casual
estimates suggested that US businesses lose between $800 and $900 million every Friday the 13th (Ng et
al., 2010). Similarly, counter to economic rationality, Taiwanese consumers were reported to be willing to
spend nearly 15% more money for a product when the price point included a lucky number 8 (Kramer &
Block, 2008), and because of the association of number 8 with good luck in Chinese language and culture,
the Beijing Olympic Games was scheduled to begin on 8/8/08 (Carlson et al., 2009).
A frequent assumption in American culture is that superstitious thoughts and behaviors characterize those
who are (1) primitive, uneducated (Lesser, 1931; Vyse, 1997) demonstrated by a comment of Lesser
(1931) that “primitive man is still in the earlier stage of human thinking, in which rationalism is crude and
tentative, and superstition its halting product” or (2) suffering from a mental disorder (Fishbein, 1930).
However, research efforts revealed that educated, intelligent, and mentally healthy adults also exhibit
superstitious tendencies (e.g., Gallup & Newport, 1991). It is exposed that Nancy Reagan, the wife of
Ronald Reagan, 40th president of the United States, relied on an astrologer from San Francisco to
determine the timing of the president’s every public move (Time, 1988). Raymond Domenech, the former
manager of the France national team and a keen astrologer, admitted that his passion for astrology even
impacted his squad selection (CultureMap, 2010). The reality, however, could be that educated and
intelligent adults might be even more superstitious than those who are primitive and uneducated. Taking
into consideration the idea of Maslow’s hierarchy of needs1 (Maslow, 1948), it can be argued that people
1 Maslow asserts that human motives emerge in a sequential pattern according to a hierarchy of five need levels.
These levels are listed in order from lowest to highest as follows: physiological, safety, affiliation, achievement and
esteem, and self-actualization. Maslow predicts that for a given individual at a given point in time, one class of
needs will be more salient than any other. The basic idea of the theory is that the importance of higher needs
increases in a consistent, sequential pattern as lower needs become satisfied and decrease (Hall & Nougaim, 1968).
Page 19
9
in the higher social classes have, ceteris paribus, lower restrictions to invest in their personal “spiritual
capital”, which might have an impact on their beliefs in star sign, horoscopes or fortune tellers (Torgler,
2007).
Besides, superstitions have been found to be included in low-involvement decision making (Newell &
Simon, 1972), however, it has also been argued that superstitious beliefs can influence high-involvement
decisions when risk and uncertainty are present, such as when to have a wedding, whether to invest in a
stock, and how to sell a home (Carlson et al., 2009). Mowen and Carlson (2003) intended to explore the
antecedents and consumer behavior consequences of trait of superstition. They found that the antecedents
of superstition include a lower need for learning among older adults, higher levels of sports interest, a
belief in fate, and a decreased belief in heaven and hell. Meanwhile, superstition might lead to belief in
astrology, magic, psychokinesis, and the existence of fictitious creatures (e.g. the Loch Ness Monster).
The phenomenon of superstition has been examined even in economic studies in which the rational
individual assumption is prevalent. Fudenberg and Levine (2006) constructed a game-theoretic model
with rational learning, taking superstitions as beliefs on events off the equilibrium path. They concluded
with the findings that some superstitions can persist and persistent superstitions do affect human behavior.
The reasons why people exhibit superstitious behaviors have been examined from three alternative
explanations in literature (Carlson et al., 2009). The first stems from reinforcement theory and an operant
conditioning perspective. It is proposed that chance associations of behaviors with reinforcers or
punishers can result in superstitious beliefs and behaviors (Skinner, 1948; Wagner & Morris, 1987). This
explanation has been supported by Skinner’s (1948) experiments on operant conditioning using pigeons
as the experiment subject to investigate their superstitious behavior. Skinner presented the pigeons with
food at random intervals and noticed that the subject pigeons developed ritualized behaviors that he
considered to be superstitious (i.e., the pigeon was behaving as if its actions were able to cause the food to
Page 20
10
arrive, Foster & Kokko, 2009). This reason does not stand sound largely because the behaviors of pigeons
in the supporting experiments were analogous to salivation in Pavlov’s dogs2 (Pavlov, 1927 in Pavlov,
1928). The second explanation comes from a cognitive learning perspective in which the individual tries
to understand his or her environment by adopting superstitious beliefs and behaviors and providing an
explanation and reason for unfamiliar and otherwise inexplicable phenomena (Keinan, 2002; Carlson et
al., 2009). The third reason stems from people’s psychological coping mechanism for anxiety that they
employ a self-delusion strategy to perceive control of life situations through the use of superstition.
Jahoda (1969) asserted that superstition functions as a means by which people reduce the stress and
anxiety that arise from uncertainty. The second and third reasons have been supported by Shermer (1997)
who contended that “superstitions are the adaptive outcome of a general ‘belief engine’, which evolves to
both reduce anxiety (proximate cause) and enable humans to make causal associations” (ultimate cause,
see also in Tinbergen, 1963; West et al., 2007; Foster & Kokko, 2009).
Academics have tried hard to offer better understanding and explanations of the phenomenon of
superstition; however, there is barely any research on whether superstition as perceived attractiveness can
affect an individual’s intension to visit a specific destination. It is proposed that superstition can be seen
as a sort of “spiritual help”, especially in difficult life situations (Torgler, 2007). In this sense, superstition
contributes to spiritual well-being which is an indispensible component of quality of life (Moberg &
Brusek, 1978).
2 In 1927, Pavlov reported an experiment conducted by Shenger-Krestovnikova in which “a hungry dog was placed
in a harness for what was intended to be a straightforward salivary conditioning experiment. When a circle was
presented, meat powder was forthcoming when an ellipse was shown, the food was withheld. Everything went as
usual, and the dog acquired the discrimination rapidly. Then the animal was required to make increasingly fine
discriminations, at which he succeeded until the ratio of the semi-axes on the ellipse reached 9:8”. Since Pavlov’s
classic report, many other psychologists have produced similar “neuroses of the experiment” by means of various
procedures (Mineka & Kihlstrom, 1978).
Page 21
11
DESTINATION ATTRACTIVENESS
The study of attractiveness is multidisciplinary. Some of these disciplines include anthropology,
sociology, and psychology (Patzer, 1985: pp.13). The idea of destination attractiveness is important not
only because it is closely related with destination competitiveness as proposed by Ritchie and Crouch
(2003): “[W]hat makes a tourism destination truly competitive is its ability to increase tourism
expenditure, to increasingly attract visitors while providing them with satisfying, memorable experiences,
and to do so in a profitable way, while enhancing the well-being of destination residents and preserving
the natural capital of the destination for future generations” (pp.2), but also because destination
attractiveness plays the role as a linkage between visitors and a destination that interact in the entire
tourism system (Formica, 2000). Despite the importance of destination attractiveness, what scholars,
researchers and practitioners are concerned with is “not related to the theoretical investigation of the
attractiveness concept itself, but to the possibility of finding a universal method for its measurement”
(Formica, 2000; Formica & Uysal, 2006).
Destination attractiveness is interchangeably used with tourism attractiveness. Pearce (1979) defined
destination attractiveness as the degree to which a destination meets the touristic expectations of its
visitors in terms of dimensions like recreational opportunities, food and accommodation, cultural richness,
natural beauty, and various other amenities. The problem with this definition is that it does not address the
subjectivity in judging the attractiveness of a specific destination. Mayo and Jarvis (1981) defined
destination attractiveness as the relative importance of individual benefits and the perceived ability of the
destination to deliver these individual benefits (pp.201), which was slightly modified by Vengesayi et al.
(2009) who considered destination attractiveness to be the opinions of visitors about the destination’s
perceived ability to satisfy their needs.
Besides the definitions from a tourist perspective, the concept of destination attractiveness has also been
developed from the angle of a destination. Kaur (1981) regarded tourism attractiveness as the drawing
Page 22
12
force generated by the overall attractions existing in a given place at a certain time. To combine both the
tourist perspective and the destination perspective, Formica and Uysal (2006) believed that destination
attractiveness is a function of the resource base (attraction) and of demand (those who are attracted).
The theoretical basis and empirical research on evaluating tourism attractiveness are derived from
multiple disciplines and bodies of knowledge (Formica, 2002; Formica & Uysal, 2006), including spatial-
analysis and planning (Smith, 1983; Walmsley & Jenkins, 1992; Gunn, 1994; Young, 1999), marketing
(Hu & Ritchie, 1993), management science, and operation research (Var et al., 1977). Formica and Uysal
(2006) embedded in the tourism-system approach their investigation of relationships between the supply-
and-demand elements that contribute to the overall evaluation of destination attractiveness of a specific
area, since attractiveness power belongs to the supply side of tourism that is represented by destination in
the tourism system. They further took the behavioral perspective of the interaction between demand and
supply in the tourism system, which is the push-full theory (Crompton, 1979), and pointed out that
destination attractiveness contributes to the pulling force that helps form destination choice (Crompton,
1979; Dann, 1981).
Though the study of destination attractiveness is limited in literature (Formica, 2002), a number of studies
have identified the attributes that tourists consider important in the evaluation of destination attractiveness
(Gearing et al., 1974; Kim, 1998). Middleton (1989) examined three factors of destination attractiveness:
facilities, prices of venues, and transport networks. However, these attributes explain only a small
proportion of destination attractiveness (Vengesayi, 2009).
Lew (1987) proposed that there are three major approaches to determining destination attractiveness:
ideographic, organizational, and cognitive. Ideographic approach relating to a specific characteristic of a
site is represented by descriptive groups of attributes, and is linked to the supply side of tourism while
Page 23
13
organizational approach best describes spatial and temporal relationships between attractions (Formica &
Uysal, 2006). The cognitive approach is based on the experiential characteristics that are related to the
attractions and focuses on the demand side of tourism (Formica & Uysal, 2006).
Most of the researches that deal with determinants of destination attractiveness adopt the first approach,
and many researchers have made efforts to categorize destination attributes into groups (e.g. Ritchie &
Zins, 1978; Ferrario, 1979; Lew, 1987; Leiper, 1990; Vengesayi et al., 2009). Ferrario (1979) laid the
foundation of grouping destination attributes. He identified attractions within a destination to represent
the first important group of destination attractiveness. His assertion was supported by the research
conducted by Crouch and Ritchie (1999) who contended that attractions are the primary factors that pull
people to visit a destination and thus destination attractions are the main factors of destination
attractiveness. A significant number of researchers have looked at destination attractiveness from the
perspective of attractions. For example, Gartner (1989) found historic and cultural sites, night-life, liquor,
outdoor life and natural environment to be important attributes of destination attractiveness.
The second group of destination attributes that predict attractiveness is represented by destination support
services and facilities (Vengesayi et al., 2009). However, they are only considered instrumental factors in
destination attractiveness (Ritchie & Crouch, 2000; Dwyer & Kim, 2003). Kim (1998) listed clean and
peaceful environment, quality of accommodation facilities, family-oriented amenities, safety, accessibility,
reputation, entertainment, and recreational opportunities to be the factors that affect destination
attractiveness.
Researchers have combined the first and second groups of destination attributes to explain destination
attractiveness. As mentioned in the introduction section of this proposal, one perspective to explore the
definition of destination attractiveness combines the groupings of attributes of destination attractiveness.
Page 24
14
Laws and Prentice (1995) and Kozak and Rimmington (1999b) defined destination attractiveness by
pointing out that destination attributes could be classified under two main headings: the primary and
secondary features. Primary features include climate, ecology, culture and traditional architecture.
Secondary destination features are those developed particularly for tourism such as hotels, catering,
transport and entertainment. The two main groups together contribute to the overall attractiveness of a
destination. Likewise, Thach and Axinn (1994) proposed that the dimensions of destination attractiveness
consist of core and augmented attributes, and the augmented dimension represents functional/physical
attributes that may influence visitors’ evaluation of the core attributes.
The third group of destination attractiveness determinants includes people-related factors (Vengesayi et
al., 2009). People-related factors are highly related to attractions and support facilities and services. They
cannot be looked at separately. Herein, people-related factors refer to factors that are concerned with local
residents within a destination. Smith (1989) proposed that the social interaction between tourists and local
people is crucial in attracting people to a destination. Similarly, Vengesayi et al. (2009) asserted that local
residents, whether they are employees of the tourism and hospitality industry or the general public,
influence the attractiveness of a destination. Baum (1995; 1996) and Crouch and Ritchie (1999)
documented the role that a destination’s people play in enhancing destination attractiveness, and various
studies discuss the relationship between destination employees and its attractiveness (Baum, 1993).
The aforementioned categorization systems of the determinants of destination attractiveness investigated
the physical attributes of destinations. Several authors noted that places are best understood by focusing
on their symbolic meanings (McCain & Ray, 2003; Williams et al., 1992), which falls into the scope of
the third approach: the cognitive approach. Russo and Van Der Borg (2002) proposed that thinking of
destination attractiveness as a collection of functional attributes might be too limited in the context of
cultural tourism experiences because they depend as much on the setting as they do on its symbolic
Page 25
15
significance. For visitors with cultural background different from that of the hosts, Clements et al. (1993)
suggested the attractiveness of cultural destinations includes learning, awareness and understanding of
other cultures, cultural exchange, and stronger cultural identity. For visitors with the same cultural
background as the hosts’, the attractiveness of a destination depends on aspects like family bonding,
community pride, and ethnic identity (Esman, 1984; Besculides et al., 2002).
Researchers have investigated the effect of destination attractiveness on destination attachment (e.g. Hou
et al., 2005), destination image, tourist satisfaction (e.g. Truong & Foster, 2006) and destination branding.
However, it has been very rare for researchers to use destination attractiveness as a dependent variable
and to see the reciprocal effects of these variables have on destination attractiveness.
BEHAVIORAL INTENTION
Behavioral intention is assessed by the subject’s intention or willingness to get involved in various
behaviors with respect to a given person or object (Kim & Hunter, 1993). The earliest researches of
behavioral intention can be found in the literature of psychology. Afterwards, the concept of behavioral
intention has been applied in various fields including marketing (e.g., Shim & Drake, 1990), human
resource (e.g., Waters & Roach, 1979), hospitality (e.g., Jang et al., 2011), to name a few. Within
marketing literature, behavioral intentions have been predicted to influence a variety of consumer
behaviors ranging family planning decisions (e.g., Davidson & Jaccard, 1975) to toothpaste preferences
(e.g., Wilson et al., 1975). In the realm of human resources, Waters and Roach (1979) identified that
measures of overall job satisfaction, intention to remain with the organization, and absenteeism were
correlated with and thus could be predictors of turnover. Jang et al. (2011) examined the Generation Y
consumer segments’ behavioral intentions toward green restaurants and found that the “health-conscious
consumer” group and the “adventurous consumer” group had higher intentions to pay premium in green
restaurants. In the hospitality and tourism field, a great body of studies has focused on the
Page 26
16
interrelationships between quality, satisfaction and behavioral intentions (Backman & Veldkamp, 1995;
Baker & Crompton, 2000; Cronin et al., 2000); besides, quality, perceived value and satisfaction have
been used as the antecedents of behavioral intentions (Kashyap & Bojanic, 2000; Petrick, 2004; Tam,
2000; Tian-Cole et al., 2002; Chen & Tsai, 2007). Mittal et al. (1999) contended that at least three
theoretical perspectives can support the link between satisfaction and behavior intention. The first one is
the adaptation-level theory (Helson, 1964), according to which prior judgments and intentions function as
anchors for future judgments and intentions. Consistency theory has been adopted as the second
supporting perspective. The basic explanation is that to lower the level of dissonance (Festinger, 1957) or
maintain balance in mental representations of different thoughts (Heider, 1958), people tend to process
information that encourages consistency. The third perspective is rooted in learning theory (Bagozzi
1981). People’s satisfactory experiences with a product or a service act as reinforcers for them to repeat
the behavior in future encounters.
It has been widely recognized in academia that behavioral intention mediates the relationship between
attitudes and behavior (Bagozzi, 1981; Bentler & Speckart, 1979; Fishbein & Ajzen, 1975; Ryan &
Bonfield, 1975; Warshaw, 1980). According to the theory of reasoned action (TRA), a person’s intention
is a function of two basic determinants: one personal in nature (i.e. attitude toward the behavior) and the
other reflecting social influence (i.e. subjective norm). The basic paradigm of the Fishbein behavioral
intention model is that behavior is affected by behavioral intention which, in turn, is affected by attitude
and subjective norm (Fishbein & Ajzen, 1975; Ajzen & Fishbein, 1980). The personal attitude toward the
behavior refers to the person’s judgment of being in favor of or against performing the behavior.
Expectancy-value models provide a framework to explore the relationship between an individual’s
attitudes and their underlying beliefs (Blue, 1995). Outcome expectancy is the belief that a given behavior
will lead or will not lead to a given outcome, whereas outcome value is the person’s evaluation or
subjective value placed on that outcome (Ajzen & Fishbein, 1980; Eagly & Chaiken, 1993; McGuire,
Page 27
17
1985). The higher value one places on an outcome, the more intended the individual is to perform the
behavior leading to the specific outcome. Rosenberg (1956) developed a different perspective to
understand the relationship between attitude and the variables that are assumed to co-vary with it. One of
the variables is the intensity of a person’s values associated with the action or object, and a second is the
perceived importance of the action or object in leading to or blocking the attainment of his values (Smith,
1995: pp.75). The subjective norm is the person’s perception of the social pressure to perform the
behavior in question. Blue (1995) suggested that behavioral and normative beliefs are antecedent to
attitude and subjective norm. Attitude toward a behavior is a function of a cognitive belief structure that
employs two subcomponents: salient beliefs that conducting a behavior will result in a specific outcome
and the evaluation of the outcome. Thus, the measure of attitude can be quantified by the use of beliefs
about the behavioral outcome weighted by the respective evaluations of those outcomes. Likewise, the
measure of subjective norm can be realized by the use of salient normative beliefs about the expectations
of others and the motivation to comply with those respective expectations. There is no closed conclusion
as to which of the two variables in the TRA is more decisive for behavioral intention as for some
behaviors, the variable of attitude may be more important in determining behavioral intentions, whereas
for other behaviors, the normative variable may stand out as the main determinant (Ajzen & Fishbein,
1980; Fishbein & Ajzen, 1975). TRA has been criticized for its stipulation that the behavior in question
must be under volitional control, which imposes strict limitations on the theory’s range of application.
Ajzen (1985) identified the characteristics of an individual that can influence successful performance of
an intended behavior such as individual differences, information, skills, and abilities, power of will,
emotions and compulsions, time and opportunity, and dependence on others. On the basis of the
discussion, he further proposed that successful performance of the intended behavior is contingent on the
person’s control over the various factors that may prevent it (i.e. perceived behavioral control), which is
the dimension added to the TRA and the theory of planned behavior (TPB, see figure 1) was thus
Page 28
18
proposed. Perceived behavioral control (PBC) is a reflection of actual control and is sometimes
considered a partial substitute for actual control (Ajzen, 1988). Ajzen (1991) stated that the relative
importance of attitude, subjective norm, and PBC in the prediction of intention is expected to vary across
behaviors and situations. In general, the more favorable the attitude and subjective norm with respect to a
behavior, and the greater the PBC, the stronger should be an individual’s intention to perform the
behavior under consideration.
TPB can be simply expressed as follows:
B~BI= (Aact)w 1+ (SN)w2+ (PBC)w3
Where,
B=behavior, BI=behavior intention, Aact=attitude toward behavioral act, SN=subjective norm,
PBC=perceived behavioral control, w=empirically derived weight/coefficient.
Figure 1 Theory of Planned Behavior
Page 29
19
Ajzen has noted that the TPB is open to the inclusion of further variables if they are found to enhance its
predictive utility in general (Ajzen, 1991) or in particular behavioral domains (Ajzen, 1998). Besides the
internal and external factors that relate to successful performance of an intended behavior identified by
Ajzen (1985), Conner and Armitage (1998) reviewed the evidence supporting the addition of six different
variables to the TPB. The six additional variables were belief salience, past behavior/habit, PBC versus
self-efficacy, moral norms, self-identity, and affective beliefs. Bentler and Speckart (1979) suggested that
more distal determinants of behavior, such as past behavior, could have a direct impact on the formation
of behavioral intention (Cheng et al., 2005). Pavlou and Fygenson (2006) proposed the extension of the
TPB with PBC viewed as a second-order factor formed by the first-order dimensions of self-efficacy and
controllability.
TPB has received considerable attention in literature. Armitage and Conner (2001) examined a database
of 185 independent studies published until the end of 1997 and found that the TPB accounted for 27%
and 39% of the variance in behavior and intention, respectively. Empirical findings in tourism and leisure
have largely supported the TPB. Ajzen and Driver (1992) used the TPB to predict leisure intentions and
behavior and concluded that attitude, subjective norm, and PBC predicted leisure intentions (R=0.50 to
0.86), which proved the consistency of the theory. Lam and Hsu (2004) found in a study of potential
travelers from mainland China to Hong Kong that attitude and PBC were related to travel intention.
Reddy et al. (2010) used the TPB to explore individuals’ attitudes, subjective norms, PBC and intention
for medical tourism. The respondents did not perceive control over the behavior. They also had slightly
unfavorable attitudes towards the topic (i.e., medical tourism), and they had even less favorable subjective
norms for travelling to another country to receive medical treatment. It is understandable that the study
found the behavioral intentions to carry out such tourism very low. In terms of destination choice, Lam
and Hsu (2006) sampled potential Taiwanese travelers to Hong Kong and found that attitude, PBC, and
past behavior were related to behavioral intention of choosing a travel destination. In hospitality settings,
Page 30
20
Han et al. (2010) employed the TPB to explain the formation of hotel customers’ intentions to visit a
green hotel. The result of the study revealed that attitude, subjective norm, and PBC positively affected
customers’ intention to stay in a green hotel. Cheng et al. (2005) tested the sufficiency of the TPB in
examining customer dissatisfaction responses in restaurants. Results of the study demonstrated that the
TPB is applicable to the measurement of behavioral intentions in the context of Chinese customer
dissatisfaction responses in high-end restaurants, and the three TPB variables (i.e., attitude, PBC, and
subjective norm) are significant predictors of behavioral intentions across the three dissatisfaction
response intentions of voice, negative word-of-mouth communication, and exit.
Since this study is intended to examine the effect of SADA on behavioral intention which is well
grounded in the TPB, the constructs in the theory will be adopted with the proxy specific to the research
setting. The subjective norm construct is generally found to be a weak predictor of intentions, partly
attributable to a combination of poor measurement and the need for expansion of the normative
component (Armitage & Conner, 2001). Thus, this study will not investigate the effect of subjective norm
on potential tourists’ visiting intention. To focus on the effect of SADA on behavioral intention, the study
will not examine PBC either. The SADA, equivalent to an attitudinal component in the TPB, is measured
by potential tourists’ ratings of the attractiveness of a superstition-based destination. Trait of superstition
is proposed by this study to moderate the relationship between potential tourists’ attitude (i.e., ratings of
SADA) and their visiting intention. In view of the importance of the two constructs, the following part of
the literature review examines attitude as an antecedent of behavior and behavioral intention and
personality (i.e., trait of superstition).
Attitude as an Antecedent of Behavior and Behavioral Intention
A person’s attitude represents his evaluation of the entity in question (Ajzen & Fishbein, 1977). It is a
predisposition, created by learning and experience, to respond toward an object, such as a product in a
consistent way. This predisposition can be favorable or unfavorable in nature (Moutinho, 1987). There
Page 31
21
has not been an all agreed-upon definition for attitude. The understanding of attitude varies with different
research settings (Gnoth, 1997; Stedman, 2002). Attitude is proposed to be a combination of affective,
cognitive and behavioral components (Allport, 1935; Ostrom, 1969). The affective component is
represented by sympathetic nervous responses and verbal statements of affect, while overt actions and
verbal statements concerning behavior are in the behavioral component; and perceptual responses and
verbal statements of beliefs are in the cognitive component (Ostrom, 1969). Millar and Tesser (1986)
proposed that different attitude components drive different behaviors, and a match between the attitude
component emphasized by thought and the attitude component that drives behavior would increase the
attitude-behavior relation. Whether there is truly a correlation between attitude and behavior has been
examined and debated for decades and despite the fact that the low correlation between attitudes and
behavior has been frequently reported in literature (Maykovich, 1976), attempts have been continued to
improve the ability of attitudes to predict behavior by adding additional variables to control (Chaiklin,
2011). To integrate specific situational constraints into models under consideration is one way that many
studies have concluded to enhance their predictive power (Belk, 1975; Hansen, 1976; Park, 1978; Tybout
& Hauser, 1981; Um & Crompton, 1990).
Other than the TPB discussed in the previous section, other theories and models have been developed in
literature to identify the relationship between attitude and behavior. One of them is the attitude
accessibility model which was proposed by Fazio and his colleagues (1983; 1986), the fundamental of
which is that attitudes guide behavior. In brief, the model regards behavior in any given situation as a
function of an individual’s immediate perceptions of the attitude object in the context of the situation in
which the object is encountered. The key for the model to function is that the strength of attitude from
memory is as such that the attitude-to-behavior process can be initiated when the accessibility of the
attitude is needed (Fazio & Powell, 1989). Fazio (1990) further proposed the MODE (Motivation and
Opportunity as Determinants) model which distinguishes between two classes of attitude-behavior
Page 32
22
processes: spontaneous and deliberative process. The spontaneous-process model focuses on preexisting
attitudes and their accessibility from memory while the deliberative process is concentrated on the raw
data (i.e., the attributes of the behavioral alternative, Fazio & Towles-Schwen, 1990). The MODE model
addresses the question concerning the conditions under which a spontaneous process versus a deliberative
one might operate. The essence of the model is that in either of the cases (spontaneous process vs.
deliberative process), attitudes exert influences on behavior, but the only difference is the process by
which they are doing so (Fazio & Towles-Schwen, 1999, pp.97). The relationship between attitude and
behavior has also been examined through the addition of another variable: value, which contributes to the
proposal of the value-attitude (VA) and value-attitude-behavior models evaluating associations between
values, attitudes, and behaviors or behavioral intentions (Heaven et al., 1994; Homer & Kahle, 1988;
Kristiansen & Matheson, 1990; McCarty & Shrum, 1994; Lindberg, 1997).
Academics have examined attitude/behavior relationship in a reverse direction. It is documented that
LaPiere conducted a classic 1934 study in which he spent two years with a Chinese couple touring the
United States during the time when there was a high anti-Asian feeling. He reported that in the 251
attempted hotel registrations, they were turned down once, and in the follow-up mail survey, 92% of the
respondents said that they would not serve Orientals and most of the rest were uncertain. Dockery and
Bedeian (1989) commented that in the experiment, LaPiere formed his position that “behavior is a direct
attitude manifestation”, and thus “one can only know a person’s true attitude by the action he or she takes”
(Chaiklin, 2011). The association between the two constructs in the reverse direction, that is, the
predictive value of behavior on attitude, can be supported by the theory of cognitive dissonance (Festinger,
1957) which proposes that individuals seek consistency in their behaviors and cognitions; therefore, in
cases of inconsistency, attitudes change to be congruent with behavior (De Leeuw et al., 2008). Bern’s
(1972) self-perception theory has been used to explain the reverse association of attitude and behavior
(Zanna et al., 1980). De Leeuw and her colleagues (2008) conducted a longitudinal study to examine the
Page 33
23
bi-directional relations between adolescents’ smoking attitudes and behaviors, and concluded that
smoking behavior predominantly forms smoking-related attitudes, rather than vice versa.
In tourism realm, researches indicated that attitudes were positively related to tourists’ behavioral
intention (Brown, 1999; Lee & Moscardo, 2005). The research findings of Brown (1999) supported the
argument that attitudes are a significant predictor of intention (i.e., climbing intention in this research
setting). Lee and Moscardo (2005) found that those who held positive environmental attitudes were more
inclined to opt for environmentally friendly travels. Huang (2007) investigated the effects of motivation,
past experience, perceived constraint, and attitude on revisit intention in the context of mainland Chinese
tourists to Hong Kong and attitude was found to positively impact revisit intention, supporting the TPB.
Many studies have explored the relationship between attitude towards a place or its image, and preference
for the place as a travel destination (Goodrich, 1978; Mayo, 1973; Scott, et al., 1978), but they did not
extend to actual travel destination choice behavior (Um & Crompton, 1990). Um and Crompton (1990)
hypothesized that attitude is important in the stages both for the awareness set to evolve to the evoked set
and for a destination to be selected from the evoked set. The results of their study supported their
hypotheses and suggested that attitude influences the determination of whether a potential destination is
selected as part of the evoked set and the final selection of a destination.
There are researches that received the opposite outcomes exemplified by the study conducted by Mohsin
(2005) who investigated tourists’ attitudes and their destination choice and argued that the relationship
between tourists’ attitudes and their destination choice did not exist due to ineffective marketing
campaigns that offered insufficient information to potential tourists. In terms of attitude-behavioral
intention relationship, Sparks (2007) undertook a study to explore potential wine tourists’ intentions to
take a wine-based vacation. Sparks concluded that no relationship between emotional attitude and
Page 34
24
intentions was found, but instead their hypothesis “attitude toward past wine tourism experiences will
have a direct effect on intention to visit a wine region in the future” was supported.
Chaiklin (2011) conducted a review on the relationship between attitudes and behavior, and contended
that the state of knowledge about the ability of attitudes to predict behavior is “murky and not a great deal
of progress has been made in clarifying the matter. The one thing that methodological advances have
clarified is that attitudes have some utility in predicting behavior when it is not a problem to the person
and there is social acceptance of its expression in action”.
Despite the fact that many studies found a nonexistent relationship between attitudes and behavior, there
is still ongoing debate on attitude/behavior relationship and many other studies, especially the ones in
tourism and hospitality literature, have verified the predictive ability of attitude for behavior; thus, the
following proposition is stated:
There is a positive relationship between potential tourists’ attitude about superstition and their
intention to visit a destination whose attractiveness is based on superstition.
This study suggests that attitude and behavioral intention outcome interact in the same direction.
Therefore, the proposition can be specified as follows:
H1: The more positive potential tourists’ attitude is about superstition, the more likely they are to visit a
destination with superstition as its attractiveness.
Personality as a Moderator
Like the concept of attitude, academics do not agree on any general definition of the term “personality”
(Kassarjian, 1971), except to some extent refer it to the unique psychological attributes that elicit
Page 35
25
consistent and lasting responses to one’s own environment (Lee, 2009). Personality influences the
formation of different types of lifestyles, which is subject to social and cultural interactions (Engel et al.,
1993). Larsen and Buss (2008) categorized personality studies into six domains: disposal, biological,
intrapsychic, cognitive/experimental, social and cultural, and adjustment. Empirically, the disposal
domain is the most popular one (Leung & Law, 2010). In the disposal domain, factor theories were
proposed to view personality as a set of traits or factors, some general and others specific to a particular
situation or test (Kassarjian, 1971). Allport (1961) argued that “scarcely anyone questions the existence of
traits as the fundamental units of personality” because they represent the “considerable constancy in a
person’s mode of conduct” (pp.332, 334). McClelland (1951) decided “for reasons of convenience to use
the trait variable to describe the surface or stylistic manifestations of personality only” (pp.233).
Hierarchical relationships are generally believed to underlie different dimensions of personality; however,
researchers have been debating with regards to the number of levels of the hierarchy (Costa & McCrae,
1992; Hampson et al., 1986). The 3M Model (Meta-theoretical Model) of motivation and personality
integrates control theory (Carver & Scheier, 1990), evolutionary psychology principles (Buss, 1991), and
elements of trait theories (Allport, 1961), and specifies how personality interacts with situations to
influence feelings, thoughts, and behaviors (Carlson et al., 2009). Within the 3M Model, there exist four
levels of traits (elemental, compound, situational, and category-specific surface). The first layer of the
model is represented by elemental traits which are enduring cross-situational traits and are the most
abstract ones. Some of the most widely acknowledged personality scales have been developed within this
level of the hierarchy including the Myers-Briggs Type Indicator (MBTI) and the Big Five.
MBTI has been widely recognized as a useful psychometric tool intended to measure personality traits of
an individual (Bisping & Patron, 2008). MBTI was developed after the theory of psychological types
proposed by Carl Jung (1923) who argued that people could be classified into types based on their
Page 36
26
preferences for different sources of data and/or for dealing with data in different ways (Edwards et al.,
2002). MBTI distinguishes different personalities utilizing the four dimensions (Jung et al., 1971): (1)
introvert-extrovert which relates to individual’s source of energy; (2) intuitive-sensing which identifies
modes of perceiving stimuli; (3) thinking-feeling which is intended to examine how decisions are made;
and (4) judging-perceiving which investigates the level of organization and control needed by an
individual.
Many Big-Five structures exist to interpret the most important five dimensions underlying human
personality. At present, the major alternative set of Big-Five markers is the NEO Personality inventory
(NEO-PI), developed by Costa and McCrae (1985) (Goldberg, 1992). The five dimensions of McCrea and
Costa’s Five-Factor Model are: (1) agreeableness which measures the tendency for an individual to be
altruistic, warm, generous, trusting, and cooperative; (2) conscientiousness which is concerned with the
extent to which an individual is efficient, punctual, well organized, and dependable; (3) extraversion
which refers to a pattern of co-varying elements: behaviors, feelings, and cognitions (Winter et al., 1998).
Sociable, assertive, active, energetic, and talkative can be used to describe individuals high in
extraversion; (4) neuroticism which is interchangeable with emotional stability. Individuals who are high
in neuroticism tend to be anxious, self-pitying, tense, touchy, unstable, and worrying (McCrae & John,
1992); and (5) openness which characterize an individual’s openness to feelings and to new ideas,
flexibility of thought, and readiness to indulgence in fantasy (Digman, 1990).
Saroglou (2002) conducted a meta-analysis to examine the relationship between religiosity and five
factors of personality (i.e., the five dimensions in the Five-Factor Model) and concluded that religiosity is
positively related to extraversion, agreeableness, and conscientiousness, and negatively related to
openness. Besides, openness was found to positively relate to measures of open or mature religiosity and
spirituality.
Page 37
27
Compound traits represent the second level of the hierarchy, defined as one-dimensional dispositions
emerging from the interplay of elemental traits, culture, and the learning history of the individual (Carlson
et al., 2009). The third level of the hierarchy consists of situational traits which explore tendencies of
consistent patterns of behavior within a general situational context. Situational traits result from the
interplay of the first and second level of the hierarch and the general situational context in which behavior
occurs (Carlson et al., 2009). This perspective of the hierarchy of personality is supported by Snyder
(1983) who proposed that the compound effects of types of traits, classes of behaviors, sets of situations
determine the behavioral consistencies of personality. At the fourth level of the hierarchy are surface traits,
which represent the most concrete and context-specific enduring dispositions to behave (Carlson et al.,
2009). Trait of superstition was conceptualized as a surface trait by Mowen and Carlson (2003).
Academics have examined personality in tourism settings (Gountas & Gountas, 2001). As noted earlier,
Plog (1974; 1991; 2001) developed the psychocentrism-allocentrism dimension and found that
psychocentrics prefer to choose travel destinations close to home, whereas allocentrics choose distant
destinations. Psychocentrics travel by means other than airplane, choose safe destinations, stay with
tourists, avoid the “natives”, stay in hotels of established brands, eat traditional foods at chain restaurants
and look for familiar types of entertainment (Hoxter & Lester, 1988). Allocentrics are open to new
experiences and adventurous activities. Galloway et al. (2008) examined whether personality trait
sensation seeking (SS) can improve the ability to predict differences in various attitudes and behaviors of
wine tourists. The findings suggested that SS is significantly related to spending on wine, and wine
drinking, as well as to the frequency of visits to wineries and the number of activities engaged in at
wineries, the use of the internet as a source of information about wineries, venturing off the beaten track
during a visit to a wine region, and the strength of opportunity for learning, stimulation, or indulgence as
incentives to visit a wine region. Lepp and Gibson (2008) also examined the SS and found that those
Page 38
28
higher in SS are more likely to have traveled internationally and to have traveled to regions of the world
rated as riskier. Nickerson and Ellis (1991) used Fiske and Maddi’s (1961) activation theory of
personality development to describe personality types and to predict destination preferences, travel
companions, interactions with local cultures, degree of activity participation, and other distinguished
characteristics. Frew and Shaw (1999) tested Holland’s theory of personality types to examine the
relationship between personality and individuals’ likelihood of visiting tourist attractions and positive
associations were reported between the respondents’ Holland personality types and their travel behavior.
The relationship between personality, attitude, and behavioral intention has been examined in
psychological and sociological literature. Personality has been implicated as determinants of the degree to
which observed behavior is consistent with verbal attitudes (McArthur et al., 1969; Zanna et al., 1980;
Fazio et al., 1982).
It is not clearly examined in literature as to how personality functions in the interplay between attitude
and behavior or behavioral intention. This study proposes that potential tourists’ trait of superstition
moderates the relationship between their attitude about superstition and their intention to visit a
destination, the attractiveness of which is superstition based. The following proposition captures the
essence of this assertion:
The relationship between potential tourists’ attitude about superstition and their intention to visit a
destination whose attractiveness is based on superstition is moderated by potential tourists’ trait of
superstition.
The associated specific hypothesis is as follows:
Page 39
29
H2: The more trait of superstition a potential tourist bears, the stronger the relationship between
potential tourists’ attitude about superstition and their intention to visit a destination with superstition
as its attractiveness.
PROPOSED MODEL
Figure 2 delineates the relationships between potential tourists’ attitude about superstition, their traits of
superstition, and their behavioral intention. According to the model, potential tourists’ attitude about
superstition will positively impact their visiting intention of a destination whose attractiveness is
superstition-based. Potential tourists’ trait of superstition is hypothesized to moderate the relationship
between the perceived attractiveness of superstition and their intention to visit a destination whose
attractiveness is superstition-based.
Summary
This chapter provides a comprehensive literature review of the important terms and constructs in the
study. Although the concept of superstition is fuzzy, the literature review provides a comprehensive
understanding of the phenomenon of superstition in order to detect some underlying dimensions of the
construct. The research hypotheses and model have been proposed based on the literature review, which
has laid a solid foundation for further examination in later sections of the study.
H2
Trait of
superstition
Intention to
Visit H1
Attitude about
Superstition
Figure 2 Proposed Model of the Research
Page 40
30
Chapter 3: Methodology
RESEARCH QUESTIONS AND HYPOTHESES
This study is intended to answer the following questions:
1. How will potential tourists’ attitudes about superstition impact their visiting intention?
2. How will potential tourists’ traits of superstition moderate the relationship between potential tourists’
attitude about superstition and their intention to visit a destination whose attractiveness is based on
superstition?
The following hypotheses are proposed based on the literature review to address the research questions:
Proposition 1: There is a positive relationship between potential tourists’ attitude about superstition and
their intention to visit a destination whose attractiveness is based on superstition.
H1: The more positive potential tourists’ attitude is about superstition, the more likely they are to
visit a destination with superstition as its attractiveness.
Proposition 2: The relationship between potential tourists’ attitude about superstition and their intention
to visit a destination whose attractiveness is based on superstition is moderated by potential tourists’ traits
of superstition. As a rule of thumb, the study will use the following decision criteria for relationships: (1)
0≤r≤0.30 = weak relation; (2) 0.30<r≤0.60 = moderate relation; and (3) 0.60<r≤1 = strong relation.
H2: The more traits of superstition a potential tourist bears, the stronger the relationship between
potential tourists’ attitude about superstition and their intention to visit a destination with superstition
as its attractiveness.
RESEARCH DESIGN
To test the hypotheses and answer the research questions, the study used a survey instrument. The
sampling technique and sampling frame were determined first (see Sample for details). A questionnaire
Page 41
31
was drafted according to the sampling frame (see Questionnaire Development for details). A pretest using
a student sample was conducted to test the validity of the survey instrument. The questionnaire was
modified and fine-tuned based on the result of the pretest. The final survey was launched using the
revised questionnaire. The data collected from the final survey were analyzed using appropriate statistical
techniques and the results will be presented in later sections of the study.
Sample
In view of the convenience and resource constraint of the study, the sample of the study consists of
Virginia Tech students, at both undergraduate and graduate level. A mixed-methods data collection
procedure was designed to populate the sample.
“Qualtrics” survey tool was used to post the questionnaire online. A link was automatically created when
the questionnaire was launched. An approval to send a link of the online questionnaire to courses
randomly selected was received from the instructors of the selected courses. An announcement was added
by the instructor to inform the students of the survey through Virginia Tech e-Learning web system
“Scholar” using the link created by Qualtrics. In order to reach the graduate students, the study sent a
request to the Graduate School of Virginia Tech for the link of the survey to be posted on its weekly email
listserv. The online questionnaire was also distributed in HTM2454 Travel and Tourism Management,
HTM2464 Introduction to Service, HTM2514 Catering Management, HTM3484 Socio-Cult Impacts of
Tourism, and STAT3704 Statistics for Engineering Applications. Eighty online questionnaires were
collected.
The value of an online survey has been increasingly recognized (Couper, 2000; Kaplowitz et al., 2004).
The advantages of an online survey include cost savings associated with eliminating the printing and
mailing of survey instruments (Cobanoglu et al., 2001; Kaplowitz et al., 2004) as well as time and cost
savings of having returned survey data already in an electronic format (Kaplowitz et al., 2004).
Page 42
32
Potential sources of errors related to surveys in general also apply to online surveys. Dillman (1991)
describes four potential sources of error related with surveys: sampling error, non-coverage error,
nonresponse error, and measurement error. Sampling error is concerned with the difference between the
estimate, based on the sample, and the true parameter, based on the total population from which the
sample is drawn (Biemer & Lyberg, 2003). To increase the sample size is generally the best way to
minimize this form of error (MacDonald et al., 2009). Non-coverage error is associated with the
sampling frame (Biemer & Lyberg, 2003). Nonresponse error occurs when the potential participant is
unwilling to participate or impossible to contact (Daly, et al., 2011). Measurement error occurs when
respondents’ answers to survey questions do not accurately reflect the variable that the survey is intended
to measure (Dillman, 1991; 2007; MacDonald et al., 2009). The major limitation of online survey relates
to the potential lack of representativeness of the “e-sample” (Best et al., 2001; Bradley, 1999; Schmidt,
1997; Tse, 1998; Hwang & Fesenmaier, 2004), which originates from non-coverage error. Besides, some
studies suggest that response rates for e-mail and web-based surveys do not match those of other survey
methods (Mehta & Sivadas, 1995; Schaefer & Dillman, 1998; Sheehan & McMillan, 1999; Weible &
Wallace, 1998; Cook et al., 2000).The methods proposed to increase response rates and improve data
quality for online surveys include follow-ups, incentives, and length and presentation of the questionnaire
(Yu & Cooper, 1983; Deutskens et al., 2004).
An approval was also sent to the instructors of the courses randomly selected to distribute the
questionnaires by the investigator of the study. A total of 243 questionnaires were collected in HTM4414
Food and Beverage Management, HTM3524 Lodging Management, ACIS5584 Information System
Security and Assurance, MKTG3104 Marketing Management, FIN4254 Bank Management and Financial,
and STAT5504 Advanced Applied Multivariate Analysis The study compared the study results for the
two sampling methods, and no significant differences were identified.
Page 43
33
Questionnaire Development
The questionnaire of the study is composed of four parts: the R-PBS, the scale of SADA, the scale of
intention to visit, and demographics and past experience.
Measurement for Traits of Superstition
A revised Paranormal Belief Scale (R-PBS) is adopted by the study to measure respondents’ traits of
superstition. The original PBS was developed by Tobacyk and Milford (1983) as a measure of self-
reported degree of belief in paranormal phenomena which are defined as those that, if genuine, would
violate basic limiting principles of science (Broad, 1953). The definition of paranormal phenomena by
Broad (1953) is similar to that of superstition employed by the study (see chapter 1) with the exception
that traditional religious belief is considered a dimension of paranormal phenomena in the PBS while the
definition of superstition in this study makes it clear that superstition has nothing to do with religious
belief. Despite the difference in the inclusion of traditional religious belief, the PBS is regarded as the
scale that can adequately measure respondents’ traits of superstition.
The PBS consists of seven subscales, with each subscale reflecting a major dimension of paranormal
belief. The PBS subscales are Traditional Religious Belief, Psi (clairvoyance, precognition, telepathy, and
psychokinesis), Witchcraft, Superstition, Spiritualism, Extraordinary Life Forms, and Precognition
(Tobacyk, 2004). The original PBS has 25 items, for which respondents can indicate the degree of belief
by using a five-point rating scale. The scale has gone minor changes over the years. The R-PBS was
constructed to improve subscale reliability and validity, particularly cross-cultural validity. One more
item was added to the R-PBS. A seven-point Likert-type scale (1=strongly disagree, 4=uncertain,
7=strongly agree) was used to replace the original five-point rating scale. Item content was also changed
for three subscales including (1) construction of a new Precognition subscale, (2) replacement of two of
Page 44
34
four Witchcraft subscale items, and (3) replacement of one of three Extraordinary Life Forms subscale
items. In total, seven new items replaced a total of six original PBS items.
All the items are specified for each subscale in the R-PBS as follows:
Traditional Religious Belief:
1. The soul continues to exist through the body may die;
8. There is a devil;
15. I believe in God;
22. There is a heaven and a hell.
Psi:
2. Some individuals are able to levitate (lift) objects through mental forces;
9. Psychokinesis, the movement of objects through psychic powers, does exist;
16. A person’s thoughts can influence the movement of a physical object;
23. Mind reading is not possible.
Witchcraft:
3. Black magic really exists;
10. Witches do exist;
17. Through the use of formulas and incantations, it is possible to cast spells on persons;
24. There are actual cases of witchcraft.
Superstition:
4. Black cats can bring bad luck;
11. If you break a mirror, you will have bad luck;
18. The number “13” is unlucky.
Spiritualism:
5. Your mind or soul can leave your body and travel (astral projection);
Page 45
35
12. During altered states, such as sleep or trances, the spirit can leave the body;
19. Reincarnation does occur;
25. It is possible to communicate with the dead.
Extraordinary Life Forms:
6. The abominable snowman of Tibet (i.e., the Big Foot) exists;
13. The Loch Ness monster of Scotland exists;
20. There is life on other planets.
Precognition:
7. Astrology is a way to accurately predict the future;
14. The horoscope accurately tells a person’s future;
21. Some psychics can accurately predict the future;
26. Some people have an unexplained ability to predict the future.
The result of the pretest showed that the dimension of Traditional Religious Belief caused some confusion
among the respondents, which ultimately affected the reliability of the scale since a huge percentage of
the respondents who held strong traditional religious beliefs tended to strongly disagree with the other
items in the R-PBS. Therefore, the study decided to take the four traditional religious belief items (“the
soul continues to exist through the body may die”, “there is a devil”, “I believe in God”, and “there is a
heaven and a hell”) off the scale for the final questionnaire.
Measurement for SADA
Measurement for SADA conformed to the procedures for scale development was established using a
student sample for two rounds of survey. The first round survey had 46 items of SADA selected from
peer interviews and literature review. All the items were retrieved based on the understanding of
superstition in “western culture”.
Page 46
36
“Ghost” (the destination is believed to have ghosts, there are ghost stories surrounding the destination,
the destination is said to be haunted), “witchcraft” (I can explore witchcraft, I can meet witches, I can
meet wizards, I can meet warlocks, I can buy things related to magic or witchcraft), and “magic” (there is
black magic, I can personally meet magicians, I can participate in magic, the destination is said to have
magic power, I can watch magic performances) are the common themes in superstition related
phenomena, from which 13 items were drafted for the questionnaire. In view of the popularity of
“vampire” and “werewolf” series, two relevant items were added (werewolf stories have been reported at
the destination, vampire stories have been reported at the destination).
“Divination” is considered one of the keys of superstition attitudes (Lasne & Gaultier, 1984: pp. 9);
therefore, one item regarding divination was added (I can learn divinations). Some of the most elaborate
and practical forms of divinations include “astrology” (I can explore astrology, I can meet astrologists),
“palmistry” (I can meet palmists, I can explore palmistry), “cartomancy” (I can explore cartomancy),
“geomancy” (I can explore geomancy) (Lasne & Gaultier, 1984: pp. 9), “numerology” (I can explore
numerology) (Buckland, 2003: pp. 334), “catoptromancy” (I can explore catoptromancy) (Buckland,
2003: pp. 94), “capnomancy” (I can explore capnomancy) (Buckland, 2003: pp. 85), “dactyliomancy” (I
can explore dactyliomancy) (Buckland, 2003: pp. 173) and “phrenology” (I can explore phrenology)
(Buckland, 2003: pp. 368). 11 items originated from these divination methods. “Plants” and “animals”
are reported to have been used in numerous superstitious practices and many beliefs stem from them
(Lasne & Gaultier, 1984: pp. 55, 87). The items “there are plants considered to be propitious” and “there
are animals considered to be propitious” were thus taken into the questionnaire.
In addition to ghosts, there are other forms of spirits which “make up an occult world subjacent to many
superstitions” (Lasne & Gaultier, 1984: pp. 30) such as “phantoms” (the destination is said to have
phantoms) (Lasne & Gaultier, 1984: pp. 30), and there are people who have the ability to connect to the
Page 47
37
world where these spirits exist such as “psychics” (I can meet psychics) (Torgler, 2007), “clairvoyants”
(I can meet clairvoyants), and “fortune tellers” (I can meet fortune tellers) (Berry, 2006: pp. 23).
Rook (1985) suggested that the average person relies on various ritual events to mark such significant life
passages as graduation, marriage, and death. “Performing rituals” is considered the way that
superstitious belief could be practiced via specific human behavior, and thus two items “I can perform
little rituals to bring good luck” and “I can watch others perform rituals” were drafted for the
questionnaire. “To wish following propitious signs” (e.g., wish upon a star) has been reported a specific
and common ritualized activity among college students (Conklin, 1919; Beckwith, 1923). The item “I can
make wishes following propitious signs” was included based on these reports.
Besides, some objects have the common purpose of bringing good luck such as “charms” (I can buy
charms) and protecting their holder from evil influence such as “talismans” (I can buy talismans) (Lasne
& Gaultier, 1984: pp. 31). Two items were added accordingly. “Supernatural phenomena” (Simmons &
Schindler, 2003) and “mystical energy” (Bonewits & Bonewits, 2007: pp. 222) are the terms commonly
related to superstitious beliefs as well, according to which, three items “supernatural things happen”, “the
destination is said to have supernatural forces”, and “the destination is said to have mystical energy” were
taken into the questionnaire.
Based on the results of peer brainstorm, five other items were included (mysterious things happen, local
residents practice superstitious behavior, the local culture has many superstitions, the destination has a
superstitious local culture, things that happen are beyond scientific explanation), thus making the
questionnaire for the pretest composed of 46 items. A seven-point Likert scale was adopted (1=strongly
disagree, 4=neutral, 7=strongly agree). One hundred thirty-nine questionnaires were collected.
Page 48
38
The principal component factor analysis with a varimax orthogonal rotation was used to analyze the 46
items in the first round survey. Two-factor, three-factor, four-factor, and five-factor solutions were
examined. A three-factor solution was deemed the most appropriate for this study, explaining 64.52% of
the variance in total (see table 1 for more details). The first factor included 25 items, explaining 29.122%
of the variance, and was named “witchcraft” in view that witchcraft related items had the highest factor
loadings in the factor. The second factor explained 18.832% of the variance with its 10 items, and was
named “astrology” to reflect that the item of the exploration of astrology had the highest factor loading in
the factor. The third factor was termed “ghost” since ghost related items had the highest factor loadings of
all its 11 items. “Ghost” could explain 16.567% of the variance.
Table 1 Factor Analysis for the Development of SADA (1st round)
Factors Factor
Loading
Eigen-
value
Explained
Variance
Reliability
Coefficient
Factor 1: Witchcraft
I can meet witches.
I can explore witchcraft.
I can meet warlocks (male witches who are often
considered to be evil).
I can buy things related to magic or witchcraft (e.g. wand,
crystal ball).
I can explore palmistry (art of foretelling future through
studying your palm).
I can explore dactyliomancy (a method of divination using
rings).
I can buy talismans (objects considered to possess magical
powers).
I can explore catoptromancy (a divination using a mirror).
I can participate in magic.
I can explore cartomancy (fortune-telling using a deck of
cards).
Vampire stories have been reported at the destination.
Werewolf stories have been reported at the destination.
The destination is said to have magic power.
I can meet wizards (male witches).
I can learn divinations (attempts to foretell the future).
I can explore capnomancy (a method of divination using
smoke).
There are animals considered to be propitious (favorably
inclined).
The destination is said to have mystical energy (ex. crystals
.838
.809
.774
.761
.726
.721
.718
.711
.706
.684
.678
.665
.659
.657
.645
.637
.624
.612
24.402
29.12%
.972
Page 49
39
used to heal).
I can meet fortune tellers.
I can personally meet magicians.
I can meet palmists (people who read palms).
There is black magic (magic that is considered evil).
I can explore numerology (the study of mystical meanings
of numbers).
I can explore phrenology (the study of relationships
between a person’s character and the shape of skull).
I can explore geomancy (the study of patterns formed by
tossed soil or sand).
Factor 2: Astrology
I can explore astrology (e.g. destiny is caused by the
position of planets).
I can perform little rituals to bring good luck.
I can buy charms (objects considered to be able to bring
good luck).
I can make wishes following propitious signs (ex. wish
upon a star).
Mysterious things happen (e.g. something out of the
ordinary).
I can meet astrologists.
There are plants considered to be propitious (favorably
inclined).
I can watch magic performances.
I can watch others perform rituals.
I can meet psychics (people who have extra sensory
perceptions).
Factor 3: Ghost
The destination is said to be haunted.
The destination is believed to have ghosts.
There are ghost stories surrounding the destination.
The destination is said to have phantoms (a physical
manifestation of the soul of a person who is dead).
Things that happen are beyond scientific explanation.
Supernatural things happen.
The local culture has many superstitions.
The destination has a superstitious local culture.
The destination is said to have supernatural forces.
I can meet clairvoyants (people who can see beyond the
five human senses).
Local residents practice superstitious behavior.
Total Variance Explained
.582
.562
.559
.556
.546
.510
.469
.749
.698
.686
.646
.642
.611
.594
.530
.510
.508
.867
.865
.838
.662
.637
.625
.598
.562
.559
.523
.510
3.141
2.136
18.83%
16.57%
64.52%
.909
.939
Note: Extraction Method – Principal Component Analysis; Rotation Method – Varimax; KMO (Kaiser-Meyer-Olkin
Measure of Sampling Adequacy) = 0.910; Bartlett’s Test of Sphericity: p=.000.
There are two requirements for the items to be selected into the final scale: (1) the items should have the
highest factor loadings within each factor; and (2) the items to be selected due to their highest factor
Page 50
40
loadings could not in the same time had high factor loadings within another factor. Based on these two
criteria, twenty-two of the 46 items of SADA were retained in the final scale (the first 9 items in
“witchcraft”, the first 8 items in “astrology”, and the first 5 items in “ghost”). A seven-point Likert scale
(1=strongly disagree, 4=neutral, 7=strongly agree) was adopted. One hundred nineteen questionnaires
were collected for the second round survey.
Factor analysis was run on the second round data set to confirm the results of the first round survey. In
order to be consistent with the first round survey, the number of factors was set at three. These three
factors explained 69.17% of the variance in the SADA Scale (see Table 2 for more details). The first
factor keeping the named “witchcraft” included nine items explaining 28.10% of the variance. “Ghost”
became the second factor with five items explaining 23.22% of the variance. The third factor explained
17.85% of the variance and was renamed “good luck”.
Table 2 Factor Analysis for the Development of SADA (2nd round)
Factors Factor
Loading
Eigen-
value
Explained
Variance
Reliability
Coefficient
Factor 1: Witchcraft
I can explore dactyliomancy (a method of divination
using rings).
I can explore witchcraft.
I can meet warlocks (male witches who are often
considered to be evil).
I can meet witches.
I can participate in magic.
I can explore catoptromancy (a divination using a
mirror).
I can explore palmistry (art of foretelling future
through studying your palm).
I can buy things related to magic or witchcraft (e.g.
wand, crystal ball).
I can buy talismans (objects considered to possess
magical powers).
Factor 2: Ghost
There are ghost stories surrounding the destination.
The destination is said to have phantoms (a physical
manifestation of the soul of a person who is dead).
The destination is said to be haunted.
.844
.830
.817
.802
.758
.703
.675
.675
.599
.914
.912
.909
11.190
2.404
28.10%
23.22%
.939
.952
Page 51
41
The destination is believed to have ghosts.
Things that happen are beyond scientific explanation.
Factor 3: Good luck
I can perform little rituals to bring good luck.
I can buy charms (objects considered to be able to
bring good luck).
I can make wishes following propitious signs (ex.
wish upon a star).
There are plants considered to be propitious
(favorably inclined).
Mysterious things happen (e.g. something out of the
ordinary).
I can explore astrology (e.g. destiny is caused by the
position of planets).
I can meet astrologists.
I can watch magic performances.
Total Variance Explained
.896
.639
.824
.739
.629
.628
.562
.527
.527
.479
1.621
17.85%
69.17%
.872
Note: Extraction Method – Principal Component Analysis; Rotation Method – Varimax; KMO (Kaiser-Meyer-
Olkin Measure of Sampling Adequacy) = 0.899; Bartlett’s Test of Sphericity: p=.000.
The Scale of SADA is the scale developed based on the result of the second round of survey. It should be
noted that the last three items within the factor of “good luck” (“I can explore astrology”, “I can meet
astrologists”, and “I can watch magic performances”) are taken off the scale to meet content validity and
to boost the reliability coefficient. The finalized SADA scale (the first 19 items listed in table 2,
1=strongly disagree, 4=neutral, 7=strongly agree) is used as the second part of the questionnaire.
Measurement for Intention to Visit
Three scenarios were set up revolving around the three principle factors (“witchcraft”, “ghost”, and “good
luck”). Intention to visit the destination described in each scenario was measured by five items modified
based on three items (likelihood to visit, intend to visit, want to visit) used by Lam and Hsu (2006), and
two (probability of visitation, willingness to visit) adapted from Dodds et al. (1991). A three-year
parameter for intention was adopted for the first three items measuring potential tourists’ visit intention.
A seven-point Likert-type scale ranging from 1 (strongly disagree) to 7 (strongly agree) was adopted to
measure the first three statements in visit intention. This study required respondents to rate their
Page 52
42
willingness to visit (the last two items in general visit intention) using a seven-point Likert-type scale
ranging from 1 (extremely low) to 7 (extremely high).
Table 3 Measurement for Intention to Visit
Scenario 1.
Suppose there is a destination where you can explore many things related to witchcraft. For example, you can meet
warlocks (male witches who are often considered to be evil) or witches in person; watch them practice dactyliomancy (a
method of divination using rings), catoptromancy (a divination using a mirror), and palmistry (art of foretelling future
through studying your palm); buy things related to witchcraft (e.g. crystal ball), and talismans (objects considered to
possess magical powers).
Money, time, cost and other constraints of making a visit to the destination are not taken into consideration.
Please consider the following statements.
Statement Strongly
Disagree
Somewhat
Disagree Disagree Neutral Agree
Somewhat
Agree
Strongly
Agree
It is very likely for me to visit such a destination
within the next three years. 1 2 3 4 5 6 7
I intend to visit such a
destination within the next
three years. 1 2 3 4 5 6 7
I want to visit such a
destination within the next
three years. 1 2 3 4 5 6 7
Probability and
Willingness to Visit
Extremely
Low Very Low Low Undecided High Very High
Extremely
High
The probability that I
would consider visiting such a destination is:
1 2 3 4 5 6 7
My willingness to visit
such a destination is: 1 2 3 4 5 6 7
Scenario 2.
Suppose there is a destination where you can listen to ghost stories surrounding the destination. The destination is said
to be haunted and believed to have ghosts. Things that happen there are beyond scientific explanation.
Money, time, cost and other constraints of making a visit to the destination are not taken into consideration.
Please consider the following statements.
Statement Strongly
Disagree
Somewhat
Disagree Disagree Neutral Agree
Somewhat
Agree
Strongly
Agree
It is very likely for me to visit such a destination
within the next three years. 1 2 3 4 5 6 7
I intend to visit such a
destination within the next
three years. 1 2 3 4 5 6 7
I want to visit such a
destination within the next
three years. 1 2 3 4 5 6 7
Probability and
Willingness to Visit
Extremely
Low Very Low Low Undecided High Very High
Extremely
High
The probability that I
would consider visiting such a destination is:
1 2 3 4 5 6 7
Page 53
43
My willingness to visit
such a destination is: 1 2 3 4 5 6 7
Scenario 3.
Suppose there is a destination, the theme of which is to bring good luck to visitors. As a visitor, you can perform little
rituals or buy charms to bring good luck. There are plants considered to be propitious (favorably inclined) in the
destination. You can make wishes following propitious signs.
Money, time, cost and other constraints of making a visit to the destination are not taken into consideration.
Please consider the following statements.
Statement Strongly
Disagree
Somewhat
Disagree Disagree Neutral Agree
Somewhat
Agree
Strongly
Agree
It is very likely for me to visit such a destination
within the next three years. 1 2 3 4 5 6 7
I intend to visit such a
destination within the next
three years. 1 2 3 4 5 6 7
I want to visit such a
destination within the next
three years. 1 2 3 4 5 6 7
Probability and
Willingness to Visit
Extremely
Low Very Low Low Undecided High Very High
Extremely
High
The probability that I
would consider visiting such a destination is:
1 2 3 4 5 6 7
My willingness to visit
such a destination is: 1 2 3 4 5 6 7
Other Variables
This study included potential tourists’ basic socio-demographic variables, such as age, gender, education
level, marital status, and annual household income to better understand various characteristics of the
respondents.
Sutton (1994) argued that many behaviors are determined by one’s past behavior rather than by
cognitions such as those described in the TRA/TPB, based on the results of studies showing past behavior
to be the best predictor of future behavior (Conner & Armitage, 1998). Conner and Armitage (1998)
further stated that frequent performance of a behavior may bring subsequent behavior under the control of
habitual processes, though there is no uniformly recognized causal relationship between past behavior and
subsequent behavior. In view of the argument about the role of past travel experience, whether a potential
tourist has visited a destination whose attractiveness is superstition-based was added to be investigated.
Page 54
44
Data Analysis
A multiple regression model was used with intention to visit as the dependent variable and attitude about
superstition as the independent variable. Hierarchical multiple regression analysis was employed to detect
the moderating effects of potential tourists’ traits of superstition on the relationships between attitude
about superstition and intention to visit. Past experience will be entered as a control variable.
The population regression equation can be expressed as follows (Berry & Feldman, 1985):
Y = α + β1 X1 + β2 X2 + … + βk Xk + ε
Where, Y is the dependent variable, assumed to be a function of a set of k independent variables—X1, X2,
X3,…, Xk—in a population. The Greek letter coefficient α, β1, β2,…, βk represent population parameters to
be estimated. The error term ε is the deviation of the observation of Y value from its true value in the
population.
Berry and Feldman (1985: pp. 10-11) suggested that the relationship between E(Y) (the expected value of
Y) and each Xi is assumed to be linear and additive although implicit in the way the regression equation is
written. In addition to the linearity and additivity assumptions, several other assumptions must be met to
be appropriately applied to the multiple regression model and conduct tests of statistical significance, as
suggested by Berry and Feldman (1985), which are as follows:
(1) All variables must be measured at the interval level and without error. Measurement error will occur
if this assumption is violated;
(2) For each set of values for the k independent variables (X1j, X2j,…, Xkj) (Xij is used to denote the value
of the jth observation of the variable Xi), E(εj) = 0 (i.e., the mean value of the error term is 0). If this
assumption is violated, the intercept is the only coefficient of the regression model that is affected.
(3) For each set of values for the k independent variables, VAR (i.e., variance) (εj) = σ2 (i.e., the variance
of the error term is constant). If the variance of the error term is not constant, heteroscedasticity
Page 55
45
occurs.
(4) For any two sets of values for the k independent variables, COV (i.e., covariance) (εj, εh) = 0 (i.e., the
error terms are uncorrelated; thus there is no autocorrelation).
(5) For each Xi, COV (Xi, ε) = 0 (i.e., each independent variable is uncorrelated with the error term). The
violation of this assumption is the occurrence of specification error which results in two ways. First,
the function form of the relationship between variables is specified improperly despite the proper
variables in the model. Second, the wrong independent variables are used when one estimates a model.
(6) There is no perfect collinearity—no independent variable is perfectly linearly related to one or more
of the other independent variables in the model. The problem of multicollinearity occurs when this
assumption is violated.
(7) For each set of values for the k independent variables, εj is normally distributed. According to Berry
and Feldman (1985), normality is not an issue for large samples due to the application of the central
limit theory.
According to Gauss-Markov theorem, the least squares estimators of regression parameters are unbiased
and efficient as long as assumptions 1-6 are met (Berry & Feldman, 1985: pp. 15). R2 is the statistic used
to assess the goodness-of-fit of the multiple regression model.
Summary
This chapter addresses the procedures of the study including the research design, the sample, the
instrument development, and the data analysis technique. The revised Paranormal Belief Scale is used to
measure traits of superstition while the SADA scale has been developed to measure potential tourists’
attitude about superstition as it relates to destination attractiveness. Three scenarios have been composed
Page 56
46
for respondents to indicate their likelihood to visit the destination in each scenario. A total of 323
questionnaires were collected for data analysis.
Page 57
47
Chapter 4: Results
The pretest of the study helped the scale development of SADA and the redesign of the R-PBS for its fit
in the purpose of the study, which was described in details in chapter 3. The fourth chapter of the study
was dedicated only to the results found in the final data collection.
DESCRIPTIVE STATISTICS
Demographics and Travel Experiences
The study received 125 responses online while the exact number of questionnaires distributed through the
link on Qualtrics cannot be determined. It is estimated that about 7,500 students (there are about 7,000
graduate students listed on the graduate school’s mail listserv) received the link of the questionnaire. The
elimination of questionnaires that were either incomplete or from an inappropriate source (i.e., other
sources than Virginia Tech) resulted in 80 usable questionnaires collected online. In the classes where the
investigator monitored the survey process in person, 249 questionnaires were distributed, of which 247
were returned. The same screening process led to 243 usable questionnaires collected in class. Thus, a
total of 323 questionnaires were collected from Virginia Tech students (graduate and undergraduate level),
among which 46.4% (N=150) are male and 53.6% (N=173) are female. The mean of age is 22.48, ranging
from 18 to 59. Of all the respondents, 62.5% (N=202) are from Pamplin College of Business. The College
of Engineering is the second largest source of the respondents, accounting for 14.6% (N=47), followed by
the College of Science (8.7%, N=28) and the College of Liberal Arts & Human Sciences (7.1%, N=23).
In terms of past experience with SADA, approximately 7% (N=22) of the respondents claimed that they
had been to a destination with superstition as one of the attractiveness attributes in the past 12 months,
while only 3.1% (N=10) believed that they had been to a destination, where the major attractiveness is
superstition-based, in the past 12 months. Approximately 5% (N=17) of the respondents were uncertain
about whether they had been to a destination with superstition as one of the attractiveness attributes, in the
past 12 months or not, and another 5% (N=16) of the respondents were uncertain about whether they had
Page 58
48
been to a destination, where the major attractiveness is superstition-based, in the past 12 months. Table 4
provides a summary of demographics and travel experience variables and their distribution.
Table 4 Summary of Demographics and Travel Experience
Demographics and Travel Experience N % Cumulative %
Gender
Male 150 46.40 46.40
Female 173 53.60 100.00
Total 323 100.00
Age Min Max Mean Std. Deviation
18 59 22.48 3.96
Demographics and Travel Experience N % Cumulative %
College
Agriculture and Life Sciences 8 2.50 2.50
Architecture and Urban Studies 2 .60 3.10
Carilion School of Medicine 1 .30 3.40
Engineering 47 14.60 18.00
Liberal Arts & Human Sciences 23 7.10 25.10
Natural Resources and Environment 9 2.80 27.90
Pamplin College of Business 202 62.50 90.40
Science 28 8.70 99.10
The University Academic Advising Center 1 .30 99.40
Veterinary Medicine 1 .30 99.70
Virginia Bioinformatics Institute 1 .30 100.00
Total 323 100.00
Have you ever been to a destination with
superstition as one of the attractiveness
attributes, in the past 12 months?
Yes 22 6.80 6.80
No 284 87.90 94.70
Uncertain 17 5.30 100.00
Total 323 100.00
Have you ever been to a destination, the major
attractiveness is superstition-based, in the past
12 months?
Yes 10 3.10 3.10
No 297 92.00 95.00
Uncertain 16 5.00 100.00
Total 323 100.00
Note: N=323. There is one missing value in “Age” (N=322).
Of the explanations provided by those who answered “Yes” to at least one of the questions regarding past
experience with SADA, the most common answers were related to a haunted destination (e.g., “haunted
bridge”, “haunted house”, “ghost tour”, “haunted cemetery”, “grave site”, “haunted hotel”, etc.). Other
common answers were “Harry Porter Castle/Land”, “New Orleans”, and “Sarannah, GA”. Some of the
other answers provided included “Madagascar rainforest”, “Beaufort, NC”, “Blarney Stone, Ireland”,
“Mansfield Reformatory, Ohio”, “Gettysburg”, “Rome”, “Tikal, Guatemala”, “Las Vegas”, and “temples”.
Page 59
49
The Scales of the Study: Descriptive Results
Before hypothesis testing, the study first looks at the descriptive statistics of the scales used in the
questionnaire (i.e., R-PBS, SADA, and the scale of intention to visit). Table 5 provides the descriptive
statistics of the R-PBS. On a scale of 1 to 7 (1= “strongly disagree”, 7= “strongly agree”), the item “there
is life on other planets” receives the highest mean and relatively large standard deviation meantime
(M=4.93, SD=1.88). After being reverse coded, the item “mind reading is not possible” has been rated
second highest on the R-PBS (M=3.91, SD=2.14), followed by the item “some people have an
unexplained ability to predict the future” (M=3.02, SD=1.91). The least believed items on the R-PBS
include “through the use of formulas and incantations, it is possible to cast spells on persons” (M=1.76,
SD=1.34), “black cats can bring bad luck” (M=1.85, SD=1.38), and “some individuals are able to levitate
(lift) objects through mental forces” (M=1.87, SD=1.52). The overall reliability of this scale is 0.935.
Table 5 Descriptive Statistics of the Revised Paranormal Belief Scale
Item Mean Std. Deviation
Some individuals are able to levitate (lift) objects through mental forces 1.87 1.52
Black magic really exists 2.10 1.58
Black cats can bring bad luck 1.85 1.38
Your mind or soul can leave your body and travel (astral projection) 2.46 1.75
The abominable snowman of Tibet (i.e., the Big Foot) exists 2.12 1.58
Astrology is a way to accurately predict the future 2.20 1.55
Psychokinesis, the movement of objects through psychic powers, does exist 1.97 1.53
Witches do exist 2.55 1.94
If you break a mirror, you will have bad luck 1.89 1.36
During altered states, such as sleep or trances, the spirit can leave the body 2.46 1.77
The Loch Ness monster of Scotland exists 2.38 1.83
The horoscope accurately tells a person’s future 2.00 1.33
A person’s thoughts can influence the movement of a physical object 1.88 1.48
Through the use of formulas and incantations, it is possible to cast spells on persons 1.76 1.34
The number 13 is unlucky 1.94 1.50
Reincarnation does occur 2.68 1.81
There is life on other planets 4.93 1.88
Some psychics can accurately predict the future 2.81 1.89
Mind reading is not possible 3.91 2.14
There are actual cases of witchcraft 2.63 1.84
It is possible to communicate with the dead 2.64 1.82
Some people have an unexplained ability to predict the future 3.02 1.91
Note: The item “Mind reading is not possible” is reverse coded.
Page 60
50
A review of the descriptive statistics of the scale of SADA (Table 6) leads to the findings that on a scale
of 1 to 7 (1= “strongly disagree”, 7= “strongly agree”), “things that happen are beyond scientific
explanation” (M=3.61, SD=2.13) and “mysterious things happen (e.g. something out of the ordinary)”
(M=3.77, SD=2.07) are the only two items with a mean larger than three (i.e., “disagree”). Both items
have the largest standard deviation as well. The item “I can explore dactyliomancy (a method of
divination using rings)” receives the lowest mean (M=1.60, SD=1.15), followed by “I can meet warlocks
(male witches who are often considered to be evil)” (M=1.69, SD=1.31), and “I can explore
catoptromancy (a divination using a mirror)” (M=1.73, SD=1.27). The overall reliability of this scale is
0.951.
Table 6 Descriptive Statistics of the Scale of Superstition as Destination Attractiveness (SADA)
I consider the destination attractive if Mean Std. Deviation
I can explore dactyliomancy (a method of divination using rings) 1.60 1.15
There are ghost stories surrounding the destination 2.78 1.98
I can perform little rituals to bring good luck 2.05 1.52
I can explore witchcraft 1.91 1.51
The destination is said to have phantoms (a physical manifestation of the soul of a
person who is dead) 2.20 1.70
I can buy charms (objects considered to be able to bring good luck) 2.26 1.68
I can meet warlocks (male witches who are often considered to be evil) 1.69 1.31
The destination is said to be haunted 2.61 1.85
I can make wishes following propitious signs (ex. wish upon a star) 2.60 1.87
I can meet witches 1.83 1.49
The destination is believed to have ghosts 2.59 1.88
There are plants considered to be propitious (favorably inclined) 2.23 1.68
I can participate in magic 2.07 1.67
Things that happen are beyond scientific explanation 3.61 2.13
Mysterious things happen (e.g. something out of the ordinary) 3.77 2.07
I can explore catoptromancy (a divination using a mirror) 1.73 1.27
I can explore palmistry (art of foretelling future through studying your palm) 1.96 1.45
I can buy things related to magic or witchcraft (e.g. wand, crystal ball) 1.92 1.52
I can buy talismans (objects considered to possess magical powers) 1.93 1.52
Three scenarios have been used to measure the respondents’ intention to visit a destination with
“witchcraft”, “ghost”, and “good luck” being the three themes of destinations featuring SADA. On a scale
of 1 to 7 (1= “strongly disagree”, 7= “strongly agree”), the five items within Scenario 1 have lower means
(see Table 7) than their counterparts within the other two scenarios. In general, the respondents report the
Page 61
51
least intention to visit the first scenario which features witchcraft. A respective comparison of the five
items within both Scenario 2 and Scenario 3 finds that except the item “the possibility that I would
consider visiting such as destination”, all the other four items in Scenario 2 have higher means than their
counterparts in Scenario 3, leading to a summary of the results that the majority of the respondents
present higher intention to visit a destination with “good luck” being the major attractiveness than one
featuring “ghost”. The reliability alphas of these three scenarios are 0.945, 0.953, and 0.956, respectively.
Table 7 Descriptive Statistics of the Scale of Intention to Visit
Scenario/Item Mean Std. Deviation
Scenario 1
“Witchcraft”
It is very likely for me to visit such a destination within the next 3 years. 1.94 1.61
I intend to visit such a destination within the next three years. 1.71 1.38
I want to visit such a destination within the next three years. 2.04 1.72
The probability that I would consider visiting such a destination 2.38 1.76
My willingness to visit such a destination 2.55 1.81
Scenario 2
“Ghost”
It is very likely for me to visit such a destination within the next 3 years. 2.47 1.70
I intend to visit such a destination within the next three years. 2.20 1.61
I want to visit such a destination within the next three years. 2.66 1.83
The probability that I would consider visiting such a destination 2.93 1.92
My willingness to visit such a destination 2.95 1.89
Scenario 3
“Good Luck”
It is very likely for me to visit such a destination within the next 3 years. 2.54 1.72
I intend to visit such a destination within the next three years. 2.34 1.66
I want to visit such a destination within the next three years. 2.72 1.80
The probability that I would consider visiting such a destination 2.84 1.83
My willingness to visit such a destination 3.04 1.83
DIMENSIONS OF THE SCALE OF SADA
The Statistical Package for the Social Sciences (SPSS) 20.0 was used for further data analysis. The
Kaiser-Meyer-Olkin Measure of Sampling Adequacy (KMO=0.929) and the result of Bartlett’s Test of
Sphericity (p=0.000) indicated that the data collected for the scale of SADA were suitable for factor
analysis which was later run to identify the underlying dimensions of the scale of SADA. The rotation
method of varimax was adopted with principal component analysis being the extraction method. The
study looked at the correlation matrix for the identification of the structural relationships among
eigenvalues. Three factors were extracted: “witchcraft”, “ghost”, and “good luck”, consistent with the
Page 62
52
result of factor analysis in the second round survey of scale development. The three factors explained
70.889% of the total variance (see Table 8).
The first factor “witchcraft” included seven items with an eigenvalue of 10.520, explaining 55.367% of
the variance. The second factor, containing mostly items related to “ghost”, explained 9.754% of the
variance with an eigenvalue of 1.853. The third factor, having “I can buy charms (objects considered to be
able to bring good luck)” highest loaded, had an eigenvalue of 1.096 and explained the rest of the
variance out of the total 70.889%. The reliability test of the scale reported that all the three factors had a
reliability coefficient (Cronbach’s alpha) larger than, or equal to, 0.900 (α≥0.900, α1=0.928, α2=0.907,
α3=0.900), manifesting that the scale of SADA had solid reliability. In order to generate a summated score
for each of the three factors, an arithmetic average of each factor was computed and saved as a new
variable in SPSS file for the later use of hypothesis testing.
Table 8 Factor Analysis of the scale of SADA
Factor/Item Factor
Loading
Eigen-
value
Explained
Variance
Reliability
Coefficient
Factor 1: Witchcraft
I can meet warlocks (male witches who are often considered to be evil).
I can meet witches.
I can explore dactyliomancy (a method of divination using rings).
I can explore catoptromancy (a divination using a mirror).
I can explore witchcraft.
I can participate in magic.
I can explore palmistry (art of foretelling future through studying your
palm).
Factor 2: Ghost
The destination is believed to have ghosts.
There are ghost stories surrounding the destination.
The destination is said to be haunted.
The destination is said to have phantoms (a physical manifestation of
the soul of a person who is dead).
Mysterious things happen (e.g. something out of the ordinary).
Things that happen are beyond scientific explanation.
Factor 3: Good Luck I can buy charms (objects considered to be able to bring good luck).
I can make wishes following propitious signs (ex. wish upon a star).
I can perform little rituals to bring good luck.
There are plants considered to be propitious (favorably inclined).
I can buy talismans (objects considered to possess magical powers).
I can buy things related to magic or witchcraft (e.g. wand, crystal ball).
.862
.760
.749
.746
.708
.698
.592
.887
.860
.840
.762
.589
.519
.787
.744
.630
.604
.594
.583
10.520
1.853
1.096
55.367%
9.754%
5.768%
.928
.907
.900
Page 63
53
Total Variance Explained 70.889%
Note: Extraction Method –Principal Component Analysis; Rotation Method –Varimax; KMO (Kaiser-Meyer-Olkin Measure
of Sampling Adequacy) =0.929; Bartlett’s Test of Sphericity: p=.000.
DIMENSIONS OF THE R-PBS
Before factor analysis was run on the R-PBS part of the data, the KMO (KMO=0.921) and Bartlett’s Test
of Sphericity (p=0.000) confirmed that the data were suitable to conduct factor analysis. Varimax was
used as the rotation method while principal component analysis served as the extraction method. The
correlation matrix delineating the structure of eigenvalues was observed. The study identified five
dimensions of the R-PBS, explaining 69.380% of the total variance. The result revealed that the items
loaded in “spiritualism” on Tobacyk’s (2004) R-PBS were spread in “Psi” (“your mind or soul can leave
your body and travel (astral projection)”), “precognition” (“reincarnation does occur”), and “witchcraft”
(“during altered states, such as sleep or trances, the spirit can leave the body” and “it is possible to
communicate with the dead”). Other five factors on Tobacyk’s (2004) R-PBS retained most of their items,
but the rest were found to be loading in different dimensions (see Table 9).
The first factor “Psi” included six items with an eigenvalue of 9.887, explaining 44.940% of the variance.
It retained three out of four items (“some individuals are able to levitate (lift) objects through mental
forces”, “psychokinesis, the movement of objects through psychic powers, does exist”, and “a person’s
thoughts can influence the movement of a physical object”), gained two items from “witchcraft” (“black
magic really exists” and “through the use of formulas and incantations, it is possible to cast spells on
persons”), one item from “Psi” as specified earlier, and lost one item to “precognition” (“mind reading is
not possible”). The second factor explained 7.947% of the variance with an eigenvalue of 1.748. It
maintained all of its items (“if you break a mirror, you will have bad luck”, “the number 13 is unlucky”,
and “black cats can bring bad luck”) and gained two items from “precognition” (“the horoscope
accurately tells a person’s future” and “astrology is a way to accurately predict the future”). The third
Page 64
54
factor “witchcraft” had an eigenvalue of 1.436 and explained 6.526% of the variance. It lost two items to
the first factor “Psi”, retained two items (“there are actual cases of witchcraft” and “witches do exist”),
and gained two items from “spiritualism” in Tobacyk’s (2004) R-PBS. The fourth factor “precognition”
contained five items with an eigenvalue of 1.153, explaining 5.239% of the variance. It kept two of its
items (“some psychics can accurately predict the future” and “some people have an unexplained ability to
predict the future”), gained one item from “Psi”, one item from “spiritualism” and one item from
“extraordinary life forms” (“there is life on other planets”). The fifth factor included only two items,
explaining 4.728% of the variance with an eigenvalue of 1.040. Its only loss was one item to
“precognition”.
A reliability test of the scale reported that all the five dimensions presented internal reliability with
Cronbach’s alpha larger than 0.7 (α≥0.7, α1=0.902, α2=0.857, α3=0. 857, α4=0.752, α5=0.822) which has
always been held as a benchmark for acceptable scale reliability (Nunnally, 1978, p.36). In order to
generate a summated score for each of the five dimensions, an arithmetic average of each factor was
computed and saved as a new variable in SPSS file for the later use of hypothesis testing.
Table 9 Factor Analysis of the R-PBS
Factor/Item Factor
Loading
Eigen-
value
Explained
Variance
Reliability
Coefficient
Factor 1: Psi
Some individuals are able to levitate (lift) objects through mental forces.
Psychokinesis, the movement of objects through psychic powers, does
exist.
A person’s thoughts can influence the movement of a physical object.
*Black magic really exists.
*Through the use of formulas and incantations, it is possible to cast
spells on persons.
*Your mind or soul can leave your body and travel (astral projection).
Factor 2: Superstition
If you break a mirror, you will have bad luck.
The number 13 is unlucky.
*The horoscope accurately tells a person’s future.
Black cats can bring bad luck.
*Astrology is a way to accurately predict the future.
Factor 3: Witchcraft
There are actual cases of witchcraft.
Witches do exist.
.832
.810
.788
.623
.551
.473
.807
.798
.752
.665
.611
.853
.826
9.887
1.748
1.436
44.940%
7.947%
6.526%
.902
.857
.857
Page 65
55
*During altered states, such as sleep or trances, the spirit can leave the
body.
*It is possible to communicate with the dead.
Factor 4: Precognition
*Mind reading is not possible.
*There is life on other planets.
Some psychics can accurately predict the future.
Some people have an unexplained ability to predict the future.
*Reincarnation does occur.
Factor 5: Extraordinary Life Forms The Loch Ness monster of Scotland exists.
The abominable snowman of Tibet (i.e., the Big Foot) exists.
Total Variance Explained
.520
.501
.656
.637
.551
.550
.496
.781
.737
1.153
1.040
5.239%
4.728%
69.380%
.752
.822
Note: Extraction Method –Principal Component Analysis; Rotation Method –Varimax; KMO (Kaiser-Meyer-Olkin
Measure of Sampling Adequacy) =0.921; Bartlett’s Test of Sphericity: p=.000. “*”means that the item loaded in different
items in Tabacyk’s (2004) analysis and in this study.
RELIABILITY OF THE MEASUREMENT FOR INTENTION TO VISIT
Three scenarios were set up to measure respondents’ intention to visit a destination with superstition
being the major attractiveness as specified in Chapter 3. Each scenario consists of five intention items. A
reliability test was run to see whether the five items under each scenario would produce consistent results.
Table 10 presents a summary of reliability statistics. A Cronbach’s alpha equal, or larger than, 0.7 (α≥0.7),
has been considered an acceptable reliability indication (Nunnally, 1978, p.36). The three scenarios (S1,
S2, S3) were believed to have strong reliability (αS1=0.945, αS2=0.953, αS3=0.956). In order to generate a
summated score, a grand arithmetic average combining the three scenarios and an arithmetic average for
each scenario were computed and saved as new variables in SPSS file for the later use of hypothesis
testing.
Table 10 Reliability Statistics
Scale of Intention to Visit Cronbach’s Alpha N of Items
Scenario 1 (Witchcraft themed) .945 5
Scenario 2 (Ghost themed0 .953 5
Scenario 3 (Good luck themed) .956 5
Page 66
56
MODEL TESTING
Regression analysis was employed for hypothesis testing in the study. Hypothesis 1 predicts a positive
relationship between the extent to which respondents feel attracted by superstition and their intention to
visit a destination whose attractiveness is based on superstition. Hypothesis 2 proposes a moderating
effect that respondents’ trait of superstition has on the relationship predicted in Hypothesis 1. In view of
the three underlying dimensions (SADA1, SADA2, SADA3) identified in SADA, the five factors (PBS1,
PBS2, PBS3, PBS4, PBS5) underlying the R-PBS, and the three scenarios (S1, S2, S3) designed to
measure intention to visit, the proposed model was extended as follows (Figure 3):
The study first tested Hypothesis 1 using Intention to Visit as the dependent variable and SADA as the
independent variable in the regression model. The summated scores of both variables were input. It is
reported in Table 11 that SADA accounted for 43.5% of the variance (R2=0.435) in respondents’ general
visit intention and yielded a significant prediction equation (F=232.001, p<0.05, p=0.000). SADA was
H1
H2
Figure 3 Extended Model Proposed for the Study (1st version)
Attitude
about
Superstition
SADA
1
SADA
22
SADA
3
Intention
to Visit
S1
S2
S3
Trait of
Superstition
PBS1 PBS2 PBS3 PBS4 PBS5
Page 67
57
found to be a significant predictor of Intention to Visit (p<0.05). Thus, the more attracted a potential
tourist feels by superstition as the major attractiveness of a destination (β=0.660, t=15.232, p<0.05,
p=0.000), the higher intention the tourist will have to visit the destination. A further look at the table leads
to the belief that multicollinearity is not a problem in view that the condition index are below 15
(CISADA=4.049) and that the range between the lower bound and the upper bound of the 95% of
confidence internal for beta did not include zero for SADA. Therefore, Hypothesis 1 is supported.
Table 11 Regression Analysis Testing H1 (DV: Intention to Visit; IV: SADA)
Model Unstandardized
Coefficients
Standardized
Coefficients
t Sig. 95.0% Confidence Interval for
Beta
Condition
Index
β Std. Error Beta Lower Bound Upper Bound
(Constant)
SADA
.788 .127 6.212 .000 .538 1.037 1.000
.748 .049 .660 15.232 .000 .652 .845 4.049
Dependent Variable: Intention to Visit; Predictor: SADA; R2=0.435; Adjusted R
2=0.433; F=232.001; p=0.000.
One of the most important assumptions to run regression is residual normality. Unstandardized residual
was saved for the purpose of normality check. The result of Shapiro-Wilk test rejected the null hypothesis
that the data were normally distributed (statistic=0.924, p<0.05, p=000). The dependent variable Intention
to Visit was thus transformed to a new variable which was the logarithm of Intention to Visit (LogS), the
unstandardized residual of which was saved. Normality tests were conducted to check the distribution of
the unstandardized residual of the transformed dependent variable. The result of Shapiro-Wilk test
rejected the null hypothesis that the data were normally distributed (statistic=0.985, p<0.05, p=003), but it
was noted that the Shapiro-Wilk statistic was increased. It is commonly held that the closer the Shapiro-
Wilk statistic is to 1, the more likely that the residual is normally distributed. It was observed that the
unstandardized residual was very close to normal distribution. Additionally, the distribution of
standardized residual was plotted in Figure 4, which confirmed the closeness to normal distribution.
Therefore, the study decided that the assumption of residual normality was not violated.
Page 68
58
Another important assumption for regression results to stand is constant variance. Constant variance
assumption was checked using the transformed Intention to Visit as the dependent variable. All the
available transformed responses were plotted to investigate whether there was a certain pattern within the
cases. As can be seen in Figure 5, the responses were randomly spread in a certain area, which led to the
decision that the constant variance assumption was not violated.
Figure 4 Normal P-P Plot of Regression Standardized Residual (DV: LogS)
Page 69
59
To further examine whether potential tourists will tend to visit all kinds of destinations with superstition
being the major attractiveness if they have positive attitudes about superstition or they will only have high
intention to visit the type of destination with the type of superstition they are interested in, the study tested
the relationship using the subscales of intention to visit as dependent variables separately and dimensions
underlying SADA as independent variables. S1 was the first dependent variable to be examined. As can
be seen in Table 12, the three independent variables (SADA1, SADA2, SADA3) jointly explained 40.1%
of the variance (R2=0.401) in S1. The model was significant (F=67.853, p<0.05, p=0.000). SADA1 was a
significant predictor of S1 (p<0.05), which revealed that the more attracted potential tourists feel by
superstition revolving around witchcraft (β=0.486, p<0.05, p=0.000) as the major attractiveness of a
destination, the higher intention they will have to pay a visit to a witchcraft themed destination. The range
between the lower bound and the upper bound of the 95% of confidence internal for beta did not include
zero for SADAA1. The tolerance value was above 0.1 (tolerance SADA1=0.333), the VIF value was below
Figure 5 Scatterplot of Responses for Intention to Visit (DV: LogS)
Page 70
60
10 (VIF SADA1=3.002), and the condition index was below 15 (CISADA1=4.410), leading to the decision that
multicollinearity was not a problem. SADA2 and SADA3 were not significant regressors in the model
(p>0.05). The check of residual normality and constant variance was conducted using the same procedure
described previously, and no violation of the assumptions was reported.
Table 12 Regression Analysis Testing H1 (DV: S1; IV: SADA1, SADA2, SADA3)
Model Unstandardized
Coefficients
Standardized
Coefficients
t Sig. 95.0% Confidence Interval
for Beta
Collinearity
Statistics
Condition
Index
(CI) β Std. Error Beta Lower Bound Upper Bound Tolerance VIF
(Constant)
SADA1
.501 .146 3.442 .001 .215 .787 1.000
.616 .097 .486 6.323 .000 .424 .808 .333 3.002 4.410
SADA2 .105 .056 .113 1.869 .063 -.006 .217 .541 1.849 6.195
SADA3 .090 .083 .081 1.086 .279 -.074 .254 .356 2.812 7.821
Dependent Variable: S1; Predictor: SADA1, SADA2, SADA3; R2=0.401; Adjusted R
2=0.395; F=67.853; p=0.000.
The same process was applied to S2 as the dependent variable. It was presented in Table 13 that the same
three independent variables (SADA1, SADA2, SADA3) explained 36.2% of the variance (R2=0.356) in
S2. The model was significant (F=57.887, p<0.05, p=0.000). SADA1 was not found to be a significant
regressor in the model (p>0.05, p=0.170). Both SADA2 and SADA3 were significant, and had a positive
relationship with S2 (βSADA2=0.565, p<0.05, p=0.000; βSADA3=0.160, p<0.05, p=0.034). Therefore, the
more attracted potential tourists feel by ghost stories and good-luck related activities as the major
attractiveness of a destination, the higher visit intention they will have for those destinations. The range
between the lower bound and the upper bound of the 95% of confidence internal for beta did not include
zero for both SADA2 and SADA3. Both the tolerance values for SADA1 and SADA2 were above 0.1
(tolerance SADA2=0.551; tolerance SADA3=0.370), the VIF values were below 10 (VIF SADA2=1.814;
VIFSADA3=2.704), and the condition indices were below 15 (CISADA2=6.190; CISADA3=7.782). All the above
information led to the judgment that multicollinearity was not an issue. The check of residual normality
and constant variance was conducted using the same procedure described previously, and no violation of
the assumptions was reported.
Page 71
61
Table 13 Regression Analysis Testing H1 (DV: S2; IV: SADA1, SADA2, SADA3)
Model Unstandardized
Coefficients
Standardized
Coefficients
t Sig. 95.0% Confidence Interval
for Beta
Collinearity
Statistics
Condition
Index
(CI) β Std. Error Beta Lower Bound Upper Bound Tolerance VIF
(Constant)
SADA1
.791 .165 4.794 .000 .467 1.116 1.000
-.152 .110 -.107 -1.377 .170 -.369 .065 .346 2.887 4.507
SADA2 .582 .063 .565 9.183 .000 .457 .706 .551 1.814 6.190
SADA3 .199 .093 .160 2.127 .034 .015 .382 .370 2.704 7.782
Dependent Variable: S2; Predictor: SADA1, SADA2, SADA3; R2=0.362; Adjusted R
2=0.356; F=57.887; p=0.000.
The model using S3 as the dependent variable was significant (F=65.772, p<0.05, p=0.000) with the three
independent variables (SADA1, SADA2, SADA3) explaining 39.2% of the variance (R2=0.392) in S3.
SADA1 and SADA2 were not significant predictors of S1 (p>0.05). SADA3 was a significant regressor
in the model. Based on the statistics summary in Table 14, it can be seen that the more attracted potential
tourists feel by superstition related to bringing good luck being the major attractiveness of a destination
(β=0.573, p<0.05, p=0.000), the higher intention they will have to visit such a destination.
Multicollinearity was not a problem -- the range between the lower bound and the upper bound of the 95%
of confidence internal for beta did not include zero for SADA3; the tolerance value was above 0.1
(tolerance SADA3=0.355); the VIF value was below 10 (VIF SADA3=2.819); and the condition index was
below 15 (CISADA3=7.875). The check of residual normality and constant variance was conducted using
the same procedure described previously, and no violation of the assumptions was reported.
Table 14 Regression Analysis Testing H1 (DV: S3; IV: SADA1, SADA2, SADA3)
Model Unstandardized
Coefficients
Standardized
Coefficients
t Sig. 95.0% Confidence Interval
for Beta
Collinearity
Statistics
Condition
Index
(CI) β Std. Error Beta Lower Bound Upper Bound Tolerance VIF
(Constant)
SADA1
.997 .159 6.283 .000 .684 1.309 1.000
.042 .106 .030 0.391 .696 -.168 .251 .330 3.026 4.424
SADA2 .045 .062 .044 0.725 .469 -.077 .166 .540 1.853 6.225
SADA3 .695 .091 .573 7.658 .000 .516 .382 .355 2.819 7.875
Dependent Variable: S3; Predictor: SADA1, SADA2, SADA3; R2=0.392; Adjusted R
2=0.386; F=65.772; p=0.000.
Based on the result of regression analysis run for Hypothesis 1, the proposed model of the study was
further extended accordingly (Figure 6).
Page 72
62
To test Hypothesis 2, a hierarchical multiple regression method was adopted. The variable PBS
superstition was investigated as an independent variable along with the other independent variables
examined in the previous analysis. The analysis was run to see whether the inclusion of the new
independent variable (PBS) would increase the models’ ability to explain the variance in the dependent
variables. Table 15 provides a summary of the regression model. Both model 1 and 2 were significant
(F1=226.853, p<0.05, p=0.000; F2=119.118, p<0.05, p=0.000). Model 1 explained 43.2% of the variance
(R21=0.432) in Intention to Visit while the explaining power of Model 2 increased 1.3% (R
22=0.445). The
change of the F value was significant (p<0.05, p=0.009). Therefore, the inclusion of trait of superstition in
the model significantly increased the model’s explaining power with 1.3% difference.
H2
0.573
6
0.160
6
0.660
0.486
0.565
6
Figure 6 Extended Model Proposed for the Study (2nd version)
Attitude
about
Superstition
SADA
1
SADA
22
SADA
3
Intention
to Visit
S1
S2
S3
Trait of
Superstition
PBS1 PBS2 PBS3 PBS4 PBS5
Page 73
63
Table 15 Regression Model Summary (DV: Intention to Visit; IV: SADA, PBS)
Model R2 Adjusted
R2
F Sig. Change Statistics
R Square Change F Change Sig. F Change
1 .432 .430 226.853 .000 .432 226.853 .000
2 .445 .441 119.118 .000 .013 6.895 .009
Model 1: DV: Intention to Visit; IV: SADA
Model 2: DV: Intention to Visit; IV: SADA, PBS
A review of the coefficients of the model (Table 16) confirmed the same decision. PBS in Model 2 was a
significant predictor (β=-0.150, p<0.05, p=0.009). The analysis presented a consistent result in terms of
SADA’s significance in predicting Intention to Visit (β=0.560, p<0.05, p=0.000). Multicollinearity was
not an issue since the 95.0% confidence interval for the betas didn’t include 0, the tolerance statistics
were above 0.1 (toleranceSADA=tolerancePBS=0.576), the VIF values were below 10
(VIFSADA=VIFPBS=1.737), and the condition indices were below 15 (CISADA=4.921, CIPBS=6.786). The
check of residual normality and constant variance was conducted using the same procedure described
previously, and no violation of the assumptions was reported.
Table 16 Regression Analysis Testing H2 (DV: Intention to Visit; IV: SADA, PBS)
Model Unstandardized
Coefficients
Standardized
Coefficients
t Sig. 95.0% Confidence Interval
for Beta
Collinearity
Statistics
Condition
Index
(CI) β Std. Error Beta Lower Bound Upper Bound Tolerance VIF
(Constant)
SADA
.800 .128 6.248 .000 .548 1.052 1.000
.745 .049 .657 15.062 .000 .648 .842 1.000 1.000 4.052
(Constant)
SADA
.588 .150 3.915 .000 .292 .884 1.000
.635 .065 .560 9.831 .000 .507 .762 .576 1.737 4.921
PBS .189 .072 .150 2.626 .009 .047 .331 .576 1.737 6.786
The result of the regression analysis supported Hypothesis 2. It was of the study’s interest to examine
separately the moderating effect that the factors of PBS might have on the relationships between SADA
and Intention to Visit. Intention to Visit was investigated as the dependent variable while SADA was the
independent variable in Model 1 and SADA, PBS1, PBS2, PBS3, PBS4, PBS5 were input as the
Page 74
64
independent variables in Model 2. Table 17 suggested that the inclusion of the five PBS dimensions did
not significantly increase the explaining power of the model (p>0.05, p=0.070). The five dimensions were
thus examined separately to see their role in Model 2.
Table 17 Regression Model Summary
(DV: Intention to Visit; IV: SADA, PBS1, PBS2, PBS3, PBS4, PBS5)
Model R2 Adjusted
R2
F Sig. Change Statistics
R Square Change F Change Sig. F Change
1 .432 .430 226.853 .000 .432 226.853 .000
2 .452 .440 40.207 .000 .019 2.066 .070
Model 1: DV: Intention to Visit; IV: SADA
Model 2: DV: Intention to Visit; IV: SADA, PBS1, PBS2, PBS3, PBS4, PBS5
It was presented in Table 18 that none of the five PBS dimensions was significant in predicting Intention
to Visit (βPBS1=-0.075, p>0.05, p=0.291, βPBS2=0.072, p>0.05, p=0.200, βPBS3=0.069, p>0.05, p=0.342,
βPBS4=0.084, p>0.05, p=0.180, βPBS5=-0.046, p>0.05, p=0.392). SADA was reported to be the only
independent variable that was significant in predicting Intention to Visit (β=0.563, p<0.05, p=0.000).
Multicollinearity was not an issue for SADA in view that the 95.0% confidence interval for its beta
ranged from 0.510 to 0.765, which did not include 0, its tolerance statistic was 0.573, above 0.1, its VIF
value was 1.744, below 10, and its condition index was 5.408, below 15. The check of residual normality
and constant variance was conducted using the same procedure described previously, and the assumptions
were not violated.
Table 18 Regression Analysis Testing H2
(DV: Intention to Visit; IV: SADA, PBS1, PBS2, PBS3, PBS4, PBS5)
Model Unstandardized
Coefficients
Standardized
Coefficients
t Sig. 95.0% Confidence Interval
for Beta
Collinearity
Statistics
Condition
Index
(CI) β Std. Error Beta Lower Bound Upper Bound Tolerance VIF
(Constant)
SADA
.800 .128 6.248 .000 .548 1.052 1.000
.745 .049 .657 15.062 .000 .648 .842 1.000 1.000 4.052
(Constant)
SADA
.495 .172 2.873 .004 .156 .835 1.000
.638 .065 .563 9.847 .000 .510 .765 .573 1.744 5.408
PBS1 -.082 .078 -.075 -1.058 .291 -.235 .071 .376 2.661 6.174
PBS2 .087 .068 .072 1.284 .200 -.047 .221 .598 1.672 7.146
Page 75
65
PBS3 .061 .064 .069 .952 .342 -.065 .188 .358 2.794 7.676
PBS4 .085 .063 .084 1.343 .180 -.040 .210 .473 2.115 9.190
PBS5 .040 .046 .046 .857 .392 -.051 .130 .657 1.523 11.845
The study investigated the moderating effect PBS might have on the relationships between the
dimensions of SADA and the subscales of Intention to Visit. It can be seen from Table 19 that the
regression using S1 as the dependent variable, the three dimensions of SADA (SADA1, SADA2, SADA3)
as the independent variables in model 1 and both the three dimensions of SADA and PBS as the
independent variable in model 2 reported that both model 1 and 2 were significant (F1=66.680, p<0.05,
p=0.000; F2=51.798, p<0.05, p=0.000). The inclusion of PBS increased the explained variance from 39.9%
(R21= 0.399) to 40.9% (R
22=0.409), and the change of F value was significant (p<0.05, p=0.031). The
regression coefficients were further investigated to see the effect of different independent variables had on
the prediction of the model.
Table 4 Regression Model Summary
(DV: S1; IV: SADA1, SADA2, SADA3, PBS)
Model R2 Adjusted
R2
F Sig. Change Statistics
R Square Change F Change Sig. F Change
1 .399 .393 66.680 .000 .399 66.680 .000
2 .409 .401 51.798 .000 .009 4.696 .031
Model 1: DV: S1; IV: SADA1, SADA2, SADA3
Model 2: DV: S1; IV: SADA1, SADA2, SADA3, PBS
It was discovered in Table 20 that both SADA1 and PBS were significant predictors of Model 2
(βSADA1=0.453, p<0.05, p=0.000, βPBS=0.132, p<0.05, p=0.031). The statistics did not find
multicollinearity a problem since the 95% confidence interval for betas of SADA1 and PBS did not
include 0, the tolerance statistics for SADA1 and PBS were above 0.1 (toleranceSADA1=0.321,
tolerancePBS=0.531), the VIF values for SADA1 and PBS were below 10 (VIFSADA1=3.117, VIFPBS=1.882),
and the condition indices were 4.867 and 8.792 for SADA1 and PBS, respectively, both of which were
Page 76
66
below 15. The check of residual normality and constant variance was conducted using the same procedure
described previously, and no violation of the assumptions was reported
Table 20 Regression Analysis Testing H2 (DV: S1; IV: SADA1, SADA2, SADA3, PBS)
Model Unstandardized
Coefficients
Standardized
Coefficients
t Sig. 95.0% Confidence Interval
for Beta
Collinearity
Statistics
Condition
Index
(CI) β Std. Error Beta Lower Bound Upper Bound Tolerance VIF
(Constant)
SADA1
.508 .147 3.453 .001 .218 .797 1.000
.616 .098 .487 6.294 .000 .423 .809 .334 2.994 4.410
SADA2 .105 .057 .112 1.845 .066 -.007 .217 .543 1.842 6.187
SADA3 .089 .084 .080 1.068 .287 -.075 .254 .357 2.801 7.809
(Constant)
SADA1
.303 .174 1.745 .082 -.039 .646 1.000
.573 .099 .453 5.777 .000 .378 .769 .321 3.117 4.867
SADA2 .090 .057 .096 1.583 .115 -.022 .202 .535 1.869 6.668
SADA3 .034 .087 .030 .388 .698 -.138 .205 .326 3.067 8.416
PBS .182 .084 .132 2.167 .031 .017 .347 .531 1.882 8.792
The moderating effect of PBS was examined by using scenario 2 as the dependent variable and the three
factors of SADA (SADA1, SADA2, SADA3) as independent variables in Model 1 and PBS together with
the three SADA dimensions as independent variables in Model 2 (Table 21). Both models were
significant (F1=56.553, p<0.05, p=0.000, F2=42.639, p<0.05, p=0.000). However, the change of F value
indicated that the effect that the addition of PBS had on the model was not significant (p>0.05, p=0.335).
Further investigation of the regression coefficients was conducted.
Table 21 Regression Model Summary
(DV: S2; IV: SADA1, SADA2, SADA3, PBS)
Model R2 Adjusted
R2
F Sig. Change Statistics
R Square Change F Change Sig. F Change
1 .359 .353 56.553 .000 .359 56.553 .000
2 .361 .352 42.639 .000 .002 .932 .335
Model 1: DV: S2; IV: SADA1, SADA2, SADA3
Model 2: DV: S2; IV: SADA1, SADA2, SADA3, PBS
It can be seen from Table 22 that SADA2 was the only regressor that was significant in predicting
the intention to visit a ghost themed destination (β=0.557, p<0.05, p=0.000), consistent with the
Page 77
67
result found in the testing of Hypothesis 1. The 95% confidence interval for the beta of SADA2
ranged between 0.447 and 0.699, the tolerance statistic of SADA2 was 0.547, the VIF value was
1.829, and the condition index was 6.635. None of the statistics indicated possible multicollinearity
for SADA2. The check of residual normality and constant variance was conducted using the same
procedure described previously, and the assumptions were not found to be violated.
Table 22 Regression Analysis Testing H2 (DV: S2; IV: SADA1, SADA2, SADA3, PBS)
Model Unstandardized
Coefficients
Standardized
Coefficients
t Sig. 95.0% Confidence Interval
for Beta
Collinearity
Statistics
Condition
Index
(CI) β Std. Error Beta Lower Bound Upper Bound Tolerance VIF
(Constant)
SADA1
.804 .167 4.823 .000 .476 1.131 1.000
-.151 .111 -.106 -1.361 .175 -.369 .067 .347 2.879 4.507
SADA2 .580 .064 .564 9.114 .000 .455 .705 .553 1.807 6.182
SADA3 .195 .094 .157 2.083 .038 .011 .380 .371 2.694 7.769
(Constant)
SADA1
.697 .200 3.490 .001 .304 1.090 1.000
-.170 .113 -.120 -1.513 .131 -.392 .051 .336 2.976 4.939
SADA2 .573 .064 .557 8.952 .000 .447 .699 .547 1.829 6.635
SADA3 .168 .098 .135 1.716 .087 -.025 .361 .340 2.937 8.349
PBS .090 .093 .059 .966 .335 -.093 .273 .571 1.751 8.754
Table 23 summarized the statistics of the models using scenario 3 as the dependent variable and the three
dimensions of SADA (SADA1, SADA2, SADA3) as the independent variables in Model 1 and PBS
along with the three factors of SADA as the independent variables in Model 2. It was reported that both
models were significant (F1=64.437, p<0.05, p=0.000, F2=51.294, p<0.05, p=0.000). The change of F
value suggested that the inclusion of increased the explaining power of the model significantly (p<0.05,
p=0.006).
Table 23 Regression Model Summary
(DV: S3; IV: SADA1, SADA2, SADA3, PBS)
Model R2 Adjusted
R2
F Sig. Change Statistics
R Square Change F Change Sig. F Change
1 .389 .383 64.437 .000 .389 64.437 .000
2 .405 .397 51.294 .000 .015 7.633 .006
Model 1: DV: S3; IV: SADA1, SADA2, SADA3
Model 2: DV: S3; IV: SADA1, SADA2, SADA3, PBS
Page 78
68
A review of the regression coefficients of the independent variables suggested that both SADA3 and PBS
were significant predictors in Model 2 (βSADA3=0.510, p<0.05, p=0.000, βPBS=0.165, p<0.05, p=0.006).
Multicollinearity was not a problem for SADA 3 or PBS seeing that the 95% confidence interval for their
betas did not include 0, their tolerance statistics were above 0.1 (toleranceSADA3=0.327,
tolerancePBS=0.550), their VIF values were below 10 (VIFSADA3=3.062, VIFPBS=1.819), and their
condition indices were below 15 (CISADA3=8.377, CIPBS=8.828). The check of residual normality and
constant variance was conducted using the same procedure described previously, and no violation of the
assumptions was reported (Table 24).
Table 24 Regression Analysis Testing H2 (DV: S3; IV: SADA1, SADA2, SADA3, PBS)
Model Unstandardized
Coefficients
Standardized
Coefficients
t Sig. 95.0% Confidence Interval
for Beta
Collinearity
Statistics
Condition
Index
(CI) β Std. Error Beta Lower Bound Upper Bound Tolerance VIF
(Constant)
SADA1
1.012 .160 6.321 .000 .697 1.327 1.000
.042 .107 .031 .392 .695 -.168 .252 .331 3.018 4.424
SADA2 .043 .062 .042 .694 .488 -.079 .165 .542 1.846 6.216
SADA3 .693 .091 .572 7.605 .000 .514 .872 .356 2.808 7.863
(Constant)
SADA1
.727 .189 3.851 .000 .356 1.099 1.000
-.015 .107 -.011 -.142 .887 -.227 .196 .319 3.134 4.869
SADA2 .025 .062 .024 .402 .688 -.096 .146 .535 1.868 6.659
SADA3 .618 .094 .510 6.568 .000 .433 .803 .327 3.062 8.377
PBS .245 .089 .165 2.763 .006 .071 .420 .550 1.819 8.828
The effect that individual PBS dimensions had on the relationship between potential tourists’ attitude
about superstition and their intention to visit the three scenarios within Intention to Visit was further
explored in the following part of the analysis.
It can be seen from Table 25 that the regression using S1 as the dependent variable, the three dimensions
of SADA (SADA1, SADA2, SADA3) as the independent variables in model 1 and the five dimensions of
PBS (PBS1, PBS2, PBS3, PBS4, PBS5) as the added independent variable in model 2 reported that both
model 1 and 2 were significant (F1=66.680, p<0.05, p=0.000; F2=26.504, p<0.05, p=0.000). The inclusion
Page 79
69
of PBS increased the explaining power of the model under investigation from 39.9% (R2
1= 0.399) to 41.7%
(R22=0.417). However, the change of F value was found not to be significant (p>0.05, p=0.105). The
study examined the five dimensions individually to decide whether the five dimensions of PBS had a
moderating effect on the relationship between the three dimensions of SADA and the witchcraft themed
scenario in Intention to Visit.
Table 25 Regression Model Summary
(DV: S1; IV: SADA1, SADA2, SADA3, PBS1, PBS2, PBS3, PBS4, PBS5)
Model R2 Adjusted
R2
F Sig. Change Statistics
R Square Change F Change Sig. F Change
1 .399 .393 66.680 .000 .399 66.680 .000
2 .417 .402 26.504 .000 .018 1.840 .105
Model 1: DV: S1; IV: SADA1, SADA2, SADA3
Model 2: DV: S1; IV: SADA1, SADA2, SADA3, PBS1, PBS2, PBS3, PBS4, PBS5
Table 26 indicated that none of the five factors of PBS was a significant regressor in Model 2 (βPBS1=-
0.061, p>0.05, p=0.420, βPBS2=0.078, p>0.05, p=0.211, βPBS3=0.024, p>0.05, p=0.751, βPBS4=0.129,
p>0.05, p=0.052, βPBS5=-0.008, p>0.05, p=0.890). Some other findings in Table 26 were that the
coefficients of the regression in model 2 were a consistent presentation of the result found in the analysis
of Hypothesis 1 that SADA1 was the only significant predictor for scenario 1 (β=0.491, p<0.05, p=0.000).
In addition to SADA1 with a 95% confidence interval for its beta between 0.426 and 0.831, a tolerance
statistic of 0.298, a VIF value of 3.356, and a condition index of 5.713, none of which showed any clue to
multicollinearity, the study found the other independent variables (SADA2, SADA3, PBS1, PBS2, PBS3,
PBS4, PBS5) in model 2 possibly problematic in multicollinearity in view of the inclusion of 0 in the 95%
confidence interval for their betas, although the other statistics testing multicollinearity did not show
potential problems. The check of residual normality and constant variance was conducted using the same
procedure described previously, and no violation of the assumptions was reported.
Page 80
70
Table 26 Regression Analysis Testing H2
(DV: S1; IV: SADA1, SADA2, SADA3, PBS1, PBS2, PBS3, PBS4, PBS5)
Model Unstandardized
Coefficients
Standardized
Coefficients
t Sig. 95.0% Confidence Interval
for Beta
Collinearity
Statistics
Condition
Index
(CI) β Std. Error Beta Lower Bound Upper Bound Tolerance VIF
(Constant)
SADA1
.508 .147 3.453 .001 .218 .797 1.000
.616 .098 .487 6.294 .000 .423 .809 .334 2.994 4.410
SADA2 .105 .057 .112 1.845 .066 -.007 .217 .543 1.842 6.187
SADA3 .089 .084 .080 1.068 .287 -.075 .254 .357 2.801 7.809
(Constant)
SADA1
.142 .199 .717 .474 -.248 .533 1.000
.629 .103 .491 6.109 .000 .426 .831 .298 3.356 5.713
SADA2 .086 .059 .091 1.455 .147 -.030 .201 .499 2.006 6.122
SADA3 -.005 .091 -.004 -.052 .959 -.184 .175 .297 3.369 6.740
PBS1 -.074 .092 -.061 -.807 .420 -.254 .106 .339 2.948 7.616
PBS2 .104 .083 .078 1.253 .211 -.059 .266 .502 1.991 9.709
PBS3 .024 .074 .024 .318 .751 -.123 .170 .344 2.908 10.968
PBS4 .144 .074 .129 1.954 .052 -.001 .290 .449 2.229 12.109
PBS5 -.007 .053 -.008 -.139 .890 -.112 .097 .634 1.577 13.953
The moderating effect of the five dimensions of PBS was tested in the model using ghost themed scenario
(S2) as the dependent variable as well. Both model 1 and 2 were found to be significant (F1=56.553,
p<0.05, p=0.000; F2=22.130, p<0.05, p=0.000). The explaining power increased from 35.9% in model 1
(R21=0.359) to 37.3% in model 2 (R
22=0.373). However, the change of F value (see Table 27) suggested
that the effect that the addition of the five PBS factors had on the model was not significant (p>0.05,
p=0.261). The five dimensions were further examined individually to decide whether the five dimensions
of PBS had a moderating effect on the relationship between the three dimensions of SADA and the ghost
themed scenario in Intention to Visit.
Table 27 Regression Model Summary
(DV: S2; IV: SADA1, SADA2, SADA3, PBS1, PBS2, PBS3, PBS4, PBS5)
Model R2 Adjusted
R2
F Sig. Change Statistics
R Square Change F Change Sig. F Change
1 .359 .353 56.553 .000 .359 56.553 .000
2 .373 .356 22.130 .000 .014 1.306 .261
Model 1: DV: S2; IV: SADA1, SADA2, SADA3
Model 2: DV: S2; IV: SADA1, SADA2, SADA3, PBS1, PBS2, PBS3, PBS4, PBS5
Page 81
71
It can be seen from Table 28 that PBS5 was the only significant predictor of the five PBS dimensions in
model 2 (β=0.118, p<0.05, p=0.039). Meantime, the coefficients in model 2 indicated that SADA2 was a
significant regressor in predicting the intention to visit ghost themed destinations (β=0.540, p<0.05,
p=0.000). Unlike the result reported for detecting the relationship between the dimensions of SADA and
the intention to visit a ghost themed destination (i.e., S2), SADA3 was not found to be a significant
predictor for S2 (β=0.144, p>0.05, p=0.082). No multicollinearity problems were detected for PBS5 or
SADA2 since the 95% confidence interval for their betas ranged between 0.425 and 0.686 for SADA2,
and between 0.005 and 0.241 for PBS5, their tolerance statistics were above 0.1 (toleranceSADA2=0.510;
tolerancePBS5=0.651), their VIF values were below 10 (VIFSADA2=1.959; VIFPBS5=1.535), and their
condition indices were below 15 (CISADA2=6.240; CIPBS5=13.760). The other independent variables
(SADA1, SADA3, PBS1, PBS2, PBS3, PBS4) that were found not to be significant regressors might have
multicollinearity problems since all of their 95% confidence intervals for betas included 0 despite the fact
that other indications (i.e., tolerance, VIF, and condition index) met the requirements not to have
multicollinearity. The check of residual normality and constant variance was conducted using the same
procedure described previously, and no violation of the assumptions was reported.
Table 28 Regression Analysis Testing H2
(DV: S2; IV: SADA1, SADA2, SADA3, PBS1, PBS2, PBS3, PBS4, PBS5)
Model Unstandardized
Coefficients
Standardized
Coefficients
t Sig. 95.0% Confidence Interval
for Beta
Collinearity
Statistics
Condition
Index
(CI) β Std. Error Beta Lower Bound Upper Bound Tolerance VIF
(Constant)
SADA1
.804 .167 4.823 .001 .476 1.131 1.000
-.151 .111 -.106 -1.361 .175 -.369 .067 .347 2.879 4.507
SADA2 .580 .064 .564 9.114 .000 .455 .705 .553 1.807 6.182
SADA3 .195 .094 .157 2.083 .038 .011 .380 .371 2.694 7.769
(Constant)
SADA1
.729 .226 3.227 .001 .284 1.173 1.000
-.158 .116 -.111 -1.360 .175 -.387 .071 .313 3.190 5.578
SADA2 .556 .066 .540 8.403 .000 .425 .686 .510 1.959 6.240
SADA3 .179 .103 .144 1.746 .082 -.023 .381 .309 3.234 6.743
PBS1 -.125 .102 -.094 -1.223 .222 -.326 .076 .356 2.808 7.567
PBS2 -.008 .093 -.006 -.089 .929 -.192 .175 .528 1.893 9.612
PBS3 .104 .083 .097 1.259 .209 -.059 .267 .357 2.800 10.957
PBS4 -.024 .081 -.020 -.298 .766 -.185 .136 .469 2.134 11.977
PBS5 .124 .060 .118 2.075 .039 .006 .241 .651 1.535 13.760
Page 82
72
The summary of regression model in Table 29 demonstrated that both model 1 and 2 were significant
(F1=64.437, p<0.05, p=0.000; F2=25.774, p<0.05, p=0.000). The independent variables in model 2
explained 40.9% of the variance (R2
2=0.409) in scenario 3, an increase from 38.9% in model 1
(R21=0.389). The improved explaining power did not prove to be significant as shown by the significance
of F change (p>0.05, p=0.084). The study examined the five dimensions individually to decide whether
the five dimensions of PBS had a moderating effect on the relationship between the three dimensions of
SADA and the good luck themed scenario in Intention to Visit.
Table 29 Regression Model Summary
(DV: S3; IV: SADA1, SADA2, SADA3, PBS1, PBS2, PBS3, PBS4, PBS5)
Model R2 Adjusted
R2
F Sig. Change Statistics
R Square Change F Change Sig. F Change
1 .389 .383 64.437 .000 .389 64.437 .000
2 .409 .393 25.774 .000 .019 1.963 .084
Model 1: DV: S3; IV: SADA1, SADA2, SADA3
Model 2: DV: S3; IV: SADA1, SADA2, SADA3, PBS1, PBS2, PBS3, PBS4, PBS5
Table 30 demonstrates that none of the five PBS dimensions was significant in predicting scenario 3
(βPBS1=-0.025, p>0.05, p=0.742, βPBS2=0.113, p>0.05, p=0.071, βPBS3=0.065, p>0.05, p=0.392,
βPBS4=0.044, p>0.05, p=0.505, βPBS5=-0.019, p>0.05, p=0.730). SADA3 was the only independent
variable that was found to be significant in model 2 (β=0.479, p<0.05, p=0.000). Multicollinearity was
not a problem for SADA3 given that the 95% confidence interval for its beta ranged from 0.385 to 0.775,
which did not include 0, the tolerance statistic was 0.297, the VIF value was 3.367, and the condition
index was 6.733. The study found that multicollinearity might be a problem for the other independent
variables in view that 0 was included in the 95% confidence interval for their betas in spite of the fact that
all other statistics aimed to detect multicollinearity did not report the same problem. The check of residual
normality and constant variance was conducted using the same procedure described previously, and no
violation of the assumptions was reported.
Page 83
73
Table 30 Regression Analysis Testing H2
(DV: S3; IV: SADA1, SADA2, SADA3, PBS1, PBS2, PBS3, PBS4, PBS5)
Model Unstandardized
Coefficients
Standardized
Coefficients
t Sig. 95.0% Confidence Interval
for Beta
Collinearity
Statistics
Condition
Index
(CI) β Std. Error Beta Lower Bound Upper Bound Tolerance VIF
(Constant)
SADA1
1.102 .160 6.321 .001 .697 1.327 1.000
.042 .107 .031 .392 .695 -.168 .252 .331 3.018 4.424
SADA2 .043 .062 .042 .694 .488 -.079 .165 .542 1.846 6.216
SADA3 .693 .091 .572 7.605 .000 .514 .872 .356 2.808 7.863
(Constant)
SADA1
.684 .216 3.172 .002 .260 1.109 1.000
.012 .112 .008 .104 .918 -.208 .231 .297 3.363 5.626
SADA2 .033 .064 032 .508 .611 -.093 .158 .499 2.004 6.133
SADA3 .580 .099 .479 5.859 .000 .385 .775 .297 3.367 6.733
PBS1 -.032 .098 -.025 -.329 .742 -.226 .161 .339 2.948 7.561
PBS2 .162 .089 .113 1.814 .071 -.014 .337 .508 1.968 9.750
PBS3 .068 .079 .065 .857 .392 -.088 .224 .349 2.866 11.022
PBS4 .053 .079 .044 .668 .505 -.102 .207 .458 2.185 12.109
PBS5 .020 .057 .019 .345 .730 -.093 .133 .637 1.570 13.827
The model of the study was further extended as follows (Figure 7) after Hypothesis 2 was tested.
0.132
0.573
6
0.118
0.150
0.165
0.160
6
0.660
0.486
0.565
6
Figure 7 Extended Model Proposed for the Study (3rd version)
Attitude
about
Superstition
SADA
1
SADA
22
SADA
3
Intention
to Visit
S1
S2
S3
Trait of
Superstition
PBS1 PBS2 PBS3 PBS4 PBS5
Page 84
74
Summary
This chapter presents the results of data analysis. It starts from a summary of the descriptive statistics of
respondents’ demographics and travel experiences and ends with hierarchical multiple regression analysis
of the hypotheses proposed in the study. The results of the data analysis demonstrate that both Hypothesis
1 and Hypothesis 2 are supported. Table 31 provides the results of the hypothesis testing.
Table 31 Result of Hypothesis Testing
Hypothesis Hypothesis Content Result
H1 Attitude about superstition -----> Intention to Visit (+) Supported
H2 Trait of superstition moderates the relationship between attitude
about superstition and intention to visit.
Supported
Page 85
75
Chapter 5: Discussion
CONCLUSION
The study supports the hypothesis that there is a positive relationship between potential tourists’ attitude
about superstition and their intention to visit a destination whose attractiveness is based on superstition;
therefore, the more positive potential tourists’ attitude is about superstition, the more likely they are to
visit a destination with superstition as its attractiveness. More specifically, those who hold positive
attitude about witchcraft have higher intention to pay a visit to a witchcraft themed destination (SADA1 --
--> S1); those who hold positive attitude about ghost stories and good luck related activities have higher
intention to visit a ghost themed destination (SADA2 ----> S2; SADA3 ----> S2); those who hold positive
attitude about good luck related activities higher intention to visit a good luck themed destination
(SADA3 ----> S3).
The study supports the hypothesis that the relationship between potential tourists’ attitude about
superstition and their intention to visit a destination whose attractiveness is based on superstition is
moderated by potential tourists’ traits of superstition. In other words, the study supports that the more
traits of superstition a potential tourist bears, the stronger the relationship between potential tourists’
attitude about superstition and their intention to visit a destination with superstition as its attractiveness.
Specifically, the study finds that trait of superstition moderates the relationship between potential tourists’
attitude about witchcraft and the intention to visit a witchcraft themed destination and the relationship
between potential tourists’ attitude about good luck related activities and their intention to visit a
destination, the major attractiveness is good luck based. Additionally, the study finds that the dimension
Extraordinary Life Forms of PBS moderates the relationship between potential tourists’ attitude about
witchcraft and the intention to visit a witchcraft themed destination.
Page 86
76
IMPLICATIONS
The study has both theoretical and practical implications. Very limited research has been conducted to
investigate the attractiveness of superstition for a destination. This study is dedicated to exploring a
unique aspect of destination attractiveness that might lead to the development of a new type of tourism.
The study develops a scale that measures respondents’ attitude about superstition as it relates to
destination attractiveness. With the combined use of the Paranormal Belief Scale, the study identifies the
underlying dimensions of the constructs key to the hypothesis testing. A model delineating the hypotheses
supported by the study has been proposed and extended, which contributes to the theory building in this
area.
The study partially supports the theory of planned behavior proposed by Fishbein and Ajzen in 1975 that
a person’s attitude can be used to predict his/her behavioral intention. The study finds that personality
traits function as a moderator in the interplay between attitude and behavioral intention, which provides
some more evidence for academics to examine personality’s functionality in human attitude and behavior.
The study results also lends support to Kramer and Block’s study in 2008 and Carlson and his colleagues’
study in 2009 that superstitious beliefs influence decision making under risk. Additionally, the study
confirms the practicality of adopting an ideographic approach toward destination attractiveness and
looking at the attraction aspects of destination attractiveness.
In terms of the application of the study results, the study suggests that in order for a destination, the major
attractiveness is superstition based (e.g., a haunted house), to increase the visitation of the destination,
relevant destination management companies should target potential tourists who have positive attitude
about superstition. The destination under investigation would be the most attractive to those who are high
in trait of superstition and have positive attitude about superstition in the same time, and this is especially
true for a destination that features witchcraft and bringing good luck to potential tourists. The destination
management companies should target those who strongly believe in the existence of extraordinary life
Page 87
77
forms such as the Loch Ness monster of Scotland and abominable snowman of Tibet and have positive
attitude about ghost stories since they are mostly likely to pay a visit to a ghost themed destination.
In order to reach this particular target market, the destination management companies can utilize
functions in social media which allow them to set up groups that involve people with superstitious
attitude and initiate discussions with the group members. The marketing department of those
organizations can gather the email addresses of the group members and create an email listserv that the
company might be able to use to send those who are registered some more information about the
destinations that feature superstition. Magazines that target similar markets might be a valid source of
potential tourists who are high in trait of superstition and have positive attitude about superstition as well.
The destination management companies can advertise in these magazines and collect information about
the demographics of the magazines’ readers. Television introductory series/advertisements might enable
the destination management companies to largely increase public’s awareness of destinations whose
major attractiveness is superstition based and project the appropriate image. It is effective but costly as
well. The destination management companies might consider the cooperation with TV series such as
Supernatural to find out who are watching them and to explore potential opportunities for advertisement.
Like TV introductory series/advertisements, this might be very expensive.
With the development of new technologies and improved quality of life, tourists will seek new adventures
in tourism, experiencing superstition at a destination being one of many other examples. It is important
for both practitioners and researchers to have their mind open to new trends in the industry. To keep
scanning the environment, not only the hospitality and tourism environment, but also the developments
and changes in other fields, such as the global economics, technologies, politics and policies, social and
demographics, etc., helps practitioners to stay current and alert. In other cases, practitioners can go
beyond and above that they develop creative tourism products themselves. In this sense, the study
Page 88
78
supports the notion that destinations should develop unique products that can differentiate themselves in
order to remain competitive and also increase their tourist market share.
LIMITATIONS
One of the limitations of the study relates to the sample. Data were collected from students at Virginia
Tech only, which is a viable option in light of the focus of the study, namely to test the two hypotheses
and the proposed model; thus, the use of students does not undermine the essence of the study, though the
practicality of the study can be better investigated by surveying a different consumer segment other than
students (e.g., potential tourists in general public).
In addition to potential tourists’ attitude about superstition and their level on traits of superstition, other
characteristics of potential tourists might come into play in their intention to visit a destination, the major
attractiveness of which is superstition based, for example, age, past experience, ethnicity, etc. The
inclusion of those characteristics might help to explain more variance in the models in multiple regression
analysis. However, these points are beyond the boundaries of this current study.
The study did not capture the demographics of those who are especially likely to have high intention to
visit a destination featuring superstition, which is one of the side effects of using student sample. The
study did not identify the characteristics of those who are high in traits of superstition as well. A possible
approach to the identification is to cluster the respondents into groups based on their responses to the R-
PBS and see whether different cluster membership will result in different demographic characteristics and
past travel experience preferences.
Page 89
79
FUTURE STUDY
Further research can be conducted in order to better explore the phenomena of SADA. One of the possible
options for further exploration can be to investigate why tourists visit a destination featuring superstition,
and researchers can compare the motives of those who visit this type of destination with the motives of
tourists who visit a general type of destinations to see whether the theories in explaining tourists
travelling motives can be applicable to the superstition themed destination settings as well.
From a more practical standpoint, future research can address the satisfaction of those who have past
experience with SADA to see where in their experience with SADA should be improved and whether this
particular form of tourism has viable potential for growth and the estimated size of the niche market.
A review of the responses to past experience with SADA leads to the finding that oftentimes the
attractiveness of superstition in a destination is not what a tourist originally expects to have with a place
they visit. In other words, they have past experience with SADA not because they intended to experience
SADA but because they visited the place for some other reason(s) (e.g., to visit Harry Potter Castle in
Universal Studio in Orlando, Florida for entertainment). Future studies can look at how relevant
organizations can develop a more distinct image for a destination with superstition as the core
attractiveness and how superstition can be a driving force for a destination to attract tourists given that the
destination has adequate superstition resources to develop unique tourism products.
Summary
This chapter provides closing remarks to the previous research with the interpretation of the results, the
implications and limitations of the study, and some suggestions for future studies. The interpretation of
the results is useful for marketing efforts of a destination management organization. The study suggests
Page 90
80
both theoretical and practical implications. The suggestions for future studies are proposed from the
perspective of both academics and industry. However, the study is not free from limitations, and the three
major limitations have been pointed out in the discussion of limitations.
Page 91
81
REFERENCE
Ajzen, I., & Fishbein, M. (1977). Attitude-behavior relations: a theoretical analysis and review of
empirical research. Psychological bulletin, 84(5), 888-918.
Ajzen, I., & Fishbein, M. (1980). Understanding attitudes and predicting social behavior. Englewood
Cliffs, NJ: Prentice-Hall.
Ajzen, I. (1985). From intentions to actions: a theory of planned behavior Action control: From cognition
to behavior (pp. 11-39). Berlin and New York: Springer-Verlag.
Ajzen, I. (1988). Attitudes, personality and behavior. Chicago, IL, US: Dorsey.
Ajzen, I. (1998). Models of human social behavior and their application to health psychology. Psychology
and Health, 13, 735-739.
Ajzen, I. (1991). The theory of planned behavior. Organizational behavior and human decision processes,
50(2), 179-211.
Ajzen, I., & Driver, B. L. (1992). Application of the theory of planned behavior to leisure choice. Journal
of Leisure Research, 24(3), 207-224.
Akama, J. S., & Kieti, D. M. (2003). Measuring tourist satisfaction with Kenya’s wildlife safari: a case
study of Tsavo West National Park. Tourism Management, 24(1), 73-81.
Allport, G. (1961). Pattern and growth in personality. New York, NY, US: Holt, Rinehart & Winston.
Allport, G. W. (1935). Attitudes. In C. A. Murchison (Ed.), A Handbook of Social Psychology (pp. 798-
844). Worcester, Massachusetts, US: Clark University Press.
Armitage, C. J., & Conner, M. (2001). Efficacy of the theory of planned behaviour: a meta-analytic
review. British Journal of Social Psychology, 40(4), 471-499.
Backman, S. J., & Veldkamp, C. (1995). Examination of the relationship between service quality and user
loyalty. Journal of Park and Recreation Administration, 13(2), 29-41.
Bagozzi, R. P. (1981). Attitudes, intentions, and behavior: a test of some key hypotheses. Journal of
Personality and Social Psychology, 41(4), 607-627.
Page 92
82
Baker, D. A., & Crompton, J. L. (2000). Quality, satisfaction and behavioral intentions. Annals of Tourism
Research, 27(3), 785-804.
Ballantyne, R., Packer, J., & Axelsen, M. (2009). Trends in tourism research. Annals of Tourism Research,
36(1), 149-152.
Baloglu, S. (1998). An empirical investigation of attitude theory for tourist destinations: a comparison of
visitors and nonvisitors. Journal of Hospitality & Tourism Research, 22(3), 211-224.
Baloglu, S., & McCleary, K. W. (1999). A model of destination image formation. Annals of Tourism
Research, 26(4), 868-897.
Baum, T. (1993). Human resource issues in international tourism. Oxford: Butterworth Heinemann Ltd.
Baum, T. (1995). Managing human resources in the European tourism and hospitality industry: a strategic
approach. London: Chapman & Hall Ltd.
Baum, T. (1996). Images of tourism past and present. International Journal of Contemporary Hospitality
Management, 8(4), 25-30.
Beckwith, M. W. (1923). Signs and superstitions collected from American college girls. The Journal of
American Folklore, 36(139), 1-15.
Beerli, A., & Martin, J. D. (2004). Factors influencing destination image. Annals of Tourism Research,
31(3), 657-681.
Belk, R. W. (1975). Situational variables and consumer behavior. Journal of Consumer Research, 2(3),
157-164.
Bentler, P. M., & Speckart, G. (1979). Models of attitude-behavior relations. Psychological Review, 86(5),
452-464.
Bern, D. J. (1972). Self-perception theory. In L. Berkowitz (Ed.), Advances in experimental social
psychology (Vol. 6, pp. 1-62). New York: Academic Press.
Berry, B. (2006). You and your superstitions. Whitefish, MT, US: Kessinger Publishing.
Berry, W. D., & Feldman, S. (1985). Multiple regression in practice. Newbury Park, CA, US: Sage
Page 93
83
Publications.
Besculides, A., Lee, M., & McCormick, P. (2002). Residents’ perceptions of the cultural benefits of
tourism. Annals of Tourism Research, 29(2), 303-319.
Best, S. J., Krueger, B., Hubbard, C., & Smith, A. (2001). An assessment of the generalizability of
Internet surveys. Social Science Computer Review, 19(2), 131-145.
Biemer, P. P., & Lyberg, L. (2003). Introduction to survey quality. Hoboken, NJ, US: Wiley-Interscience.
Bisping, T. O., & Patron, H. (2008). Personality type as a determinant of student success in introductory
general business courses. Academy of Educational Leadership Journal, 12(1), 35-50.
Blain, C., Levy, S. E., & Ritchie, J. (2005). Destination branding: Insights and practices from destination
management organizations. Journal of Travel Research, 43(4), 328-338.
Blue, C. L. (1995). The predictive capacity of the theory of reasoned action and the theory of planned
behavior in exercise research: an integrated literature review. Research in Nursing and Health, 18(2),
105-122.
Bonewits, P., & Bonewits, I. (2007). Real Energy: systems, spirits, and substances to heal, change, and
grow. Pompton Plains, NJ, US: Career Press.
Bradley, N. (1999). Sampling for Internet surveys: an examination of respondent selection for Internet
research. Journal of the Market Research Society, 41(4), 387-395.
Broad, C. D. (1953). The relevance of psychical research to philosophy. In J. Ludwig (Ed.), Philosophy
and parapsychology (pp. 43- 63). Buffalo, NY, US: Prometheus.
Brown, T. J. (1999). Antecedents of culturally significant tourist behavior. Annals of Tourism Research,
26(3), 676-700.
Brugger, P., Dowdy, M., & Graves, R. (1994). From superstitious behavior to delusional thinking: the role
of the hippocampus in misattributions of causality. Medical hypotheses, 43(6), 397-402.
Buckland, R. (2003). The fortune-telling book: the encyclopedia of divination and soothsaying: Visible
Ink Pr.
Page 94
84
Buss, D. M. (1991). Evolutionary personality psychology. Annual review of psychology, 42(1), 459-491.
Campbell, C. (1996). Half-belief and the paradox of ritual instrumental activism: a theory of modern
superstition. British Journal of Sociology, 47(1), 151-166.
Campo, S., & Yagüe, M. J. (2008). Tourist loyalty to tour operator: effects of price promotions and tourist
effort. Journal of Travel Research, 46(3), 318-326.
Caneen, J. M. (2003). Cultural determinants of tourist intention to return. Tourism Analysis, 8(2), 237-242.
Carlson, B. D., Mowen, J. C., & Fang, X. (2009). Trait superstition and consumer behavior: re-
conceptualization, measurement, and initial investigations. Psychology and Marketing, 26(8), 689-
713.
Carver, C. S., & Scheier, M. F. (1990). Origins and functions of positive and negative affect: a control-
process view. Psychological review, 97(1), 19-35.
Chaiklin, H. (2011). Attitudes, behavior and social practice. Journal of Sociology & Social Welfare, 38(1),
31-54.
Chen, C. F., & Tsai, D. C. (2007). How destination image and evaluative factors affect behavioral
intentions? Tourism Management, 28(4), 1115-1122.
Chen, J. S., & Uysal, M. (2002). Market positioning analysis: a hybrid approach. Annals of Tourism
Research, 29(4), 987-1003.
Cheng, S., Lam, T., & Hsu, C. H. C. (2005). Testing the sufficiency of the theory of planned behavior: a
case of customer dissatisfaction responses in restaurants. International Journal of Hospitality
Management, 24(4), 475-492.
Clements, C., Schultz, J., & Lime, D. (1993). Recreation, tourism, and the local residents: partnership or
co-existence? Journal of Park and Recreation Administration, 11(4), 78-91.
Cobanoglu, C., Warde, B., & Moreo, P. J. (2001). A comparison of mail, fax and web-based survey
methods. International journal of market research, 43(4), 441-452.
Conklin, E. S. (1919). Superstitious belief and practice among college students. The American Journal of
Page 95
85
Psychology, 30(1), 83-102.
Conner, M., & Armitage, C. J. (1998). Extending the theory of planned behavior: a review and avenues
for further research. Journal of applied social psychology, 28(15), 1429-1464.
Cook, C., Heath, F., & Thompson, R. L. (2000). A meta-analysis of response rates in Web-or Internet-
based surveys. Educational and psychological measurement, 60(6), 821-836.
Costa Jr, P., & McCrae, R. (1985). The NEO Personality Inventory manual. Odessa, FL: Psychological
Assessment Resources.
Costa, P. T., & McCrae, R. R. (1992). Normal personality assessment in clinical practice: the NEO
personality inventory. Psychological assessment, 4(1), 5-13.
Couper, M. P. (2000). Web surveys: a review of issues and approaches. The Public Opinion Quarterly,
64(4), 464-494.
Crompton, J. L. (1979). Motivations for pleasure vacation. Annals of Tourism Research, 6(4), 408-424.
Cronin, J. J., Brady, M. K., & Hult, G. T. M. (2000). Assessing the effects of quality, value, and customer
satisfaction on consumer behavioral intentions in service environments. Journal of retailing, 76(2),
193-218.
Crouch, G., & Ritchie, J. (1999). Tourism, competitiveness, and societal prosperity. Journal of Business
Research, 44(3), 137-152.
CultureMap. (2010). Star crossed soccer: astrology leads French World Cup coach astray. Retrieved 04-
10, 2011, from http://houston.culturemap.com/newsdetail/06-21-10-star-croosed-astrology-leads-
french-world-cup-coach-astray/
Daly, J. M., Jones, J. K., Gereau, P. L., & Levy, B. T. (2011). Review Article: Nonresponse error in mail
surveys: top ten problems. Nursing Research and Practice. Retrieved from
http://www.hindawi.com/journals/nrp/2011/987924/cta/
Dann, G. (1981). Tourist motivation an appraisal. Annals of Tourism Research, 8(2), 187-219.
Davidson, A. R., & Jaccard, J. J. (1975). Population psychology: a new look at an old problem. Journal of
Page 96
86
Personality and Social Psychology, 31(6), 1073.
De Leeuw, R. N. H., Engels, R. C. M. E., Vermulst, A. A., & Scholte, R. H. J. (2008). Do smoking
attitudes predict behaviour? A longitudinal study on the bi-directional relations between adolescents’
smoking attitudes and behaviours. Addiction, 103(10), 1713-1721.
Deutskens, E., De Ruyter, K., Wetzels, M., & Oosterveld, P. (2004). Response rate and response quality of
internet-based surveys: An experimental study. Marketing letters, 15(1), 21-36.
Devenport, L. (1979). Superstitious bar pressing in hippocampal and septal rats. Science, 205(4407), 721-
723.
D’Hauteserre, A. M. (2000). Lessons in managed destination competitiveness: the case of Foxwoods
Casino Resort. Tourism Management, 21(1), 23-32.
D’Hauteserre, A. M. (2001). Destination branding in a hostile environment. Journal of Travel Research,
39(3), 300-307.
Diamond, J. (2001). Snake oil and other preoccupations. London, UK: Vintage.
Digman, J. M. (1990). Personality structure: emergence of the five-factor model. Annual review of
psychology, 41(1), 417-440.
Dillman, D. A. (1991). The design and administration of mail surveys. Annual review of sociology, 17,
225-249.
Dillman, D. A. (2007). Mail and internet surveys: The tailored design method (2nd ed.). Hoboken, NJ, US:
John Wiley & Sons.
Dockery, T. M., & Bedeian, A. G. (1989). Attitude versus actions: LaPieres (1934) classic study revisited.
Social Behavior and Personality: an international journal, 17(1), 9-16.
Dodds, W. B., Monroe, K. B., & Grewal, D. (1991). Effects of price, brand, and store information on
buyers’ product evaluations. Journal of marketing research, 28(3), 307-319.
Dwyer, L., & Kim, C. (2003). Destination competitiveness: determinants and indicators. Current issues in
tourism, 6(5), 369-414.
Page 97
87
Eagly, A. H., & Chaiken, S. (1993). The psychology of attitudes. Orlando, FL, US: Harcourt Brace
Jovanovich College Publishers.
Echtner, C. M., & Ritchie, J. (1993). The measurement of destination image: an empirical assessment.
Journal of Travel Research, 31(4), 3.
Edwards, J. A., Lanning, K., & Hooker, K. (2002). The MBTI and social information processing: an
incremental validity study. Journal of Personality Assessment, 78(3), 432-450.
Ekinci, Y., & Hosany, S. (2006). Destination personality: an application of brand personality to tourism
destinations. Journal of Travel Research, 45(2), 127.
Ekinci, Y., Sirakaya-Turk, E., & Baloglu, S. (2007). Host image and destination personality. Tourism
Analysis, 12, 5(6), 433-446.
Engel, J. F., Black, H., & Miniard, P. (1993). Consumer behavior. Orlando, FL, US: Dryden Press.
Enright, M. J., & Newton, J. (2004). Tourism destination competitiveness: a quantitative approach.
Tourism Management, 25(6), 777-788.
Enright, M. J., & Newton, J. (2005). Determinants of tourism destination competitiveness in Asia Pacific:
comprehensiveness and universality. Journal of Travel Research, 43(4), 339-350.
Esman, M. (1984). Tourism as ethnic preservation: the Cajuns of Louisiana. Annals of Tourism Research,
11(3), 451-467.
Fazio, R. H. (1990). Multiple processes by which attitudes guide behavior: the MODE model as an
integrative framework. In L. Berkowitz (Ed.), Advances in experimental social psychology (Vol. 23,
pp. 75-109). New York, NY, US: Academic Press.
Fazio, R. H., Chen, J. M., McDonel, E. C., & Sherman, S. J. (1982). Attitude accessibility, attitude-
behavior consistency, and the strength of the object-evaluation association. Journal of Experimental
Social Psychology, 18(4), 339-357.
Fazio, R. H., Powell, M. C., & Herr, P. M. (1983). Toward a process model of the attitude–behavior
relation: accessing one’s attitude upon mere observation of the attitude object. Journal of Personality
Page 98
88
and Social Psychology, 44(4), 723-735.
Fazio, R. H., Powell, M. C., & Williams, C. J. (1989). The role of attitude accessibility in the attitude-to-
behavior process. Journal of Consumer Research, 16(3), 280-288.
Fazio, R. H., & Towles-Schwen, T. (1999). The MODE model of attitude-behavior processes. In S.
Chaiken & Y. Trope (Eds.), Dual process theories in social psychology (pp. 97–116). New York:
Guilford Press.
Fazio, R. H., & Williams, C. J. (1986). Attitude accessibility as a moderator of the attitude–perception and
attitude–behavior relations: an investigation of the 1984 presidential election. Journal of Personality
and Social Psychology, 51(3), 505-514.
Ferrario, F. F. (1979). The evaluation of tourist resources: an applied methodology. Journal of Travel
Research, 17(4), 24-30.
Festinger, L. (1957). A theory of cognitive dissonance. Palo Alto, CA, US: Stanford University Press.
Fishbein, M. (1930). Shattering Health Superstitions. New York, NY, US: Horace Liveright.
Fishbein, M., & Ajzen, I. (1975). Belief, attitude, intention, and behavior: an introduction to theory and
research. Boston, MA, US: Addison-Wesley.
Fiske, D. W., & Maddi, S. R. (1961). Functions of varied experience. Homewood, IL, US: Dorsey Press.
Fodness, D., & Murray, B. (1997). Tourist information search. Annals of Tourism Research, 24(3), 503-
523.
Fodness, D., & Murray, B. (1998). A typology of tourist information search strategies. Journal of Travel
Research, 37(2), 108-119.
Fodness, D., & Murray, B. (1999). A model of tourist information search behavior. Journal of Travel
Research, 37(3), 220-230.
Formica, S. (2000). Destination attractiveness as a function of supply and demand interaction. Virginia
Polytechnic Institute and State University, Blacksburg.
Formica, S., & Uysal, M. (2002). Segmentation of travelers based on environmental attitudes. Journal of
Page 99
89
Hospitality & Leisure Marketing, 9(3/4), 35-49.
Formica, S., & Uysal, M. (2006). Destination attractiveness based on supply and demand evaluations: an
analytical framework. Journal of Travel Research, 44(4), 418-430.
Foster, K. R., & Kokko, H. (2009). The evolution of superstitious and superstition-like behaviour.
Proceedings of the Royal Society B: Biological Sciences, 276(1654), 31-37.
Frew, E. A., & Shaw, R. N. (1999). The relationship between personality, gender, and tourism behavior.
Tourism Management, 20(2), 193-202.
Fudenberg, D., & Levine, D. K. (2006). Superstition and rational learning. The American economic
review, 96(3), 630-651.
Gallarza, M. G., Saura, I. G., & Garcia, H. C. (2002). Destination image: towards a conceptual framework.
Annals of Tourism Research, 29(1), 56-78.
Galloway, G., Mitchell, R., Getz, D., Crouch, G., & Ong, B. (2008). Sensation seeking and the prediction
of attitudes and behaviours of wine tourists. Tourism Management, 29(5), 950-966.
Gallup, G. H., & Newport, F. (1991). Belief in paranormal phenomena among adult Americans. Skeptical
Inquirer, 15(2), 137-146.
Gartner, W. (1989). Tourism image: attribute measurement of state tourism products using
multidimensional scaling techniques. Journal of Travel Research, 28(2), 16-20.
Gearing, C. E., Swart, W. W., & Var, T. (1974). Establishing a measure of touristic attractiveness. Journal
of Travel Research, 12(4), 1-8.
Gnoth, J. (1997). Tourism motivation and expectation formation. Annals of Tourism Research, 24(2), 283-
304.
Goldberg, L. R. (1992). The development of markers for the Big-Five factor structure. Psychological
assessment, 4(1), 26-42.
Goodrich, J. N. (1978). The relationship between preferences for and perceptions of vacation destinations:
application of a choice model. Journal of Travel Research, 17(2), 8-13.
Page 100
90
Gountas, J., & Gountas, S. (2001). A new psychographic segmentation method using Jungian MBTI
variables in the tourism industry. In J. Mazanec, G. Crouch, B. Richie & A. Woodside (Eds.),
Consumer psychology of tourism, hospitality and leisure (Vol. 2, pp. 215-229). Oxford, UK: CABI.
Gunn, C. A. (1994). Tourism planning: basics concepts and cases. London, UK: Psychology Press.
Gursoy, D., & Terry Umbreit, W. (2004). Tourist information search behavior: cross-cultural comparison
of European union member states. International Journal of Hospitality Management, 23(1), 55-70.
Hall, D. T., & Nougaim, K. E. (1968). An examination of Maslow’ need hierarchy in an organizational
setting. Organizational behavior and human performance, 3(1), 12-35.
Hampson, S. E., John, O. P., & Goldberg, L. R. (1986). Category breadth and hierarchical structure in
personality: studies of asymmetries in judgments of trait implications. Journal of Personality and
Social Psychology, 51(1), 37-54.
Han, H., Hsu, L. T. J., & Sheu, C. (2010). Application of the theory of planned behavior to green hotel
choice: testing the effect of environmental friendly activities. Tourism Management, 31(3), 325-334.
Hansen, F. (1976). Psychological theories of consumer choice. Journal of Consumer Research, 3(3), 117-
142.
Heaven, P., Stones, C., Nel, E., Huysamen, G., & Louw, J. (1994). Human values and voting intention in
South Africa. British Journal of Social Psychology, 33(2), 223-231.
Heider, F. (1958). The psychology of interpersonal relations. New York, NY, US: John Wiley & Sons.
Helson, H. (1964). Adaptation-level theory. New York, NY, US: Harper.
Hira, K., Fukui, T., Endoh, A., Rahman, M., & Maekawa, M. (1998). Influence of superstition on the date
of hospital discharge and medical cost in Japan: retrospective and descriptive study. Br. Med. J., 317,
1680-1683.
Homer, P. M., & Kahle, L. R. (1988). A structural equation test of the value-attitude-behavior hierarchy.
Journal of Personality and Social Psychology, 54(4), 638-646.
Hosany, S., Ekinci, Y., & Uysal, M. (2007). Destination image and destination personality. International
Page 101
91
Journal of Culture, Tourism and Hospitality Research, 1(1), 62-81.
Hou, J., Lin, C., & Morais, D. (2005). Antecedents of attachment to a cultural tourism destination: the
case of Hakka and non-Hakka Taiwanese visitors to Pei-Pu, Taiwan. Journal of Travel Research,
44(2), 221-233.
Hoxter, A. L., & Lester, D. (1988). Tourist behavior and personality. Personality and Individual
Differences, 9(1), 177-178.
Hsu, C. H. C., Cai, L. A., & Li, M. (2010). Expectation, motivation, and attitude: a tourist behavioral
model. Journal of Travel Research, 49(3), 282-296.
Hu, Y., & Ritchie, J. R. B. (1993). Measuring destination attractiveness: a contextual approach. Journal of
Travel Research, 32(2), 25-34.
Huang, S. S. (2007). The effects of motivation, past experience, perceived constraint, and attitude on
tourist revisit intention. Hong Kong Polytechnic University, Hong Kong.
Hwang, Y. H., & Fesenmaier, D. R. (2004). Coverage error embedded in self-selected Internet-based
samples: a case study of Northern Indiana. Journal of Travel Research, 42(3), 297-304.
Jahoda, G. (1969). The psychology of superstition. New York, NY, US: Penguin.
Jang, Y. J., Kim, W. G., & Bonn, M. A. (2011). Generation Y consumers’ selection attributes and
behavioral intentions concerning green restaurants. International Journal of Hospitality Management,
30(4), 803-811.
Jarvis, P. (1980). Towards a sociological understanding of superstition. Social Compass, 27(2-3), 285-295.
Jung, C. G. (1923). Psychological type. New York: Harcourt, Brace and Company.
Jung, C. G., Hull, R. F. C., & Baynes, H. G. (1971). Psychological types. Princeton, NJ: Princeton
University Press
Kaplowitz, M. D., Hadlock, T. D., & Levine, R. (2004). A comparison of web and mail survey response
rates. Public opinion quarterly, 68(1), 94-101.
Kashyap, R., & Bojanic, D. C. (2000). A structural analysis of value, quality, and price perceptions of
Page 102
92
business and leisure travelers. Journal of Travel Research, 39(1), 45-51.
Kassarjian, H. H. (1971). Personality and consumer behavior: a review. Journal of Marketing Research,
VIII, 409-418.
Kaur, J. (1981). Methodological approach to scenic resource assessment. Tourism Recreation Research,
6(1), 19-22.
Keinan, G. (2002). The effects of stress and desire for control on superstitious behavior. Personality and
Social Psychology Bulletin, 28(1), 102-108.
Kim, H. (1998). Perceived attractiveness of Korean destinations. Annals of Tourism Research, 25(2), 340-
361.
Kim, M. S., & Hunter, J. E. (1993). Relationships among attitudes, behavioral intentions, and behavior.
Communication research, 20(3), 331-364.
Kozak, M., & Rimmington, M. (1998). Benchmarking: destination attractiveness and small hospitality
business performance. International Journal of Contemporary Hospitality Management, 10(5), 184-
188.
Kozak, M., & Rimmington, M. (1999a). Measuring tourist destination competitiveness: conceptual
considerations and empirical findings. International Journal of Hospitality Management, 18(3), 273-
283.
Kozak, M., & Rimmington, M. (1999b). Developing a benchmarking model for tourist destinations. In K.
S. Chon (Ed.), The practice of graduate research in hospitality and tourism (pp. 23). London, UK:
Psychology Press.
Kozak, M., & Rimmington, M. (2000). Tourist satisfaction with Mallorca, Spain, as an off-season holiday
destination. Journal of Travel Research, 38(3), 260-269
Kramer, T., & Block, L. (2008). Conscious and nonconscious components of superstitious beliefs in
judgment and decision making. Journal of Consumer Research, 34(6), 783-793.
Kristiansen, C. M., & Matheson, K. (1990). Value conflict, value justification, and attitudes toward
Page 103
93
nuclear weapons. The Journal of Social Psychology, 130(5), 665-675.
Lam, T., & Hsu, C. H. C. (2004). Theory of planned behavior: potential travelers from China. Journal of
Hospitality & Tourism Research, 28(4), 463-482.
Lam, T., & Hsu, C. H. C. (2006). Predicting behavioral intention of choosing a travel destination. Tourism
Management, 27(4), 589-599.
Larsen, R. J., & Buss, D. M. (2008). Personality psychology: domains of knowledge about human nature.
New York: McGraw-Hill Higher Education.
Lasne, S., & Gaultier, A. P. (1984). A Dictionary of Superstitions. Englewood Cliffs, NJ, US: Prentice-
Hall.
Laws, E., & Prentice, R. (1995). Tourist destination management: issues, analysis and policies. London,
UK: Routledge.
Lee, T. H. (2009). A structural model to examine how destination image, attitude, and motivation affect
the future behavior of tourists. Leisure Sciences, 31(3), 215-236.
Lee, W. H., & Moscardo, G. (2005). Understanding the impact of ecotourism resort experiences on
tourists’ environmental attitudes and behavioural intentions. Journal of Sustainable Tourism, 13(6),
546-565.
Leiper, N. (1990). Tourist attraction systems. Annals of Tourism Research, 17(3), 367-384.
Lepp, A., & Gibson, H. (2008). Sensation seeking and tourism: tourist role, perception of risk and
destination choice. Tourism Management, 29(4), 740-750.
Lesser, A. (1931). Superstition. The Journal of Philosophy, 28(23), 617-628.
Leung, R., & Law, R. (2010). A review of personality research in the tourism and hospitality context.
Journal of Travel & Tourism Marketing, 27(5), 439-459.
Levitt, E. E. (1952). Superstitions: twenty-five years ago and today. The American Journal of Psychology,
65(3), 443-449.
Lew, A. A. (1987). A framework of tourist attraction research. Annals of Tourism Research, 14(4), 553-
Page 104
94
575.
Lindberg Rebecca L, K. (1997). Modeling resident attitudes toward tourism. Annals of Tourism Research,
24(2), 402-424.
MacDonald, S. E., Newburn-Cook, C. V., Schopflocher, D., & Richter, S. (2009). Addressing nonresponse
bias in postal surveys. Public Health Nursing, 26(1), 95-105.
Marzano, G., & Scott, N. (2009). Power in destination branding. Annals of Tourism Research, 36(2), 247-
267.
Maslow, A. H. (1948). “Higher” and “lower” needs. The Journal of Psychology, 25(2), 433-436.
Maykovich, M. K. (1976). Attitudes versus behavior in extramarital sexual relations. Journal of Marriage
& the Family, 38(4), 693-699.
Mayo, E. (1973). Regional images and regional travel destination. Paper presented at the The Fourth
Annual Conference of TTRA., Salt Lake City UT.
Mayo, E., & Jarvis, L. (1981). The psychology of leisure travel: effective marketing and selling of travel
services. Boston, MA, US: CBI Publishing Company, Inc.
McArthur, L. A., Kiesler, C. A., & Cook, B. P. (1969). Acting on an attitude as a function of self-percept
and inequity. Journal of Personality and Social Psychology, 12(4), 295-302.
McCain, G., & Ray, N. (2003). Legacy tourism: the search for personal meaning in heritage travel.
Tourism Management, 24(6), 713-717.
McCarty, J. A., & Shrum, L. (1994). The recycling of solid wastes: personal values, value orientations,
and attitudes about recycling as antecedents of recycling behavior. Journal of Business Research,
30(1), 53-62.
McClelland, D. (1951). Personality. New York, NY, US: William Slon Associates.
McCrae, R. R., & John, O. P. (1992). An introduction to the five-factor model and its applications. Journal
of Personality, 60(2), 175-215.
McGuire, W. J. (1985). Attitudes and attitude change. Handbook of Social Psychology, 2(3), 233-346.
Page 105
95
Mehta, R., & Sivadas, E. (1995). Comparing response rates and response content in mail versus electronic
mail surveys. Journal of the Market Research Society, 37(4), 429-440.
Middleton, V. T. C. (1989). Marketing implications for attractions. Tourism Management, 10(3), 229-232.
Mihalič, T. (2000). Environmental management of a tourist destination: a factor of tourism
competitiveness. Tourism Management, 21(1), 65-78.
Millar, M. G., & Tesser, A. (1986). Effects of affective and cognitive focus on the attitude-behavior
relation. Journal of Personality and Social Psychology, 51(2), 270-276.
Mineka, S., & Kihlstrom, J. F. (1978). Unpredictable and uncontrollable events: a new perspective on
experimental neurosis. Journal of Abnormal Psychology, 87(2), 256-271.
Mittal, V., Kumar, P., & Tsiros, M. (1999). Attribute-level performance, satisfaction, and behavioral
intentions over time: a consumption-system approach. The Journal of Marketing, 63(2), 88-101.
Moberg, D. O., & Brusek, P. M. (1978). Spiritual well-being: a neglected subject in quality of life
research. Social Indicators Research, 5(1), 303-323.
Mohsin, A. (2005). Tourist attitudes and destination marketing--the case of Australia’s northern territory
and Malaysia. Tourism Management, 26(5), 723-732.
Morgan, N., & Pritchard, A. (2002). Contextualizing destination branding. In N. Morgan, A. Pritchard &
R. Pride (Eds.), Destination branding: Creating the unique destination proposition (pp. 11-41).
Oxford, UK: Butterworth-Heinemann.
Moutinho, L. (1987). Consumer behaviour in tourism. European Journal of Marketing, 21(10), 5-44.
Mowen, J. C., & Carlson, B. (2003). Exploring the antecedents and consumer behavior consequences of
the trait of superstition. Psychology and Marketing, 20(12), 1045-1065.
Nayha, S. (2002). Traffic deaths and superstition on Friday the 13th. American Journal of Psychiatry,
159(12), 2110-2111.
Newell, A., & Simon, H. A. (1972). Human problem solving. Englewood Cliffs, NJ, US: Prentice-Hall
Ng, T., Chong, T., & Du, X. (2010). The value of superstitions. Journal of Economic Psychology, 31(3),
Page 106
96
293-309.
Nickerson, N. P., & Ellis, G. D. (1991). Traveler types and activation theory: a comparison of two models.
Journal of Travel Research, 29(3), 26-31.
Nunnally J. (1978). Psychometric theory. New York, NY, US: McGraw-Hill.
Ostrom, T. M. (1969). The relationship between the affective, behavioral, and cognitive components of
attitude. Journal of Experimental Social Psychology, 5(1), 12-30.
Park, C. W. (1978). A conflict resolution choice model. Journal of Consumer Research, 5(2), 124-137.
Patzer, G. (1985). The physical attractiveness phenomena. New York, NY, US: Plenum Press.
Pavlou, P. A., & Fygenson, M. (2006). Understanding and predicting electronic commerce adoption: an
extension of the theory of planned behavior. Management Information Systems Quarterly, 30(1),
115-143.
Pavlov, I. P., & Gantt, W. (1928). Experimental psychology and psycho-pathology in animals (W. H.
Gantt, Trans.). In I. P. Pavlov (Ed.), Lectures on conditioned reflexes: Twenty-five years of objective
study of the higher nervous activity (behaviour) of animals (pp. 47-60). New York, NY, US:
Liverwright Publishing Corporation.
Pearce, D. (1979). Towards a geography of tourism. Annals of Tourism Research, 6(3), 245-272.
Petrick, J. F. (2004). The roles of quality, value, and satisfaction in predicting cruise passengers’
behavioral intentions. Journal of Travel Research, 42(4), 397-407.
Phillips, W., & Jang, S. (2008). Destination image and tourist attitude. Tourism Analysis, 13(4), 401-411.
Pike, S. (2002). Destination image analysis--a review of 142 papers from 1973 to 2000. Tourism
Management, 23(5), 541-549.
Pizam, A., Neumann, Y., & Reichel, A. (1978). Dimentions of tourist satisfaction with a destination area.
Annals of Tourism Research, 5(3), 314-322.
Plog, S. (2001). Why destination areas rise and fall in popularity. Cornell Hotel and Restaurant
Administration Quarterly, 42(3), 13-24.
Page 107
97
Plog, S. C. (1974). Why destination areas rise and fall in popularity. Cornell Hotel and Restaurant
Administration Quarterly, 14(4), 55-58.
Plog, S. C. (1991). Leisure travel: making it a growth market.... again! New York, NY, US: John Wiley.
Plowright, T. (2010). The Wizarding World of Harry Potter-at Universal Orlando. Retrieved 09-21, 2011,
from http://travelwithkids.about.com/od/familyfunplaces/a/Harry-Potter-Theme-Park.htm
Reddy, S. G., York, V. K., & Brannon, L. A. (2010). Travel for treatment: students’ perspective on medical
tourism. International Journal of Tourism Research, 12(5), 510-522.
Ritchie, J., & Crouch, G. (2000). The competitive destination: a sustainability perspective. Tourism
Management, 21(2), 1-7.
Ritchie, J., & Zins, M. (1978). Culture as determinant of the attractiveness of a tourism region. Annals of
Tourism Research, 5(2), 252-267.
Ritchie, J. R. B., & Crouch, G. I. (2003). The competitive destination: a sustainable tourism perspective.
Wallingford: CABI Publishing.
Ritchie, J. R. B., & Ritchie, R. J. B. (1998). The branding of tourism destinations: past achievements and
future challenges. Paper presented at the the 1998 Annual Congress of the International Association
of Scientific Experts in Tourism, Destination Marketing: Scopes and Limitations, Marrakech,
Morocco.
Rook, D. W. (1985). The ritual dimension of consumer behavior. Journal of Consumer Research, 12(3),
251-264.
Rosenberg, M. J. (1956). Cognitive structure and attitudinal affect. The Journal of abnormal and social
psychology, 53(3), 367-372.
Russo, A., & Van Der Borg, J. (2002). Planning considerations for cultural tourism: a case study of four
European cities. Tourism Management, 23(6), 631-637.
Saroglou, V. (2002). Religion and the five factors of personality: a meta-analytic review. Personality and
Individual Differences, 32(1), 15-25.
Page 108
98
Schaefer, D. R., & Dillman, D. A. (1998). Development of a standard e-mail methodology: Results of an
experiment. Public opinion quarterly, 62(3), 378-397.
Scheibe, K. E., & Sarbin, T. R. (1965). Towards a theoretical conceptualisation of superstition. The
British Journal for the Philosophy of Science, 16(62), 143-158.
Schmidt, W. C. (1997). World-Wide Web survey research: benefits, potential problems, and solutions.
Behavior Research Methods, 29(2), 274-279.
Scott, D. R., Schewl, C. D., & Frederick, D. G. (1978). A multi-brand/multi-attribute model of tourist
state choice. Journal of Travel Research, 17(1), 23-29.
Shaner, A. (1999). Delusions, superstitious conditioning and chaotic dopamine neurodynamics. Medical
hypotheses, 52(2), 119-123.
Sheehan, K. B., & McMillan, S. J. (1999). Response variation in e-mail surveys: An exploration. Journal
of Advertising Research, 39(4), 45-54.
Shermer, M. (1997). Why people believe weird things: pseudoscience, superstition, and other confusions
of our time. New York, NY, US: W. H. Freeman & Co.
Shim, S., & Drake, M. F. (1990). Consumer intention to utilize electronic shopping: the Fishbein
behavioral intention model. Journal of Direct Marketing, 4(3), 22-33.
Simmons, L. C., & Schindler, R. M. (2003). Cultural superstitions and the price endings used in Chinese
advertising. Journal of International Marketing, 11(2), 101-111.
Sirgy, M. J., & Su, C. (2000). Destination image, self-congruity, and travel behavior: toward an
integrative model. Journal of Travel Research, 38(4), 340-352.
Skinner, B. F. (1948). “Superstition” in the pigeon. Journal of Experimental Psychology, 38(2), 168-172.
Smith, S. L. J. (1983). Restaurants and dining out: geography of a tourism business. Annals of Tourism
Research, 10(4), 515-549.
Smith, S. L. J. (1995). Tourism analysis: a handbook (2nd ed.). Harlow, Essex, UK: Longman.
Smith, V. L. (1989). Hosts and guests: the anthropology of tourism. Philadelphia: Philadelphia University
Page 109
99
Press.
Snyder, M. (1983). The influence of individuals on situations: implications for understanding the links
between personality and social behavior. Journal of Personality, 51(3), 497-516.
Sparks, B. (2007). Planning a wine tourism vacation? Factors that help to predict tourist behavioural
intentions. Tourism Management, 28(5), 1180-1192.
Stedman, R. C. (2002). Toward a social psychology of place: predicting behavior from place-based
cognitions, attitude, and identity. Environment and Behavior, 34(5), 561-581.
Stone, P., & Sharpley, R. (2008). Consuming dark tourism: a thanatological perspective. Annals of
Tourism Research, 35(2), 574-595.
Stone, P. D. (2006). A dark tourism spectrum: towards a typology of death and macabre related tourist
sites, attractions and exhibitions. Tourism: An Interdisciplinary International Journal, 54(2), 145-160.
Sutton, S. (1994). The past predicts the future: Interpreting behaviour–behaviour relationships in social
psychological models of health behaviour. In D. R. Rutter & L. Quine (Eds.), Social psychology and
health: European perspectives (pp. 7 1-88). Aldershot, UK: Avebury.
Tam, J. L. M. (2000). The effects of service quality, perceived value and customer satisfaction on
behavioral intentions. Journal of Hospitality & Leisure Marketing, 6(4), 31-43.
Thach, S., & Axinn, C. (1994). Patron assessments of amusement park attributes. Journal of Travel
Research, 32(3), 51-60.
Tian-Cole, S., Crompton, J. L., & Willson, V. L. (2002). An empirical investigation of the relationships
between service quality, satisfaction and behavioral intentions among visitors to a wildlife refuge.
Journal of Leisure Research, 34(1), 1-24.
Time. (1988, 1988-05-16). Good heavens! An astrologer dictating the President’s schedule? Retrieved
04-10, 2011, from http://www.time.com/time/magazine/article/0,9171,967389,00.html
Tinbergen, N. (1963). On aims and methods of ethology. Zeitschrift für Tierpsychologie, 20(4), 410-433.
Tobacyk, J., & Milford, G. (1983). Belief in paranormal phenomena: assessment instrument development
Page 110
100
and implications for personality functioning. Journal of personality and social psychology, 44(5),
1029-1037.
Tobacyk, J. J. (2004). A revised paranormal belief scale. The International Journal of Transpersonal
Studies, 23(23), 94-98.
Torgler, B. (2007). Determinants of superstition. Journal of Socio-Economics, 36(5), 713-733.
Truong, T. H., & Foster, D. (2006). Using HOLSAT to evaluate tourist satisfaction at destinations: the
case of Australian holidaymakers in Vietnam. Tourism Management, 27(5), 842-855.
Tse, A. C. B. (1998). Comparing the response rate, response speed and response quality of two methods
of sending questionnaires: E-mail vs. mail. Journal of the Market Research Society, 40(4), 353-361.
Tybout, A. M., & Hauser, J. R. (1981). A marketing audit using a conceptual model of consumer behavior:
application and evaluation. The Journal of Marketing, 45(3), 82-101.
Um, S., & Crompton, J. L. (1990). Attitude determinants in tourism destination choice. Annals of Tourism
Research, 17(3), 432-448.
UNWTO. (2008). UNWTO tourism highlights, 2011 edition. Retrieved 10-30, 2011, from
http://mkt.unwto.org/sites/all/files/docpdf/unwtohighlights11enlr_1.pdf
Uysal, M., Chen, J. S., & Williams, D. R. (2000). Increasing state market share through a regional
positioning. Tourism Management, 21(1), 89-96.
Uysal, M., Li, X., & Sirakaya-Turk, E. (2008). Push-pull dynamics in travel decisions. In H. Oh & A.
Pizam (Eds.), Handbook of Hospitality Marketing Management (pp. 413-439). Oxford, UK:
Elsevier-BH.
Var, T., Beck, R., & Loftus, P. (1977). Determination of touristic attractiveness of the touristic areas in
British Columbia. Journal of Travel Research, 15(3), 23-29.
Vengesayi, S., Mavondo, F., & Reisinger, Y. (2009). Tourism destination attractiveness: attractions,
facilities, and people as predictors. Tourism Analysis, 14(5), 621-636.
Vyse, S. (1997). Superstition in the age of science. World Revieiv, 2(4), 13-15.
Page 111
101
Vyse, S. A. (2000). Believing in magic: the psychology of superstition. Oxford, UK: Oxford University
Press.
Wagner, G. A., & Morris, E. K. (1987). “Superstitious” behavior in children. The Psychological Record,
37(4), 471-488.
Wagner, M. E. (1928). Superstitions and their social and psychological correlatives among college
students. Journal of Educational Sociology, 2(1), 26-36.
Walmsley, D., & Jenkins, J. (1992). Tourism cognitive mapping of unfamiliar environments. Annals of
Tourism Research, 19(2), 268-286.
Warshaw, P. R. (1980). A new model for predicting behavioral intentions: an alternative to Fishbein.
Journal of Marketing Research, 17(2), 153-172.
Waters, L., & Roach, D. (1979). Job satisfaction, behavioral intention, and absenteeism as predictors of
turnover. Personnel Psychology, 32(2), 393-397.
Weible, R., & Wallace, J. (1998). The impact of Internet on data collection. Marketing Research, 10(3),
19-23.
West, S., Griffin, A., & Gardner, A. (2007). Social semantics: altruism, cooperation, mutualism, strong
reciprocity and group selection. Journal of Evolutionary Biology, 20(2), 415-432.
Wheen, F. (2004). How mumbo-jumbo conquered the world. New York, NY, US: Harper Perennial.
Williams, D., Patterson, M., Roggenbuck, J., & Watson, A. (1992). Beyond the commodity metaphor:
examining emotional and symbolic attachment to place. Leisure Sciences, 14(1), 29-46.
Wilson, D. T., Mathews, H. L., & Harvey, J. W. (1975). An empirical test of the Fishbein behavioral
intention model. Journal of Consumer Research, 1(4), 39-48.
Winter, D. G., John, O. P., Stewart, A. J., Klohnen, E. C., & Duncan, L. E. (1998). Traits and motives:
toward an integration of two traditions in personality research. Psychological review, 105(2), 230-
250.
Yoon, Y., & Uysal, M. (2005). An examination of the effects of motivation and satisfaction on destination
Page 112
102
loyalty: a structural model. Tourism Management, 26(1), 45-56.
Young, M. (1999). Cognitive maps of nature-based tourists. Annals of Tourism Research, 26(4), 817-839.
Yu, J., & Cooper, H. (1983). A quantitative review of research design effects on response rates to
questionnaires. Journal of Marketing Research, 20(1), 36-44.
Zanna, M. P., Olson, J. M., & Fazio, R. H. (1980). Attitude–behavior consistency: an individual difference
perspective. Journal of Personality and Social Psychology, 38(3), 432-440.
Page 113
103
Appendix 1: Scale Development (SADA): Pretest Questionnaire
Superstitions and Destination Attractiveness
This questionnaire examines superstition and your perceptions of destination attractiveness. The questionnaire is
anonymous and confidential. Please consider each question or statement and circle the number that most closely
reflects your opinions. If you have any questions, please raise your hand, and I will come and help you. Thank you!
~~~~~~~~~~~~~~~~~~~~~~~~~~~~~~~~~~~~~~~~~~~~~~~~~~~~~~~~~~~~~~~~~~~~~~~~~~~~~~~~~~~~~~
1. Superstitions as Destination Attractiveness
Please indicate your agreement with the statements below by circling one of the numbers that best describes your
belief. “1” represents strongly disagree, “7” represents strongly agree, and “4” is neutral or no opinion.
Statement Strongly
Disagree
Strongly
Agree I consider the destination attractive if
I can perform little rituals to bring good luck. 1 2 3 4 5 6 7
I can buy charms (objects considered to be able to
bring good luck). 1 2 3 4 5 6 7
I can explore geomancy (the study of patterns
formed by tossed soil or sand). 1 2 3 4 5 6 7
I can meet palmists (people who read palms). 1 2 3 4 5 6 7
There is black magic (magic that is considered
evil). 1 2 3 4 5 6 7
Mysterious things happen (e.g. something out of the
ordinary). 1 2 3 4 5 6 7
I can explore astrology (e.g. destiny is caused by
the position of planets). 1 2 3 4 5 6 7
I can meet fortune tellers. 1 2 3 4 5 6 7
There are plants considered to be propitious
(favorably inclined). 1 2 3 4 5 6 7
I can explore witchcraft. 1 2 3 4 5 6 7
I can meet witches. 1 2 3 4 5 6 7
I can personally meet magicians. 1 2 3 4 5 6 7
I can explore cartomancy (fortune-telling using a
deck of cards). 1 2 3 4 5 6 7
I can make wishes following propitious signs (ex.
wish upon a star). 1 2 3 4 5 6 7
I can participate in magic. 1 2 3 4 5 6 7
I can explore dactyliomancy (a method of
divination using rings). 1 2 3 4 5 6 7
The destination is said to have magic power. 1 2 3 4 5 6 7
I can explore phrenology (the study of relationships
between a person’s character and the shape of
skull).
1 2 3 4 5 6 7
Supernatural things happen. 1 2 3 4 5 6 7
I can meet astrologists. 1 2 3 4 5 6 7
The destination is said to have supernatural forces. 1 2 3 4 5 6 7
I can buy things related to magic or witchcraft (e.g.
wand, crystal ball). 1 2 3 4 5 6 7
I can explore capnomancy (a method of divination
using smoke). 1 2 3 4 5 6 7
Werewolf stories have been reported at the
destination. 1 2 3 4 5 6 7
I can meet psychics (people who have extra sensory 1 2 3 4 5 6 7
Page 114
104
perceptions).
Vampire stories have been reported at the
destination. 1 2 3 4 5 6 7
Local residents practice superstitious behavior. 1 2 3 4 5 6 7
I can explore palmistry (art of foretelling future
through studying your palm). 1 2 3 4 5 6 7
The local culture has many superstitions. 1 2 3 4 5 6 7
The destination is said to have mystical energy (ex.
crystals used to heal). 1 2 3 4 5 6 7
The destination is believed to have ghosts. 1 2 3 4 5 6 7
I can meet wizards (male witches). 1 2 3 4 5 6 7
The destination has a superstitious local culture. 1 2 3 4 5 6 7
I can learn divinations (attempts to foretell the
future). 1 2 3 4 5 6 7
I can watch magic performances. 1 2 3 4 5 6 7
Things that happen are beyond scientific
explanation. 1 2 3 4 5 6 7
I can explore catoptromancy (a divination using a
mirror). 1 2 3 4 5 6 7
I can watch others perform rituals. 1 2 3 4 5 6 7
The destination is said to be haunted. 1 2 3 4 5 6 7
I can explore numerology (the study of mystical
meanings of numbers). 1 2 3 4 5 6 7
There are ghost stories surrounding the destination. 1 2 3 4 5 6 7
There are animals considered to be propitious
(favorably inclined). 1 2 3 4 5 6 7
I can meet clairvoyants (people who can see beyond
the five human senses). 1 2 3 4 5 6 7
The destination is said to have phantoms (a physical
manifestation of the soul of a person who is dead). 1 2 3 4 5 6 7
I can buy talismans (objects considered to possess
magical powers). 1 2 3 4 5 6 7
I can meet warlocks (male witches who are often
considered to be evil). 1 2 3 4 5 6 7
2. Demographics and Travel Behavior
Please answer the following questions:
1) What is your gender? □ Male □ Female
2) Which college are you studying at?
□ Agriculture & Life Sciences □ Architecture & Urban Studies □ Business
□ Engineering □ Liberal Arts & Human Sciences □ Natural Resources and Environment
□ Science □ Veterinary Medicine
3) Which year are you in? □ Freshman □ Sophomore □ Junior □ Senior
4) What’s your ratio-ethnicity?
□ Asian (Those of Primarily Asian Descent) □ Black (Those of Primarily African Descent)
□ Hispanic/Latino (Those of Primarily Spanish Descent) □ Native American
□ White (Those of Primarily European Descent) □ Other
5) Do you prefer vacation packages when planning your vacations? □ Yes □ No □ I’m not sure.
6) Where do you usually get information when planning your vacations? (You can choose more than one items)
□ Website □ Print Media □ TV □ Radio □ Travel agent/professionals
□ Friends/relatives/acquaintance □ Other
This is the end of the questionnaire,
Thank you very much for completing the survey!
Page 115
105
Appendix 2: Scale Development (SADA): Final Questionnaire
Superstitions and Destination Attractiveness
The questionnaire examines superstition and your perceptions of destination attractiveness. It is anonymous and
confidential. If you have any questions, please raise your hand, and I will come and help you. Thank you!
~~~~~~~~~~~~~~~~~~~~~~~~~~~~~~~~~~~~~~~~~~~~~~~~~~~~~~~~~~~~~~~~~~~~~~~~~~~~~~~~~~~~~~
1. Superstitions as Destination Attractiveness
Please indicate your agreement with the statements below by circling one of the numbers that best describes your
belief. “1” represents strongly disagree, “7” represents strongly agree, and “4” is neutral or no opinion.
Statement Strongly
Disagree
Strongly
Agree I consider the destination attractive if
I can perform little rituals to bring good luck. 1 2 3 4 5 6 7
I can buy charms (objects considered to be able to
bring good luck). 1 2 3 4 5 6 7
Mysterious things happen (e.g. something out of the
ordinary). 1 2 3 4 5 6 7
I can explore astrology (e.g. destiny is caused by
the position of planets). 1 2 3 4 5 6 7
There are plants considered to be propitious
(favorably inclined). 1 2 3 4 5 6 7
I can explore witchcraft. 1 2 3 4 5 6 7
I can meet witches. 1 2 3 4 5 6 7
I can make wishes following propitious signs (ex.
wish upon a star). 1 2 3 4 5 6 7
I can participate in magic. 1 2 3 4 5 6 7
I can explore dactyliomancy (a method of
divination using rings). 1 2 3 4 5 6 7
I can meet astrologists. 1 2 3 4 5 6 7
I can buy things related to magic or witchcraft (e.g.
wand, crystal ball). 1 2 3 4 5 6 7
I can explore palmistry (art of foretelling future
through studying your palm). 1 2 3 4 5 6 7
The destination is believed to have ghosts. 1 2 3 4 5 6 7
I can watch magic performances. 1 2 3 4 5 6 7
Things that happen are beyond scientific
explanation. 1 2 3 4 5 6 7
I can explore catoptromancy (a divination using a
mirror). 1 2 3 4 5 6 7
The destination is said to be haunted. 1 2 3 4 5 6 7
There are ghost stories surrounding the destination. 1 2 3 4 5 6 7
The destination is said to have phantoms (a physical
manifestation of the soul of a person who is dead). 1 2 3 4 5 6 7
I can buy talismans (objects considered to possess
magical powers). 1 2 3 4 5 6 7
I can meet warlocks (male witches who are often
considered to be evil). 1 2 3 4 5 6 7
2. Traits of Superstitions
Please indicate your agreement with the statements below by circling one of the numbers that best describes your
belief. 1 represents strongly disagree and 7 represents strongly agree. There is no right or wrong answer.
Statement Strongly Strongly
Page 116
106
Disagree Agree
The soul continues to exist through the body may
die 1 2 3 4 5 6 7
Some individuals are able to levitate (lift) objects
through mental forces 1 2 3 4 5 6 7
Black magic really exists 1 2 3 4 5 6 7
Black cats can bring bad luck 1 2 3 4 5 6 7
Your mind or soul can leave your body and travel
(astral projection) 1 2 3 4 5 6 7
The abominable snowman of Tibet (i.e., the Big
Foot) exists 1 2 3 4 5 6 7
Astrology is a way to accurately predict the future 1 2 3 4 5 6 7
There is a devil 1 2 3 4 5 6 7
Psychokinesis, the movement of objects through
psychic powers, does exist 1 2 3 4 5 6 7
Witches do exist 1 2 3 4 5 6 7
If you break a mirror, you will have bad luck 1 2 3 4 5 6 7
During altered states, such as sleep or trances, the
spirit can leave the body 1 2 3 4 5 6 7
The Loch Ness monster of Scotland exists 1 2 3 4 5 6 7
The horoscope accurately tells a person’s future 1 2 3 4 5 6 7
I believe in God 1 2 3 4 5 6 7
A person’s thoughts can influence the movement of
a physical object 1 2 3 4 5 6 7
Through the use of formulas and incantations, it is
possible to cast spells on persons 1 2 3 4 5 6 7
The number “13” is unlucky 1 2 3 4 5 6 7
Reincarnation does occur 1 2 3 4 5 6 7
There is life on other planets 1 2 3 4 5 6 7
Some psychics can accurately predict the future 1 2 3 4 5 6 7
There is a heaven and a hell 1 2 3 4 5 6 7
Mind reading is not possible 1 2 3 4 5 6 7
There are actual cases of witchcraft 1 2 3 4 5 6 7
It is possible to communicate with the dead 1 2 3 4 5 6 7
Some people have an unexplained ability to predict
the future 1 2 3 4 5 6 7
3. Demographics and Travel Behavior
Please answer the following questions:
1) What is your gender? □ Male □ Female
2) Which year are you in? □ Freshman □ Sophomore □ Junior □ Senior
3) What’s your ratio-ethnicity?
□ Asian (Those of Primarily Asian Descent) □ Black (Those of Primarily African Descent)
□ Hispanic/Latino (Those of Primarily Spanish Descent) □ Native American
□ White (Those of Primarily European Descent) □ Other
4) Do you prefer vacation packages when planning your vacations? □ Yes □ No □ I’m not sure.
5) Where do you usually get information when planning your vacations? (You can choose more than one items)
□ Website □ Print Media □ TV □ Radio □ Travel agent/professionals
□ Friends/relatives/acquaintance □ Other
This is the end of the questionnaire,
Thank you very much for completing the survey!
Page 117
107
Appendix 3: Pretest Questionnaire
The Effects of Superstition as Destination Attractiveness on Behavioral Intention
Dear respondent,
You are invited to complete a survey which is an essential part of a thesis research that will lead to a master’s degree.
The survey is anonymous and confidential. Thank you for your time. Your contribution to the study is highly
appreciated.
Yunzhou (Carol) Zhang ([email protected] )
Master Candidate of the Department of Hospitality and Tourism Management
Virginia Tech
~~~~~~~~~~~~~~~~~~~~~~~~~~~~~~~~~~~~~~~~~~~~~~~~~~~~~~~~~~~~~~~~~~~~~~~~~~~~~~~~~~~~~~
Part I. Please circle a number for each item to indicate how much you agree or disagree with that item. There is no
right or wrong answer. This is a sample of your own beliefs and attitudes. Thank you. (1=Strongly Disagree;
2=Somewhat Disagree; 3=Disagree; 4=Neutral; 5=Agree; 6=Somewhat Agree; 7=Strongly Agree)
Statement Strongly
Disagree
Strongly
Agree
The soul continues to exist through the body may
die 1 2 3 4 5 6 7
Some individuals are able to levitate (lift) objects
through mental forces 1 2 3 4 5 6 7
Black magic really exists 1 2 3 4 5 6 7
Black cats can bring bad luck 1 2 3 4 5 6 7
Your mind or soul can leave your body and travel
(astral projection) 1 2 3 4 5 6 7
The abominable snowman of Tibet (i.e., the Big
Foot) exists 1 2 3 4 5 6 7
Astrology is a way to accurately predict the future 1 2 3 4 5 6 7
There is a devil 1 2 3 4 5 6 7
Psychokinesis, the movement of objects through
psychic powers, does exist 1 2 3 4 5 6 7
Witches do exist 1 2 3 4 5 6 7
If you break a mirror, you will have bad luck 1 2 3 4 5 6 7
During altered states, such as sleep or trances, the
spirit can leave the body 1 2 3 4 5 6 7
The Loch Ness monster of Scotland exists 1 2 3 4 5 6 7
The horoscope accurately tells a person’s future 1 2 3 4 5 6 7
I believe in God 1 2 3 4 5 6 7
A person’s thoughts can influence the movement
of a physical object 1 2 3 4 5 6 7
Through the use of formulas and incantations, it is
possible to cast spells on persons 1 2 3 4 5 6 7
The number “13” is unlucky 1 2 3 4 5 6 7
Reincarnation does occur 1 2 3 4 5 6 7
There is life on other planets 1 2 3 4 5 6 7
Some psychics can accurately predict the future 1 2 3 4 5 6 7
There is a heaven and a hell 1 2 3 4 5 6 7
Mind reading is not possible 1 2 3 4 5 6 7
There are actual cases of witchcraft 1 2 3 4 5 6 7
It is possible to communicate with the dead 1 2 3 4 5 6 7
Page 118
108
Some people have an unexplained ability to predict
the future 1 2 3 4 5 6 7
Part II. Please indicate your level of agreement with the following statements by circling one of the numbers that
best describes your belief. (1=Strongly Disagree; 2=Somewhat Disagree; 3=Disagree; 4=Neutral; 5=Agree;
6=Somewhat Agree; 7=Strongly Agree)
Statement Strongly
Disagree
Strongly
Agree I consider the destination attractive if
I can explore dactyliomancy (a method of
divination using rings) 1 2 3 4 5 6 7
There are ghost stories surrounding the destination 1 2 3 4 5 6 7
I can perform little rituals to bring good luck 1 2 3 4 5 6 7
I can explore witchcraft 1 2 3 4 5 6 7
The destination is said to have phantoms (a
physical manifestation of the soul of a person who
is dead)
1 2 3 4 5 6 7
I can buy charms (objects considered to be able to
bring good luck) 1 2 3 4 5 6 7
I can meet warlocks (male witches who are often
considered to be evil) 1 2 3 4 5 6 7
The destination is said to be haunted 1 2 3 4 5 6 7
I can make wishes following propitious signs (ex.
wish upon a star) 1 2 3 4 5 6 7
I can meet witches 1 2 3 4 5 6 7
The destination is believed to have ghosts 1 2 3 4 5 6 7
There are plants considered to be propitious
(favorably inclined) 1 2 3 4 5 6 7
I can participate in magic 1 2 3 4 5 6 7
Things that happen are beyond scientific
explanation 1 2 3 4 5 6 7
Mysterious things happen (e.g. something out of
the ordinary) 1 2 3 4 5 6 7
I can explore catoptromancy (a divination using a
mirror) 1 2 3 4 5 6 7
I can explore palmistry (art of foretelling future
through studying your palm) 1 2 3 4 5 6 7
I can buy things related to magic or witchcraft (e.g.
wand, crystal ball) 1 2 3 4 5 6 7
I can buy talismans (objects considered to possess
magical powers) 1 2 3 4 5 6 7
Part III. Intention to Visit
Please read Scenario 1.
Scenario 1.
Suppose there is a destination where you can explore many things related to witchcraft. For example, you can
meet warlocks (male witches who are often considered to be evil) or witches in person; watch them practice
dactyliomancy (a method of divination using rings), catoptromancy (a divination using a mirror), and palmistry
(art of foretelling future through studying your palm); buy things related to witchcraft (e.g. crystal ball), and
talismans (objects considered to possess magical powers).
Money, time, cost and other constraints of making a visit to the destination are not taken into consideration.
Page 119
109
Please indicate your level of agreement with the following statements by circling one of the numbers that best
describes your intention to visit the destination in scenario 1. (1=Strongly Disagree; 2=Somewhat Disagree;
3=Disagree; 4=Neutral; 5= Agree; 6=Somewhat Agree; 7=Strongly Agree)
Statement Strongly
Disagree
Strongly
Agree
It is very likely for me to visit such a destination
within the next three years. 1 2 3 4 5 6 7
I intend to visit such a destination within the next
three years. 1 2 3 4 5 6 7
I want to visit such a destination within the next
three years. 1 2 3 4 5 6 7
Please indicate your probability and willingness to visit the destination in scenario 1 by circling one of the
numbers in the scale. (1=Extremely Low; 2= Very Low; 3=Low; 4= Undecided; 5=High; 6=Very High;
7=Extremely High)
Probability and Willingness to Visit Extremely
Low
Extremely
High
The probability that I would consider visiting such a destination is:
1 2 3 4 5 6 7
My willingness to visit such a destination is: 1 2 3 4 5 6 7
Please read Scenario 2.
Scenario 2.
Suppose there is a destination where you can listen to ghost stories surrounding the destination. The destination
is said to be haunted and believed to have ghosts. Things that happen there are beyond scientific explanation.
Money, time, cost and other constraints of making a visit to the destination are not taken into consideration.
Please consider the following statements.
Please indicate your level of agreement with the following statements by circling one of the numbers that best
describes your intention to visit the destination in scenario 2. (1=Strongly Disagree; 2=Somewhat Disagree;
3=Disagree; 4=Neutral; 5= Agree; 6=Somewhat Agree; 7=Strongly Agree)
Statement Strongly
Disagree
Strongly
Agree
It is very likely for me to visit such a destination
within the next three years. 1 2 3 4 5 6 7
I intend to visit such a destination within the next
three years. 1 2 3 4 5 6 7
I want to visit such a destination within the next
three years. 1 2 3 4 5 6 7
Please indicate your probability and willingness to visit the destination in scenario 2 by circling one of the
numbers in the scale. (1=Extremely Low; 2= Very Low; 3=Low; 4= Undecided; 5=High; 6=Very High;
7=Extremely High)
Probability and Willingness to Visit Extremely
Low
Extremely
High
The probability that I would consider visiting such a destination is:
1 2 3 4 5 6 7
My willingness to visit such a destination is: 1 2 3 4 5 6 7
Please read Scenario 3.
Scenario 3.
Suppose there is a destination, the theme of which is to bring good luck to visitors. As a visitor, you can
Page 120
110
perform little rituals or buy charms to bring good luck. There are plants considered to be propitious (favorably
inclined) in the destination. You can make wishes following propitious signs.
Money, time, cost and other constraints of making a visit to the destination are not taken into consideration.
Please consider the following statements.
Please indicate your level of agreement with the following statements by circling one of the numbers that best
describes your intention to visit the destination in scenario 3. (1=Strongly Disagree; 2=Somewhat Disagree;
3=Disagree; 4=Neutral; 5= Agree; 6=Somewhat Agree; 7=Strongly Agree)
Statement Strongly
Disagree
Strongly
Agree
It is very likely for me to visit such a destination
within the next three years. 1 2 3 4 5 6 7
I intend to visit such a destination within the next
three years. 1 2 3 4 5 6 7
I want to visit such a destination within the next
three years. 1 2 3 4 5 6 7
Please indicate your probability and willingness to visit the destination in scenario 3 by circling one of the
numbers in the scale. (1=Extremely Low; 2= Very Low; 3=Low; 4= Undecided; 5=High; 6=Very High;
7=Extremely High)
Probability and Willingness to Visit Extremely
Low
Extremely
High
The probability that I would consider visiting such a destination is:
1 2 3 4 5 6 7
My willingness to visit such a destination is: 1 2 3 4 5 6 7
Part IV. Demographics and Travel Experience
1. What’s your gender? □ Male □ Female
2. What’s your age? _________
3. What’s your major and college?
Your Major: ____________________________________________________
Your college:____________________________________________________
4. Have you ever been to a destination, the major attractiveness is superstition-based, in the past 12 months?
□ Yes □ No □ I’m uncertain
If yes, please specify. ________________________________________________________________________
If uncertain, please explain. ___________________________________________________________________
Thank you very much for completing the survey!
Page 121
111
Appendix 4: Formal Questionnaire
The Effects of Superstition as Destination Attractiveness on Behavioral Intention
Dear respondent,
You are invited to complete a survey which is an essential part of a thesis research that will lead to a master’s degree.
The survey is anonymous and confidential. Thank you for your time. Your contribution to the study is highly
appreciated.
Carol Zhang ([email protected] )
Master Candidate of the Department of Hospitality and Tourism Management
Virginia Tech
~~~~~~~~~~~~~~~~~~~~~~~~~~~~~~~~~~~~~~~~~~~~~~~~~~~~~~~~~~~~~~~~~~~~~~~~~~~~~~~~~~~~~~
Part I. Please circle a number for each item to indicate how much you agree or disagree with that item. There is no
right or wrong answer. This is a sample of your own beliefs and attitudes. Thank you. (1=Strongly Disagree;
2=Somewhat Disagree; 3=Disagree; 4=Neutral; 5=Agree; 6=Somewhat Agree; 7=Strongly Agree)
Statement Strongly
Disagree
Strongly
Agree
Some individuals are able to levitate (lift) objects
through mental forces. 1 2 3 4 5 6 7
Black magic really exists. 1 2 3 4 5 6 7
Black cats can bring bad luck. 1 2 3 4 5 6 7
Your mind or soul can leave your body and travel
(astral projection). 1 2 3 4 5 6 7
The abominable snowman of Tibet (i.e., the Big
Foot) exists. 1 2 3 4 5 6 7
Astrology is a way to accurately predict the future. 1 2 3 4 5 6 7
Psychokinesis, the movement of objects through
psychic powers, does exist. 1 2 3 4 5 6 7
Witches do exist. 1 2 3 4 5 6 7
If you break a mirror, you will have bad luck. 1 2 3 4 5 6 7
During altered states, such as sleep or trances, the
spirit can leave the body. 1 2 3 4 5 6 7
The Loch Ness monster of Scotland exists. 1 2 3 4 5 6 7
The horoscope accurately tells a person’s future. 1 2 3 4 5 6 7
A person’s thoughts can influence the movement
of a physical object. 1 2 3 4 5 6 7
Through the use of formulas and incantations, it is
possible to cast spells on persons. 1 2 3 4 5 6 7
The number “13” is unlucky. 1 2 3 4 5 6 7
Reincarnation does occur. 1 2 3 4 5 6 7
There is life on other planets. 1 2 3 4 5 6 7
Some psychics can accurately predict the future. 1 2 3 4 5 6 7
Mind reading is not possible. 1 2 3 4 5 6 7
There are actual cases of witchcraft. 1 2 3 4 5 6 7
It is possible to communicate with the dead. 1 2 3 4 5 6 7
Some people have an unexplained ability to predict
the future. 1 2 3 4 5 6 7
Page 122
112
Part II. Please indicate your level of agreement with the following statements by circling one of the numbers that
best describes your belief. (1=Strongly Disagree; 2=Somewhat Disagree; 3=Disagree; 4=Neutral; 5=Agree;
6=Somewhat Agree; 7=Strongly Agree)
Statement Strongly
Disagree
Strongly
Agree I consider the destination attractive if
I can explore dactyliomancy (a method of
divination using rings). 1 2 3 4 5 6 7
There are ghost stories surrounding the destination. 1 2 3 4 5 6 7
I can perform little rituals to bring good luck. 1 2 3 4 5 6 7
I can explore witchcraft. 1 2 3 4 5 6 7
The destination is said to have phantoms (a
physical manifestation of the soul of a person who
is dead).
1 2 3 4 5 6 7
I can buy charms (objects considered to be able to
bring good luck). 1 2 3 4 5 6 7
I can meet warlocks (male witches who are often
considered to be evil). 1 2 3 4 5 6 7
The destination is said to be haunted. 1 2 3 4 5 6 7
I can make wishes following propitious signs (ex.
wish upon a star). 1 2 3 4 5 6 7
I can meet witches. 1 2 3 4 5 6 7
The destination is believed to have ghosts. 1 2 3 4 5 6 7
There are plants considered to be propitious
(favorably inclined). 1 2 3 4 5 6 7
I can participate in magic. 1 2 3 4 5 6 7
Things that happen are beyond scientific
explanation. 1 2 3 4 5 6 7
Mysterious things happen (e.g. something out of
the ordinary). 1 2 3 4 5 6 7
I can explore catoptromancy (a divination using a
mirror). 1 2 3 4 5 6 7
I can explore palmistry (art of foretelling future
through studying your palm). 1 2 3 4 5 6 7
I can buy things related to magic or witchcraft (e.g.
wand, crystal ball). 1 2 3 4 5 6 7
I can buy talismans (objects considered to possess
magical powers). 1 2 3 4 5 6 7
Part III. Intention to Visit
Please read Scenario 1.
Scenario 1.
Suppose there is a destination where you can explore many things related to witchcraft. For example, you can
meet warlocks (male witches who are often considered to be evil) or witches in person; watch them practice
dactyliomancy (a method of divination using rings), catoptromancy (a divination using a mirror), and palmistry
(art of foretelling future through studying your palm); buy things related to witchcraft (e.g. crystal ball), and
talismans (objects considered to possess magical powers).
Money, time, cost and other constraints of making a visit to the destination are not taken into consideration.
Please indicate your level of agreement with the following statements by circling one of the numbers that best
describes your intention to visit the destination in scenario 1. (1=Strongly Disagree; 2=Somewhat Disagree;
3=Disagree; 4=Neutral; 5= Agree; 6=Somewhat Agree; 7=Strongly Agree)
Statement Strongly Strongly
Page 123
113
Disagree Agree
It is very likely for me to visit such a destination
within the next three years. 1 2 3 4 5 6 7
I intend to visit such a destination within the next
three years. 1 2 3 4 5 6 7
I want to visit such a destination within the next
three years. 1 2 3 4 5 6 7
Please indicate your probability and willingness to visit the destination in scenario 1 by circling one of the
numbers in the scale. (1=Extremely Low; 2= Very Low; 3=Low; 4= Undecided; 5=High; 6=Very High;
7=Extremely High)
Probability and Willingness to Visit Extremely
Low
Extremely
High
The possibility that I would consider visiting such a destination is:
1 2 3 4 5 6 7
My willingness to visit such a destination is: 1 2 3 4 5 6 7
Please read Scenario 2.
Scenario 2.
Suppose there is a destination where you can listen to ghost stories surrounding the destination. The destination
is said to be haunted and believed to have ghosts. Things that happen there are beyond scientific explanation.
Money, time, cost and other constraints of making a visit to the destination are not taken into consideration.
Please consider the following statements.
Please indicate your level of agreement with the following statements by circling one of the numbers that best
describes your intention to visit the destination in scenario 2. (1=Strongly Disagree; 2=Somewhat Disagree;
3=Disagree; 4=Neutral; 5= Agree; 6=Somewhat Agree; 7=Strongly Agree)
Statement Strongly
Disagree
Strongly
Agree
It is very likely for me to visit such a destination
within the next three years. 1 2 3 4 5 6 7
I intend to visit such a destination within the next
three years. 1 2 3 4 5 6 7
I want to visit such a destination within the next
three years. 1 2 3 4 5 6 7
Please indicate your probability and willingness to visit the destination in scenario 2 by circling one of the
numbers in the scale. (1=Extremely Low; 2= Very Low; 3=Low; 4= Undecided; 5=High; 6=Very High;
7=Extremely High)
Probability and Willingness to Visit Extremely
Low
Extremely
High
The possibility that I would consider visiting such a destination is:
1 2 3 4 5 6 7
My willingness to visit such a destination is: 1 2 3 4 5 6 7
Please read Scenario 3.
Scenario 3.
Suppose there is a destination, the theme of which is to bring good luck to visitors. As a visitor, you can
perform little rituals or buy charms to bring good luck. There are plants considered to be propitious (favorably
inclined) in the destination. You can make wishes following propitious signs.
Money, time, cost and other constraints of making a visit to the destination are not taken into consideration.
Please consider the following statements.
Page 124
114
Please indicate your level of agreement with the following statements by circling one of the numbers that best
describes your intention to visit the destination in scenario 3. (1=Strongly Disagree; 2=Somewhat Disagree;
3=Disagree; 4=Neutral; 5= Agree; 6=Somewhat Agree; 7=Strongly Agree)
Statement Strongly
Disagree
Strongly
Agree
It is very likely for me to visit such a destination
within the next three years. 1 2 3 4 5 6 7
I intend to visit such a destination within the next
three years. 1 2 3 4 5 6 7
I want to visit such a destination within the next
three years. 1 2 3 4 5 6 7
Please indicate your probability and willingness to visit the destination in scenario 3 by circling one of the
numbers in the scale. (1=Extremely Low; 2= Very Low; 3=Low; 4= Undecided; 5=High; 6=Very High;
7=Extremely High)
Probability and Willingness to Visit Extremely
Low
Extremely
High
The possibility that I would consider visiting such a destination is:
1 2 3 4 5 6 7
My willingness to visit such a destination is: 1 2 3 4 5 6 7
Part IV. Demographics and Travel Experience
1. What’s your gender? □ Male □ Female
2. What’s your age? _________
3. What’s your major? ____________________________________________________
4. What's your college at Virginia Tech? _______________________________________
5. Have you ever been to a destination with superstition as one of the attractiveness attributes, in the past 12 months?
□ Yes □ No □ I’m uncertain
If yes, please specify. ________________________________________________________________________
If you are uncertain, please explain. _____________________________________________________________
6. Have you ever been to a destination, the major attractiveness is superstition-based, in the past 12 months?
□ Yes □ No □ I’m uncertain
If yes, please specify. ________________________________________________________________________
If you are uncertain, please explain. _____________________________________________________________
That’s the end of the survey.
Thank you very much for completing the survey!
Page 125
115
Appendix 5: IRB Approval Letter