University of Central Florida University of Central Florida STARS STARS Honors Undergraduate Theses UCF Theses and Dissertations 2019 The Effects of Zinc Nanofertilizers on Tomato Plants The Effects of Zinc Nanofertilizers on Tomato Plants Ketsira Pierre University of Central Florida Part of the Agricultural Science Commons Find similar works at: https://stars.library.ucf.edu/honorstheses University of Central Florida Libraries http://library.ucf.edu This Open Access is brought to you for free and open access by the UCF Theses and Dissertations at STARS. It has been accepted for inclusion in Honors Undergraduate Theses by an authorized administrator of STARS. For more information, please contact [email protected]. Recommended Citation Recommended Citation Pierre, Ketsira, "The Effects of Zinc Nanofertilizers on Tomato Plants" (2019). Honors Undergraduate Theses. 566. https://stars.library.ucf.edu/honorstheses/566
Transcript
University of Central Florida University of Central Florida
STARS STARS
Honors Undergraduate Theses UCF Theses and Dissertations
2019
The Effects of Zinc Nanofertilizers on Tomato Plants The Effects of Zinc Nanofertilizers on Tomato Plants
Ketsira Pierre University of Central Florida
Part of the Agricultural Science Commons
Find similar works at: https://stars.library.ucf.edu/honorstheses
University of Central Florida Libraries http://library.ucf.edu
This Open Access is brought to you for free and open access by the UCF Theses and Dissertations at STARS. It has
been accepted for inclusion in Honors Undergraduate Theses by an authorized administrator of STARS. For more
Plant pH is significant for all plant nutrients, especially zinc. Deviation in pH range 5.5 to
7.0, can decrease Zn2+, which is the zinc concentration readily available to plants7. As pH
increases, zinc available will decrease. Zinc concentration decreases from 10-4 M to 10-10 M
when pH increases from 5 to 8. The availability of Zn is reduced more in alkaline soils than in
acidic soils due to the lower solubility of soil Zn. The higher carbonate contents in alkaline soils
absorb zinc and hold it in a form that is not bioavailable. Liming acidic soils reduce Zn uptake
causing Zn deficiency (Hafeez et al., 2013). Zinc available declines in flooding and submerged
9
soil conditions because of the changes in pH and insoluble zinc compounds8. Deficiency is also
affected by climate, weather, high HCO3 - presence in soil, highly leached soils, sandy soils,
calcareous granite, and acidic soils.
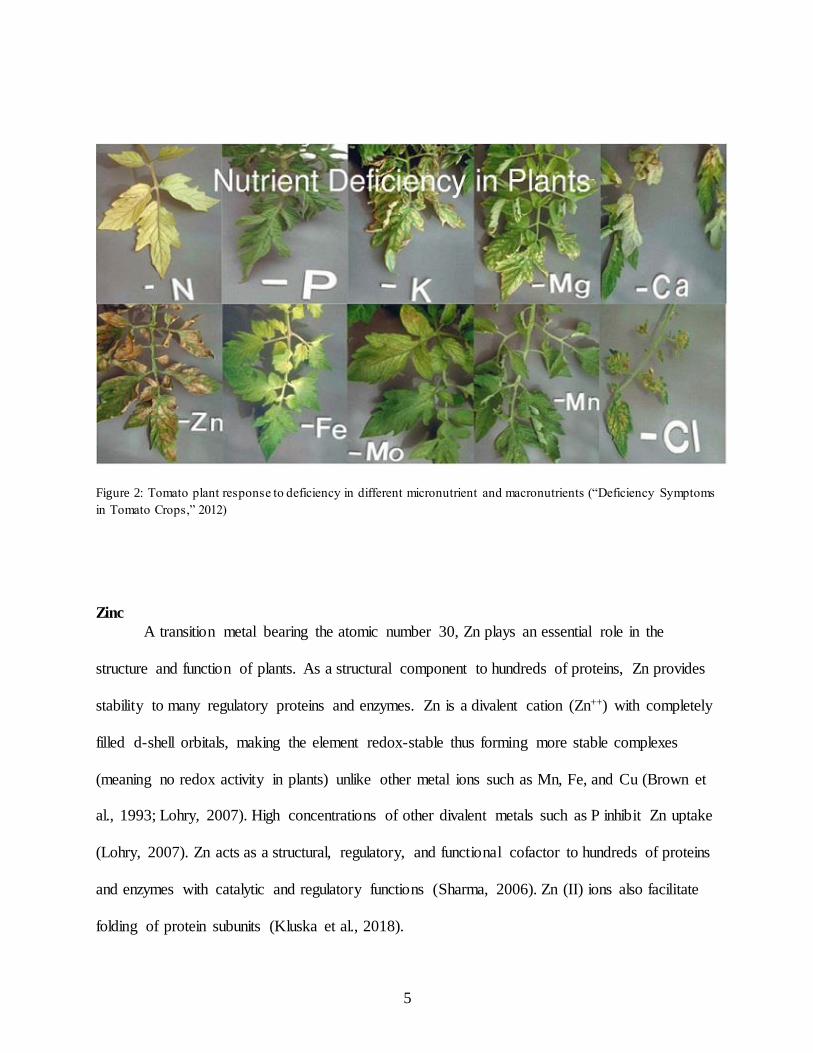
According to Sharma (2006), Zinc deficiency symptoms appear on the subterminal leaves
after early stages of healthy growth. Development of bronze or reddish-brown tints or blotches
associated with fading lamina and interveinal chlorosis, reduced leaf size, and condensation of
shoot growth are common symptoms of zinc deficiency (Sharma, 2006). Necrosis at root apex
and inward curling of leaf lamina are also seen (Tripathi et al., 2015). Plants are seen to have
stunted growth noticeable 2 to 3 weeks after transplantation and may die in severe cases.
Symptoms initiate in tips of young leaves as fading lamina and appearance of light brown
necrotic lesions that spread and connect as deficiency continues. Leaves of tomato plants also
show inward curling of lamina and epinasty in response to zinc deficiency4. Although zinc
deficiency is harmful to plants, excess Zn is toxic. Therefore, an adequate supply of Zn is
essential for proper growth and development.
Zinc Deficiency in Human Health
Zinc deficiency affects not only plants but human health as well. Developing countries
get the majority of nutrients from plant-based diets. Reliance on plant-based diets may be due to
the economic, traditional, religious, and or cultural reasons (Solomons, 2000). Therefore, plants
low in nutrients will transfer to people. Due to this phenomenon, high prevalence of deficiency
in vitamin A, Fe, Zn, riboflavin, and vitamin B12 are often seen. Many of these nutrients are
available in meat.
10
Zn is required for catalyst activity of enzymes, plays a role in protein synthesis, wound
healing, immune function, DNA synthesis, and cell division. Zinc is also required for proper
taste and smell. It is also necessary for proper growth and development during childhood,
adolescence, and pregnancy (“Zinc: Fact Sheet for Health Professionals,” n.d.).
According to the National Institute of Health Office of Dietary Supplements,
recommended dietary supplements, recommended dietary allowance for Zn are: 2-3mg in
infants, 5mg in children, 8-11mg in adolescents and adults, and 11-13mg for pregnant and
lactating women. Insufficient intake or absorption of Zn will lead to Zn deficiency.
Consequences of Zn deficiency include growth retardation (more severe in children,
hypogonadism in males, changes in neuro-sensory (abnormal taste sensation) and delayed wound
healing (Prasad, 1998). Hair loss and alteration in hair color from black to a reddish-brown have
also been observed (Maret and Sandstead, 2006). Other significant adverse clinical effect of Zn
deficiency is impairment of cognitive function (memory loss), increased oxidative stress, and
upregulation of inflammatory cytokines (Prasad, 2017). Lymphocyte proliferation is also
affected due to Zn involvement in DNA synthesis and cell division. Tymulin, a hormone
involved in T-lymphocyte maturation is Zn-dependent, therefore adversely affected by low Zn
presence (Prasad, 1995). Effects on the nervous system included impaired brain function, never
decreased conduction, ataxia, disorientation, and impaired neuropsychological performance
(Maret and Sandstead, 2006).
Severe dermatitis manifests later as Zn deficiency increases. Mild deficiency in pregnant
women results in increased maternal morbidity, abnormal taste sensation, prolonged gestation,
inefficient labor, and atonic bleeding (Prasad, 1998). Further insufficient intake can lead to
11
stunted brain development in fetus and infertility in men (Hafeez, 2013). High morbidity and
death from diarrhea, pneumonia, and other infections in children can also occur from foodborne
illnesses have been reported in developing counties. Zinc deficiency is often associated with Fe
deficiency (both are inhibited by P increase) and affects cognitive and reproductive performance,
provoke pregnancy complications leading to low birth weight and defects (Akhtar et al., 2013).
Figure 3: Estimated prevalence of inadequate zinc intake across the globe (Wessells and Brown , 2012).Figure 3:
Estimated prevalence of inadequate zinc intake across the globe (Wessells and Brown, 2012).
12
Figure 4: Risk of zinc deficiency based on prevalence of childhood shunting and prevalence of inadequate zinc
intake (Wessells and Brown, 2012).
Application of Nanoparticles to Soil
Current farming practices often involve leaching, mineralization, and bioconversion,
which result in 50-70% loss of micronutrients. Smart practices from nanotechnology can lead
conventional farming to more sustainable agriculture (CChipa, 2016). Nanotechnology involves
technology at a nanoscale (1-100nm) (Nasrollahzadeh et al., 2019). It is a “field that consists of
13
creating and utilizing chemical, physical, and biological systems from single atoms and
molecules to form functional structures at a nanoscale. Nanotechnology allows a wide range of
diverse application amongst disciples like chemistry, agriculture, physics, medicine, and various
fields of engineering. Nanotechnology can improve sustainable agriculture with Nano-fertilizers
(NF) and Nano-pesticides in the form of precision farming by converting essential plant nutrients
into Nano-coated or Nano-encapsulated particles and delivering to plants. NF improve nutrient
use efficiencies through slowly releasing nutrients. Nanoparticles provide several advantages to
promoting agricultural productivity, including enhancement of seed germination and growth
against stress. Zinc-nanoparticles are widely used due to their high reactivity; they enhance Zn
availability as well as other nutrients in the soil (Aziz et al., 2019). The potential that this smart
and controlled method has can lead to more sustainable environmental solutions (CChipa, 2016).
According to Kharissova et al. (2013), due to problems associated with environmental
contamination from synthesis practices of nanomaterials, the use of ‘greener ‘environmentally
friendly methods are on the rise. The synthesis of using such materials can lower the toxicity of
resulting materials and byproducts. More environmentally friendly routes to NP and
nanomaterials involve extracts from plants and other natural products; such products include tea,
coffee, banana, pure amino acids, wine, table sugar, and glucose, have been used as capping and
reducing agents during synthesis (Kharissova et al., 2013).
Capping agents are often used to inhibit NP overgrowth and aggregation as well as
control structural NP characteristics in a precise manner (Niu and Li, 2013). In this study, to
improve ZnO solubility, urea, sodium salicylate (SAL), and n-acetyl cysteine (NAC) were used
as capping agents. Urea, SAL, and NAC all have a natural presence in plants. Urea is a known N
14
macronutrient metabolite in plants (Merigout et al., 2008). SAL is a plant hormone that induces
plant defense against abiotic stresses (War et al., 2011). NAC is a natural antioxidant. It
contributes to the beneficial effects of onion and garlic in warding off illness and cardiovascular
protection (Souza et al., 2011).
This study aims to investigate the effects of NP synthesized with a combination of
different capping agents (urea, SAL, NAC) to improve ZnO dispersibility and uptake by plants.
Due to the difficulty of monitoring NP in soil, a greenhouse experiment was developed by
growing tomato plants in different NF treatments and comparing phenotypic developments such
as height, number of leaves, fruit, and flowers. Weekly measurements were taken and averaged
to analyze the comparable benefits of NF treatments to controls.
15
CHAPTER 2: MATERIALS AND METHODS
Materials
All reagents and chemicals were purchased and provided by the Santra Research Group
at the Nanoscience Technology Center, University of Central Florida. The Santra Research
Group also prepared and provided the Zn, NPs, urea granules and capping agents used for this
study.
Soil Preparation and Digestion for Characterization
For the atomic absorption spectroscopy machine to perform elemental analysis of a
sample, the sample must be in a form the instrument can process which is usually liquid. For soil
preparation, the soil was first was dried at 60 C for 48 hours and sieved through a 2mm mesh
strainer. Then 1g of the sieved soil was applied to each centrifuge tube (3 tubes were used).
For sample digestion, a water bath was set between 95-98C in a fume hood. In the fume
hood, 5 mL of DI water and 15 mL of concentrated HNO3 were added to each tube via pipette.
The slurry was then mix and added to the water bath and covered. The samples were heated for a
1 hour then refluxed without boiling. If brown fumes generated, the heating steps were repeated
until there were no more brown fumes (about 4 hours). Then 5 mL of HNO3 was added to
samples and put back into the water bath for 30 more minutes to confirm soil was entirely
digested. Samples were allowed to cool down to room temperature. Then 5 mL of H2O2 was
added to each tube and put back into the bath for another hour. Samples were then removed from
the bath, and 5 mL of HCl was added to each sample. Samples were then filtered and diluted for
16
AAS characterization (Robinson et al., 2005 as cited by JoVe Science Education Database,
2019).
ZnO Nanoparticles and Soil Characterization for Zn Content
Atomic absorption spectroscopy (AAS) is an elemental analysis used to determine ppm
levels of trace metals. For this experiment, AAS was used to confirm zinc presence and
determine average percent of Zn content for each treatment. A___lamp was used to test for Zn
concentration. Three samples of each treatment were prepared by Santra Research Group. The
samples were tested against Zn standards at 0.2, 0.4, 0.6, 0.8, 1, 1.2, 1.4, 1.6, 1.8, 2, and 2.5 ppm.
Samples with high concentrations were diluted. The absorbance and calibration curve equation
were used to determine the concentration of Zn for each sample. The concentration of Zn was
multiplied by dilution to find the concentrations in ppm of Zn. Percent Zn was calculated using
concentrations in ppm of Zn over the total weight of NP per 1mL. To find the average percent Zn
content, percent Zn concentration of all three samples per treatment was added and divided by 3.
The average percent of Zn content was used to prepare 3ppm NP solutions for coating urea and
seed germination experiment.
Urea Coating with ZnO Nanoparticles
Nanoparticles were dispersed in a saturated urea solution in absolute ethanol. Then 3%
(w/w) of metallic Zn was incorporated to 2 mm urea granules. Mineral oil and PVP were used to
improve the coating process. Food coloring was added to help differentiate the different
17
treatments. Samples were rotated until the urea granules were completely coated. Once coated,
samples were set to dry before being added to the soil for the greenhouse experiment.
Greenhouse Experiment
The effects of the different combinations of capping agent on Zn NP was evaluated using
tomato plants, BHN 602 VFFF Hybrid, purchased from Amazon and organic potting soil,
Nature’s Care Organic Potting Soil Mix, purchased from Home Depot. The organic potting soil
was analyzed for Zinc using AAS. The soil was dried to provide a constant weight when
measured. The tomato plants were grown in a temperature-regulated greenhouse. There were 27
tomato plants, 5 for each treatment (UREA only, NAC-Urea, Urea-SAL, NAC-SAL, and Bulk
ZnO), and 2 with only the commercial soil. The seeds were planted in trays about 1/8 inch deep.
The potted seeds were watered in and then germinated in an elevated plastic dome to promote
soil-moisture retention (trap moisture and keep the heat high) for about 7-10 days until seedlings.
Once the true leaf emerged, the plants then transplanted into 3-inch pots containing the 1lbs dry
soil and different treatments, coated NP with varying combinations of capping agents (fertilizer).
Of the 1lbs dried soil, 3% was the created fertilizer which contains 3% Zn. This treatment only
occurred once. Tomato cages were added to each plant to support the stems and decrease
susceptibility to rot or damage from insects. The tomato plants were observed and watered at the
same time with the same volume of water. Plant phenotype such as height, quality, number of
leaves, number of flowers, and yield was measured and recorded every week.
Seed Germination Experiment
18
Seed germination experiment was conducted to test the effects of NF treatments on seed
germination rate and root length. For this experiment, the NPs were tested in solution (3ppm
metallic Zn) . Zinc is a micronutrient, therefore, amount added is very small, with urea (nitrogen
macronutrient) coating we would not be able to see the effects of the treatment. 35 mL of each
test solution was prepared (DI water, NAC-Urea, NAC-SAL, Urea-SAL, Bulk ZnO, and Zn
(NO3)2 6H2O) into centrifuge tubes. Filter paper was labeled Petri dishes with 5 mL of each test
solution. Ferry-Morse beefsteak tomato seeds purchased from Home Depot were sterilized with
10% NaClO (or 10% H2O2) for 10 minutes. Seeds were then washed with DI water three times to
wash off sterilizing solution. Sterilized seeds were soaking in test solutions for 2 hours (20 mL
each). Then seeds were drained and transferred onto filter paper. Each Petri dish contained ten
seeds 1 cm apart. Six replicates total for each test solution: 3 each for the 7th and 10th day for
germination and root length measurements. Petri dishes were wrapped in aluminum foil and left
in a growth chamber (no light, 25C, 80% humidity). Germination was checked on the 7th and
10th day (Lin et al., 2007).
19
CHAPTER 3: RESULTS AND DISCUSSION
Atomic Absorption Spectroscopy
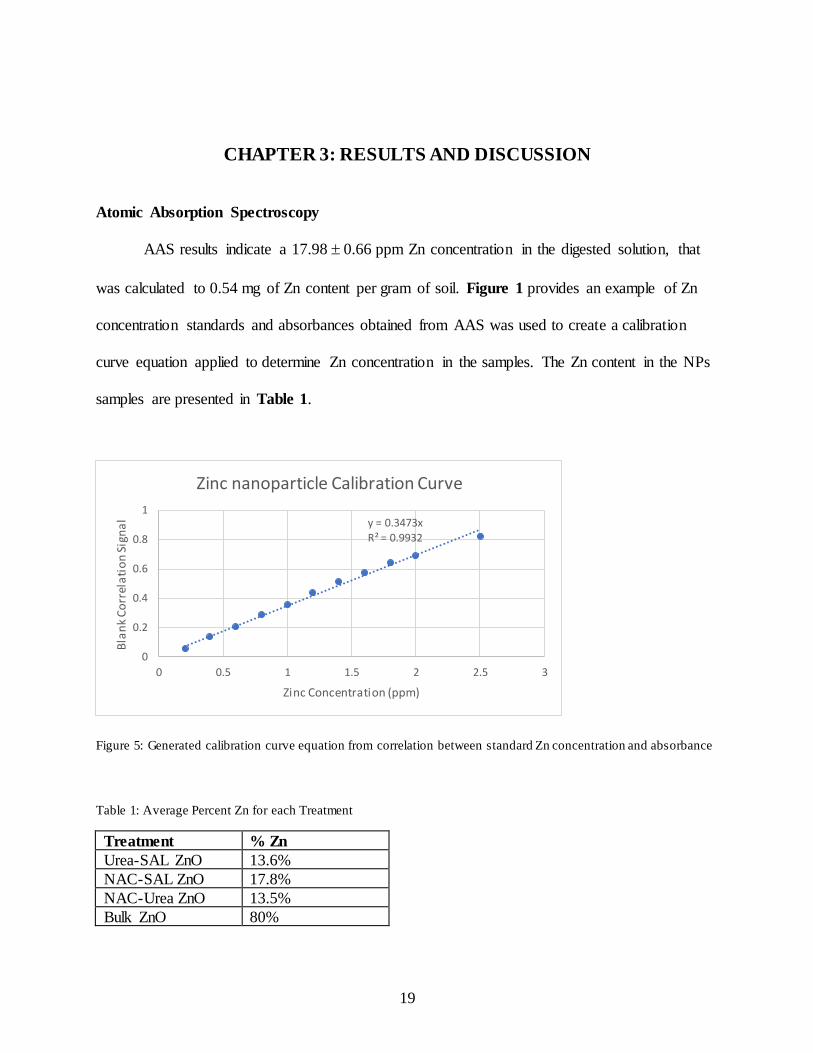
AAS results indicate a 17.98 0.66 ppm Zn concentration in the digested solution, that
was calculated to 0.54 mg of Zn content per gram of soil. Figure 1 provides an example of Zn
concentration standards and absorbances obtained from AAS was used to create a calibration
curve equation applied to determine Zn concentration in the samples. The Zn content in the NPs
samples are presented in Table 1.
Figure 5: Generated calibration curve equation from correlation between standard Zn concentration and absorbance
Table 1: Average Percent Zn for each Treatment
Treatment % Zn
Urea-SAL ZnO 13.6%
NAC-SAL ZnO 17.8%
NAC-Urea ZnO 13.5%
Bulk ZnO 80%
y = 0.3473xR² = 0.9932
0
0.2
0.4
0.6
0.8
1
0 0.5 1 1.5 2 2.5 3
Bla
nk
Co
rrel
ati
on
Sig
na
l
Zinc Concentration (ppm)
Zinc nanoparticle Calibration Curve
20
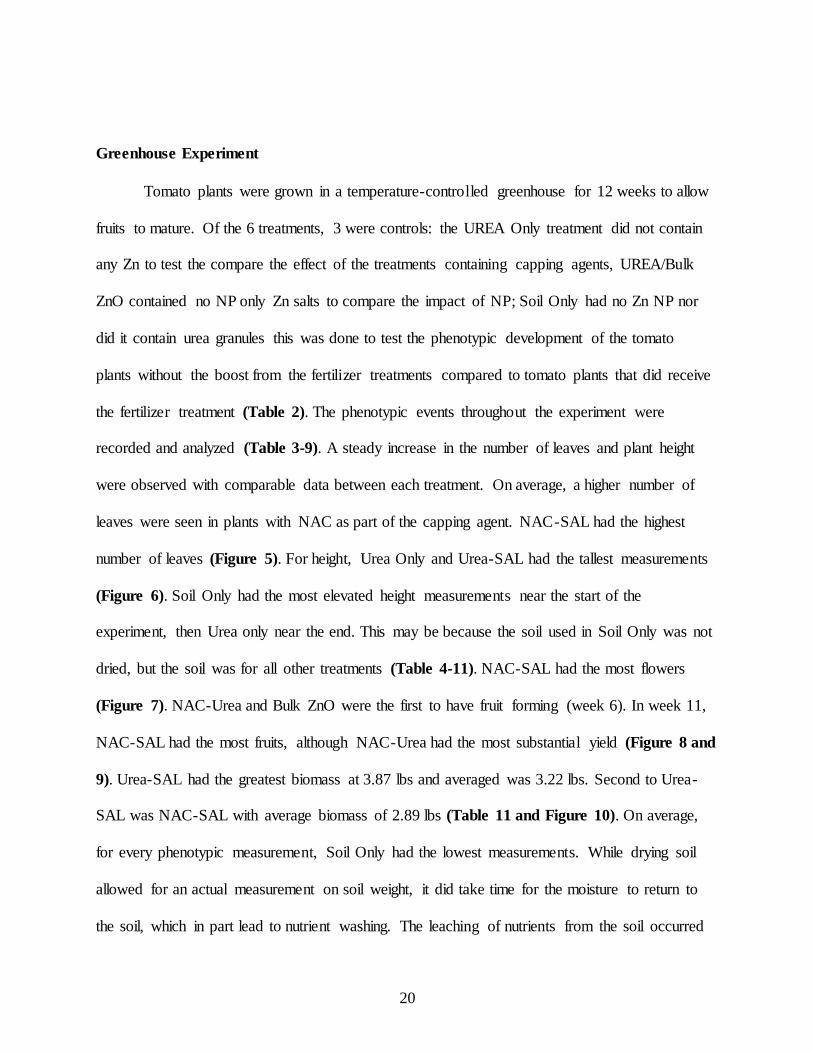
Greenhouse Experiment
Tomato plants were grown in a temperature-controlled greenhouse for 12 weeks to allow
fruits to mature. Of the 6 treatments, 3 were controls: the UREA Only treatment did not contain
any Zn to test the compare the effect of the treatments containing capping agents, UREA/Bulk
ZnO contained no NP only Zn salts to compare the impact of NP; Soil Only had no Zn NP nor
did it contain urea granules this was done to test the phenotypic development of the tomato
plants without the boost from the fertilizer treatments compared to tomato plants that did receive
the fertilizer treatment (Table 2). The phenotypic events throughout the experiment were
recorded and analyzed (Table 3-9). A steady increase in the number of leaves and plant height
were observed with comparable data between each treatment. On average, a higher number of
leaves were seen in plants with NAC as part of the capping agent. NAC-SAL had the highest
number of leaves (Figure 5). For height, Urea Only and Urea-SAL had the tallest measurements
(Figure 6). Soil Only had the most elevated height measurements near the start of the
experiment, then Urea only near the end. This may be because the soil used in Soil Only was not
dried, but the soil was for all other treatments (Table 4-11). NAC-SAL had the most flowers
(Figure 7). NAC-Urea and Bulk ZnO were the first to have fruit forming (week 6). In week 11,
NAC-SAL had the most fruits, although NAC-Urea had the most substantial yield (Figure 8 and
9). Urea-SAL had the greatest biomass at 3.87 lbs and averaged was 3.22 lbs. Second to Urea-
SAL was NAC-SAL with average biomass of 2.89 lbs (Table 11 and Figure 10). On average,
for every phenotypic measurement, Soil Only had the lowest measurements. While drying soil
allowed for an actual measurement on soil weight, it did take time for the moisture to return to
the soil, which in part lead to nutrient washing. The leaching of nutrients from the soil occurred
21
in a combination of dried soil, and the high volume of water needed for successful transplanting,
therefore, leaves took on a yellow-green color (a sign of nutrient deficiency). Fortunately, color
and plant condition improved as moisture returned (Table 4-11). Results suggest NAC-SAL has
the greatest potential overall in showed higher number of leaves and number of fruits set
compared to controls.
Table 2: Summary of Tomato Plant Distribution for Nano-Zinc Treatments
Treatment Number of
Plants
UREA Only 5
UREA/Nano-ZnO-NAC-Urea
5
UREA/Nano-ZnO-
Urea- SAL 5
UREA/Nano-ZnO-NAC-SAL
5
UREA/Bulk ZnO 5
Soil Only 2
22
Figure 6: Average number of tomato plant leaves over time per treatment
0
5
10
15
20
25
WEEK 1 WEEK 2 WEEK 3 WEEK 4 WEEK 5 WEEK 6 WEEK 9
Nu
mb
er
of l
eav
es
Number of leaves on Tomato Plants Each Week
NAC-UREA NAC-SAL BULK-ZnO UREA-SAL UREA Only SOIL Only
23
Figure 7: Average height of tomato plants over time per treatment
Figure 8: Average number of flowers per treatment
0
20
40
60
80
100
120
WEEK 1 WEEK 2 WEEK 3 WEEK 4 WEEK 5 WEEK 6 WEEK 9
Hei
ght
(cm
)
Plant Height of Tomato Plants Each Week
NAC-UREA NAC-SAL BULK-ZnO UREA-SAL UREA Only SOIL Only
0
2
4
6
8
10
12
WEEK 5 WEEK 6 WEEK 9
Nu
mb
er o
f new
flo
wer
s
Number of new flowers on Tomato Plants
NAC-UREA NAC-SAL BULK-ZnO UREA-SAL UREA Only SOIL Only
24
Figure 9: Average number of fruits per plant treatment
Figure 10: Average weight of fruits per treatment
0
1
2
3
4
5
6
7
NAC-UREA NAC-SAL BULK-ZnO UREA-SAL UREA Only SOIL Only
Nu
mb
er o
f Fru
its
Treatments
Number of fruits on Tomato Plants (week 11)
0
0.1
0.2
0.3
0.4
0.5
0.6
0.7
NAC-UREA NAC-SAL BULK-ZnO UREA-SAL UREA Only SOIL Only
Fru
it w
eigh
t (l
bs)
Treatments
Yield of Tomato Plants (week 12)
25
Figure 11: Average biomass per treatment
Seed Germination Experiment
The benefits of NF with dual capping agents were further tested with tomato seed
germination and root length (Lin et al., 2007). Figure 11 shows the germination percentage of
each treatment after 7 and 10 days of incubation in zero light, 26C, and 80% humidity in the
growth chamber. Results showed all NF had a germination rate above 85%. On the 7th day,
NAC-Urea had the highest germination success at 100% and DI water the lowest at 87%. For the
10th day, NAC-SAL and Zn (NO3)2 6H2O had 100% germination success. On the 10th day, DI
water Petri dishes were dried. Nanofertilzer solutions have a higher boiling point than DI water;
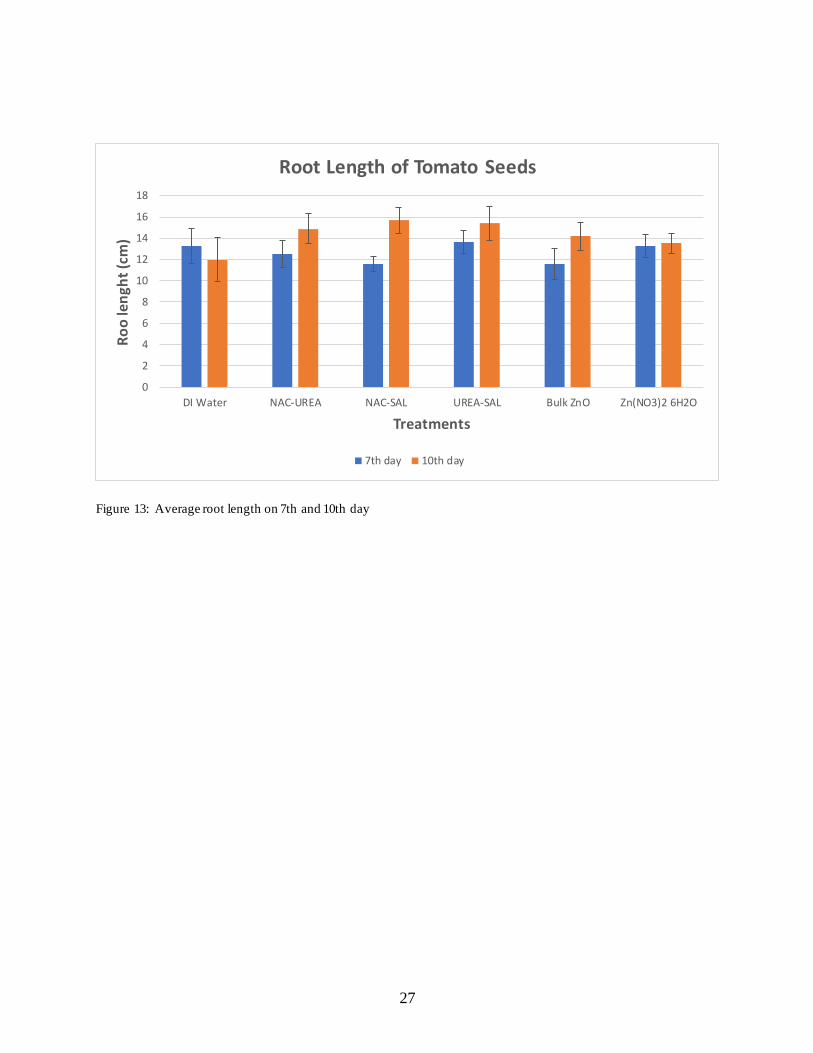
therefore, DI water Petri dishes dried quicker. Figure 12 shows the root length in each treatment
after 7 and 10 days. Results show root length was longest in Urea-SAL at 13.62 cm on the 7th
day and NAC-SAL at 15.71 cm on the 10th day. Urea- SAL had comparable results with DI
0
0.5
1
1.5
2
2.5
3
3.5
4
4.5
NAC-UREA NAC-SAL BULK-ZnO UREA-SAL UREA Only SOIL Only
Bio
mas
s (l
bs)
Treatments
BIOMASS of Tomato Plants (week 12)
26
water and Zn (NO3)2 6H2O for 7th-day root length. On average, root length and percent
germinated was more significant on the 10th day. These results suggest NAC-SAL NF has more
significant potential for seed germination and root elongation.
Figure 12: Average germination on the 7th and 10th day
0%
50%
100%
150%
200%
250%
300%
DI Water NAC-UREA NAC-SAL UREA-SAL Bulk ZnO Zn(NO3)2 6H2O
Ger
min
atio
n S
ucc
ess
Treatments
Germination Rate of Tomato Plants
7th day 10th day
27
Figure 13: Average root length on 7th and 10th day
0
2
4
6
8
10
12
14
16
18
DI Water NAC-UREA NAC-SAL UREA-SAL Bulk ZnO Zn(NO3)2 6H2O
Ro
o le
ngh
t (c
m)
Treatments
Root Length of Tomato Seeds
7th day 10th day
28
CHAPTER 4: CONCLUSIONS
Zinc deficiency is characterized by bronze or reddish-brown tints or blotches associated with
fading lamina and interveinal chlorosis, reduced leaf size, and condensation of shoot growth are
common symptoms of zinc deficiency (Sharma, 2006). Zinc deficiency can manifest in people
dependent on such crops. Tomato plants treated with urea coated with 3% Zn (w/w) using NAC-
SAL ZnO showed a higher number of leaves and number of fruits set compared to controls. It is
concluded ZnO NP with dual capping agents had a successful impact and can be used as a source
of Zn micronutrient. For the seed germination experiment, NAC-SAL NF has more significant
potential for seed germination and root elongation.
Although favorable results were collected depicting the benefits of capped NPs, increasing
nutrient deficiency was seen in later weeks; Zn was replaced, but because other essential
nutrients were not; deficiency in micronutrients and macronutrients lead to a decline in plants
resulting in the experiment being shortened. Increasing the number of plants in each treatment
will also provide more accurate results — further studies adding NP a week after transplant is
suggested. Bigger plant pots and NPs on top of the soil rather than mixed in may reduce nutrient
deficiency. For the seed germination experiment, adding more solution to Petri dishes is
recommended to avoid them to dry at long periods of incubation.
29
APPENDIX: Weekly Data Collection and Observations During Greenhouse Experiment
30
Table 3: Key of leaf condition over 12 weeks
Score Leaf Condition
1 Healthy
2 Slight green discoloration
3 lighter green
4 Yellow-green Table 4: Week 1- Phenotype data collection and observation
Week 1
Treatment Pant Condition
Leaf Number
Height
NAC-UREA 1 4 6 7 cm
NAC-UREA 2 4 6 10 com NAC-UREA 3 1 6 10.05 cm
NAC-UREA 4 2 6 8 cm NAC-UREA 5 2 5 6.5 cm
NAC-SAL 1 2 6 7 cm
NAC-SAL 2 2 6 9.5 cm NAC-SAL 3 2 6 12 cm
NAC-SAL 4 1 6 9 cm NAC-SAL 5 2 5 13 cm
BULK-ZnO 1 4 6 7.5 cm
BULK-ZnO 2 2 6 10 cm BULK-ZnO 3 4 6 8 cm
BULK-ZnO 4 4 6 6 cm
BULK-ZnO 5 1 6 11 cm
UREA-SAL 1 2 6 10 cm UREA-SAL 2 2 6 9.5 cm
UREA-SAL 3 2 6 9.5 cm UREA-SAL 4 2 6 8 cm
UREA-SAL 5 4 5 4 cm
UREA ONLY 1 3 5 3.5 cm UREA ONLY 2 4 5 9.5 cm
UREA ONLY 3 4 5 3 cm UREA ONLY 4 4 5 9 cm
UREA ONLY 5 4 5 3.5 cm
SOIL ONLY 1 1 5 8 cm SOIL ONLY 2 1 6 9 cm
31
Table 5: Week 2 - Phenotype data collection and observation
Week 2
Treatment Pant
Condition
Leaf
Number
Height
NAC-UREA 1 2 9 20 cm
NAC-UREA 2 2 9 27 cm NAC-UREA 3 2 9 24 cm
NAC-UREA 4 2 8 26 cm NAC-UREA 5 2 8 25 cm
NAC-SAL 1 4 8 22 cm
NAC-SAL 2 4 8 21 cm NAC-SAL 3 4 8 25.5 cm
NAC-SAL 4 4 7 16 cm NAC-SAL 5 4 9 26.5 cm
BULK-ZnO 1 4 8 18 cm
BULK-ZnO 2 4 8 22 cm
BULK-ZnO 3 4 8 15 cm BULK-ZnO 4 4 8 17 cm
BULK-ZnO 5 4 8 31 cm
UREA-SAL 1 2 9 25 cm UREA-SAL 2 2 9 27 cm
UREA-SAL 3 2 9 26 cm UREA-SAL 4 2 9 24 cm
UREA-SAL 5 4 7 12 cm
UREA ONLY 1 4 8 19 cm UREA ONLY 2 4 8 20 cm
UREA ONLY 3 4 8 19 cm UREA ONLY 4 4 8 19 cm
UREA ONLY 5 4 8 18 cm
SOIL ONLY 1 1 7 26 cm
SOIL ONLY 2 1 8 27 cm
Observations: The changes in leaf color could be due to the
dry soil (took some time for moisture to return to soil after
drying) and or nutrient washing after transplanting.
32
Table 6: Week 3 - Phenotype data collection and observation
Week 3
Treatment Pant
Condition
Leaf
Number
Height
NAC-UREA 1 2 11 40 cm
NAC-UREA 2 2 11 50 cm NAC-UREA 3 2 11 35.5 cm
NAC-UREA 4 2 10 46 cm NAC-UREA 5 2 9 33 cm
NAC-SAL 1 4 11 38 cm
NAC-SAL 2 4 10 47 cm NAC-SAL 3 4 10 44 cm
NAC-SAL 4 4 9 44.5 cm NAC-SAL 5 4 10 46 cm
BULK-ZnO 1 4 11 42 cm BULK-ZnO 2 4 11 42 cm
BULK-ZnO 3 4 10 36 cm BULK-ZnO 4 4 10 44 cm
BULK-ZnO 5 4 11 45.5 cm
UREA-SAL 1 2 10 44 cm UREA-SAL 2 2 10 42 cm
UREA-SAL 3 2 9 46 cm UREA-SAL 4 2 10 44 cm
UREA-SAL 5 4 9 40 cm
UREA ONLY 1 4 10 44 cm UREA ONLY 2 4 9 41 cm
UREA ONLY 3 4 10 42.5 cm UREA ONLY 4 4 10 40 cm
UREA ONLY 5 4 10 37 cm
SOIL ONLY 1 1 9 51 cm
SOIL ONLY 2 1 13 47 cm
33
Table 7: Week 4 - Phenotype data collection and observation
Week 4
Treatment Pant
Condition
Leaf
Number
Height Flower
Number
NAC-UREA 1 2 13 49 cm 2
NAC-UREA 2 2 12 57 cm 0 NAC-UREA 3 1 12 42 cm 1
NAC-UREA 4 1 12 60 cm 1 NAC-UREA 5 1 11 51 cm 0
NAC-SAL 1 2 12 45.5 cm 1
NAC-SAL 2 3 12 50.5 cm 2 NAC-SAL 3 1 12 57 cm 1
NAC-SAL 4 1 13 54.5 cm 2 NAC-SAL 5 3 13 54.5 cm 2
BULK-ZnO 1 2 13 56 cm 0
BULK-ZnO 2 2 14 61 cm 0
BULK-ZnO 3 3 13 64 cm 0 BULK-ZnO 4 2 13 59 cm 1
BULK-ZnO 5 1 12 48 cm 0
UREA-SAL 1 4 12 61 cm 0 UREA-SAL 2 1 13 53 cm 2
UREA-SAL 3 2 12 55.5 cm 2 UREA-SAL 4 2 12 61 cm 0
UREA-SAL 5 3 13 69.5 cm 0
UREA ONLY 1 1 13 60.5 cm 0 UREA ONLY 2 1 12 60 cm 0
UREA ONLY 3 4 13 65.5 cm 0 UREA ONLY 4 1 13 60 cm 0
UREA ONLY 5 3 13 67 cm 0
SOIL ONLY 1
4, new growth 1 9 61 cm 0
SOIL ONLY 2
4, new growth 1 13 53 cm 0
Observation: Stems of soil only plants are not as thick as stems of the
others.
34
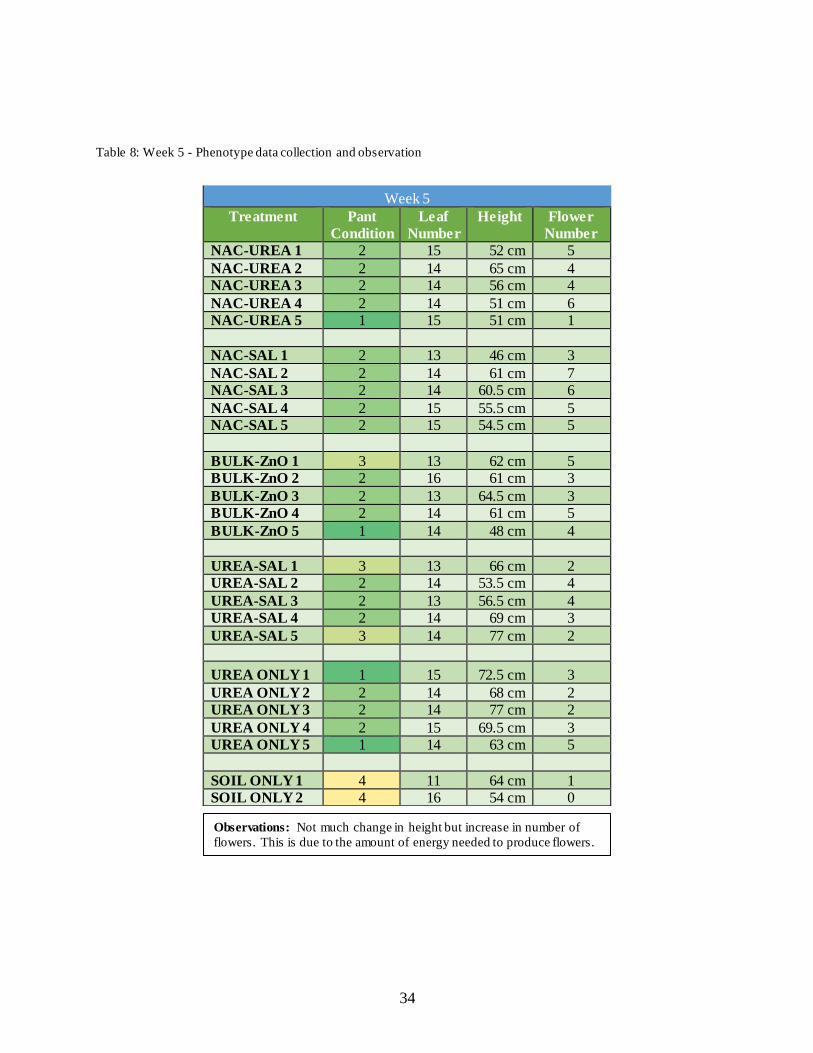
Table 8: Week 5 - Phenotype data collection and observation
Week 5
Treatment Pant
Condition
Leaf
Number
Height Flower
Number
NAC-UREA 1 2 15 52 cm 5
NAC-UREA 2 2 14 65 cm 4 NAC-UREA 3 2 14 56 cm 4
NAC-UREA 4 2 14 51 cm 6 NAC-UREA 5 1 15 51 cm 1
NAC-SAL 1 2 13 46 cm 3
NAC-SAL 2 2 14 61 cm 7 NAC-SAL 3 2 14 60.5 cm 6
NAC-SAL 4 2 15 55.5 cm 5 NAC-SAL 5 2 15 54.5 cm 5
BULK-ZnO 1 3 13 62 cm 5 BULK-ZnO 2 2 16 61 cm 3
BULK-ZnO 3 2 13 64.5 cm 3 BULK-ZnO 4 2 14 61 cm 5
BULK-ZnO 5 1 14 48 cm 4
UREA-SAL 1 3 13 66 cm 2 UREA-SAL 2 2 14 53.5 cm 4
UREA-SAL 3 2 13 56.5 cm 4 UREA-SAL 4 2 14 69 cm 3
UREA-SAL 5 3 14 77 cm 2
UREA ONLY 1 1 15 72.5 cm 3
UREA ONLY 2 2 14 68 cm 2 UREA ONLY 3 2 14 77 cm 2
UREA ONLY 4 2 15 69.5 cm 3 UREA ONLY 5 1 14 63 cm 5
SOIL ONLY 1 4 11 64 cm 1 SOIL ONLY 2 4 16 54 cm 0
Observations: Not much change in height but increase in number of
flowers. This is due to the amount of energy needed to produce flowers.
35
Table 9: Week 6 - Phenotype data collection and observation
Week 6
Treatment Pant
Condition
Leaf
Number
Height Flower
Number
Fruit
Number
NAC-UREA 1 4 17 53 cm 7 0
NAC-UREA 2 2 16 59.5 cm 11 1 fruit
forming
NAC-UREA 3 4 14 49.5 cm 9 0
NAC-UREA 4 2 18 63 cm 7 0 NAC-UREA 5 1 13 57 cm 7 0
NAC-SAL 1 4 15 47 cm 6 0
NAC-SAL 2 4 15 61.5 cm 9 0 NAC-SAL 3 2 16 60 cm 10 0
NAC-SAL 4 3 16 55 cm 8 0 NAC-SAL 5 1 18 55.5 cm 5 0
BULK-ZnO 1 2 15 63 cm 6 0
BULK-ZnO 2 2 15 60 cm 8 1 fruit
forming BULK-ZnO 3 3 12 62 cm 6 0
BULK-ZnO 4 2 13 62 cm 8 0
BULK-ZnO 5
4, new growth 1 16 60 cm 8 0
UREA-SAL 1 2 16 67.5 cm 6 0
UREA-SAL 2 1 16 69 cm 9 0 UREA-SAL 3 4 15 56 cm 10 0
UREA-SAL 4 4 13 70 cm 6 0 UREA-SAL 5 4 13 77.5 cm 8 0
UREA ONLY 1 1 13 72 cm 5 0
UREA ONLY 2 1 14 69 cm 5 0 UREA ONLY 3 4 14 78 cm 5 0
UREA ONLY 4 1 15 70 cm 7 0
UREA ONLY 5 1 17 62 cm 6 0
SOIL ONLY 1 4 10 55 cm 2 0 SOIL ONLY 2 4 13 57 cm 1 0
Observation: Whit flies and their eggs were noticed on the tomato plants – mostly on
the Bulk ZnO and NAC-UREA plants. Flies and their eggs were manually removed
with water. If bad enough, leaf or leaflet was removed. White flies may be a factor in
leaf discoloration.
36
Table 10: Week 9 - Phenotype data collection and observation
Week 9 Treatment Pant
Condition
Leaf
Number
Height Flower
Number
Fruit
Number
Fruit
Condition
NAC-UREA 1 1 16 110 cm 11 1 Healthy NAC-UREA 2 2 16 100 cm 0 2 Healthy
NAC-UREA 3 2 15 98.5 cm 2 4 3 w/ BER NAC-UREA 4 2 15 108 cm 4 4 Healthy
NAC-UREA 5 1 16 100 cm 4 2 Healthy
NAC-SAL 1 2 20 99 cm 7 4 1 w/ BER NAC-SAL 2 2 18 109 cm 8 2 Healthy
NAC-SAL 3 2 21 110 cm 9 2 Healthy
NAC-SAL 4 2 14 102 cm 6 0 NAC-SAL 5 1 26 120 cm 11 2 Healthy
BULK-ZnO 1 2 22 118 cm 11 3 Healthy BULK-ZnO 2 1 21 103 cm 3 3 Healthy
BULK-ZnO 3 2 13 98 cm 2 2 Healthy BULK-ZnO 4 2 19 11 cm 5 1 Healthy
BULK-ZnO 5 2 14 96 cm 6 5 2 w/ BER
UREA-SAL 1 4 11 109 cm 0 3 Healthy UREA-SAL 2 2 24 102 cm 7 3 1 w/ BER
UREA-SAL 3 4 16 43 cm 3 5 3 w/ BER UREA-SAL 4 4 23 113 cm 5 0
UREA-SAL 5 4 15 129.5 cm 2 3 1 w/ BER
UREA ONLY 1 2 21 118 cm 2 1 1 w/ BER UREA ONLY 2 2 18 103.5 cm 6 3 1 w/ BER
UREA ONLY 3 2 11 117 cm 4 2 Healthy UREA ONLY 4 2 22 111 cm 4 3 1 w/ BER
UREA ONLY 5 2 18 116 cm 0 2 1 w/ Damage
SOIL ONLY 1 4 9 105 cm 1 1 Healthy
SOIL ONLY 2 4 10 90 cm 0 0
Observation: Blossom-End Rot (BER) is a brown soaking end spot on the bottom of tomato plants. BER is due to calcium deficiency or imbalance. All plants have taken on a rusty brown color on older leaves. Some of the older leaves have been removed.
Observation: Blossom-End Rot (BER) is a brown water soaking end spot on the bottom of tomato
plants. BER is a result of calcium deficiency or imbalance. All plants have taken on a rusty brown color
on older leaves – this may be from Zn deficiency
37
Table 11: Week 11 - Phenotype data collection and observation