The Effects of Barometric Pressure on First Graders' Behavior by Nicole J. Blaskowski A Research Paper Submitted in Partial Fulfillment of the Requirements for the Master of Science Degree in Guidance and Counseling Approved: 2 Semester Credits The Graduate School University of Wisconsin-Stout December, 2007
Transcript
The Effects ofBarometric Pressure on First Graders' Behavior
by
Nicole J. Blaskowski
A Research Paper Submitted in Partial Fulfillment of the
Requirements for the Master of Science Degree
in
Guidance and Counseling
Approved: 2 Semester Credits
The Graduate School
University ofWisconsin-Stout
December, 2007
11
The Graduate School University of Wisconsin-Stout
Menomonie, WI
Author: Blaskowski, Nicole J.
Title: The Effects ofBarometric Pressure on First Graders' Behavior
Graduate DegreelMajor: Master of Science in Guidance and Counseling
Research Adviser: Amy Gillett, Ph.D.
MonthlYear: December, 2007
Number of Pages: 40
Style Manual Used: American Psychological Association, 5th edition
ABSTRACT
In our modern day lifestyles as humans we may not always have the time to be in
tune with our bodies and the surrounding effects of the weather. Some people can feel a
weather pattern change from the moment they wake up, and others do not feel the effects
of weather changes at all. Biometeorology is defined by Merriam-Webster Online as "A
science that deals with the relationship between living things and atmospheric
phenomena" (2007, n.p.).
Teachers being as busy as they are do not have time to spend during the day
trying to get students to cooperate behaviorally or to maintain their attention. If a
correlation exists between the barometric pressure and behavioral changes, teachers could
check the barometric pressure before school starts to get an idea ofhow they will need to
alter their lesson plans.
iii
The Graduate School
University ofWisconsin-Stout
Menomonie, WI
Acknowledgements
I would like to thank my family for their continuous love and support throughout
my life and education, my husband Brian for his love and dedication with me throughout
the time we have been together, and the friends that I have met throughout my life that
have encouraged me along the way. I would also like to thank Dr. Amy Gillett for being a
great thesis advisor, the teachers that I have had throughout my life, and the teachers that
participated in this research. Last but not least, I would like to thank Aaron J. Staut for his
thesis topic The Effects ofBarometric Pressure on Elementary School Students'
Behavior; his thesis inspired me to perform further research on the topic.
Animals are also affected by the change in barometric pressure. After hunting
whitetail deer in Midwestern Wisconsin for about 35 years, Larry Putman can predict rain
or storms by the whitetail deer's behavior (L. Putman, personal communication, July 7,
2007). Mr. Putman explained that the whitetail deer will move and eat more when the
barometric pressure is falling because they can sense that rain or a storm is approaching.
The keen instincts of the whitetail deer are to eat and find shelter before the rain or storm
arrive.
It is not fully understood how the barometric pressure affects fish. An article
written by Adams (2006) titled Effects ofBarometric Pressure on Fishing, described that
fish activity can be related to the barometric pressure. Adams reported how the types of
pressure affected fish behaviors. A clear day with high barometric pressure cause the fish
to move toward deeper water, and the fish tend to move slower. As the barometric
pressure rises and the skies are clearing, the fish move around a more. During average
barometric pressure, ordinary fishing patterns were seen and the weather was reasonable.
As the barometric pressure dropped, the weather became questionable, and the fish were
at their most active peale As the barometric pressure became lower, the fish slowed down
and were less active as rain or a storm approached. The lowest barometric pressure was
during a storm or rainfall and this inhibited fish activity. Adams stated, "It is important,
however, to note that the effects ofbarometric pressure is greater in fresh and shallow
waters, than it is in deeper waters" (2006, p. 1).
Burroughs, Crowder, Robertson, Vallier-Talbot, and Whitaker (1996) included a
chapter in their book Weather pertaining to the weather and our health. They stated,
3
"Respiratory infections and muscular pains appear to be triggered by sudden changes in
temperature and humidity that accompany both cold and warm fronts, especially when
temperatures are low" (1996, p. 131). "Heart attacks, bleeding ulcers, and migraines have
also been linked to abrupt weather changes" (1996, p. 131). Looking back to history and
even today, people can sometimes predict weather patterns by pain in they feel in their
joints.
Watson (1993) described how the weather has an effect on humans. It has been
documented that many people in the world are sensitive to the weather. Variations in the
atmospheric pressure can alter our moods, reactions, and attention. Watson explained,
"For example, a sudden drop in barometric pressure (the first sign of an approaching
storm) may cause the cells in your body to exert an increased outward pressure - at least
until they adjust - which causes a bloated feeling, a headache, or grumpiness" (Watson,
1993, p. 17). Pressure change is what gives us the yucky feeling of swelling, irritability,
and headaches. The barometric pressure can also cause us to be less active or more active
throughout our day. The drastic weather changes have also been said to be linked to why
suicide rates tend to be higher in early spring (Watson, 1993.)
Americans have developed myths about the animals and weather. If you have
been outside before a storm, you may have noticed that insects tend to be more lively,
birds fly lower, and the frogs start to croak more. Have you ever driven down a country
road on an overcast day and started to smell rain in the air? Then further down the road
you noticed a group of cows lying in the pasture gathered together? These are all
examples of how the barometric pressure can be an indicator ofa change in animal
4
behaviors. Although some of these patterns may not be statistically supported, it is
evident to those who have repeatedly witnessed this phenomenon.
Teachers being as busy as they are do not have time to waste during the day trying
to get students to cooperate behaviorally or to maintain their attention. If a correlation
exists between the barometric pressure and behavioral changes, teachers could check the
barometric pressure before school started to get an idea ofhow they will need to alter
their lesson plans. For example, on a higher than average barometric pressure day
teachers could adjust accordingly to students' sluggish behavior, and on a lower than
average barometric pressure day, it may be more challenging to get work accomplished
when children are more restless and lively.
Statement ofthe Problem
The purpose of this study was to explore the atmospheric pressure effects on first
grade students' overall daily behavior reported by their teacher. The atmospheric pressure
was recorded at 8:00am during the first part of the school day and also at 3:00pm at the
end of the seven hour school day. The researcher recorded the atmospheric pressure with
an instrument called a barometer from the website Weather Underground, which can be
found at www.wunderground.comland is continuously updated throughout the day. The
atmospheric pressure study was conducted from April 10, 2007 through May 18, 2007 at
a rural school in northwestern Wisconsin. A Likert scale was used by the teachers to
assess the students' overall behavior at 3:00pm for the seven hour school day. The
atmospheric pressure change from 8:00am to 3:00pm was recorded and correlated with
the Likert scale of the students' overall classroom behavior for the day.
5
Purpose ofthe Study
The purpose of this study was to analyze the possible connection between
atmospheric pressure and first graders' classroom behavior.
Null Hypotheses
There will be no relationship between the daily variations in atmospheric pressure
and the overall daily first grade students' behavior rating by their teachers.
Assumptions ofthe Study
There are some assumptions that go along with this study. It is assumed that the
first grade children are developed behaviorally in adapting to the routine and schedule of
school, and can demonstrate socially appropriate daily school behaviors that we
commonly practice in the United States school systems. It will also be assumed that the
teachers of the first graders will be openly willing to participate and will generate truthful
answers on the Likert scale measuring the students' overall classroom behavior on a daily
basis. Lastly, it will be assumed that the barometric pressure will be accurately recorded,
whether by personal or mechanical functioning of the barometer.
Limitations ofthe Study
The researcher has identified various limitations to the study.
1. The first day of spring begins March zo", and the students may be excited for
the upcoming warm weather.
2. Aprill May are close to the end of the school year and students may be "worn
out from the school year," or "eager" that it is almost finished.
6
3. There may be a field trip or a school activity during the month of the study that
could cause a change in the data, or any type of gathering at school that may cause
energetic behaviors.
4. Aspects outside of school such as poor nutrition, family issues, friendships, an
illness, academic struggles, poverty, did not sleep well the night before, and any other
variable the child may have could adversely impact this study.
5. The teachers may not remain objective during the study, or may also adversely
be impacted by the barometric pressure, which may cause them to alter their judgment of
the overall classroom behavior for the day.
6. The lack of sunshine from cloud cover may cause the students and/or the
teachers to demonstrate a lethargic demeanor.
Definition ofTerms
For clarification, these definitions are the interpretations of the researcher.
Atmospheric pressure is the pressure at any point of the Earth's atmosphere and is
commonly referred to as the "barometric pressure."
Barometer is an instrument used to measure the atmospheric pressure.
High Pressure Area is when the atmospheric pressure is higher than the
surrounding area. This occurs with the presence oflight winds and clear skies.
Low Pressure Area is when the atmospheric pressure is lowest compared to the
surrounding area. This occurs with the presence of tropical storms, stronger winds, and
overcast skies.
7
Station Pressure is when the atmospheric pressure ranges from altitudes different
than sea level, theses include geographic specific readings.
8
Chapter II: Literature Review
Introduction
In this chapter the researcher will be providing background information in four
main areas: weather basics, the history ofweather inventors, how weather can affect
species, and student behaviors in the classroom. This background information is to
provide the reader with a foundation to explore the topic ofhow the barometric pressure
may affect first grade students' behavior.
Weather Basics
To understand the effects ofweather, it is important to understand the basic
elements ofweather. The troposphere is the lowest part of the atmosphere in which
weather occurs. Species on Earth live in the troposphere layer of the atmosphere.
According to Allaby (1995), the atmosphere is over 370 miles in thickness, and the
weight from all that air pressure is on our Earth's surface. The force that is exerted
downward is known as the pressure, hence the term atmospheric pressure.
Burroughs, Crowder, Robertson, Vallier-Talbot, and Whitaker (1996) explained
the weather and some of the effects weather has on animals and humans. In their book
Weather, the atmosphere was described in great detail. The Earth's atmosphere gives
species the oxygen to breath, the water vapor that is needed in order to have weather, and
the circulation of the wind that creates storms and varies our climate. Air is composed of
trillions ofmolecules moving in all different directions, causing collisions between the
molecules themselves and other particles in the atmosphere. When the molecules bounce
off these other particles, it creates pressure in the air, also known as barometric or
9
atmospheric pressure (Burroughs et al., 1996). As the barometric pressure goes up, the
molecules collide more frequently causing the barometric pressure to rise.
High atmospheric pressure is generally associated with clear skies, whereas low
pressure is associated with cloudy skies and possibly precipitation or a storm moving into
the area (Burroughs et al., 1996). A change in barometric pressure occurs as a warm air
mass rises. It cools and spreads due to the lower temperatures higher in the atmosphere.
When the air has cooled, it starts to sink back to Earth through gravity. In the locations
where the air is rising, an area of low pressure occurs, where there is air sinking, high
pressure occurs. Since the atmosphere works constantly to reach stability, air moves into
the low pressure area from surrounding areas of high pressure. The movement from high
to low pressure areas is always in one direction, and is what we call, the wind (Burroughs
et aI., 1996).
Air pressure was also described by Sloane (2005). "Air pressure is just another
way of referring to air weight" (Sloane, 2005, p. 11). Barometric pressure is another term
people often use when referring to air pressure. The barometer is the instrument that
measures the amount of pressure in the air by weighing it. Since mercury is a liquid, has a
high density, and will not evaporate, it is a commonly used substance for measuring
barometric pressure.
Sloane (2005) described air movement. The movement of the air is wind, and it
moves from high pressure areas to low pressure areas. "It first flows around the high
pressure area, ail the while leaning outward; then it flows around the low-pressure area,
all the while leaning inward" (Sloane, 2005, p. 12). "The steeper the slope of the
10
atmospheric hill or valley, the faster the air flowed downward (the higher is the wind)"
(Sloane, 2005, p. 13). In the northern hemisphere the wind moves clockwise around the
high pressure area, and then flows counterclockwise around the low pressure area. This is
reversed in the southern hemisphere where the wind would flow counterclockwise around
the high and clockwise around the low (Sloane, 2005).
History ofWeather Inventors
Burroughs, Crowder, Robertson, Vallier-Talbot, and Whitaker (1996), included
several chapters on how past generations reported and recorded weather. Aristotle and
Theophrastus were from the golden age of Greek scholarship. "His treatise,
Meteorologica, was an attempt to describe everything of a physical nature in the sky, air,
sea, and earth, including all weather phenomena" (Burroughs et aI., 1996, p. 64). In
Meteorologica, Aristotle documented interesting things regarding the weather, but also
had some misconceptions as well (Burroughs et aI., 1996). When Aristotle retired, his
student, Theophrastus, continued his work (cited in Burroughs, Crowder, Robertson,
Vallier-Talbot, & Whitaker, 1996). Theophrastus wrote a book titled On Weather Signs
which included 80 various signs of rain, 24 different documentations of fair weather, 50
of storms, and 45 of the wind. Some we would consider to be more like folklore today.
"Whenever there is fog, there is little or no rain (Burroughs et aI., 1996, p. 65.).
Today, we see this as truthful because fog generally occurs with settled weather near the
center of a high pressure area. After Aristotle and Theophrastus, the Greeks continued to
show a great interest in meteorology (Burroughs et aI., 1996). When the Roman Empire
11
dissolved, civilization shifted to the Islamic world. During the Middle Ages, European
scholars rediscovered the work of Aristotle.
Burroughs, Crowder, Robertson, Vallier-Talbot, and Whitaker (1996) further
talked about how the Middle Ages and Renaissance was a time period when meteorology
began to prosper. "Leonardo's journals contain numerous studies ofweather phenomena
and designs for meteorological instruments, including a hygrometer- a device for
measuring humidity" (Burroughs et aI., 1996, p. 67). The thermoscope was developed by
Galileo, which was the first creation of what we know as the thermometer. Sadly, Galileo
did not leave a trace ofwhat he accomplished with his thermoscope.
Galileo's student, Evangelista Torricelli, made the first barometer. He took a glass
tube that was about four feet long, and filled it with mercury, then inverted the open end
into a dish of more mercury. "Torricelli noted that much of the mercury remained in the
tube instead of going into the dish, and that the space above the mercury in the tube was a
vacuum" (Burroughs et aI., 1996, p. 67). Torricelli decided that the air pressure changes
is what caused the variations in the height of the mercury in the tube (Burroughs et al.,
1996).
During the Age ofReason, meteorological observations continued improving and
advancing. Burroughs, Crowder, Robertson, Vallier-Talbot, and Whitaker (1996)
documented that Gabriel Fahrenheit created the Fahrenheit measurement for temperature,
which is still commonly used in the United States. Because ofTorricelli's previous
invention, the atmospheric pressure was fairly simple to calculate. During the Age of
Reason variations of the barometers were created using different fluids. Robert Boyle
12
invented two different types ofbarometers, one made from water, and the other a siphon
device which was more transportable.
The Burroughs, Crowder, Robertson, Vallier-Talbot, and Whitaker (1996) book
contains valuable pieces on the history ofweather. Many Severe storms have struck the
Great Lakes, sinking numerous ships, and killing countless people between the years
1868 and 1869. As a result of the tragic loss of life, President Ulysses S. Grant signed a
law in 1870 that established the first national weather service in the United States. This
weather service has predicted weather and protected many lives over the past century.
Moving into the Modem Era, Burroughs, Crowder, Robertson, Vallier-Talbot, and
Whitaker (1996), documented the use of satellites and computers to monitor our weather
systems. The late 1900's was a time oftechnological changes for the advancement of
predicting weather. Today, we use extensive equipment and experts to predict weather.
Even with modem technology, weather cannot always be predicted quick enough to save
lives. For example, when hurricane Katrina ripped through New Orleans the residents
who stayed behind did not anticipate the flood gates breaking from the waves crashing
upon it. This left thousands ofpeople stranded without food or drinking water. Weather
has devastating affects on living species and non-living things on Earth. Although not all
weather can be predicted in time to save lives, the current technology has done a
wonderful job of saving numerous lives.
How the Weather Can Affect Species
The barometric pressure has been studied by several researchers. In a research
study by El-Mallakh, Nair, Piecznski, and Schory (2003), it was proposed that violent
13
acts, along with why psychiatry patients needed immediate assistance were linked to low
barometric pressure. This study obtained information about patients that were checked
into the impatient emergency psychiatric at the University of Louisville Hospital in 1999.
The researchers also obtained information from the Police Department in Jefferson
County regarding violent offenses. The researchers examined the amount of emergency
psychiatric patients along with violent offenses for 337 days. Although, the research did
not find a strong link between low barometric pressure and emergency psychiatric visits,
and low barometric pressure and violent offenses, a correlation still existed (El-Mallakh
et aI., 2003).
When humans feel sinus pressure it may be caused by the change in barometric
pressure (Williams, 2005). During a cold or when your sinuses are stopped up, the
change in barometric pressure becomes more noticeable. More air may enter your sinuses
during high pressure, and if the air pressure suddenly falls before a storm, the pressure in
your sinuses needs time to adjust. During this period of adjustment it may be
uncomfortable as the pressure moves out of the sinuses. The uncomfortable feeling in
your sinuses also may occur when you are flying on an airplane and have a sudden
altitude change, or if you are taking an elevator that quickly goes up many floors
(Williams, 2005).
Student Behaviors in the Classroom
Research by Barry (2006) investigated how children from birth to the age of eight
behave based on memory skills learned. Memory has not been fully developed at this
point in a child's life, but this time period serves as the building blocks for future
14
memory skills. With younger children it is effective for adults to give small easy
commands when initiating a behavior. For example, when asking the students in your
classroom to clean up an area it may be more effective to ask them to, "put the lids tightly
on the paint," ''wash the brushes with soap in the sink," "put the paint and the brushes in
the drawer," and "remain seated quietly when you are finished". These specific verbal
commands said slowly, and repeated will help young children understand exactly what is
expected of them versus just saying "clean up the classroom". After repeating the steps of
the process many times, the children will have the background knowledge to understand
what "cleaning up the classroom" means (Barry, 2006).
In a classroom where young children are talking it is better to say "talk quietly"
than "do not yell" because in their speed ofprocessing it takes more time to process
negative information than it does to process positive information (Barry, 2006). Teachers
may notice when they ask a question to the class they may call on an eager student to
answer a question and the student says "ahh, I forgot," this is usually because the younger
child has used up all of their limited amount ofprocessing memory to get your attention
to call on them. Overtime the amount ofbasic knowledge increases along with how the
information is organized and processed (Barry, 2006).
With the amount of time first grade teachers spend in the classroom with their
students, they can observe changes in the overall feel of the classroom. I have heard
teachers say when a rain or snow storm is approaching the children are more "lively".
While doing my practicum for school counseling in the elementary school, I noticed these
changes while giving guidance lessons to the first grade classrooms. It could be linked to
15
the barometric pressure, or it could be linked to other factors such as: the children are
excited or nervous for approaching weather, the reaction the teachers and faculty have
about approaching weather may affect the students' reactions, or their behavior may be
linked to other weather elements or external factors.
16
Chapter III: Methodology
Introduction
This chapter includes information regarding how the sample was selected, a
description of the sample, and the instruments used. In addition, data collection, along
with data analysis procedures is given. The chapter concludes with the methodological
limitations.
Subject Selection and Description
Participants were chosen from a rural school near by the local weather recording
station for the most accurate barometric recording. Selection of participants was based on
students in the first grade for the purposes of developmental reasoning. Upon receiving
approval from the principal of the school, the researcher left the consent form, along with
the Likert scale for the principal to distribute to the first grade teachers. The teachers
were instructed to mail the consent form to the researcher prior to data collection. At the
end of the data collection, the teachers were instructed to mail the data back to the
researcher. A copy ofthe consent form sent to the teachers is located in Appendix A.
Only the first grade teachers were invited to participate in this study and were
chosen due to the amount of time they spend in the classroom with the students on a
regular basis. The students were unaware that their teachers were observing and
recording their behavior therefore limiting biases. The first grade has four-full time
teachers with about 20 students in each classroom.
17
Instrumentation
The researcher used two instruments to record data for this study. One was a
barometer to measure the atmospheric (barometric) pressure, and the other was a Likert
scale created by the researcher to measure the teachers' perception of first graders'
behavior. The Likert scale was created by the researcher; no pilot study was performed,
nor was the instrument tested for validity or reliability. The Likert scale was made up of
five variables to rate the students' behavior including: 1=sluggish, 2=between sluggish
and usual, 3=usual, 4=between usual and lively, 5=lively. A copy of the instrument used
can be found in Appendix B.
The barometric reading was taken from the Weather Underground. The website
www.wunderground.com/provides a station located in Eau Claire, Wisconsin, which was
the closest weather station to the elementary school in this study. The researcher recorded
the atmospheric pressure with an instrument called a barometer used by the website
Weather Underground, which can be found at www.wunderground.com/and is
continuously updated throughout the day.
The atmospheric pressure study was conducted from April 10, 2007 through May
18, 2007 at a rural school in northwestern Wisconsin. The Likert scale was used by the
teachers to assess the students' overall behavior at 3:00pm for the seven hour school day.
The atmospheric pressure change from 8:00am and 3:00pm was recorded and correlated
with the Likert scale ofthe students' overall classroom behavior for the day.
The purpose of this study was to examine the effects that atmospheric pressure
had on first graders overall daily classroom behavior. The reason for choosing first grade
18
would be they have the developmental skills ofthe appropriate behaviors our United
States public school system deems acceptable. Also, first graders are generally in the
Piaget's pre-operational phase, which may inhibit the students' ability to think abstractly
about the effects the barometric pressure is having on their behaviors and overall feelings
ofbeing lively or sluggish.
Data Collection Procedures
The barometric pressure was recorded at 8:00am and 3:00pm for the duration of
the 29 day study through the Weather Underground webpage, which was on average
updated hourly at the time the researcher recorded data. At 3:00pm the teachers were
instructed to circle on the Likert scale what the overall rating of their classroom was for
the day, this included: 1=sluggish, 2=between sluggish and usual, 3=usual, 4=between
usual and lively, 5=lively.
Data Analysis
The difference in barometric reading from 8:00am and 3:00pm was recorded. The
researcher compiled the four overall behavior ratings from each of the teachers' Likert
scale for an average behavior rating score. The difference in barometric reading and
overall behavior score were analyzed through a computer program titled Statistical
Program for Social Sciences, version 15.0 (SPSS, 2006). A Correlation was used to
determine ifthere was a statistically significant relationship between barometric pressure
change and overall classroom behavior, using Pearson r correlation coefficient.
Significance was set at the .05 level.
19
Limitations
The following are limitations of the methodology from this study:
1. The Likert scale was not tested for validity for reliability prior to being used for
this research.
2. No baseline data was taken prior to the study for comparison of results.
3. Other schools were not included in this sample, limiting data to this particular
school.
20
Chapter IV: Results
Introduction
This chapter will present demographic information of the participants in the
research study. It will also include statistics regarding the outcome of the study and
conclude with the research hypothesis.
Demographic Information
For purposes ofconfidentiality, the name of the school was not identified. The
demographics the researcher can provide is that of the four first grade teachers, 100%
participated. Each teacher had on average 20 students in a classroom. The school is
located in a small town, in the Midwestern region of Wisconsin.
Item Analysis
The results from the study are reported in Table 1. There was more variation in
classroom behavior noted in classroom one, however, when the classroom data was
combined, there were not appreciable variations verified. See Table I for the complete
data. In addition, a copy of the raw data is provided in Appendix C.
21
Table 1: Barometric Pressure Change and Behavior Rating Scale Date Barometric Average Behavior Behavior Behavior Behavior
Pressure Overall Rating for Rating for Rating for Rating for Change Behavior the First the the Third the Fourth From Rating for Classroom Second Classroom Classroom 8:00am to the Four Classroom 3:00pm Classrooms
Consent to Participate In UW-Stout Approved Research
Title: The Effects of Barometric Pressure on First Graders' Behavior
Investigator: Nicole J. Blaskowski Research Sponsor: Amy L. Gillett
Description: For twenty nine continuous school days during the time period of April 1Oth and May 18th, the researcher will record the barometric pressure from a local weather station www.weau.com/weather which is continuously updated throughout the day. The barometric recordings will occur at 8:00am and 3:00pm. At 3:00pm the first grade teachers will complete one question on the Likert scale asking what the overall energy level of the classroom was for the day. After the study, the researcher will take an average of the two barometric recordings and correlate it with the Likert scale recordings from the teachers.
Risks and Benefits: The risks are minimal. The first grade teachers will use a Likert scale to assess the overall daily classroom energy level of the first grade students. The students will be unaware that their teacher is rating their overall behavior for the day.
The benefits of this study are valuable. If a correlation is found, then first grade teachers can check the barometric pressure before school and make modifications to their lesson plans according to the anticipated energy level of the students. This can improve the effectiveness of teachers' lesson plans and decrease the amount of wasted time in the classroom.
Time Commitment and Payment: The time commitment of this study will be minimal. It should take about thirty seconds at the end of each day to circle one number on the Likert scale provided. No payment will be given to the participants.
Confidentiality: Your name will not be included on any documents. I do not believe that you can be identified from any of this information. This informed consent will not be kept with any of the other documents completed with this project.
Right to Withdraw: Your participation in this study is entirely voluntary. You may choose not to participate without any adverse consequences to you. Should you choose to participate and later wish to withdraw from the study, you may discontinue your participation at this time without incurring adverse consequences.
28
IRB Approval: This study has been reviewed and approved by The University ofWisconsin-Stout's Institutional Review Board (IRB). The IRB has determined that this study meets the ethical obligations required by federal law and University policies. If you have questions or concerns regarding this study please contact the Investigator or Advisor. If you have any questions, concerns, or reports regarding your rights as a research subject, please contact the IRB Administrator.
Investigator: Nicole Blaskowski IRB Administrator: [email protected] Sue Foxwell, Director, Research Services
152 Vocational Rehabilitation Bldg. Advisor: Amy L. Gillett UW-Stout Menomonie, WI 54751 [email protected] 715-232-2477
Statement of Consent: By signing this consent form you agree to participate in the project entitled, The Effects of Barometric Pressure on First Graders' Behavior.
Signature Date
29 Appendix B:
The Effects ofBarometric Pressure on First Graders' Behavior
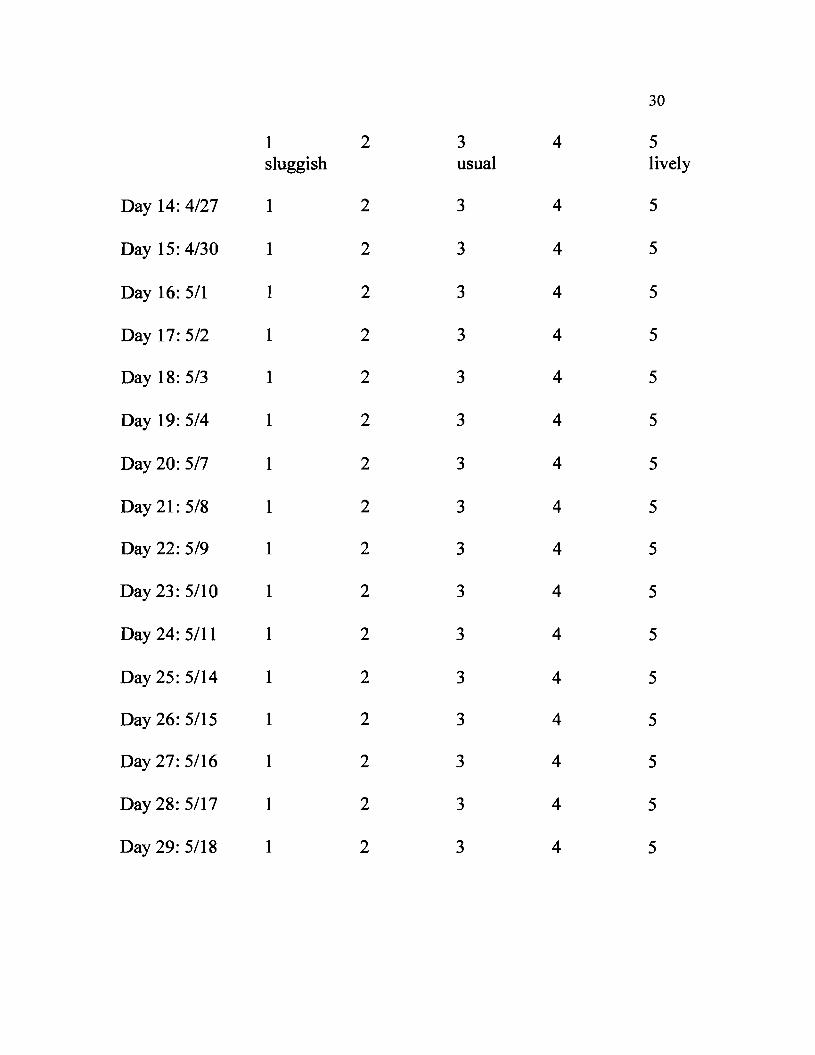
Likert Scale Rate the overall classroom behavior on a scale from 1 to 5: sluggish being 1, 2 being between sluggish and usual, usual being 3, between usual and lively a 4, and lively a 5. This should be completed at about 3:00pm when the students have left for the day, each day for thirty continuous school days.
1 2 3 4 5 sluggish usual lively
Day 1: 4/10 1 2 3 4 5
Day 2: 4/11 1 2 3 4 5
Day 3: 4/12 1 2 3 4 5
Day 4: 4/13 1 2 3 4 5
Day 5: 4/16 1 2 3 4 5
Day 6: 4/17 1 2 3 4 5
Day 7: 4/18 1 2 3 4 5
Day 8: 4/19 1 2 3 4 5
Day 9: 4/20 1 2 3 4 5
Day 10: 4/23 1 2 3 4 5
Day 11: 4/24 1 2 3 4 5
Day 12: 4/25 1 2 3 4 5
Day 13: 4/26 I 2 3 4 5
30
1 2 3 4 5 sluggish usual lively
Day 14: 4/27 1 2 3 4 5
Day 15: 4/30 1 2 3 4 5
Day 16: 5/1 1 2 3 4 5
Day 17: 5/2 1 2 3 4 5
Day 18: 5/3 1 2 3 4 5
Day 19: 5/4 1 2 3 4 5
Day 20: 5/7 1 2 3 4 5
Day 21: 5/8 1 2 3 4 5
Day 22: 5/9 1 2 3 4 5
Day 23: 5/10 1 2 3 4 5
Day 24: 5/11 1 2 3 4 5
Day 25: 5/14 1 2 3 4 5
Day 26: 5/15 1 2 3 4 5
Day 27: 5/16 1 2 3 4 5
Day 28: 5/17 1 2 3 4 5
Day 29: 5/18 1 2 3 4 5
31
Appendix C:
Barometric Pressure and Weather Data Collected
Day 1: Tuesday April 10, 2007 8:00am: Barometric pressure: 30.04
Clear and 27 degrees Fahrenheit
3:00pm: Barometric pressure: 29.93 Clear and 45 degrees Fahrenheit
Day 2: Wednesday April 11, 2007 8:00am: Barometric pressure: 29.79
Flurries and 30 degrees Fahrenheit
3:00pm: Barometric pressure: 29.67 Flurries and 36 degrees Fahrenheit
Day 3: Thursday April 12, 2007 8:00am: Barometric pressure: 29.83
Partly cloudy and 33 degrees Fahrenheit
3:00pm: Barometric pressure: 29.90 Cloudy and 43 degrees Fahrenheit
Day 4: Friday April 13, 2007 8:00am: Barometric pressure: 30.22
Clear and 33 degrees Fahrenheit
3:OOpm: Barometric pressure: 30.15 Clear and 53 degrees Fahrenheit
Day 5: Monday April 16, 2007 8:00am: Barometric pressure: 30.13
Clear and 37 degrees Fahrenheit
3:00pm: Barometric pressure: 30.00 Clear and 67 degrees Fahrenheit
32
Day 6: Tuesday April 17, 2007 8:00am: Barometric pressure: 30.02
Clear and 46 degrees Fahrenheit
3:OOpm: Barometric pressure: 30.03 Clear and 60 degrees Fahrenheit
Day 7: Wednesday April 18, 2007 8:00am: Barometric pressure: 30.12
Clear and 41 degrees Fahrenheit
3:00pm: Barometric pressure: 30.02 Clear and 64 degrees Fahrenheit
Day 8: Thursday April 19, 2007 8:OOam: Barometric pressure: 30.13
Clear and 43 degrees Fahrenheit
3:OOpm: Barometric pressure: 30.08 Partly cloudy and 66 degrees Fahrenheit
Day 9: Friday April 20, 2007 8:00am: Barometric pressure: 30.25
Clear and 48 degrees Fahrenheit
3:00pm: Barometric pressure: 30.17 Clear and 70 degrees Fahrenheit
Day 10: Monday April 23, 2007 8:00am: Barometric pressure: 29.89
Partly cloudy and 53 degrees Fahrenheit
3:00pm: Barometric pressure: 29.97 Cloudy and 68 degrees Fahrenheit
Day 11: Tuesday April 24, 2007 8:00am: Barometric pressure: 30.16
Clear and 47 degrees Fahrenheit
3:OOpm: Barometric pressure: 30.11 Clear and 61 degrees Fahrenheit
33
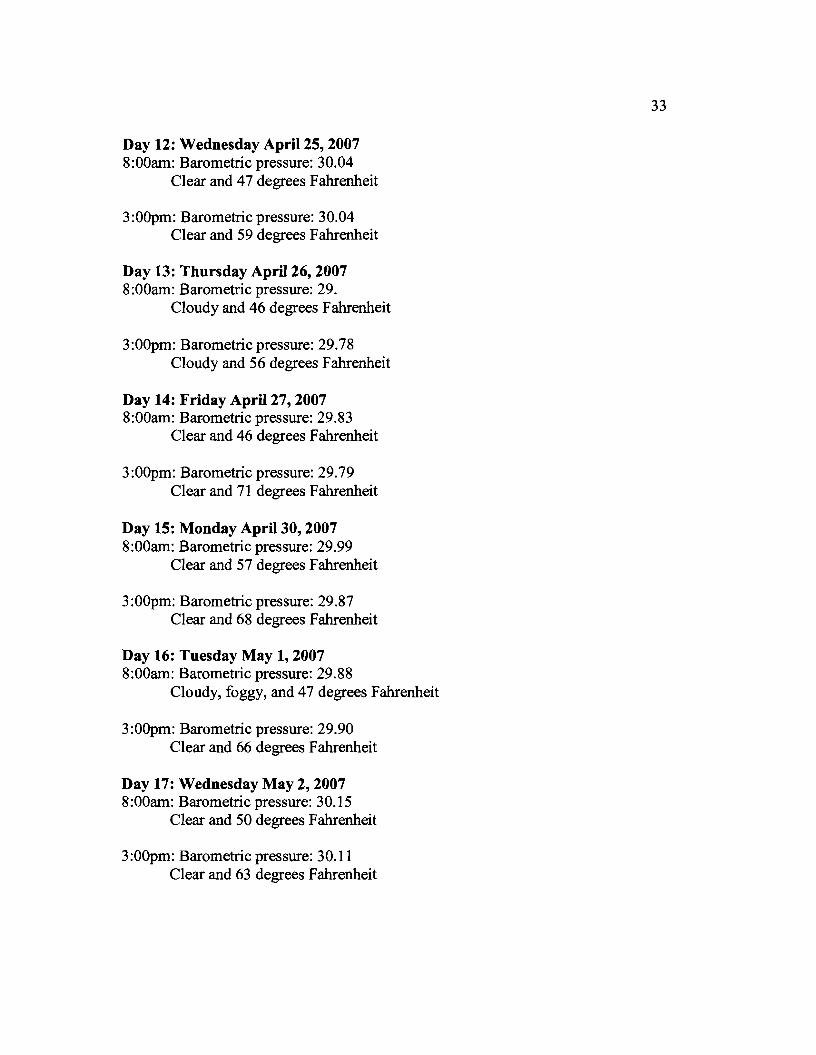
Day 12: Wednesday April 25, 2007 8:00am: Barometric pressure: 30.04
Clear and 47 degrees Fahrenheit
3:00pm: Barometric pressure: 30.04 Clear and 59 degrees Fahrenheit
Day 13: Thursday April 26, 2007 8:00am: Barometric pressure: 29.
Cloudy and 46 degrees Fahrenheit
3:00pm: Barometric pressure: 29.78 Cloudy and 56 degrees Fahrenheit
Day 14: Friday April 27, 2007 8:00am: Barometric pressure: 29.83
Clear and 46 degrees Fahrenheit
3:00pm: Barometric pressure: 29.79 Clear and 71 degrees Fahrenheit
Day 15: Monday April 30, 2007 8:00am: Barometric pressure: 29.99
Clear and 57 degrees Fahrenheit
3:OOpm: Barometric pressure: 29.87 Clear and 68 degrees Fahrenheit
Day 16: Tuesday May 1, 2007 8:00am: Barometric pressure: 29.88
Cloudy, foggy, and 47 degrees Fahrenheit
3:00pm: Barometric pressure: 29.90 Clear and 66 degrees Fahrenheit
Day 17: Wednesday May 2, 2007 8:00am: Barometric pressure: 30.15
Clear and 50 degrees Fahrenheit
3:00pm: Barometric pressure: 30.11 Clear and 63 degrees Fahrenheit
34
Day 18: Thursday May 3, 2007 8:00am: Barometric pressure: 30.20
Clear and 47degrees Fahrenheit
3:OOpm: Barometric pressure: 30.10 Clear and 70 degrees Fahrenheit
Day 19: Friday May 4, 2007 8:00am: Barometric pressure: 30.10
Cloudy and 55 degrees Fahrenheit
3:00pm: Barometric pressure: 30.02 Cloudy and 66 degrees Fahrenheit
Day 20: Monday May 7, 2007 8:00am: Barometric Pressure: 30.04
Drizzle and 59 degrees
3:00pm: Barometric Pressure: 29.96 Overcast and 64 degrees Fahrenheit
Day 21: Tuesday May 8, 2007 8:00am: Barometric Pressure: 30.05
Partly cloudy and 61 degrees Fahrenheit
3:00pm: Barometric Pressure: 30.00 Scattered clouds and 75 degrees Fahrenheit
Day 22: Wednesday May 9, 2007 8:00am: Barometric Pressure: 29.97
Clear and 61 degrees Fahrenheit
3:00pm: Barometric Pressure: 29.91 Clear and 79 degrees Fahrenheit
Day 23: Thursday May 10, 2007 8:00am: Barometric Pressure: 29.93
Clear and 54 degrees Fahrenheit
3:OOpm: Barometric Pressure: 29.89 Mostly cloudy and 78 degrees Fahrenheit
35
Day 24: Friday May 11, 2007 8:00am: Barometric Pressure: 30.14
Clear and 57 degrees Fahrenheit
3:00pm: Barometric Pressure 29.94 Light rain and 54 degrees Fahrenheit
Day 25: Monday May 14, 2007 8:00am: Barometric Pressure: 29.77
Clear and 73 degrees Fahrenheit
3:00pm: Barometric Pressure: 29.62 Clear and 94 degrees Fahrenheit
Day 26: Tuesday May 15, 2007 8:00am: Barometric Pressure: 29.88
Cloudy and 61 degrees Fahrenheit
3:00pm: Barometric Pressure: 29.95 Overcast and 56 degrees Fahrenheit
Day 27: Wednesday May 16, 2007 8:00am: Barometric Pressure: 30.09
Cloudy and 45 degrees Fahrenheit
3:00pm: Barometric Pressure: 30.11 Drizzle and 46 degrees Fahrenheit
Day 28: Thursday May 17, 2007 8:00am: Barometric Pressure: 30.38
Clear and 41 degrees Fahrenheit!
3:00pm: Barometric Pressure: 30.32 Clear and 66 degrees Fahrenheit
Day 29: Friday May 18, 2007 8:00am: Barometric Pressure: 30.20
Partly cloudy, 54 degrees Fahrenheit
3:00pm: Barometric Pressure: 30.07 Clear and 75 degrees Fahrenheit