Page 1
THE EFFICIENCY OF TREASURY BILLS MARKETIN KENYA
BY
ODEP SOLOMON OTIENO
REG. NO: D61/P/7072/2004
A project submitted in partial fulfilment of the requirements for the degree of
MASTERS IN BUSINESS ADMINISTRATION
SCHOOL OF BUSINESS UNIVERSITY OF NAIROBI
2008
OTIENO LUTHER ODHIAMBO Supervisor
University of NAIROBI Library
■11111111111110339142 2
\\
Page 2
DECLARATION
I, Odep Solomon Otieno hereby certify that;
1. Except where due acknowledgement has been made, this project work
2. The project has not been previously submitted in whole or in part toacademicaward.
S i g n e c k a M ^ ........... ..... Date. . 2 . 1 1 .
Odep Solomon Otieno D61/P/7072/2004
is mine alone,
qualify for any other
I, Mr Otieno Luther Odhiambo hereby certify that this project has been presented for examination with my approval as the University of Nairobi Supervisor.
M ^ . . D „ . ..........
Mr. Otieno Luther Odhiambo
Lecturer, School of Business
University of Nairobi
I.
Page 3
DEDICATION
This project is dedicated to the memory of my late father Evans Odep and my late brothers
Mordecai Oyugi and Enoch Owira {Best Neighbour)-, and.sister Risper Achieng’.
II.
Page 4
ACKNOWLKDGEMEN1
I am truly indebted to a number o f people, without whom, this project would not have been
successfully completed. My most sincere gratitude goes to my family for their patience and
understanding during the period of my studies. I also wish to thank the Management and Staff
of the School of Business, University of Nairobi, and my student colleagues for their time and
encouragement.
Special thanks to my former colleague at KLM, Philip Apiyo, for proof-reading my project
and to my Supervisor, Mr. Luther Otieno, whose guidance helped me a lot in developing the
project.
MERCI BEAU COUP
III.
Page 5
LIST OF ABBREVIATIONS
Analysis o f Variance ANOVA
Central Bank of Kenya CBK
Efficient Market Hypothesis EMH
Treasury Bills T-Bills
Unbiased Expectations Theory UET
IV.
Page 6
Table 1: Descriptive Statistics for Weekly TB Returns................................ ....... ...........................17
Table 2: Descriptive Statistics for Weekly Returns from TB Lag and Forward Rates..............18
Table 3: One-way ANOVA: 91DaysTB, 182DaysTB.................................................................... 19
Table 4: One-way ANOVA: 91DaysTBlag, ForRatelag............................... ........... ........................20
Graph 1: Main Effects Plot-Data Means for ForRates...................................................... .— .......21
Table 5: The Regression....................................................................................................................... 22
LIST OF TABLES AND GRAPH
V.
Page 7
TABLE OF CONTENTS
CHAPTER 11.0 Introduction.... . . . . . . . . ............................................. • •• • •................................................ ..........11.1 Background................................................................................................. ................................ 11.1.1 Efficient Market Hypothesis.................................... ................................................................ 21.1.2 Treasury Bills Market....................................................................................................... .........41.1.3 Term Structure o f Interest Rates................................ ...............................................................51.2 Statement of the Problem............................................................................................................61.3 Objectives o f the Study......................................... ; ....................................................................71.4 Importance o f this Study.............................................................................................................7
CHAPTER 22.0 Literature Review.......................................................................................: ........... ..................82.1 Efficient Market Hypothesis...................................................................................................... 82.2 Efficiency of Treasury Bill Market..........................................................................................92.2.1 Rational Expectation Hypothesis............................................................................................. 102.3 Term Structure o f Interest Rates.............................................................................................. 102.3.1 Market Expectations (Pure Expectations) Hypothesis.......................................................... 112.3.2 Liquidity Preference Theory..................................................................................................... 122.3.3 Market Segmentation Theory................................................................................................... 122.3.4 Preferred Habitat Theory......................................................................... ..................................132.4 Market Efficiency Tests in T-Bill Market............................................................................... 132.4.1 Efficient Market, Spot Rate and Forward Rates..................................................................... 142.5 Market Efficiency in Kenya......................................................................................................152.6 91 Days and 181 Days T-Bill Rates.......................................................................................... 162.7 Sum m ary...................................................................................................................................... 17
CHAPTER 33.0 Research Methodology.................................................................................................................193.1 Population.......................................................................................................................................193.2 Data Collection M ethod............................................................................................................... 203.1.2 Variables of the Study......................................................................... .........................................203.1.3 Data Analysis................................................................................................................................. 21
CHAPTER 44.0 Data Analysis and Findings...................................................................................................... 224.1 Introduction.............................................................................................. ......................................224.2 Descriptive Statistics.................................................................................................................... 224.3 Forward Rates............................................................................................................................. 234.4 Expected Spot Rates and Actual Spot Rates............................................................................. 244.5 Forward Rates and Actual Spot Rates Test for Equal Variances............................................244.6 First Test of ANOVA................................................................................................................... 254.7 ANOVA for 91-Days TB Lag and Forward Rate Lag............................................................. 254.8 The Main Effect Plot............................................................................................... :....................264.9 Forecasting Spot Rate............................................................... .....................................................27
VI.
Page 8
CHAPTER 55.0 Conclusions..................................................................... .......295 1 Recommendations for Further Research................ .......... . .......295 2 Limitation o f this Study............................................ .......30
REFERENCES.................................. ........31APPENDIX...................................... ................................................. .............33
VII.
Page 9
ABSTRACT
This study is purposed to test the efficiency of the Kenyan T reasury Bills Market. It tests how
accurate forward rates are in predicting the expected spot rates and is founded on the unbiased
expectations theory.
The data used consist of weekly yields on 91-day and 182-day T-Bills over the six year period
from 18th February 2002 to 17th March 2008. Using first test of ANOVA we determine
whether the 91-day and 182-day Treasury bills are different. We again use ANOVA for 91-
Days TB Lag and Forward Rate Lag to test whether the forward rate is equal to the expected
spot rate. Finally we run the regression model to find out the change in future spot rate when
forward rate changes by 1. This helps determine whether the relationship between future spot
rate and forward rate is statistically significant.
We find that 91-day and 182-day T-Bills appear different in line with the theory that assets of
longer maturity tend to give higher returns as compensation. We also find that forward rate
tends to be higher than the comparable spot rate suggesting the existence of forward
premiums. The regression co-efficient, P-value of 0.000, show that the relationship is
statistically significant i.e. you can use forward rates to predict future spot rates.
The implication is that market players would not achieve much trying to predict future spot
rates using the forward rates alone. The CBK should develop a model that incorporates
forward rate and other macro-economic factors to predict more accurately the future spot rate;
as we find that the forward rates have incremental information for the future changes in the
spot exchange rates, given that they move towards the same direction. This would guide
investors in their decision to invest in the Kenya Treasury Bills.
VIII.
Page 10
This study will pay attention to the cross-interest rates and cross-maturity term structures of the
forward premium to assess if at all they contain information that can be useful in predicting
future spot interest rates.
A forward interest rate is the rate one can lock in now for a commitment to buy a one-period
bond in the future. This leads naturally to the hypothesis that forward rates forecast future spot
(one period) interest rates. Early tests of this hypothesis largely use US Treasury bills, and the
results are rather negative.
A market is efficient if nobody can obtain extraordinary profit in the long run by using publicly
available information (Fama, 1965). Gross (1983) summarize the conditions to be fulfilled if the
market is to be efficient: the market is competitive, information is costless to acquire; the market
participants have the capacity to effectively use the information; transaction costs is zero; and no
non-random innovation between contract time and actual delivery.
i
1.1.1 Efficient Market Hypothesis
The weak-form efficiency hypothesis of t-bill market just like foreign exchange markets, presents
testable implications for the time series behavior of systems of spot interest rates. Findings of
cointegration in systems of spot interest rates just like spot exchange rates (Alexander and
Johnson (1992), Lopez (1996) would seem to contradict the market efficiency hypothesis. A
cointegrated system would imply the presence of predictability of t-bill interest rate. The t-bill
interest rate market efficiency implies that, if the market is efficient, then there are no remaining
ex-ante opportunities for making profits through speculation.
2
Page 11
Rationally, an efficient Treasury bill market utilizes available information efficiently in forming
its expectations about the future yields. Studies on the efficiency of the U. S. Treasury bill market
include those by Roll (1970), Sargent (1972), Hamburger and Platt (1975), and Fama (1975,
1976a,b). Studies by Campbell and Shiller (1988), Stock and Watson (1988), and Hall, Anderson
and Granger (1992), recognize the nonstationarity of the bill yields and find that their term
structure is well modeled as a cointegrated system.
The t-period spot rate is the interest rate on a pure discount bond whose life extends from today
through t future periods. Thus for pure-discount bonds with maturities of one, two, and three
years, spot rates for one, two, and three years can be determined. This suggests that the spot rate
of interest (st) for each t is the bonds market discount rate for a bond’s cash flow that is to be
received in period t. After the spot rates have been determined, it is a straight forward matter to
determine the corresponding set of discount factors. The set of discount factors, also referred to
as the market discount function are used to determine the present value of bonds.
The forward rate is the expected yield during some future period - e.g., the forward rate for year
three is the one year rate expected to prevail in year three (three years from now). The t-period
forward rate t periods in the future is represented by the interest rate, determined today, on a pure
discount bond that will come into existence t periods from today and mature t periods after t-1.
3
Page 12
1.1.2 Treasury Bills M arket
Treasury bills are the most important money instrument. During the first five months of the fiscal
year 2007/08, Government domestic debt increased by 5.3 percent from Ksh 404.7 billion in June
2007 to Ksh 426.0 billion in November 2007. The rise in domestic debt during the period
reflected increases of Ksh 21.6 billion and Ksh 3.6 billion in Treasury bonds and other domestic
debt, respectively. These increases were, however, partly offset by a decrease of Ksh 3.9 billion
in Treasury bills.
The amounts tied in Treasury bills show its importance in the money and capital market.
Treasury bills (excluding Repos) decreased from Ksh 94.4 billion in June 2007 to Ksh 90.6
billion in November 2007. Consequently, Treasury bills, expressed as a percentage of overall
domestic debt, decreased from 23.3 percent to 21.3 percent during the period. Treasury bills held
by commercial banks decreased from Ksh 45.1 billion or 47.7 percent in June 2007 to Ksh 36.9
billion or 40.8 percent in November 2007. The share of 91-day Treasury bills in outstanding
Government securities increased from 6.0 percent to 8.3 percent while 182-day Treasury bills
decreased from 19.7 percent to 15.3 percent during the period.
The importance of efficiency in Treasury bill market is that rational investors will not invest in
any risky asset that offer returns that is equal to or less than return on security issued by treasury.
Treasury bills can be transacted readily due to existence of active secondary market and that they
enjoy zero default risk and negligible price risk. They represent the obligations of the
Government of Kenya which have a primary tenor like 91 and 182 days. They are sold on an
auction basis every week in certain minimum denominations by the Central Bank of Kenya. They
do not carry an explicit rate or coupon rate. Instead they are sold at a discount rate to be
4
Page 13
redeemed at a later date at a value equal to its face value. This means that the implied yield of a
treasury bill depends on both the size of the discount and the period of maturity.
1.1.3 Term Structure of Interest Rates
There are four different theories that explain term structure of interest rates. The pure
expectations hypothesis asserts that investors are expecting higher short-term rates in the future.
In which case, the forward rate curve would be even steeper than the currently prevailing yield
curve which is the geometric average of these future short-term rates. The liquidity hypothesis
would imply that this upward sloping yield curve is a natural by-product of risk averse investors
who require a higher yield to invest in longer term securities because of the higher risk involved -
i.e., the greater volatility of longer maturity securities. The assertion under the market
segmentation hypothesis is that there is greater demand for short-term securities by those who
have an interest in this segment of the market. Therefore, those institutions that tend to invest in
the short-term segment of the yield curve have greater funds at the present time compared to
those who have an interest in long-term securities. Then there is the preferred habitat hypothesis
that is intermediate between the liquidity preference and segmented market hypothesis. The
preferred habitat theory holds that various investors and borrowers have segments in the market
in which they prefer to operate. However such investors are assumed to be willing to leave their
desired maturity segments if there are significant differences in yields between various segments.
The theory relied on in this study is the pure expectations hypothesis.
5
Page 14
1.2 Statement of the Problem
The base interest rate on securities issued by the Government is the basis for analyzing returns
from investment in financial assets such as stocks and bonds, i.e. interest rate on Treasury
securities is the benchmark interest rate in modern economies.
Studies on the efficiency of the U. S. Treasury bill market include those by Roll (1970), Sargent
(1972), Hamburger and Platt (1975), and Fama (1975, 1976a, b) report that forward rates and
spot rates are cointergrated and that the T-bill market is efficient. Campbell and Shi Her (1988),
Stock and Watson (1988), and Hall, Anderson and Granger 1992),recognize the non-stationarity
of the bill yields and report that their term structure is cointegrated. In an earlier study in Canada,
Park (1982) found that the weekly bill auction market was efficient.
Various studies in Kenya that have touched on market efficiency have not specifically dealt with
the efficiency of the Treasury bill market in Kenya. These studies have found that the foreign
exchange and securities markets are largely inefficient.
Langat (1998) for instance carried out a study on the impact of Treasury bills rates volatility on
corporate investments and concluded that there is a positive and significant influence of T-bill
rates on commercial investment in Kenya.
Thus this study explores this line of research (in Kenya) and provides insight into the Treasury
bill market whose efficiency is central to efficiency of money and capital markets. This study
6
Page 15
also extends earlier study (elsewhere) by using data in an emerging economy. How accurate are
forward rates in predicting the expected spot rate?
1.3 Objective of the study
The objective of this study is to test the efficiency of the Treasury Bills Market.
1.4 Importance of this Study
The study is useful to the following stakeholders:
1. Corporate managers and investment advisors when pricing financial securities.
2. Treasury managers with an interest in forecasting future spot rates.
3. Central Bank of Kenya and Treasury in understanding changes in Treasury bill yield curves.
4. Investors and general public in making decisions about their market expectations.
5. Academic researchers can use the study in conducting further research in related fields.
7
Page 16
CHAPTER 2
2.0 Literature review
2.1 Efficient Market Hypothesis
The Efficient Market Hypothesis (EMH) is about informational efficiency’ It implies that
investors and their agents have the capacity to efficiently discount the available information in
the security prices. It has its origins in the rational expectations theory that requires prices to take
into account all relevant information disclosed to the market (Jensen, 1978). However, the EMH
does not imply that prices will always be “correct”! It simply implies consensus in the market and
that there are no free lunches. Furthermore, the EMH does not require every market player to be
well-informed. Market prices are formed by the actions of the majority. The presence in the
market of several risk-averse, rational agents, who maximize their wealth, is a sufficient
condition for prices to contain all relevant information.
In this study the fundamental assumption is that if markets are efficient then spot and forward
interest rates will adjust immediately to the arrival of new information. However the arrival of
information is unpredictable. The unpredictable movements in spot and forward rates raise the
question whether the Treasury bill market is efficient. The theoretical debate on market efficiency
started with the famous Fama (1970) definition of market efficiency. That definition put in
context of this study would imply that the forward rate should be the best predictor of future spot
rate.
Moreover, the Treasury bill market might be judged inefficient either because period to period
movements in spot rates are serially correlated, or because forward rates are not unbiased
8
Page 17
predictors of future spot exchange rates. Much of the recent evidence on asset market efficiency
has been difficult to interpret.
2.2 Efficiency of Treasury Bill Market
The Treasury bill market is said to be efficient if it utilizes available information efficiently in
forming its expectations about the future yields. Future yield are important because they are used
to discount future cash flow to their present value. This is an important stage in bond valuation.
Earlier studies on the efficiency of the U. S. Treasury bill market include those by Roll (1970),
Sargent (1972), Hamburger and Platt (1975), and Fama (1975, 1976a, b). More recent studies,
including Campbell and Shiller (1988), Stock and Watson (1988), and Hall, Anderson and
Granger (1992), recognize the non-stationarity of the bill yields and find that their term structure
is well modeled as a co-integrated system.
A forward interest rate is the rate one can contract now for a commitment to buy a one-period
bond in the future. One would therefore expect a strong correlation between current one period
forward rate and future spot (one period) interest rates.
Early tests of this hypothesis employed US Treasury bills, and the results are that forward rates
do not seem to predict spot rates, except perhaps a month or two ahead [Hamburger and Platt
(1975), Shiller, Campbell, and Schoenholtz (1983), Fama (1984)]. Fama and Bliss (1987) find,
however, that when the forecast horizon is extended, longer term forward rates have strong power
to forecast spot rates. They attribute this forecast power to slow mean reversion of the spot rate
that only becomes evident over long horizons.
9
Page 18
The evidence in Fama and Bliss (1987) that forward interest rates forecast future spot interest
rates for horizons beyond a year repeats in the out-of-sample 1986-2004 period. The
predictability of the spot rate captured by forward rates seems to be due to mean reversion toward
a time-varying expected value that is subject to a sequence of apparently permanent shocks.
2.2.1 Rational Expectation Hypothesis
The rational expectation hypothesis states that in an efficient market participant agents do no
expect to earn above normal profit, except by chance, by systematically using available
information (Billson, 1981). This definition of the market efficiency hypothesis requires that: the
market is competitive; information is costless to acquire and it is used rationally; transaction cost
is zero (Goss, 1983). In order to be an efficient market in treasury bills i.e. where current forward
rates are equal to expected forward rates, it is necessary that there is no risk-free gain in that
market; in which we should not expect significant differences between forward rates and
expected forward rates.
In Treasury bill markets, this condition is satisfied through arbitrage by which equilibrium rates
across the t-bill of different maturities are established such that no one is making profits by
trading one Treasury bill for another at any point in time.
In summary, market efficiency is defined not as well only for a point of time (spot market), but
over time (futures and forward market) (Levich, 1979). This interpretation of market efficiency
means that the forward rate by itself is the best forecast of the future spot rate. This means that
market players cannot make better forecasts than the forward rate. In other words, the available
information is already fully utilized and reflected by forward rate. In terms of investment strategy
10
Page 19
this means that, in t-bill market, the roll over strategy cannot be replaced by maturity strategy to
earn profits because the values are identical.
2.3 Term Structure of Interest Rates
There are four main economic theories attempting to explain how yields vary with maturity. Two
of the theories are extreme positions, while the third attempts to find a middle ground between
the former two.
2.3.1 Market Expectations (Pure Expectations) Hypothesis
This hypothesis assumes that the various maturities are perfect substitutes and suggests that thei
shape of the yield curve depends on market participants' expectations of future interest rates.
( i + i l tr = ( i + i r r lx i + i yr 2) • • ■ ( ! + i \ r n )
These expected rates, along with an assumption that arbitrage opportunities will be minimal, is
enough information to construct a complete yield curve. For example, if investors have an
expectation of what 1-year interest rates will be next year, the 2-year interest rate can be
calculated as the compounding of this year's interest rate by next year's interest rate.
More generally, rates on a long-term instrument are equal to the geometric mean of the yield on a
series of short-term instruments. This theory perfectly explains the stylized fact that yields tend to
move together.
In the early literature, a special importance is given to test the unbiased expectation hypothesis
vdiich is the special case of the market efficiency hypothesis. It is based on the assumption of the
risk neutrality of the participants.
11
Page 20
However, the rejection of the unbiased hypothesis does not lead us to rejection o f the market
efficiency hypothesis. Forward rates can differ from the future spot rate because of transaction
costs and/or risk premium. It is also important to note that interest rate, whether it is a spot or
forward rate, reflect current information at the time of quotation. Hence one cannot expect these
rates to reflect same information after their quotation. Some events (e.g. government
intervention) cannot be reflected in forward interest rate although this can be reflected in future
spot rates.
2.3.2 Liquidity Preference Theory
The Liquidity Preference Theory asserts that long-term interest rates not only reflect investors’
assumptions about future interest rates but also include a premium for holding long-term bonds,
called the term premium or the liquidity premium. This theory is therefore an offshoot of the Pure
Expectations Theory. This premium compensates investors for the added risk of having their
money tied up for a longer period, including the greater price uncertainty. Because of the term
premium, long-term bond yields tend to be higher than short-term yields, and the yield curve
slopes upward. Long term yields are also higher not just because of the liquidity premium, but
also because of the risk premium added by the risk of default from holding a security for a long
term.
2.3.3 Market Segmentation Theory
This theory is also called the segmented market hypothesis. In this theory, financial instruments
of different terms are not substitutable. As a result, the supply and demand in the markets for
short-term and long-term instruments is determined independently. Prospective investors would
12
Page 21
have to decide in advance whether they need short-term or long-term instruments. Due to the fact
that investors prefer their portfolio to be liquid, they will prefer short-term instruments to long
term instruments. Therefore, the market for short-term instruments will receive a higher demand.
Higher demand for the instrument implies higher prices and lower yield. This explains the
stylized fact that short-term yields are usually lower than long-term yields. This theory explains
the predominance of the normal yield curve shape. However, because the supply and demand of
the two markets are independent, this theory fails to explain the observed fact that yields tend to
move together (i.e., upward and downward shifts in the curve).In an empirical study in 2000,
Alexandra E. MacKay, Eliezer Z. Prisman, and Yisong S. Tian found segmentation in the market
for Canadian government bonds, and attributed it to differential taxation.
For a brief period in the last week of 2005, and again in early 2006, the US Dollar yield curve
inverted, with short-term yields actually exceeding long-term yields. Market segmentation theory
would attribute this to an investor preference for longer term securities, particularly from pension
funds and foreign investors who prefer guaranteed longer term yields.
2.3.4 Preferred Habitat Theory
The Preferred Habitat Theory states that investors have distinct investment horizons and require a
meaningful premium to buy bonds with maturities outside their "preferred" maturity, or habitat.
Supporters of this theory believe that short-term investors are more prevalent in the capital
market and therefore, longer-term rates are normally higher than short-term rates. However,
short-term rates can be higher than long-term rates occasionally i.e. the reverse yield. The
pieferred habitat theory therefore represents a middle ground between the market segmentation
theory and the market expectations theory. It seems to explain both the persistence of the normal
13
Page 22
yield curve shape and the tendency of the yield curve.to shift up and down while basically
retaining its shape.
2.4 Market Efficiency Tests in T-Bill Market
From the above formulation, it becomes clear that the market efficiency hypothesis is conditional
on the set of information available at the time forward rates are quoted and it is valid under the
fulfillment of all conditions. In which case, the difference between forward rate and comparable
spot rate could be due to arrival of new information. This make the test of the EMH heavily
dependent upon the definition of the information set. According to the level of information,
following the work of Fama (1970), the test of market efficiency can be made as a weak form, a
semi-strong form or as a strong form efficiency test.
In the weak form of the test, the information set contains only the historical exchange rates of the
currency in question. In the case of a semi-strong form test, the set contains all publicly available
information in addition to its own historical exchange rates. In the strong form of the test, inside
information in addition to publicly, available information is included to the set. The difficulty of
obtaining knowledge about the distribution and the level of inside information makes it
impossible to test the hypothesis in the strong form.
In this study the market efficiency will be tested in semi-strong form. The semi-strong form of
the test can be divided into two sub-groups according to the variables which have been used to
construct the information set. The first group may be called "simple semi-strong form and the
information set consist of treasury bills of different maturities. The second group information set
may contain the information related to other variables such as GNP, money supply, and interest
14
Page 23
rates on risky assets. The underlying assumption of the simple semi-strong form is that exchange
rates reflect all publicly available information.
2.4.1 Efficient iMarket, Spot Rate and Forward Rates
Fama and Bliss (1987) present evidence that forward interest rates forecast future spot interest
rates for horizons beyond a year and confirms the same in the out-of-sample 1986-2004 period.
But their explanation that the forecast power is due to mean reversion of the spot rate toward a
constant expected value is no longer valid. Instead, the predictability of the spot rate captured by
forward rates seems to be due to mean reversion toward a time-varying expected value that is
subject to a sequence of apparently permanent shocks that are on balance positive to mid-1981
and on balance negative thereafter.
A market is efficient if nobody can obtain abnormal profit in the long run by using publicly
available information. Hence if a market is efficient, in the long run nobody can make any
extraordinary profit, in which case a spot rate has a long run equilibrium relationship with a
forward rate.
Recall that in an efficient market nobody can obtain extraordinary profit in the long run by using
publicly available information. Hence if a market is efficient, in the long run nobody can make
any extraordinary profit: Such that the difference between expected spot rate and forward rate is
zero i.e. E (St+1 - Ft) = 0. This implies that a spot rate has a long-run equilibrium relationship
with a forward rate; which in itself is a testable proposition.
Park (2000) examines if the spot and forward interest rates of the Canadian Treasury bill market
are cointegrated and test the bill market efficiency. The data used are monthly average yields of
15
Page 24
three- and six-month Treasury bills from July 1962 to February 1996. Both spot and forward
rates are found to be 1(0) and cointegrated in the Engle-Granger (1987) sense.
2.5 Market Efficiency in Kenya
Various studies in Kenya that have touched on market efficiency have not specifically dealt with
the efficiency of the Treasury bill market.
Langat (1998) who studied the impact of Treasury bills rates volatility on corporate investment-
the case of commercial banks (using 91-day T-bills) concluded that there exists a positive and
significant influence of T-bill rates on commercial investment.
Kiio (2006) found market adjusted excess returns to be significant for the 10 days before and 10
days after dividend announcement for cash dividend paying firms in her research on market
efficiency and the effects of cash dividend announcements on share prices of companies listed on
the Nairobi Stock Exchange.
Ndunda (2002) examined EMH for the foreign exchange market in Kenya and found out that
there exists strong evidence against the simple efficiency hypothesis for the major currencies in
his study on testing whether forward exchange rates are predictors of future spot rates in Kenya.
Muhoro (2005) and Kurgat (1998) studied efficiency of the foreign exchange market in Kenya
and found the market to be inefficient due to occurrence of huge arbitrage opportunities in the
market. Kurgat (1998) found that there exists higher arbitrage opportunity in bureaus than in
banks.
16
Page 25
2.6 91-Day and 182-Day T-Bill Rates
In finance, differences in expected returns are usually interpreted as rewards for risk and time.
This makes it possible ordering and comparing returns across maturities. The liquidity preference
hypothesis tells us that expected return always increase with maturity. This is at variance with
models that allow for time-varying expected returns. Fama and Bliss (1987) find, however, that
when the forecast horizon is extended, longer-term forward rates have strong power to forecast
spot rates. They attribute this forecast power to slow mean reversion of the spot rate that only
becomes evident over long horizons.
Theoretically we expect the equivalent yield of the six month (182 days) Treasury bill to be at
least twice if not more, than that of the three month (91 days). The reason is the effect of
compounding the discount of the first three month period over the second 3-month period.
2.7 Summary
There have been various studies on Efficient Markets but none has been conclusive as evidenced
in the past literature. EMH theory has been met with a lot of opposition especially from the
technical analysts, Goodman (1979). Their argument is that many investors base their
expectations on past prices, past earnings, track records and other indicators. Past prices do
influence future prices. In Kenya, similar studies have also been carried out but this touch on
spot market efficiency of foreign exchange market and volatility of Treasury bill rate. None of
the local studies has touched on Efficiency of the Treasury Bill Market.
17
Page 26
This study therefore is to try and bridge this gap in research. It will endeavor to establish the
relationship between spot and forward T-bill interest rates as well as answer the question as to
whether it is possible to use forward rates to forecast future movement of the spot rates in the
Kenyan Treasury bill market.
18
Page 27
CHAPTER 3
3.0 Research Methodology
This is an empirical study on the relationship between forward rates and future spot rates, using
Kenyan Treasury Bill data.
To calculate the forward rate between period’s t-1 and t the following formula can be used:
(1 + ft.,.,) = (! +s,)7(l + st.,)‘-'
The spot rate for t periods is given by:
(1 + st)‘= ( l+ f , . l, ,)x ( l+ s t.,)M
Where:
S is spot rate; f is forward rate; t is years to maturity.
3.1 Population
The population of interest consists of all weekly yields on 91-day and 182-day T-bills for six
years, from 18th February 2002 to 17th March 2008. This is current data. This short period is
necessary if we assume that spot rates and forward rates are stationary. Appendix 1 gives details
ot these weekly returns.
19
Page 28
3.2 Data Collection Method
The study will use secondary data from The Central Bank of Kenya. This shall be obtained from
CBK monthly and yearly Economic Reviews. The data will be limited to 6 years from 2002 to
2008 with the assumption that spot rates and forward rates are stationary. .
3.3 Variables of the Study
Three variables will be employed in this study, namely the yield on 91-day, 182-day and forward
rates. Relying on the assumption that the yield and spot rate are identical on a pure discount
bond, the implied forward rate is:
(l+ft.,) = (l+St),/(l+S t.1
(l+f9U82) = (l+ S 182 ) l82/(l+S9i)9'
If we assume a constant premium (for term, liquidity or risk), then the equation that defines the
equilibrium relationship between forward rate and future spot rate, is:
ft = Et (St+3.I) + P
Where:
ft = forward rate implied when we relate the yield on 91 day treasury bills to the yield on 182 day
treasury bills.
I = Information set
20
Page 29
p = constant premium
The Treasury bill market is efficient if its assessment of future spot rates incorporates all
information at month t, such that: St+3 =Et (St+3.It) + Ut+3
Where:
St+3 = the three month spot rate at month t+3,
Et = is the conditional operator
It = is the information set at time t
Ut+3 = the forecast error or part of St+3 which is unpredictable at month t.
3.4 Data Analysis
The study will use regression analysis to the relationship between forward rates (ft) and future
spot rates (St+3):
Actual Future spot rate = a + B (forward rate)
The efficient market hypothesis would imply that the coefficient of ft generated by regression
equation is equal to one ( 1) if St+i is to be equal to ft.
21
Page 30
CHAPTER FOUR
4.0 Data Analysis and Findings
4.1 Introduction
The results of the analysis are represented in this chapter. The objective of this study is to
determine how accurate forward rates are in predicting the expected spot rate (esi 2)- The
Efficient Market Hypothesis (EMH) is related to the concept of informational efficiency, agents’
efficient exploitation of the available information set. This study has its foundations on unbiased
expectations theory (UET). The UET holds that the forward rate represents average opinion of
what expected future spot rate for the period in question will be. In equilibrium the UET states
that the expected spot rate is equal to the forward rate:
es 12 ~fi,2
The null hypothesis is that the spot rate is equal to the forward rate.
4.2 Descriptive Statistics
This study employed data for the period 18th February 2002 to 17th March 2008. In the total there
were data for 316 weeks. The 91-day and 182-day Treasury bills weekly returns were from issue
No. 1456 to issue No. 1773.
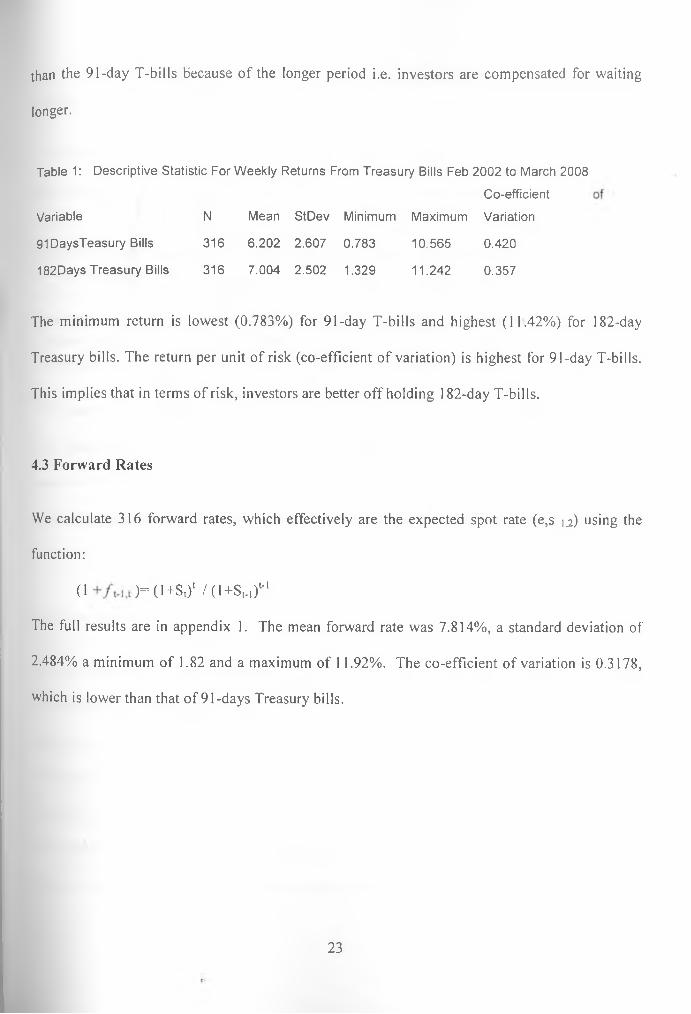
Below is a summary of the descriptive statistics of the 91-day and 182-day T-bills returns
employed in this study. The 91-day T-bills have the average return of 6.202% compared to
7.004% for the 182-day T-bills. Theoretically the return on 182-day T-bills should be higher
22
Page 31
than the 91-day T-bills because of the longer period i.e. investors are compensated for waiting
longer.
Table 1: Descriptive Statistic For Weekly Returns From Treasury Bills Feb 2002 to March 2008
Variable N Mean StDev Minimum Maximum
Co-efficient
Variation
91DaysTeasury Bills 316 6.202 2.607 0.783 10.565 0.420
182Days Treasury Bills 316 7.004 2.502 1.329 11.242 0.357
The minimum return is lowest (0.783%) for 91-day T-bills and highest (11.42%) for 182-day
Treasury bills. The return per unit of risk (co-efficient of variation) is highest for 91-day T-bills.
This implies that in terms of risk, investors are better off holding 182-day T-bills.
4.3 Forward Rates
We calculate 316 forward rates, which effectively are the expected spot rate (e,s 1,2) using the
function:
(1 )=(l+s,)‘ /(1+S,.,)1-'
The full results are in appendix 1. The mean forward rate was 7.814%, a standard deviation of
2.484% a minimum of 1.82 and a maximum of 11.92%. The co-efficient of variation is 0.3178,
which is lower than that of 91-days Treasury bills.
23
Page 32
4.4 Expected Spot Rates and Actual Spot Rates
To compare the actual spot rate with expected forward rates (es) or forward rates, we lag the 8
observed spot rates. The summary of these two variables are as follows:
Table 2: Descriptive Statistic For Weekly Returns From Treasury Bills Lag and Forward Rates
Feb 2002 to March 2008
Co-efficient of
Variable N Mean StDev Minimum Maximum Variation
91DaysT. Bills 315 6.188 2.599 0.783 10.469 0.420
91 Forward Rate 315 7.811 2.488 1.82 11.923 0.319
The mean forward rate is higher than the comparable spot rate and less variable if we compare
their standard deviations. The next question is whether these two variables are different i.e. is the
mean of forward rate of 7.811% statistically higher than the actual spot rate of 6.188%? The
variability as measured by standard deviation show wider fluctuation in actual spot rate than
expected.
4.5 Forward Rates and Actual Spot Rates Test for Equal Variances
We use variance test to perform hypothesis tests for equality or homogeneity of variance between
forward rates and actual spot rates. Statistical procedures, including analysis of variance, assume
that although different samples may come from populations with different means, they have the
same variance.
Analysis of variance (ANOVA) is similar to regression in that it is used to investigate and model
the relationship between a response variable and one or more independent variables. However,
analysis of variance differs from regression in two ways: the independent variables are qualitative
24
Page 33
(categorical), and no assumption is made about the nature of the relationship (that is, the model
does not include coefficients for variables). In effect, analysis of variance extends the two-sample
t-test for testing the equality of two population means to a more general null hypothesis of
comparing the equality of more than two means, versus them not all being equal.
4.6 First Test of ANOVA
This test determines whether the 91-day and 182-day Treasury bills are different. They appear
different as the 91-day TB reports a mean of 6% while the 182-day reports a mean of 7%, a
difference of 1%. This is in line with the theory that assets of longer maturity tend to give higher
returns as compensation. P value of 0.00 confirms this.
Table 3: One-way ANOVA: 91DaysTB, 182DaysTB
Analysis of VarianceSource DF SS MS F PFactor 1 101.54 101.54 15.55 0.000Error 630 4112.66 6.53Total 631 4214.20
Individual 95% CIs For MeanBased on Pooled StDev
Level N Mean StDev — +--------+-------- +----- -- + —9lDaysTB 316 6.202 2.607 ( --------------* . -----)182DaysT 316 7.004. 2.502 ( * ---- )
— +--------+-------- +----- -- +--Pooled StDev = 2.555 6.00 6.40 6.80 7.20
4.7 ANOVA for 91-Days TB Lag and Forward Rate Lag
This test the hypothesis that means of several populations are equal. It is an extension of T-test,
specifically for the case where the population variances are assumed to be equal like in the case
of expected spot rates and actual spot rates.
This test determines whether the forward rate is equal to the expected spot rate. We find that they
are not equal. The forward rate tends to be higher than the comparable spot rate. This suggests
25
Page 34
existence of forward premiums. The theory that might explain this phenomenon is the liquidity
preference theory as opposed to the unbiased expectations theory.
Table 4: One-way ANOVA: 91DaysTBIag, ForRatelag
Analysis of VarianceSource DF SS MS F PFactor 1 414.80 414.80 64.09 0 . 000Error 628 4064.38 6.47Total 629 4479.18
Individual 95% CIs For MeanBased on Pooled StDev
Level N Mean StDev — +--------91DaysTB 315 6.188 2.599 (----- -)ForRatel 315 7.811 2.488 (■--+-----Pooled StDev = 2.544 6.00 6.60 7.20
4.8 The Main Effect Plot
1 he main effect plot is used to compare the impact of the two Treasury bills on forward rates.
G raph 1 Main h t t e c t s Plot - Data M ean s tor Forward R a te s and 91 d ay s and 182 Days T Bills
Page 35
The points in the plot are the means of the response variables at the various levels for each
factor, with a reference line drawn at the grand mean of the response data forward rate. The
effects are the differences between the means and the reference line. From the graph above we
see that the 91-day Treasury bills effects upon forward rate are large compared to the effects of
182-day Treasury bills on forward rates.
Our finding is that the mean and variance of 91-day Treasury bill is different from that of 182-
day Treasury bill. The P-value for the ANOVA is 0.000 at a commonly used x-level of 0.05 for
the test, and we conclude that there are no significant differences in the return between the two
bills.
The same conclusion is reached when we compare the actual spot rate with forward rates.
The P-value of 0.000 confirms no significant differences between mean actual spot rate and
expected spot rate.
4.9 Forecasting Spot Rate
The dependent variable is the 91-day spot rate whereas the expected forward rate is the spot rate.
The results of the regression are summarized below.The regression equation is 9lDaysTBlag = - 1.41 + 0.972 ForRatelag
Predictor Coef SE Coef T PConstant -1.4069 0.1772 -7.94 0.000ForRatel 0.97236 0.02162 44.97 0.000S = 0.9530 R-Sq = 86.6% R-Sq(adj) = 86.6%
The slope 0.972 is the change in forward spot rate when forward rate changes by 1 i.e. it is almost
one to one. The constant intercept value of - 1.407 is the predicted spot rate when predictor
forward rate is zero. The co-efficient P-value tells us whether or not the association between the
27
Page 36
iespouse and the prediction is statistically significant. In our case, a P-value of 0.000 show that
the lelationship is statistically significant i.e. you can use forward rates to predict spot rates. The
R2 rePresent the proportion'of variation in the response data explained by the predictors i.e.
86.6% in our case.
28
Page 37
CHAPTER 5
5.0 Conclusions
In this paper we focus mainly on the expectations hypothesis applied to the Treasury bill market
to test whether it could be considered efficient in that way. According to our findings presented in
chapter four, the estimates provided prove that this market is not efficient.
The basic statistical analysis shows that, there is a relationship between spot and forward
exchange rates and that when the time arrives the actual spot rates tend to be lower than the
hitherto expected forward rates. This could confirm the view, shared by many authors, that the
forward exchange rate contains a risk premium.
However, we find that the forward rates have incremental information for the future changes in
the spot exchange rates, given that they move towards the same direction.
5.1 Recommendations for Further Research
This study finds that forward rates are not accurate predictors of future or expected spot rates.
The information content of the market players need to be researched to determine which
economic variables would exactly predict the future spot rates.
It would also be of interest to carry out further research on the level of cointegration in the
Kenyan Treasury Bills market.
29
Page 38
5.2 Limitation of this Study
The short period of research made it difficult collecting and analyzing data for earlier periods
before the year 2002. If time could allow, other advanced models could be used in similar studies.
30
Page 39
REFERENCES
Campbell, J. Y. and R. J. Shiller (1987), Cointegration and Tests of Present Value Models,
Journal o f Political Economy 95, 1062-1088.
Davidson, R. and J. G. MacKinnon (1993), Estimation and Inference in Econometrics, NewYork:
Oxford University Press.
Engle, R. F. and C. W. J. Granger (1987), A Cointegration and Error Correction:
Representation, Estimation, and Testing, Econometrica 55, 251-76.
Fama, E (Jan. 1965): “The Behaviour of Stock Market Prices”, Journal of Business, 38, pp 34-
105.
Fama, E (May, 1970): “Efficient Capital Markets: A Review of Theory and Empirical Work”,
Journal of Finance, 383-412
Fama, E. F. (1975), Short-Term Interest Rates as Predictors of Inflation, American Economic
Review 65, 269-282.
Fama, E. F. (1976a), Inflation Uncertainty and the Expected Returns on Treasury Bills, Journal
of Political Economy 84, 427-448.
Fama, E. F. (1976b), Forward Rates as Predictors of Future Spot Rates, Journal o f Financial
Economics 3, 361-377.
Hall, A. D., H. M. Anderson, and C. W. J. Granger (1991), Cointegration Analysis of Treasury
Bill Yields, Review o f Economics and Statistics 73, 116-126.
Hamburger, M. J. and E. N. Platt (1975), Expectations Hypothesis and the Efficiency of the
Treasury Bill Market, Review o f Economics and Statistics 57, 190-199.
31
Page 40
Kiio, Kanini E. (2006): “An Empirical Investigation into Market Efficiency and the effects of
cash divided announcements on Share Prices of Compound listed on the Nairobi Stock”,
(University of Nairobi).
Kurgat, P (1998); “An Empirical study of spot Market Efficiency in Kenya’s Foreign Exchange
Bureaus” (University of Nairobi).
Langat, Stanley C. (1998): An Empirical study of the Impact of Treasury Bill Rates volatity on
Corporate Investment. The case of Commercial Banks in Kenya, (University of Nairobi).
Muhoro Judith W. (2005): Determining the Efficiency of the Forex Market in Kenya,
(University of Nairobi).
Ndunda, F.K. (2002): Testing whether Forward Exchange Rates are Predictors of Future Spot
Rates in Kenya”, (University o f Nairobi).
Park, S. (2000): A Test of The Market Efficiency Hypothesis with An Application to Canadian
Treasury Bill Yields, Carleton Economic Papers, Carleton University, Department of Economics.
Roll, R. (1970), The Behavior o f Interest Rates: An Application o f the Efficient Market Model to
U. S. Treasuiy Bills, New York: Basic Books.
Sargent, T. (1972), Rational Expectations and the Term Structure of Interest Rates, Journal o f
Money, Credit and Banking 4, 74-97.
Sharpe, W.F., Alexander, G.J., and Bailey, J.V (1999): Investments. Sixth Edition, Prentice Hall.
Stock, J. H., and M. W. Watson (1988), Testing for Common Trends, Journal o f the American
Statistical Association 83, 1097-1107.
32
Page 41
Appendix 1
W eekly TB rates
Date IssueNo 91DaysTB 182DaysTB Period ForRate 91DaysTBIag ForRatelag Class Return -18-Feb-02 1457 10.565 11.242 1 11.92 10.47 11.92 0 10.46925-Feb-02 1458 10.469 10.995 2 11:52 10.33 11.52 0 10.333
4-Mar-02 1459 10.333 10.803 3 11.28 10.15 11.28 0 10.14711-Mar-02 1460 10.147 10.645 4 11.15 10.05 11.15 0 10.05118-Mar-02 1461 10.051 10.516 5 10.98 1005 10 98 0 10.04525-Mar-02 1462 10 045 10.423 6 10.80 10.08 10.80 0 10.075
1-Apr-02 1463 10.075 10.447 7 10.82 10.10 10 82 0 10.0978-Apr-02 1464 10.097 10.524 8 10.95 10.08 10.95 0 10.078
15-Apr-02 1465 10.078 10 511 9 10.95 9.98 10.95 0 9 98222-Apr-02 1466 9.982 10.471 10 10.96 9.82 10.96 0 9.81829-Apr-02 1467 9.818 10.419 11 11.02 9.65 11.02 0 9 6476-May-02 1468 9.647 10.347 12 11.05 9 32 11.05 0 9.315
13-May-02 1469 9.315 10.18 13 11.05 8.87 11.05 0 8.86820-May-02 1470 8.868 9.891 14 1092 8.33 10.92 0 8.32927-May-02 1471 8.329 9.499 15 10.68 7.72 10.68 0 7.716
3-Jun-02 1472 7 716 9.07 16 10.44 7.13 10.44 0 7.13210-Jun-02 1473 7.132 8.651 17 10.19 7.01 10.19 0 7.00617-Jun-02 1474 7.006 8.632 18 10.28 7.50 10.28 0 7.49824-Jun-02 1475 7.498 8.859 19 10.24 8.31 10.24 0 8.306
1-Jul-02 1476 8.306 9.127 20 9.95 8.73 9.95 0 8.7328-Jul-02 1477 8.732 9.377 21 10.03 8.78 10.03 0 8.779
15-Jul-02 1478 8.779 9.41 22 10.04 8.74 10 04 0 8.7422-Jul-02 1479 8.74 9.395 23 10.05 8.61 10.05 0 8.61129-Jul-02 1480 8.611 9 503 24 10.40 8.43 10.40 • 0 8.4285-Aug-02 1481 8 428 9.495 25 10.57 8.32 10.57 0 8.315
12-Aug-02 1482 8.315 9.468 26 10.63 8.32 10.63 0 8.32219-Aug-02 1483 8.322 9.5 27 10.69 8.29 10.69 c 8.29326-Aug-02 1484 8.293 9.49 28 10.70 8.08 10.70 0 8.075
2-Sep-02 1485 8.075 9.163 29 10.26 7.85 10.26 0 7.8489-Sep-02 1486 7.848 8.852 30 9.87 7.58 9.87 0 7.575
16-Sep-02 1487 7.575 8.443 31 9.32 7.24 9.32 0 7.24123-Sep-02 1488 7.241 8.324 32 9 42 7.27 9.42 0 7.26530-Sep-02 1489 7.265 8.32 33 9.39 7.54 9.39 0 7.535
7-Oct-02 1490 7.535 8.353 34 9.18 8.04 9.18 ' 0 8.03614-Oct-02 1491 8.036 8.494 35 8.95 8.28 8.95 0 8 28121-Oct-02 1492 8.281 8.578 36 8.88 8.41 8.88 0 8.40928-Oct-02 1493 8.409 8 75 37 9.09 8.36 9.09 0 8.3634-Nov-02 1494 8.363 8.75 38 9.14 8.30 9.14 0 8.303
11-Nov-02 1495 8 303 8.742 39 9.18 8.25 9.18 0 8.24518-NOV-02 1496 8.245 8.715 40 9.19 8.28 9.19 0 8.28325-Nov-02 1497 8.283 8.827 41 9.37 8.34 9.37 0 8.338
2-Dec-02 1498 8 338 8 885 42 9.43 8.37 9.43 0 8.3659-Dec-02 1499 8.365 8.857 43 9.35 8.39 9.35 0 8.393
16-Dec-02 1500 8.393 8.722 44 9.05 8 37 9.05 0 8.37323-Dec-02 1501 8 373 8.715 45 9.06 8.42 9.06 0 8.41930-Dec-02 1502 8.419 8 7 5 46 9.08 8.48 9.08 0 8.478
6-Jan-03 1503 8.478 8.75 47 9.02 8.42 9 02 0 8.41513-Jan-03 1504 8.415 8.75 48 9.09 8.35 9.09 0 8.35220-Jan-03 1505 8.352 8.713 49 9.08 8.29 9.08 0 8.29127-Jan-03 1506 8.291 8.7 50 9.11 8.15 • 9.11 0 8 1493-Feb-03 1507 8.149 8.643 51 9.14 7.92 9.14 0 7.921
10-Feb-03 1508 7.921 8.349 52 8.78 7.62 8.78 0 7.62317-Feb-03 1509 7.623 8.029 53 8.44 7.40 8.44 0 7.40224-Feb-03 1510 7.402 7.532 54 7.66 6.99 7.66 0 6.989
3-Mar-03 1511 6 989 7.106 55 7.22 6.48 7.22 0 6.48110-Mar-03 1512 6.481 6.715 56 6.95 6.12 6.95 0 6.11517-Mar-03 1513 6.115 6.505 57 6.90 5.82 6.90 0 5.816
33
Page 42
Date IssueNo 91DaysTB 182DaysTB Period ForRate 91DaysTB ForRatelag C lass Return24-Mar-03 1514 5 816 6.499 58 7.19 5.80 7.19 0 5.79631-Mar-03 1515 5.796 6.366 59 6.94 6.09 6,94 0 6.091
7-Apr-03 1516 6.091- ■ 6.571 60 7 05 6.26 7.05 0 6.26414-Apr-03 1517 6.264 6.833 61 ' "‘7.41 '• 6.32 7.41 0 6.32421-Apr-03 1518 6.324 6.985 62 7.65 6.34 7.65 0 6.33628-Apr-03 1519 6.336 6.938 63 7.54 6.18 7.54 0 - 6.1845-May-03 1520 6 184 6.906 64 7.63 6.01 7.63 0 ' 6.008
12-May-03 1521 6Q08 6.807 65 7.61 5.78 7.61 0 5.78219-May-03 1522 5.782 6.696 66 7.62 5.40 7.62 0 5.39926-May-03 1523 5.399 6.299 67 7.21 4.82 7.21 0 4.823
2-Jun-03 1524 4.823 5.547 68 6.28 3 85 6.28 0 ' 3.8549-Jun-03 1525 3.854 4.788 69 5.73 2.52 5 73 0 2.524
16-Jun-03 1526 ‘ 2.524 3.925 70 5.35 2.03 5.35 0 2.02723-Jun-03 1527 2.027 3.425 71 4.84 1.76 4.84 0 1.76330-Jun-03 1528 1.763 2.894 72 4.04 1.54 4.04 0 1.537
7-Jul-03 1529 1.537 2.82 73 4.12 1.55 4.12 0 1.54714-Jul-03 1530 1.547 3.068 74 4.61 1.54 4.61 0 1 54221-Jul-03 1531 1 542 3.015 75 4.51 1.52 4.51 0 1.52228-Jul-03 1532 1.522 2.891 76 4 28 1.48 4.28 0 1.484-Aug-03 1533 1.48 2.6 77 . 3.73 1.36 3.73 0 1.364
11-Aug-03 1534 1.364 2.345 78 3.34 1.04 3.34 0 1.03618-Aug-03 1535 1.036 1.997 79 2.97 0.84 2.97 0 0.84325-Aug-03 1536 0.843 1.519 80 2.20 0.84 2.20 0 0.844
1-Sep-03 1537 0.844 1.359 81 1.88 0.84 1.88 0 0 848-Sep-03 1538 0.84 1.329 82 1.82 0.83 1.82 0 0.832
15-Sep-03 1539 0.832 1.371 83 1.91 0.78 1.91 0 0.78322-Sep-03 1540 0.783 1.34 84 1.90 0.85 1.90 0 0.84929-Sep-03 1541 0.849 1.351 85 1.86 0.98 1.86 0 0.98
6-Oct-03 1542 0.98 1.612 86 2.25 0.93 2.25 0 0.9313-Oct-03 1543 0.93 1.396 87 1.86 1.04 1.86 0 1.03820-0ct-03 1544 1.038 1.445 88 1.85 1.07 1.85 0 1.07427-Oct-03 1545 1.074 1.729 89 2.39 1.13 2.39 0 1.1333-Nov-03 1546 1.133 1.894 90 2.66 1.25 2.66 0 1.249
10-Nov-03 1547 1.249 1.718 91 2.19 1.36 2.19 0 1.35717-Nov-03 1548 1.357 1.946 92 2.54 1.38 2.54 0 1.38124-Nov-03 1549 1.381 1.963 93 2.55 1.49 2.55 0 1.488
1-Dec-03 1550 1.488 2.076 94 2.67 1.53 2.67 0 1.5268-Dec-03 1551 1.526 2.127 95 2.73 1.41 2.73 0 1.412
15-Dec-03 1552 1.412 2.05 96 2.69 1.46 2.69 0 1.4622-Dec-03 1553 1 46 2.1 97 2.74 1.41 2.74 0 1.40529-Dec-03 1554 1.405 2.076 98 2.75 1.52 2.75 0 1.515
5-Jan-04 1555 1.515 2.247 99 2.98 1.59 2.98 0 1.5912-Jan-04 1556 1.59 2.349 100 3.11 1.60 3.11 0 1.60119-Jan-04 1557 1.601 2.379 101 3.16 1.61 3.16 0 1.61426-Jan-04 1558 1.614 2.418 102 3.23 1.61 3.23 0 1.6062-Feb-04 1559 1.606 2.407 103 3.21 1.59 3.21 0 1.5919-Feb-04 1560 1.591 2.366 104 3.15 1.55 3.15 0 1.554
16-Feb-04 1561 1.554 2.208 105 2.87 1.53 2.87 0 1.53423-Feb-04 1562 1.534 2.356 106 3.18 1.57 3.18 0 1.574
1-Mar-04 1563 1 574 2.429 107 3,29 1.59 3.29 0 1.598-Mar-04 1564 1.59 2.47 108 3.36 1.59 3.36 0 1.589
15-Mar-04 1565 1.589 2.513 109 3.45 1.58 3.45 0 1.58222-Mar-04 1566 1.582 2.61 110 3.65 1.62 3.65 0 1.62329-Mar-04 1567 1.623 2.625 111 3.64 1.73 3.64 0 1 732
5-Apr-04 1568 1.732 2.666 112 3.61 1.93 3.61 0 1.92712-Apr-04 1569 1.927 2.924 113 3.93 2.17 3.93 0 2.1719-Apr-04 1570 2.17 3.361 114 4.57 2.61 4.57 0 2.61126-Apr-04 1571 2.611 3.516 115 4.43 2.84 4.43 0 2.8383-May-04 1572 2.838 3.685 116 4.54 2.98 4.54 0 2.984
10-May-04 1573 2.984 3.684 117 4.39 2.99 4 39 0 2.99217-May-04 1574 2.992 3.685 118 4.38 2.94 4.38 0 2 93724-May-04 1575 2.937 3.599 119 4.27 2.60 4.27 0 2.631-May-04 1576 2.6 3.381 120 4.17 2.30 4.17 0 2.299
34
Page 43
Date IssueNo 91 DaysTB 182DaysTB Period ForRate 91 DaysTB ForRatelag Class Return7-Jun-04 1577 2.299 3.23 121 4 17 2.07 4.17 0 2.065
14-Jun-04 1578 2.065 3.203 122 4.35 1.98 4.35 0 - 1.97821-Jun-04 1579 1.978 3.121 123 4.28 1.72 4.28 0 1.71728-Jun-04 1580 1.717 3.029 124 4.36 1.64 4.36 0 1.636
5-Jul-04 1581 1.636 2.931 125 4.24 1 61 4.24 0 1.61312-Jul-04 1582 1.613 2:911 '126 4.23 1.70 4.23 0 1.70119-Jul-04 1583 1.701 2.935 127 4.18 1.88 4.18 0 1.87626-Jul-04 1584 1.876 3.128 128 4.40 2.01 4.40 0 2.0112-Aug-04 1585 2.011 3.291 129 4.59 2.18 4.59 0 2.1779-Aug-04 1586 2.177 3.437 130 4.71 2.26 4.71 0 2.256
16-Aug-04 1587 2.256 3.497 131 4.75 2.41 4.75 0 2.40523-Aug-04 1588 2.405 3.548 132 4.70 2.49 4.70 0 2.48730-Aug-04 1589 2.487 3.674 133 4.87 2.61 4.87 0 2.6096-Sep-04 1590 2.609 3.783 134 4.97 2.70 4.97 0 2.7
13-Sep-04 1591 2.7 3.968 135 5.25 2.78 5.25 0 2.77920-Sep-04 1592 2.779 4.064 136 5.37 2.91 5.37 0 2.90627-Sep-04 1593 2.906 4.292 137 5.70 3.24 5.70 0 3.236
4-Oct-04 1594 3.236 4.568 138 5.92 3.73 5.92 0 3.73211-Oct-04 1595 3.732 5.006 139 6.30 4.33 6.30 0 4.33218-Oct-04 '1596 4.332 5.577 140 6.84 4.50 6.84 0 4.525-Oct-04 1597 4.5 5.5 141 6.51 4.52 6.51 0 4.5181-Nov-04 1598 4.518 5.534 142 6.56 4.60 6.56 0 4.68-Nov-04 1599 4.6 5.565 143 6.54 4.75 6.54 0 4.748
15-Nov-04 1600 4.748 5.692 144 6.64 5.18 6.64 0 5.18222-Nov-04 1601 5.182 6.27 145 7.37 6.26 7.37 0 • 6.25929-Nov-04 1602 6.259 7.088 146 7.92 7.19 7.92 0 7.1896-Dec-04 1603 7.189 ‘ 7.776 147 8.37 8.65 8.37 0 8.65
13-Dec-04 1604 8.65 7.998 148 7.35 8.29 7.35 0 8.29127-Dec-04 1606 8.291 8.795 149 9.30 8.25 9.30 0 8.254
3-Jan-05 1607 8.254 8.781 150 9.31 8.25 9.31 0 8.24710-Jan-05 1608 8.247 8.761 151 9.28 8.28 9.28 0 8.27717-Jan-05 1609 8.277 8.771 152 9.27 8.22 9.27 0 8.21624-Jan-05 1610 8.216 8.634 153 9.05 8.30 9.05 0 8.30131-Jan-05 1611 8.301 8.839 154 9.38 8.44 9.38 0 8.447-Feb-05 1612 8.44 8.998 155 9.56 8.63 9.56 0 8.634
14-Feb-05 1613 8.634 8.984 156 9.34 8.62 9.34 0 8.61521-Feb-05 1614 8.615 8.937 157 9.26 8.66 9.26 0 8.65928-Feb-05 1615 8.659 8.94 158 9.22 8.65 9.22 0 8.652
7-Mar-05 1616 8.652 8.969 159 9.29 8.64 9.29 0 8.63614-Mar-05 1617 8.636 8.97 160 9.31 8.61 9.31 0 8.61221-Mar-05 1618 8.612 8.853 161 9.09 8.62 9.09 0 8.6228-Mar-05 1619 8.62 8.854 162 9.09 8.67 9.09 0 8.673
4-Apr-05 1620 8.673 8.959 163 9.25 8.70 9.25 0 8.69911-Apr-05 1621 8.699 8.973 164 9.25 8.69 9.25 0 8.68718-Apr-05 1622 8.687 8.75 165 8.81 8.66 8.81 0 8.66325-Apr-05 1623 8.663 8.981 166 9.30 8.66 9.30 0 8.662-May-05 1624 8.66 8.901 167 9.14 8.67 9.14 0 8.679-May-05 1625 8.67 9.054 168 9.44 8.67 9.44 0 8.666
16-May-05 1626 8.666 9.05 169 9.44 8.66 9.44 0 8.66223-May-05 1627 8.662 9.057 170 9.45 8.64 9.45 0 8.64130-May-05 1628 8.641 9.052 .171 9.46 8.56 9.46 0 8.563
6-Jun-05 1629 8.563 9.023 172 9.48 8.50 9.48 0 8.49713-Jun-05 1630 8.497 8.896 173 9.30 8.49 9.30 0 8.48620-Jun-05 1631 8.486 8.943 174 9.40 8.46 9.40 0 8.46227-Jun-05 1632 8.462 8.977 175 9.49 8.59 9.49 0 8.586
4-Jul-05 1633 8.586 9.084 176 9.58 8.57 9.58 0 8.57311 -Jul-05 1634 8.573 9.067 177 9.56 8.60 9.56 0 8.59718-Jul-05 1635 8.597 9.051 178 9.51 8.59 9.51 0 8.59225-Jul-05 1636 8.592 9.117 179 9.64 8.63 9.64 0 8.631-Aug-05 1637 8.63 9.112 180 9.60 8.63 9.60 0 8.638-Aug-05 1638 8.63 9.093 181 9.56 8.66 9.56 0 8.663
15-Aug-05 1639 8.663 9.093 182 9.52 8.66 9.52 0 8.66122-Auq-05 1640 8.661 9.09 183 9.52 8.69 9.52 0 8.693
35
Page 44
Date IssueNo 91DaysTB 182DaysTB Period ForRate 91DaysTB ForRatelag Class Return29-Aug-05 1641 8.693 9.079 184 9.47 8.66 9.47 0 8.663
5-Sep-05 1642 8.663 9.096 185 9.53 8.62 9.53 0 8.62212-Sep-05 1643 8.622 8.989 186 9.36 8.54 9.36 0 8.53619-Sep-05 1644 8.536 8.862 187 9.19 8 49 9.19 0 8.48826-Sep-05 1645 8.488 8.646 188 8.80 8.41 8.80 0 8.406
3-Oct-05 1646 8.406 8.616 189 8.83 8 32 8.83 0 8.31710-0ct-05 1647 8.317 8.613 190 8.91 8.22 8.91 0 8.21717-Oct-05 1648 8.217 8.531 191 8.85 8.06 8.85 0 8.05724-Oct-05 1649 8.057 8.458 192 8.86 7.94 8.86 0 7.94431-Oct-05 1650 7.944 8.396 193 8.85 7.85 8.85 0 7.8537-Nov-05 1651 7.853 8.386 194 8.92 7.81 8.92 0 7.807
14-Nov-05 1652 7.807 8.358 195 8.91 7.86 8.91 0 7.85521-Nov-05 1653 7.855 8.367 196 8.88 7.86 8.88 0 7.85828-Nov-05 1654 7.858 8.366 197 8.88 7.96 8.88 0 7.956
5-Dec-05 1655 7.956 8.403 198 8.85 8.04 8.85 0 8.04312-Dec-05 1656 8.043 8.406 199 8.77 8.14 8.77 0 8.1419-Dec-05 1657 8.14 8.509 200 8.88 8.14 8.88 0 8.1426-Dec-05 1658 8.14 8.634 201 9.13 8.16 9.13 0 8.155
2-Jan-06 1659 8.155 8.732 202 9.31 8.26 9.31 0 8.2619-Jan-06 1660 8.261 8.792 203 9.33 8.26 9.33 0 8.258
16-Jan-06 1661 8.258 8.819 204 9.38 8.25 9.38 0 8.24523-Jan-06 1662 8.245 8.907 205 9.57 8.25 9.57 0 8.24730-Jan-06 1663 8.247 8.937 206 9.63 8.21 9.63 0 8.216-Feb-06 1664 8.21 8.951 207 970 8.09 9.70 0 8.085
13-Feb-06 1665 8.085 8.869 208 9.66 7.95 9.66 0 7.94520-Feb-06 1666 7.945 8.827 209 9.72 7.86 9.72 0 7 85927-Feb-06 1667 7.859 8.77 210 9.69 7.76 9.69 0 7.763
6-Mar-06 1668 7.763 8.703 211 9.65 7.69 9.65 0 7.68613-Mar-06 1669 7.686 8.653 212 9.63 7.62 9.63 0 7.62220-Mar-06 1670 7.622 8.602 213 9.59 7.35 9.59 0 7.34527-Mar-06 1671 7.345 8.126 214 8.91 7.23 8.91 0 7.233
3-Apr-06 1672 7.233 7.875 215 8.52 7.09 8.52 0 7.08810-Apr-06 1673 7.088 7.374 216 7.66 6.95 7.66 0 6.95117-Apr-06 1674 6.951 7.177 217 7.40 6.79 7.40 0 6.79124-Apr-06 1675 6.791 7.009 218 7.23 6.84 7.23 0 6.8411-May-06 1676 6.841 7.045 219 7.25 7.08 7.25 0 7.0828-May-06 1677 7.082 7.452 220 7.82 7.10 7.82 0 7.099
15-May-06 1678 7.099 7.478 221 7.86 7.08 7.86 0 7.07922-May-06 1679 7.079 7.661 222 825 6.97 8.25 0 6.97129-May-06 1680 6.971 7.744 223 8.52 6.84 8.52 0 6.84
5-Jun-06 1681 6.84 7.681 224 8.53 6.69 8.53 0 6.68612-Jun-06 1682 6.686 7.419 225 8.16 6 55 8.16 0 6.54719-Jun-06 1683 6.547 7.257 226 7.97 6.31 7.97 0 6.31226-Jun-06 1684 6.312 6.92 227 7.53 6.13 7.53 0 6.129
3-Jul-06 1685 6.129 6.73 228 7.33 6.00 7.33 0 6.00110-Jul-06 1686 6.001 6.619 229 7.24 5.90 7.24 0 5.89517-Jul-06 1687 5.895 6.388 230 6.88 5.74 6.88 0 5.7424-Jul-06 1688 5.74 6.222 231 6.71 5.71 6 71 0 5.70831-Jul-06 1689 5.708 6.125 232 6.54 5.85 6.54 0 5.8457-Aug-06 1690 5.845 6.228 233 6.61 5.85 6.61 0 5.849
14-Aug-06 1691 5.849 6.326 234 6.81 5.99 6.81 0 5.99321-Aug-06 1692 5.993 6.575 235 7.16 6.13 7.16 0 6.13428-Aug-06 1693 6.134 6.73 236 7.33 6.29 7.33 0 6.293
4-Sep-06 1694 6.293 7.1 237 7.91 6.39 7.91 0 6.38811-Sep-06 1695 6.388 7.331 238 8.28 6.51 8.28 0 6.51118-Sep-06 1696 6.511 7.533 239 8.56 6.62 8.56 0 6.6225-Sep-06 1697 6.62 7.816 240 9.03 6.68 9.03 0 6.681
2-Oct-06 1698 6.681 7.99 241 9.32 6.79 9.32 0 6.799-Oct-06 1699 6.79 8.246 242 9.72 6.85 9.72 0 6.849
16-Oct-06 1700 6.849 8.373 243 9.92 6.90 9.92 0 6.89823-Oct-06 1701 6.898 8.467 244 10.06 6.91 10.06 0 6.91430-0ct-06 1702 6.914 8.484 245 10.08 6.90 10.08 0 6.8986-Nov-06 1703 6.898 8.423 246 9.97 6.65 9.97 0 6.648
36
Page 45
Date IssueNo 91DaysTB 182DaysTB Period ForRate 91DaysTBIag ForRatelag Class Return13-Nov-06 1704 6.648 8.159 247 9.69 6.25 9.69 0 6.2520-Nov-06 1705 6.25 7.838 248 9.45 5.86 9.45 0 5.85727-Nov-06 1706 5.857 7.525 249 9.22 5.68 9.22 0 5.68
4-Dec-06 1707 5.68 7.312 250 8.97 564 8.97 0 5.63611-Dec-06 1708 5.636 7.282 251 8.95 5.76 8 95 0 5 76318-Dec-06 1709 5.763 7.328 252 8.92 5.83 8.92 0 5.83125-Dec-06 1710 5.831 7.372 253 8 94 5.88 8.94 0 5.876
1-Jan-07 1711 5.876 7.772 254 9.70 5.92 9.70 0 5.9218-Jan-07 1712 5.921 8.123 255 10.37 5.99 10.37 0 5.991
15-Jan-07 1713 5.991 8.27 256 10.60 6.08 10.60 0 6.08122-Jan-07 1714 6.081 8.51 257 10 99 6.13 10.99 0 6.12929-Jan-07 1715 6.129 8.736 258 11.41 6.19 11.41 0 6.1935-Feb-07 1716 6.193 8.873 259 11.62 6.21 11.62 0 6.214
12-Feb-07 1717 6.214 8.67 260 11.18 6.25 11.18 0 6.24519-Feb-07 1718 6.245 8.458 261 10.72 6.24 10.72 0 6.24226-Feb-07 1719 6.242 8.253 262 10.30 6.22 10.30 0 6.219
5-Mar-07 1720 6.219 8.067 263 9.95 6.26 9.95 0 6.26212-Mar-07 1721 6.262 7.979 264 9.72 6.35 9.72 0 6.35119-Mar-07 1722 6.351 . 7.927 265 9.53 6.43 9.53 0 6.4326-Mar-07 1723 6.43 7.921 266 9.43 6.47 9.43 0 6.474
2-Apr-07 1724 6.474 7.814 267 9.17 6.51 9.17 0 6.519-Apr-07 1725 6.51 7.822 268 9 15 6.65 9.15 0 6.653
16-Apr-07 1726 6.653 7.918 269 9.20 6.80 9.20 0 6.79723-Apr-07 1727 6.797 7.985 270 9.19 6.80 9.19 0 6.79530-Apr-07 1728 6.795 8.101 271 9.42 6.80 9.42 0 6.7957-May-07 1729 6.795 8.138 272 9.50 6.78 9.50 0 6.782
14-May-07 1730 6.782 8.042 273 9.32 6.77 9.32 0 6.77421-May-07 1731 6.774 7.99 274 9.22 6.74 9.22 0 6.74428-May-07 1732 6.744 7.74 275 8.75 6.64 8.75 0 6.643
4-Jun-07 1733 6.643 7.521 276 8.41 6.58 8.41 0 6.57511-Jun-07 1734 6.575 7.297 277 8.02 6.49 8.02 0 6.48718-Jun-07 1735 6.487 7.028 278 7.57 6.40 7.57 0 6.39825-Jun-07 1736 6.398 6.906 279 7.42 6.35 7.42 0 6.345
2-Jul-07 1737 6.345 6.876 280 7.41 6.35 7.41 0 6.3459-Jul-07 1738 6.345 6.959 281 7.58 6.46 7.58 0 6.463
16-Jul-07 1739 6.463 7.115 282 7.77 6.57 7.77 0 6.56523-Jul-07 1740 6.565 7.305 283 8.05 6.90 8.05 0 6.90230-Jul-07 1741 6.902 7.575 284 8.25 7.08 8.25 0 7.0846-Aug-07 1742 7.084 7.927 285 8.78 7.34 8.78 0 7.342
13-Aug-07 1743 7.342 8.105 286 8.87 7.37 8.87 0 7.3720-Aug-07 1744 7.37 7.99 287 8.61 7.38 8.61 0 7.38427-Aug-07 1745 7.384 7.924 288 8.47 7.36 8.47 0 7.361
3-Sep-07 1746 7.361 7.874 289 8.39 7.35 8.39 0 7.35210-Sep-07 1747 7.352 7.804 290 8.26 7.33 8.26 0 7.33217-Sep-07 1748 7.332 7.801 291 8.27 7.34 8.27 0 7.34124-Sep-07 1749 7.341 7.795 292 8.25 7.35 8.25 0 7.346
1-Oct-07 1750 7.346 7.798 293 8 25 7.45 8.25 0 7.4528-Oct-07 1751 7.452 7.805 294 8.16 7.56 8.16 0 7.556
15-Oct-07 1752 7.556 7.841 295 8.13 7.67 8.13 0 7.67422-Oct-07 1753 7.674 7.842 296 8.01 7.72 8 01 0 7.72429-Oct-07 1754 7.724 7.914 297 8.10 7.92 8.10 0 7.9225-Nov-07 1755 • 7.922 8.018 298 8.11 7.93 8.11 0 7.932
12-Nov-07 1756 7.932 8.142 299 8.35 7.30 8.35 0 7.29819-Nov-07 1757 7.298 8.056 300 8.82 6.93 8.82 0 6.92526-Nov-07 1758 6.925 7.934 301 8.95 6.88 8.95 0 6.875
3-Dec-07 1759 6.875 7.889 302 8.91 6.87 8.91 0 6.86510-Dec-07 1760 6.865 7.842 303 8.83 6.84 8.83 0 6.83917-Dec-07 1761 6.839 7.858 304 8.89 6.89 8.89 0 6.89224-Dec-07 1762 6.892 7.889 305 8.90 6.80 8.90 0 6.796
7-Jan-08 1763 6.796 8.187 306 9.60 6.89 9.60 0 6.89114-Jan-08 1764 6.891 8.056 307 9.23 7.00 9.23 0 6.99921-Jan-08 1765 6.999 8.032 308 9.07 7.12 9.07 0 7.11528-Jan-08 1766 7.115 8.089 309 9.07 7.33 9.07 0 7.334
37
Page 46
Date Is s u e N o 9 1 D a ysT B 182D aysT B P e rio d F o rR a te 9 1 D a ysT B F o rR a te la g C la ss R e tu rn4-Feb-08 1767 7.334 8.355 310 9.39 7.42 9.39 0 7.424
11-Feb-08 1768 7.424 8.413 311 9.41 7.29 9.41 0 7.29118-Feb-08 1769 7.291 8.313 312 9.34 7.07 9.34 0 7.06925-Feb-08 1770 7.069 8.137 313 9 22 6.96 9.22 0 6.9563-Mar-08 1771 6.956 7.991 314 9.04 6.89 9.04 0 6.894
10-Mar-08 1772 6.894 7.763 315 8 64 6.87 8.64 0 6.86817-Mar-08 1773 6.868 7.724 315 8.59 1 11 92