The electricity industry in Spain: A structural analysis using adisaggregated input-output model
Rosa Duarte, Raquel Langarita*, Julio S�anchez-Ch�olizDepartment of Economic Analysis, Faculty of Economics and Business of the University of Zaragoza, Gran Vía, 2, 50005, Zaragoza, Spain
a r t i c l e i n f o
Article history:Received 20 November 2016Received in revised form14 August 2017Accepted 17 August 2017Available online 20 September 2017
This paper describes the construction and analysis of a disaggregated input-output model and itsextension to a social accounting matrix (SAM) for the Spanish economy in 2013. Our focus is the specificdisaggregation of the electricity industry into the generating, transmission, distribution and marketingbusinesses, which were decoupled in 1997 under legislation prohibiting any single company fromconducting more than one of them. The multi-sectoral framework also allows disaggregation of elec-tricity generating by production technologies (wind, nuclear, conventional thermal, hydropower, solarand other technologies). To the best of our knowledge, this is the first paper in which this information ispresented in a multi-sectoral framework for the Spanish economy, which is enormously dependent onthe electricity industry. The structural analysis reveals the industry's role in Spain and the importance ofits activities. None of the electricity generating businesses is a Rasmussen key sector, and generating anddistribution are both capital-intensive activities. Meanwhile, conventional thermal and hydropowergenerating together make up more than 50% of total output in value terms, while nuclear power accountsfor only around 7%. Finally, imports and exports of electricity are small, and almost all demand is coveredby domestic production.
Energy dependence and its impact on economic growth is amajor current concern both for society in general and for the sci-entific community in particular. Meanwhile, the price of electricitydirectly affects consumption and production decisions, given thatpower is indispensable both in the home and in industry. It is acommonplace that energy takes different forms, and it can there-fore be classified in at least two categories. The first refers to theavailability of energy sources (non-renewable such as fossil fuelsand nuclear energy, or renewable such as hydropower, wind, solarand biomass). The second category is based on the energy sourceused, allowing us to distinguish between primary energy (found innature, such as oil or hydraulic energy) and secondary energy,defined as the final energy obtainable from a primary source bymeans of some kind of transformation. It is this category withwhich the present study is concerned.
This paper focuses on the Spanish electricity industry and its
relationships with the rest of the country's activities in a multi-sectoral context. Spain's economic growth in recent decadescannot be understood without considering the significant devel-opment and changes that have occurred in the energy industry.Economic growth in the 1980s and 90s was to a considerable extentbased on energy-intensive industries, resulting in rising demandfor energy in the expansive phase of the economic cycle (until theinternational crisis of 2007) evenwhile the EU trendwas already ona downward path ([1]). Strong national demand for energy coupledwith very limited primary energy production (given Spain's scarcityof conventional energy resources) created a panorama informed bya strong potential energy deficit and country vulnerability, threat-ening further economic expansion. According to [2], Spanish en-ergy dependence in 1997 was as high as 71%. This drove the searchfor alternatives in the form of energy diversification, progressivederegulation and the decoupling of the electricity system in 1997.Specifically, the Spanish Electricity Industry Act (Law 54/1997) laidthe foundations for the current electricity model for the sector,seeking to deregulate the sector and guarantee the power supply atthe lowest possible cost. As a crucial step in this deregulationprocess, articles 11 and 14 of the Act provided for the unbundling ofthe power utilities' generating, distribution, transport and
R. Duarte et al. / Energy 141 (2017) 2640e2651 2641
marketing businesses. Major issues nevertheless persist, includingscant competition, the rising tariff deficit, regulatory uncertainty(affecting self-consumption initiatives and the development of re-newables), limited connexion with foreign grids, high capacitytariffs, and occasional sharp price hikes (see Refs. [3] and [4]).
In this tangled context, any evaluation of the electricity indus-try's current role, its importance as a driver of economic growth,and existing economic dependences and bottlenecks will require anew description of interrelationships both within the sector andbetween it and the rest of the economy. Our work is a first step inthis direction, providing a structural analysis of the electricity in-dustry in Spain, of its operational subsectors and of the associatedproduction technologies. To this end, we focus on building andanalysing an input-output table (IOT) of the Spanish economy in2013 (the most recent year for which the basic input-output tabledata are available for Spain), and on a specific disaggregation of theelectricity industry by activities and technologies. The IOT is furtherextended to social accounts in order to include income relation-ships between sectors and institutions and to arrive at a dis-aggregated Social Accounting Matrix (SAM).
The disaggregated IOT and SAM produced are significant resultsin themselves, because this is the first time, to the best of ourknowledge, that the Spanish electricity industry has been brokendown into a multi-sectoral schema despite its importance for theeconomy as a whole. This disaggregation into 10 subsectors isdefined by generating technologies and by transmission, distribu-tion, marketing and related activities, opening the way to differentmethodological options for policy design.
These disaggregated matrices provide the empirical basis for astructural analysis of the links and dependences currently existingbetween the Spanish economy as a whole and the electricity in-dustry and its different subsectors. There is a wide literature on theanalysis of the relevance of energy sector in the economies, and itsrelationship with the rest of economic sectors from differentmethodological perspectives (see for instance [5e7] or [8]). Ouranalysis will be based on the analysis of inter-sector linkages andthe study of the structure of the dependence chains in an input-output framework.
While the structural analysis is the central focus of this paper,the disaggregated IOTand associated SAMhave additional value perse, as a basis for the future calibration of computable generalequilibrium models (CGEM). Despite the interest of CGEM in thefield of energy issues, the design and evaluation of specific policiesis beyond the scope of this paper. In any case, the IOT and SAMstructures allow us to undertake an in-depth analysis of the elec-tricity industry and its role in the Spanish economy using forwardand backward linkages, graph analysis, and dependence chains,with significant results.
Multi-sector IO models provide a powerful tool for economicanalysis because they can account not only for direct dependencesbetween sectors but also for all direct and indirect relationshipsalong the whole length of the supply chain [9e14]. These modelshave been used to analyse the links between the energy and othersectors of the economy like tourism [15] and agriculture [16].Moreover, the extension of input-output databases to social ac-counting matrices (SAMs), including both IOT production accountsand institutional and social accounts (such as Taxes, GovernmentExpenditure, Savings/Investment, Households, Trade, and Marginsand Taxes on products), allows the evaluation of relationships be-tween energy use ([17]), GHG emissions ([18,19]) and the genera-tion and distribution of income in the economy, as well as providinga basis for the calibration of CGEMs ([20,21]) as mentioned above.
To sum up, our work could be considered a first step towards thedesign and assessment of a raft of future energy policies covering,for instance, self-consumption, energy tariffs, and alternative
technologies. Meanwhile, other European countries have alsopressed ahead with decoupling of the businesses involved in theelectricity industry following similar processes to that seen inSpain. In this regard, our methodology and findings may also helpadvance understanding of the energy production nexus andstructure in other European countries, even though the presentanalysis focuses more narrowly on the Spanish economy.
The rest of the paper is organized as follows. In section 2, wepresent the steps followed to obtain the disaggregated IOT for theSpanish economy in 2013 from the original supply and use tables. Insection 3, we extend the IOT to obtain a SAM with a similardisaggregation. Section 4 presents the results from the structuralanalysis. The paper closes with some final remarks and commentson future lines of research.
2. A symmetric 2013 IOT and SAM for Spain withdisaggregated electricity industry
As explained in the introduction, our objective is to obtain adisaggregated industry-by-industry 2013 symmetric IOT for theSpanish economy with a special focus on the structure of theelectricity sector, and then to extend it to a SAM. Our starting pointis the most recent edition of the Spanish supply and use tables for2013 published by INE [22]. Our initial IOT obtained from Ref. [22]covers 63 industries and has only one sector referring to energy:“Electricity, gas, steam and air conditioning” (sector code 35 inNACE rev. 2). We proceeded in three steps. First, we disaggregatedthe sector into Electricity, Gas and other subsectors. Next, the newElectricity industry was again disaggregated into its main activities,viz. Electricity Generating (further broken down into Wind gener-ating, Nuclear generating, Conventional Thermal generating,Hydrogenerating, and Solar and other generating), Transmission,Distribution, Marketing and Related Activities. The result is an IOTwith 72 industries, 10 of which are energy related. Finally, havingobtained the IOT, we took the income flows in the economy toconstruct a SAM with the same energy industry disaggregation.
A symmetric IOT is usually obtained from the informationoffered by supply and use tables. The supply matrix shows whichsector or industry is producing each kind of good and the levels ofoutput. It is a matrix of products (goods) by industries, and thenumber of products may differ from the number of industries. A usematrix shows which sector or industry consumes what kind ofgoods in its own production processes. Our starting point is the2013 supply and use tables for Spain published by Ref. [22].Obtaining a symmetric IOT means reorganizing the informationincluded in the supply and use tables without changing the value ofthe macro-economic aggregates. Symmetric IOTs can be eitherindustry-by-industry or product-by-product matrices, showing thesales of each industry (product) in the ranks and the purchases ofeach industry (product) to meet production needs in the columns.IOTs also include sector information about both final demand andvalue added (VA). When reorganizing the supply and use tables, itis necessary to decide if the symmetric IOT required is an industry-by-industry or product-by-product table. This choice will dependon the specific objective of the economic analysis concerned. Weuse the former option because industry-by-industry IOTs are closerto statistical sources in Spain. In addition, they are more commonlyapplied to the Spanish economy (see Refs. [23e26]).
INE publishes supply and use tables annually. The most recentINE supply and use tables refer to 2013 [22], which we used toobtain the symmetric IOT following the criteria suggested byRef. [27]. More specifically, the IOTwas built using the fixed productsales structure assumption. The result is a first IOT, which we maycall 2013IOT. By way of illustration, Table 1 presents an aggregationof 2013IOT with 5 productive sectors.
Table
120
13IO
Twithfive
sectors(M
illionsof
Euros).
Prim
arysector
Man
ufacturing
Energy
Con
struction
Services
Total
Con
sumption
Gross
capital
form
ation
Exports
Tran
sportan
dco
mmercial
marginsan
dtaxe
son
products
Totalusesat
purchaser
prices
Prim
arysector
3214
32,836
6694
4138
40,348
19,456
1280
14,410
�15,53
359
,961
Man
ufacturing
17,433
286,68
223
,964
28,524
106,01
546
2,61
822
7,34
663
,979
221,77
8�2
02,595
772,78
3En
ergy
587
19,716
28,645
3326
17,212
69,486
21,328
395
809
�454
087
,479
Con
struction
144
3506
937
25,001
14,345
43,933
10,236
81,691
2351
�508
613
3,12
6Se
rvices
2431
60,632
7644
20,315
262,62
735
3,64
954
0,69
744
,387
52,552
139,45
11,13
0,73
5
Total
23,809
403,37
261
,256
77,260
404,33
797
0,03
481
9,06
319
1,73
229
1,90
0�8
8,30
32,18
4,08
4
Wag
es43
2076
,195
4595
27,159
373,04
648
5,31
5Operatingsu
rplus
26,796
62,301
20,186
25,057
306,05
344
0,39
3Ta
xes
�536
711
455
317
3212
,915
9947
Outp
utat
basic
price
s49
,559
554,84
486
,969
132,27
11,09
9,59
21,92
3,23
5
Imports
10,402
245,52
051
085
531
,143
288,43
0
Totalreso
urces
59,961
800,36
487
,479
133,12
61,13
0,73
52,21
1,66
5
Source:
Owncalculation
s.
R. Duarte et al. / Energy 141 (2017) 2640e26512642
A first reading of this table confirms the relevance of the energycomplex in Spain and some of its characteristics. The industryrepresented 4.52% of total Spanish output at basic prices in 2013,but only 2.71% of value added, compared to 28.85% of total outputand 14.81% of VA in the case of manufacturing. Meanwhile, con-struction accounted for 6.88% of total output and 5.77% of VA. Theenergy operating surplus represents 23.21% of total energy output,slightly lower than the operating surplus in the service sector(27.83%) but higher than in industry (11.23%). Finally, the VA/wagesratios are 5.51 in Energy, 1.82 in Industry, 1.99 in Construction and1.86 in Services, demonstrating high levels of productivity perworker in the energy industry.
The table also reflects the energy industry's low levels of im-ports and exports. Thus, just 0.18% of total Spanish imports in 2013were made by the energy sector and 0.28% of total Spanish exports.By contrast, primary sector imports and exports were around 3.61%and 4.94% respectively, and the figures for manufacturing were85.12% and 75.98% respectively. Moreover, energy exports make uphardly 0.92% of total energy output. Finally, the share of interme-diate demand in total energy use is 79.43%, while household con-sumption accounts for more than 24.38% of total production.
2.1. Disaggregation of the energy sector in 2013IOT
Having calculated the 2013IOT from the supply and use tables,our next objective was to disaggregate the energy sector into 10different sectors to obtain a final IOT, which we may call2013IOTDE. This was done in two steps. First, we disaggregatedEnergy into two sectors, Electricity and Gas. Next, we disaggregatedthe new Electricity sector into nine subsectors based on externalinformation. The final phase involved matching the figures so ob-tained applying the methods described in Refs. [28] and [29] toavoid possible contradictions.
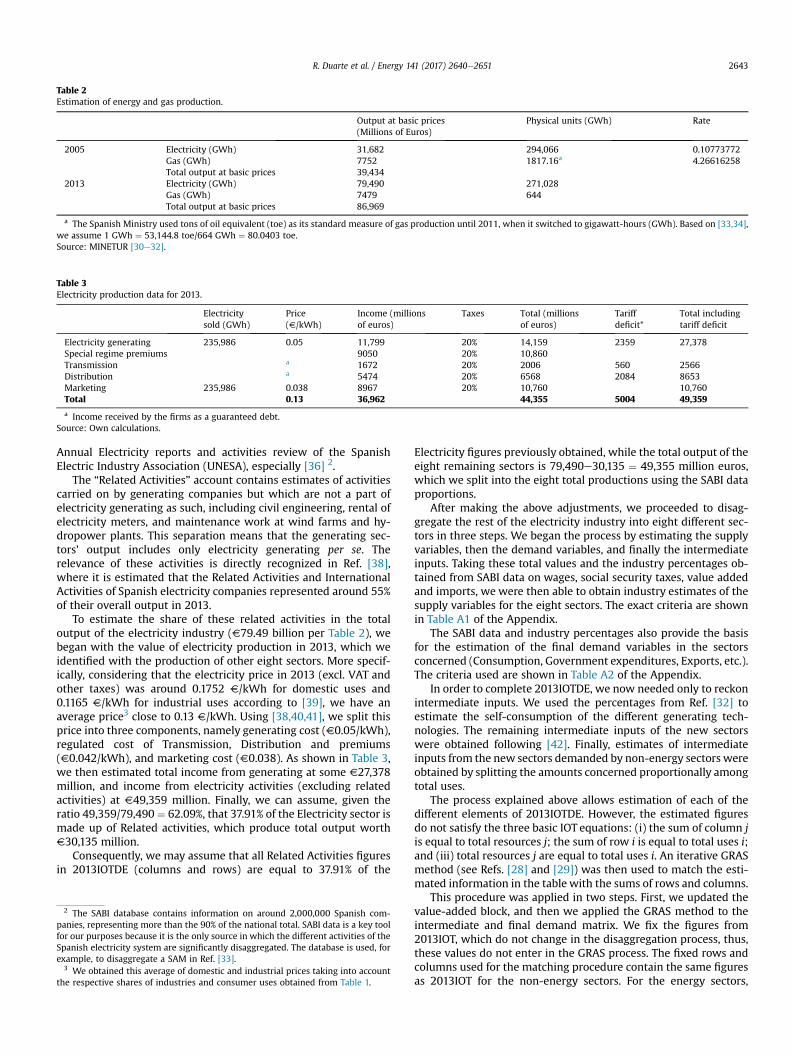
The starting points for this first disaggregationwere the SpanishIOT for 2005 [30], which included both electricity and gas sectorsand their output at basic prices, and the production of electricityGWh and gas in tonnes of oil equivalent (‘toe’) in 2005 and 2013,obtained from the Spanish Industry Ministry [31,32]. Assumingconstant rates of monetary output/physical output, we can splitfinal energy output per 2013IOT to obtain estimates at basic prices,as shown in Table 2.
We then estimated the intermediate inputs, value added andimports of the new Electricity and Gas sectors for 2013 using thetechnical coefficients and the coefficients of value added and im-ports related to the output of both sectors for 2005, and the figuresfrom the Energy column of 2013IOT.We proceeded in the samewayto estimate intermediate and final demand based on the Energyrow of 2013IOT1.
The next step was to break down the Electricity sector obtainedinto 9 new sectors by generating technology used (5 sectors) and bytype of business (4 sectors). The resulting technological sectorswere Wind, Nuclear, Conventional Thermal, Hydropower and Solarand other Generating, and the business sectors were Generating,Transmission, Distribution, Marketing, and Related activities. Themain databases for this higher disaggregation are the Iberian Bal-ances Analysis System (SABI in its Spanish acronym) [35], and the
1 Certain minor changes were necessary because the Spanish National Classifi-cation of Economic Activities (CNAE in the Spanish acronym) changed in 2009 fromCNAE-93 to CNAE-09, obliging us to aggregate in some cases and to disaggregate inothers.
a The Spanish Ministry used tons of oil equivalent (toe) as its standard measure of gas production until 2011, when it switched to gigawatt-hours (GWh). Based on [33,34],we assume 1 GWh ¼ 53,144.8 toe/664 GWh ¼ 80.0403 toe.Source: MINETUR [30e32].
a Income received by the firms as a guaranteed debt.Source: Own calculations.
R. Duarte et al. / Energy 141 (2017) 2640e2651 2643
Annual Electricity reports and activities review of the SpanishElectric Industry Association (UNESA), especially [36] 2.
The “Related Activities” account contains estimates of activitiescarried on by generating companies but which are not a part ofelectricity generating as such, including civil engineering, rental ofelectricity meters, and maintenance work at wind farms and hy-dropower plants. This separation means that the generating sec-tors' output includes only electricity generating per se. Therelevance of these activities is directly recognized in Ref. [38],where it is estimated that the Related Activities and InternationalActivities of Spanish electricity companies represented around 55%of their overall output in 2013.
To estimate the share of these related activities in the totaloutput of the electricity industry (V79.49 billion per Table 2), webegan with the value of electricity production in 2013, which weidentified with the production of other eight sectors. More specif-ically, considering that the electricity price in 2013 (excl. VAT andother taxes) was around 0.1752 V/kWh for domestic uses and0.1165 V/kWh for industrial uses according to [39], we have anaverage price3 close to 0.13 V/kWh. Using [38,40,41], we split thisprice into three components, namely generating cost (V0.05/kWh),regulated cost of Transmission, Distribution and premiums(V0.042/kWh), and marketing cost (V0.038). As shown in Table 3,we then estimated total income from generating at some V27,378million, and income from electricity activities (excluding relatedactivities) at V49,359 million. Finally, we can assume, given theratio 49,359/79,490¼ 62.09%, that 37.91% of the Electricity sector ismade up of Related activities, which produce total output worthV30,135 million.
Consequently, we may assume that all Related Activities figuresin 2013IOTDE (columns and rows) are equal to 37.91% of the
2 The SABI database contains information on around 2,000,000 Spanish com-panies, representing more than the 90% of the national total. SABI data is a key toolfor our purposes because it is the only source in which the different activities of theSpanish electricity system are significantly disaggregated. The database is used, forexample, to disaggregate a SAM in Ref. [33].
3 We obtained this average of domestic and industrial prices taking into accountthe respective shares of industries and consumer uses obtained from Table 1.
Electricity figures previously obtained, while the total output of theeight remaining sectors is 79,490e30,135 ¼ 49,355 million euros,which we split into the eight total productions using the SABI dataproportions.
After making the above adjustments, we proceeded to disag-gregate the rest of the electricity industry into eight different sec-tors in three steps. We began the process by estimating the supplyvariables, then the demand variables, and finally the intermediateinputs. Taking these total values and the industry percentages ob-tained from SABI data on wages, social security taxes, value addedand imports, we were then able to obtain industry estimates of thesupply variables for the eight sectors. The exact criteria are shownin Table A1 of the Appendix.
The SABI data and industry percentages also provide the basisfor the estimation of the final demand variables in the sectorsconcerned (Consumption, Government expenditures, Exports, etc.).The criteria used are shown in Table A2 of the Appendix.
In order to complete 2013IOTDE, we now needed only to reckonintermediate inputs. We used the percentages from Ref. [32] toestimate the self-consumption of the different generating tech-nologies. The remaining intermediate inputs of the new sectorswere obtained following [42]. Finally, estimates of intermediateinputs from the new sectors demanded by non-energy sectors wereobtained by splitting the amounts concerned proportionally amongtotal uses.
The process explained above allows estimation of each of thedifferent elements of 2013IOTDE. However, the estimated figuresdo not satisfy the three basic IOT equations: (i) the sum of column jis equal to total resources j; the sum of row i is equal to total uses i;and (iii) total resources j are equal to total uses i. An iterative GRASmethod (see Refs. [28] and [29]) was then used to match the esti-mated information in the table with the sums of rows and columns.
This procedure was applied in two steps. First, we updated thevalue-added block, and then we applied the GRAS method to theintermediate and final demand matrix. We fix the figures from2013IOT, which do not change in the disaggregation process, thus,these values do not enter in the GRAS process. The fixed rows andcolumns used for the matching procedure contain the same figuresas 2013IOT for the non-energy sectors. For the energy sectors,
R. Duarte et al. / Energy 141 (2017) 2640e26512644
however, we were obliged to use the estimates obtained. The tableproduced in this way is 2013IOTDE.
3. Extending 2013IOTDE to create a social accounting matrix
The extension of 2013IOTDE to a SAM means estimating therelationships between productive sectors and institutional ac-counts, in our extension comprising L (labour), K (capital), H(Households), SI (Savings/Investment), five tax accounts (Net taxeson products, Social Security contributions paid by employers, SocialSecurity contributions paid by workers, Other net taxes on pro-duction, and Personal Income Tax (PIT), Government, Foreign trade(Imports/Exports) and MT (Margins and taxes on products).
The figures in a SAM represent monetary transfers from oneaccount to another, whichwe can classify in four types: (i) Transfersfrom productive sectors to other productive sectors, in our caserepresenting the intermediate inputs from 2013IOTDE; (ii) Trans-fers from productive sectors to institutional accounts, which extendthe information given by the demand variables in 2013IOTDE; (iii)Transfers from institutional accounts to productive sectors, whichare also an extension of the 2013IOTDE supply variables; and (iv)Transfers from institutional accounts to other institutional ac-counts, which are specific to the SAM.
The data used to extend 2013IOTDE were obtained from theSpanish Revenue Service (AEAT in its official acronym), [43] and[44], following the criteria described in published papers such as[23]. The SAM obtained has 84 accounts, 12 of them institutional.An aggregated SAM with only 14 productive and 8 institutionalaccounts is shown in Table 4. The full SAM is available on request.
This table confirms some of the features of the energy complexmentioned above. One of them is the nugatory share of all elec-tricity subsectors in imports and exports, the highest being 2.35% inthe case of Solar and other generating.
We may also observe that the labour compensation is lowerthan in the rest of the sector blocks (4.23% of total resources in theenergy sector, versus 6.38%, 7.60%, 16.09% and 26.07% in the Pri-mary sector, Industry, Construction and Services), a sign of theelectricity industry's characteristically high ratio of capital to la-bour. The sector with the highest percentage labour compensationis Solar and other generating. By contrast, the capital compensationis higher than in other sectors, representing 23.08% of resources
Table 4Summary of the SAM 2013 (2013SAMDE).
compared to 44.69% in the Primary Sector, 7.60% in Manufacturing,18.82% in Construction, and 27.07% in Services. In this case, Windand Nuclear generating exhibit the highest capital compensation(87.76% of resources and 84.32% respectively), although the per-centages in Transmission and Distribution are also very significant.
Finally, household energy demand is around 24.31% of totalenergy demand, as mentioned, 79.43% of which is intermediatedemand. Meanwhile, household energy costs account for aroundthe 2.17% of their total expenditure, compared to more than 36.41%in services.
4. Results
Having presented the main features of the disaggregated IOTand SAM, let us now turn to analyse the productive structure of theSpanish economy focusing in particular on the electricity industry.This will allow us to evaluate the centrality of the sector and itsdependence chain. We proceed by examining first the inter-sectorlinkages, which are illustrated by means of a graph, and then thedependence chains found in 2013IOTDE using the Leontief model([45]) commonly applied in the literature (see Ref. [26]).
4.1. Sectoral linkages
To begin our analysis of the electricity industry's role and theimportance of its various subsectors in the Spanish economy as awhole, let us first represent the main relationships with othersectors by means of a graph, focusing initially on direct relation-ships. We will then complete the analysis taking into account theindirect relationships between sectors through the informationprovided by the backward and forward linkage indicators.
Fig. 1 shows energy and other strongly linked sectors (for thesake of clarity, we omit other sectors that are less tightly connectedwith energy). Each node represents a production sector, which isindicated by a sector number (the grey number next to the node).The arrow indicates the direction of the production flow, which isthe inverse of the direction of the monetary flow. The second figureplaced on the arrow represents purchases made by each sector as apercentage of its total output (only cases above 3% are represented).
A first look at the graph shows that one of the strongest inter-sector relationships is that between Manufacture of coke and
Fig. 1. Main electricity sector relationships (purchases as a percentage of total sectoroutput).Source: own work. 3: Fisheries and aquaculture. 4: Extractive industries. 10: Manu-facture of coke and refined petroleum. 11: Chemicals. 14: Manufacture of other non-metallic mineral products. 15: Manufacture of iron, steel and ferroalloy products. 16:Manufacture of metal products, except for machinery and equipment. 24: Windgenerating. 26: Conventional thermal generating. 27: Solar and other generating. 28:Hydrogenerating. 31: Electricity marketing. 32: Related electricity sector activities. 33:Gas. 36: Construction. 40: Overland transport and pipelines. 41: Maritime transportand interior waterways. 42: Air transport. 48: Telecommunications. 60: Activitiesrelated to employment. 62: Safety, investigation and ancillary activities.
R. Duarte et al. / Energy 141 (2017) 2640e2651 2645
refined petroleum (10) and Extractive industries (4), in which thelatter's sales are equal to 74% of the former's total output.Furthermore, Extractive industries also sell inputs to Related elec-tricity sector activities (32), Electricity marketing (31), Gas (33),Manufacture of other non-metallic mineral products (14) andManufacture of products of iron, steel and ferroalloys (15), and itbuys inputs mainly from Manufacture of metallic products (16),Overland transport and pipelines (40) and Chemicals (11). Mean-while, Manufacture of coke and refined petroleum (10) also sellsinputs to Fisheries and aquaculture (3), Chemicals (11), Solar andother generating (27), Electricity marketing (31), Related electricitysector activities (32), Maritime transport (41), Air transport (42)and Overland transport and pipelines (40).
Wind generating (24) purchases a significant 4% of its outputvalue from Related electricity sector activities (32), while Conven-tional thermal generating (26) buys inputs from Manufacture ofmetallic products (16), Related electricity sector activities (32), Gas(33), Construction (36), Telecommunications (48) and Safety andinvestigation activities (62). It sells its output to Electricity mar-keting (31). Solar and other generating (27) buys inputs fromManufacture of coke and refined petroleum (10), Related electricitysector activities (32) and Gas (33), and it sells to Electricity mar-keting (31). Hydrogenerating (28) buys inputs from Related elec-tricity sector activities (32) and Gas (33), and it sells most of itsproduction to Electricity marketing (31).
Electricity marketing (31) purchases inputs from Extractive in-dustry (4), Manufacture of coke and refined petroleum (10), and,given the sales of the different generating technologies, fromConventional thermal generating (26), Solar and other generating(27), Hydrogenerating (28), and Related electricity sector activities(32), as well as Gas (33). The sector sells its output to Manufactureof other non-metallic mineral products (14).
Related electricity sector activities (32) buys inputs from (4),(10), (11), (28), (31) and (33) and sells part of its production toManufacture of other non-metallic mineral products (14), Windgenerating (24), Conventional thermal generating (26), Solar andother generating (27), Hydrogenerating (28), and Electricity mar-keting (31).
To sum up, the electricity subsectors are closely related withbasic industries, and with a significant part of the transport andservice sectors. Moreover, Nuclear generating (25), Electricity
transmission (29) and Electricity distribution (30) do not appear onthe graph, indicating a low level of direct relationships with eachsector in particular, because they have small but significant linkswith all sectors. Extractive industries (4), Manufacture of coke andrefined petroleum (10), Electricity marketing (31), Related elec-tricity sector activities (32) and Gas (33) also play a key role. Threegenerating sectorsdthermal (26), solar (27) and hydropower(28)dare also structurally significant, but less so than marketing(31) or related activities (32).
The graph above is a simple representation of the direct linksbetween the electricity subsectors and the wider economy. How-ever, the multi-sectoral framework allows us a more completeanalysis of these economic linkages, revealing not only direct re-lationships but also indirect links. This means we can analyse thecapacity of the sectors to produce the inputs needed by thedifferent electricity sectors in each of the production steps alongthe whole of the supply chain.
If x denotes the production vector in an economy, y denotes netfinal demand, A ¼ (aij) is the matrix of total technical coefficientsrepresenting the technology, and (I-A)�1 ¼ (aij) is the Leontief in-verse matrix, then the equilibrium equation for this economy canbe written:
x ¼ Ax þ y; x ¼ (I-A)�1 y (1)
In our case, A ¼ (aij) is obtained from 2013IOTDE by dividingintermediate inputs by total sectoral outputs (excluding imports).The Leontief inverse, (I-A)�1 ¼ (aij) shows the inputs generated insector i that are directly or indirectly incorporated per unit of finaldemand of sector j.
The unitary backward coefficients Bj are calculated as the sum ofthe (I-A)�1 columns(see Eq. (2)) and show the production gener-ated in the whole economy per unit of final demand. In otherwords, the backward coefficients reflect the capacity of a sector todrive economic activity when its final demand increases (house-hold consumption, investment, exports,..). The global backwardcoefficients Bj are the sums of the ðI� AÞ�1by columns and estimatethe vertically-integrated production associated with the final de-mand of sector j.
Bj ¼Xi
aij; Bj ¼ yjXi
aij (2)
The unitary forward coefficients Fi are calculated as the sum ofthe (I-A)�1 rows (see Eq. (3)). These coefficients compute the sec-toral output incorporated per an additional unit of final demand inall sectors of the economy. Hence, these coefficients tell us howdifferent sectors facilitate the activity of others by supplying theinputs they need to fulfil their final demand. The global forwardcoefficients are calculated as the sum of the ðI� AÞ�1by rows and areequal to sectoral production.
Fi ¼Xj
aij; Fi ¼Xj
aijyj (3)
According to [46], economic sectors can be classified accordingto their capacity to boost the economy through direct and indirectpurchases from all other sectors (backward linkages), their capacityto facilitate the activity of other sectors (forward linkages), or both.Thus, an industry may be regarded as a key sector when bothlinkages are above the average values for the economy, as a back-ward sector if only its backward linkage is above average, and as aforward sector if the forward linkage is higher than the average.Finally it will be a non-significant sector if both linkages are belowthe average values. Although this classification is made on the basisof unitary indicators in the literature, a complementary picture of
Table 5Backward and forward linkages of sectors associated with energy activities.
Unitarybackward
Unitaryforward
Classification
Globalbackward
Globalforward
3 Fisheries and aquaculture 2.5312 1.0818 Backward 3518 29724 Extractive industries 2.5871 8.5290 Key �118,281 624410 Manufacture of coke and refined petroleum 3.6408 6.0231 Key 33,459 45,47011 Chemicals 3.5265 7.6420 Key �10,287 48,35214 Manufacture of other non-metallic mineral products 2.8940 2.0476 Backward 4045 15,45215 Manufacture of iron, steel and ferroalloy products 3.5034 5.4969 Key 9085 40,58716 Manufacture of metallic products, except for machinery and equipment 3.0354 3.7093 Key 12,650 27,42624 Wind generating 1.2763 1.1262 N. S. 1068 188925 Nuclear generating 1.1631 1.0701 N. S. 158 72526 Conventional thermal generating 2.8665 1.5525 Backward 5783 651327 Other generating 2.7731 1.6765 Backward 6962 815428 Hydrogenerating 3.4733 1.9292 Backward 2990 849229 Electricity transmission 1.2103 1.1557 N. S. 266 159930 Electricity distribution 1.0002 1.2721 N. S. 808 321931 Electricity marketing 3.8850 2.5538 key 19,403 18,76432 Related activities 3.0381 4.8932 Key 13,910 30,13533 Production, distribution and commercialization of gas and steam,
and air conditioning2.8476 2.2138 Backward 1484 7479
36 Construction 2.5121 3.1256 Key 221,913 132,27140 Overland transport and pipelines 2.4474 3.9010 Key 49,790 47,15641 Maritime transport and interior waterways 2.7458 1.0641 Backward 6003 284042 Air transport 2.9906 1.4515 Backward 17,710 980648 Telecommunications 2.0813 2.8464 Forward 32,149 34,91060 Activities related to employment 1.2116 1.4406 N. S. �2 326562 Safety, investigation and ancillary activities 1.6924 3.4888 Forward �174 27,074
Average 2.3370 2.3370 26,712 26,712
Source: Own work.
4 A block is indecomposable if any sector of this block sells inputs directly orindirectly to all sectors of the block.
R. Duarte et al. / Energy 141 (2017) 2640e26512646
the sectors' importance in the economy can also be obtained fromthe global backward and forward linkages.
A key sector depends on other industries, which is to say it usesinputs from other sectors in order to incorporate them in its pro-duction process and, in turn, its output is sold to other industries tobe modified in their production processes. Hence, such a sector willbe highly integrated in the economic structure, both pulling andpushing the activity of other sectors. In a backward or forwardsector, however, only one of these two perspectives will predomi-nate. Table 5 shows the values for the energy sectors and for certainsectors strongly linked to them (see Fig. 1), as well as the averagevalues for the Spanish economy as a whole.
Two out of the nine new electricity sectors obtained from ourdisaggregationdElectricity marketing (31) and Related electricitysector activities (32)dare key sectors. Marketing has a backwardlinkage of 3.88 compared to an average value of 2.34, while thebackward linkage of Related activities is 3.04. Three sec-torsdConventional thermal generating (26), Solar and othergenerating (27) and Hydrogenerating (28)dare backward sectors.These five sectors all boost growth in the Spanish economy whentheir demand increases, but only the first two facility it signifi-cantly, especially Related activities, which has a forward linkageequal to 4.89. Surprisingly, the remaining sectors (wind and nucleargenerating, and electricity transmission and distribution) belong tothe non-significant category. In other words, they have only a verylimited role as drivers of growth.
Extractive industry (4) is a key sector, and it has the highestforward coefficient, so that when production expands it generates alarge increase in the output of the remaining sectors in terms ofboth sales and purchases. This is important for us because it pro-duces inputs for energy sectors, although it is not itself an energyindustry. This is also the case with the Manufacture of coke andrefined petroleum (10), another key sector with a high forwardlinkage of 6.02 compared to an average value 2.34.
Table 5 shows a further five key sectors, three of them indus-triald(11), (15) and (16)d, Construction (36) and a transport sector(40). These sectors are important drivers of the Spanish economy,
and electricity and/or energy is an essential input for them. Energyis in fact crucial for the Spanish economy because of its links withthe industrial, construction and service sectors rather than in itself.
4.2. Analysis of the dependence chain of electricity sectors in theSpanish economy
The foregoing analysis confirms the importance of the electricityindustry to the Spanish economy. To explore this matter further, letus classify the different sectors of the Spanish economy based ontheir greater or lesser supply- and demand-side capacity, evalu-ating both of them in a global way, in direct and indirect terms. Thisclassification will provide an overview of the global dependencechains between the different productive sectors in the economy.
We use the methodology described in Ref. [47], which consistsof organizing the hierarchy of sectors according to their nature assupply- or demand-side industries. The criterion followed involvesplacing the more independent sectors (stronger supply-side char-acteristics) at the beginning of the table and the more dependentsectors (dominant demand-side) at the end. Thus, the sector whichdirectly or indirectly demands inputs from the most sectors will beplaced at the end of the chain. An iterative method was used toobtain the classification, starting with the inverse Leontief matrixobtained from 2013IOTDE. In each step of the iteration, we elimi-nated all scores below a given value for the step concerned,focusing only on the purchases and sales described by theremaining coefficients.
If no coefficients are removed from our matrix, we find that itcan be broken down into two indecomposable4 blocks, the firstcomprising sectors (1) to (71) and the second formed only by Ac-tivities of households as employers (72). In our hierarchy, then,sector (72) appears in the last position, because it has zero inter-mediate sales to other sectors.
R. Duarte et al. / Energy 141 (2017) 2640e2651 2647
Then, removing the coefficients smaller than a value b smallenough, we can break the previous block with 71 sectors into twonew indecomposable blocks. One with 70 sectors and anothercomposed by only one sector, Scientific research and development(56), which has no significant sales to any sector. For this reason,this sector (56) appears in the new hierarchy in post 71, beforesector (72). We can repeat iteratively this process, putting theunisectoral block in front position or behind depending on if theblock has null purchases or null sales. The process finishes when allsectors are ordered. We can see the hierarchy obtained in Fig. 2.
As may be observed, five key sectors of the Spanish econo-mydChemicals (11), Construction (36), Metals (15), Transport (40)and Metal manufactures (16)dare placed in the central part of theclassification with Chemicals (11) at the top (position 19 of 72) andConstruction (36) at the bottom in position 38. The size and keynature of these industries drive the role of electricity activities, asmentioned above. A further two sectors, Extractive industries (4)and Coal and oil (10) also occupy central positions, respectivelyplaced the 16th and 24th, as major suppliers of the electricityindustry.
The result of all this is that certain electricity sectors also occupyrelatively central positions. For example, Solar and other generating(27) is placed 43rd, while Hydrogenerating (28) ranks 34th. How-ever, the technical nature or dominant backward roles of othersectors push them towards the extremes of the classification, asexplained above. For example, Distribution (30) is placed first in thelist as a supplier of all of the other sectors, while Transmission (29)and Nuclear (25) are in the 64th and 65th place, revealing that theysell their output either directly to consumers or to intermediatesectors which make very significant sales to end consumers.
5. Final remarks and future research
The Spanish energy system faces major challenges, which willhave crucial implications both for the future development of the
11 * * *
2 * *3 *
4
3
Fig. 2. Hierarchy of seller and buyer sectors.Source: own work. The names of each sector are provided in Table A3 of the Appendix.
electricity sector and for the economy as a whole. Key issuesinclude scant competition, the tariff deficit, faulty tariff design, araft of uncertainties, potential market integration and the intro-duction of new technologies. In this context, the need for tools thatprovide detailed information on the complexities of the sector andits relationships with the rest of the economy is a matter of someurgency. This paper takes a first step in this direction, contributingto an accurate depiction of the sector's structure. To that end, wehave constructed and disaggregated an IOT for the Spanish econ-omy in 2013, disaggregating the electricity sector by activity(generating, transmission, distribution, marketing, and related ac-tivities). Generating was then further disaggregated into thedifferent production technologies. The resulting table reveals theinterrelationships between electricity sector activities and the restof the economy. To the best of our knowledge, this is the first timethat energy activities in the Spanish IOT have been disaggregatedinto ten sectors (nine electricity sectors and gas activities) to throwlight on the technological structure of the industry and inter-sectoral links. We have also extended the IOT to a SAM with 11additional accounts, including five tax accounts and one tradeaccount.
We began by representing sectoral relationships in a graph andcalculating forward and backward linkages to obtain an initialpicture of the structural role played by electricity activities. Thisanalysis was further fleshed out by an examination of dependencechains through the hierarchical classification of sectors based ontheir supply- or demand-side nature.
One of the salient structural features of the Spanish electricitysystem is its scant connection with foreign power distributiongrids. Connections with France, Portugal and Morocco are far whatmight be considered a desirable level, which means that domesticoutput must meet Spanish demand practically in its entirety, whileexports and imports of electricity are absolutely nugatory. This hasserious consequences for competitiveness and has fostered theemergence of oligopolistic structures. There can be no doubt that
2
4
R. Duarte et al. / Energy 141 (2017) 2640e26512648
increasing the level of connections with France and other countrieswould encourage competition in the electricity market and helpsecure the power supply.
Another significant finding is that both generating and thetransport and distribution sectors are highly capital intensive butcreate relatively few jobs. This is doubtless largely a consequence ofthe technical characteristics of these activities, but it also points tothe highly relevant fact that these industries are not a priori driversof employment. As we revealed by the linkages analysed, however,the sector is strongly linked to extractive industries (notably coal),which do create jobs, and this is something that should not belightly passed over.
Our findings with regard to the “key” nature of the electricitysector were something of a surprise. It is common sense to supposeelectricity to be essential to economy, and it might therefore beimaged that these are “Rasmussen” key sectors. As we have seen,however, this is true only of Electricity marketing, while all of theothers except Related activities are backward sectors (i.e. demandpredominates over supply), or they are not significant. Hence, noneof the electricity generating sectors is key. The explanation isfortunately simple and may be observed in Table 5. All of thesesectors have strong linkages to metals industries, construction andtransport, and their significance to the wider economy lies in theirrole in aiding the development of these sectors.
The disaggregation of the electricity sectors also revealed howvaried they actually are, which should put us on our guard aboutmaking overly general analyses. The power generated by conven-tional thermal systems and hydroelectric plants accounts for morethan 50% of the value of electricity output, yet it is nuclear andwindpower that exercise public opinion. Nuclear power produces onlyaround 7% of total output, while wind generating suffers from theproblem of variability and the technical difficulty of accumulation.This may be why neither these two sectors are relevant under theRasmussen classification, as shown in Table 5.
The electricity sectors are also very different in terms of the
Table A1Criteria estimation for Supply variables.
Sectoral variables in SABI datafor electricity sector j
Variable name of electricitysectors j from 2013IOTDE
Aggregated value (a¼(aj)) Value added at basic prices (b¼(bj))
Personnel expenditure (c¼(cj)) Gross wages and salaries (e¼(ej))
Social contributions (f¼(fj))
Remuneration of employees (d¼(dj))Corporate tax (g¼(gj)) Other net taxes on production (h¼(hj))
Out-turn for the financial year(k¼(kj))
Gross operating surplus/Mixedincome (n¼(nj))
Allowances for depreciation(l¼(lj))
Financial expenses (m¼(mj))Operating Income (u¼(uj)) Total resources (v¼(vj))
Corporate tax (g¼(gj)) Net taxes on products (p¼(pj))
Imports (q¼(qj)) Total imports (r¼(rj))
Imports EU (s¼(sj))
Imports RoW (t¼(tj))
Production at basic prices (x¼(xj))Production at purchaser prices(w¼(wj))Total intermediate inputs (z¼(zj))
Source: Own work with data from Refs. [34,36,37].
business models involved: while the generating sectors' revenuesare determined basically by daily electricity auctions, transport anddistribution revenues are tariff-based, and the marketing sectoroperates under fundamentally competitive conditions. This is afurther indication of the highly varied nature of the industry as awhole, and therefore of the need to ensure that analyses take ac-count of inter-sector differences.
These differences and the limitations of the structural analysisbased on input-output tables described in this paper provide thestarting point for our main line of future research, the extension ofthe SAM obtained to a computable general equilibrium model atthe same level of disaggregation. This would provide a sound basisfor the analysis of differentiated policies targeting the varioussectors involved in the electricity industry and it would allowquantification of the likely effects of upgrading connections withEurope, as well as evaluation of the possible outcomes of changes inconsumption patterns or the mix of generating technologies.
Finally, electricity sector activities have also been decoupled inother European countries, and in this light our methodology andconclusions about the structure of electricity production may wellbe applicable to other countries or regions. This is a further line ofresearch which we hope to address at some point in the future.
Acknowledgements
Wearegrateful for thepartialfinancingreceived fromtheECO2013-41353-P and ECO2016-74940-P projects of the Spanish Ministry ofEconomy and Competitiveness, and the Aragonese Government,through the pre-doctoral grant, and through the S10 consolidatedgroup and the Social European Fund in the years 2015 and 2016.
Appendix
Criteria for estimation
bj ¼ ajPj
aj�0:6209�Value added in Electricity sector
ej ¼ cjPj
cj�0:6209�Wages and salaries in Electricity sector
fj ¼ ejtf ; with tf ¼ Social contributions in Electricity sectorWages and salaries in Electricity sector
dj ¼ ej þ fjhj ¼ cgP
j
gj�0:6209�Other net taxes on production in Electricity sector
We obtain ~nj ¼ kj þ lj þmj , then nj is estimated as:
nj ¼ ~njPj
~nj�0:6209�Gross operating surplus=Mixed income in Electricity sector
vj ¼ ujPj
uj�0:6209�Total resources in Electricity sector
pj ¼ gjPj
gj�0:6209�Net taxes on products in Electricity sector
rj ¼ qjPj
qj�0:6209�Total imports in Electricity sector
sj ¼ rjts; with ts ¼ EU imports in Electricity sectorTotal imports in Electricity sector
tj ¼ rjtt ; with tt ¼ RoW imports in Electricity sectorTotal imports in Electricity sector
xj ¼ vj � rjwj ¼ xj � bj
zj ¼ wj � pj
Table A2Criteria estimation for Final demand variables.
Sectoral variables in SABI datafor electricity sector
Variable name of electricity sectors i from2013SIOTDE
Criteria for estimation
Total use (C¼(Ci)) Ci ¼ vj, Total uses are equal to Total resourcesConsumption of households (E¼(Ei)) Hi ¼ CiP
i
Ci�0:6209�Consumption by households in Electricity sector
Consumption of the non-profit institutions(F¼(Fi))
Hi ¼ CiPi
Ci�0:6209�Consumption by non� profit institutions in Electricity sector
Consumption of Government (G¼(Gi)) Hi ¼ CiPi
Ci�0:6209�Consumption by Government in Electricity sector
Total final consumption expenditure (H¼(Hi)) Hi ¼ Ei þ Fi þ Gi
Fixed assets 2010 (J¼(Ji)) Gross fixed capital formation (K¼(Ki)) Ki ¼ Ji�LiPi
ðJi�LiÞ �0:6209�Gross fixed capital formation in Electricity sector
Fixed assets 2009 (L¼(Li))Inventories 2010 (M¼(Mi)) Variation of inventories (N¼(Ni)) We estimate Ni as Ni ¼ ðMi � OiÞ � rCi , with r being
r ¼
264Pi
ðMi�OiÞ�0:6209�Variation of inventories and :::: in Electricity sectorPi
Ci
375
Inventories 2009 (O¼(Oi))Gross capital formation (P¼(Pi)) Pi ¼ Ki þ Ni
Exports (Q¼(Qi)) Total exports (R¼(Ri)) Ri ¼ QiPi
Qi�0:6209�Total exports in Electricity sector
Exports EU (S¼(Si)) Si ¼ RitS; with tS ¼ EU exports in Electricity sectorTotal exports in Electricity ector
Exports RoW (T¼(Ti)) Ti ¼ RitT ; with tR ¼ RoW exports in Electricity sectorTotal exports in Electricity sector
Total final demand (U¼(Ui)) Ui ¼ Hi þ Pi þ RiTotal intermediate demand (V¼(Vi)) Vi ¼ Ci � Ui
Source; Own work.
Table A3Accounts of the SAM.
Accounts
1 Agriculture, livestock, hunting and related services2 Forestry and logging3 Fisheries and aquaculture4 Extractive industries5 Agrifood industry6 Textile industry7 Industry of wood and cork8 Paper industry9 Graphical arts and reproduction of recorded media10 Manufacture of coke and refined petroleum11 Chemicals12 Manufacture of pharmaceutical basics and prepared pharmaceutical products13 Manufacture of products of rubber and plastic14 Manufacture of other non-metallic mineral products15 Manufacture of products of iron, steel and ferroalloys16 Manufacture of metallic products, except for machinery and equipment17 Manufacture of computer products, electronic and optical products18 Manufacture of material and electrical equipment19 Manufacture of machinery and equipment n.c.o.p.20 Manufacture of motor vehicles, trailers and semi-trailers21 Manufacture of other transport equipment22 Manufacture of furniture; other manufacturing23 Repair and installation of machinery and equipment24 Generation of electricity from wind25 Generation of electricity from nuclear26 Generation of electricity from conventional thermal27 Generation of electricity from other sources28 Generation of hydropower29 Transmission of electricity30 Distribution of electricity31 Commercialization of electricity32 Related activities to the electricity sector33 Gas, steam and air conditioning34 Collection, purification and distribution of water35 Withdrawal and treatment of waste water and residues36 Construction37 Sale and repair of motor vehicles and motorcycles38 Wholesale trade39 Retail trade, except for motor vehicles and motorcycles40 Overland transport and pipelines41 Maritime transport and interior waterways
(continued on next page)
R. Duarte et al. / Energy 141 (2017) 2640e2651 2649
Table A3 (continued )
Accounts
42 Air transport43 Storage and attached activities to transport44 Post and courier activities45 Hosting, service of meals and drinks46 Publishing47 Activities of cinema, television and music48 Telecommunications49 Information, transmission and computer services50 Financial services, except insurance and pension funding51 Insurance, reinsurance and pension funding, except compulsory social security52 Auxiliary activities to financial services and to insurances53 Real estate activities54 Juridical and consultation activities55 Technical services of architecture and engineering; tests and technical analyses56 Scientific research and development57 Advertising and market research58 Other professional, scientific and technical activities; veterinary activities59 Rental activities60 Activities related to employment61 Activities related to tourism62 Safety activities and investigation and auxiliary activities to companies63 Public administration and defence64 Education65 Sanitary activities66 Activities of social services67 Activities of arts, entertainment and recreation68 Sports activities and amusement and recreation activities69 Activities of membership organizations70 Computer repair, personal items and housewares71 Other personal services72 Activities of households as employersL LaborK CapitalH HouseholdSI Savings/InvestmentCotizem Social contributions by employerstn Net taxes on productsTy Other net taxes on productionCotizt Social contributions by employeesIRPF Income tax from individualsG Government expenditureFT Foreign tradeMT Margins and taxes on productssum Total (equal to total resources)
Source: own work.
R. Duarte et al. / Energy 141 (2017) 2640e26512650
References
[1] MAGRAMA (Spanish Ministry of Agriculture and Environment). Spanish sus-tainable development strategy. 2007. http://www.mapama.gob.es/es/ministerio/planes-estrategias/estrategia-espanola-desarrollo-sostenible/09047122800cfd5b_tcm7-14860.pdf.
[2] Pardo Abad CJ. Situaci�on actual del sector energ�etico en Espa~na. Espacio,Tiempo y Forma, Serie VI. Geografía 2001;13:59e83.
[3] Langarita R, S�anchez-Ch�oliz J, Sarasa C, Duarte R, Jim�enez S. Electricity costs inirrigated agriculture: a case study for an irrigation scheme in Spain. RenewSustain energy Rev 2017;68:1008e19.
[4] BOE. Law 54/1997, of November 27th of electric sector. Off State Bull 1997;285.[5] Ang BW. Decomposition analysis for policymaking in energy: which is the
preferred method? Energy Policy 2004;32:1131e9.[6] WangWW, Liu X, Zhang M, Song XF. Using a new generalized LMDI method to
analyze China's energy consumption. Energy 2014;67:617e22.[7] Su B, Ang BW. Structural decomposition analysis applied to energy and
emissions: some methodological developments. Energy Econ 2012;34:177e88.
[8] Zhang M, Song Y. Exploring influence factors governing the changes in China'sfinal energy consumption under a new framework. Nat Hazards 2015;78:653e68.
[9] Zhang H, Lahr ML, Bi J. Challenges of green consumption in China: a householdenergy use perspective. Econ Syst Res 2016;28:183e201.
[10] Lopes de Carvalho A, Henggeler Antunes C, Freire F, Olivera Henriques C.A hybrid inputeoutput multi-objective model to assess econom-iceenergyeenvironment trade-offs in Brazil. Energy 2015;82:769e85.
[11] Cui LB, Peng P, Zhu L. Embodied energy, export policy adjustment and China'ssustainable development: a multi-regional input-output analysis. Energy
2015;82:457e67.[12] Meng FY, Zhou DQ, Zhou P, Bai Y. Sectoral comparison of electricity-saving
potentials in China: an analysis based on provincial input-output tables. En-ergy 2014;72:772e82.
[13] Pahlavan R, Omid M, Akram A. Energy input-output analysis and applicationof artificial neural networks for predicting greenhouse basil production. En-ergy 2012;37:171e6.
[14] Kuhtz S, Zhou C, Vito Albino V, Yazan DM. Energy use in two Italian andChinese tile manufacturers: a comparison using an enterprise inputeoutputmodel. Energy 2010;35:364e74.
[15] Logar I, Van den Bergh JCJM. The impact of peak oil on tourism in Spain: aninput-output analysis of price, demand and economy-wide effects. Energy2013;54:155e66.
[16] Ozkan B, Akcaoz H, Fert C. Energy inputeoutput analysis in Turkish agricul-ture. Renew Energy 2004;29:39e51.
[17] Hartono D, Resosudarmo BP. The economy-wide impact of controlling energyconsumption in Indonesia: an analysis using a Social Accounting Matrixframework. Energy Policy 2008;36:1404e19.
[18] Baiocchi G, Minx J, Hubacek K. The impact of social factors and consumerbehavior on carbon dioxide emissions in the United Kingdom. J Ind Ecol2010;14:50e72.
[19] Parikh J, Panda M, Ganesh-Kumar A, Singh V. CO2 emissions structure of In-dian economy. Energy 2009;34:1024e31.
[20] Cansino JM, Cardenete MA, Gonz�alez-Lim�on JM, Rom�an R. The economic in-fluence of photovoltaic technology on electricity generation: a CGE(computable general equilibrium) approach for the Andalusian case. Energy2014;73:70e9.
[21] Fujimori S, Dai H, Masui T, Matsuoka Y. Global energy model hindcasting.Energy 2016;114:293e301.
R. Duarte et al. / Energy 141 (2017) 2640e2651 2651
[22] INE. Cuentas econ�omicas. Contabilidad Nacional Anual de Espa~na. Base 2010.Marco input-output. 2016. http://www.ine.es/jaxi/menu.do?type¼pcaxis&path¼/t35/p008/&file¼inebase.
[23] Cazcarro I, Duarte R, S�anchez-Ch�oliz J. Water consumption based on a dis-aggregated social accounting matrix of Huesca (Spain). J Ind Ecol 2010;14(3):496e511.
[24] Vel�azquez E. An inputeoutput model of water consumption: analysingintersectoral water relationships in Andalusia. Ecol Econ 2006;56:226e40.
[25] Alc�antara V, Padilla E. “Key” sectors in final energy consumption: an input-output application to the Spanish case. Energy Policy 2003;31:1673e8.
[26] Polo Clemente, Valle Elisabeth. Un an�alisis input-output de la economíabalear. Estadística Espa~nola 2002;44(151):393e444.
[27] EUROSTAT. Eurostat manual of supply, use and input-output tables. Eurostatmethodologies and working papers. ISSN 1977e0375. 2008.
[28] Junius T, Oosterhaven J. The solution of updating or regionalizing a matrixwith both positive and negative entries. Econ Syst Res 2003;15(1):87e96.
[29] Lenzen M, Wood R, Gallego B. Some comments on the GRAS method2007;19(4):461e5.
[30] INE. (Instituto Nacional de Estadística). Cuentas econ�omicas. ContabilidadNacional de Espa~na. Base 2000. Marco input-output. Resultados 2000-2007.Published on December 20, 2010. 2010. http://www.ine.es/daco/daco42/cne00/cneio2000.htm.
[31] MINETUR. La energía en Espa~na 2005. Gobierno de Espa~na: Ministerio deindustria, comercio y turismo; 2005.
[32] MINETUR. La energía en Espa~na 2013. Gobierno de Espa~na: Ministerio deindustria, comercio y turismo; 2013.
[33] MINETUR. La energía en Espa~na 2010. Gobierno de Espa~na: Ministerio deindustria, comercio y turismo; 2010.
[34] MINETUR. La energía en Espa~na 2011. Gobierno de Espa~na: Ministerio deindustria, comercio y turismo; 2011.
[35] SABI. Sistema de An�alisis de Balances Ib�ericos. On-line database. [View: 5 April2017]. Available under license:. 2017. https://sabi.bvdinfo.com/version-20151210/Search.QuickSearch.serv?_CID¼0&context¼3VTIBVFGGIWNW7U.
[36] UNESA. Asociaci�on espa~nola de la industria el�ectrica. Informe el�ectrico.Memoria de actividades. Memoria estadística. 2013. 2013.
[37] Barrera-Lozano M, Mainar AJ, Vall�es J. Disaggregation of sectors in social ac-counting matrices using a customized Wolsky method. Appl Econ Lett2015;22(13).
[38] UNESA. Asociaci�on espa~nola de la industria el�ectrica. Informe el�ectrico.Memoria de actividades. Memoria estadística. 2014. 2014.
[40] CNMC. Report about the results of the provisional liquidation number 8 of2013 electricity sector. National Commission of Markets and Competition;2013.
[41] OMIE. Electricity market. April 2017. 2014. http://www.omie.es/files/flash/ResultadosMercado.swf.
[42] Peters JC. The GTAP-power database: disaggregating the electricity sector inthe GTAP database, working paper. West Lafayette, IN, USA: Center for GlobalTrade Analysis, Purdue University; 2015.
[43] AEAT. Informe anual de recaudaci�on tributaria a~no 2013. Agencia Tributaria:Servicio de Estudios Tributarios y Estadísticas; 2013.
[44] MEYSS. Presupuestos de la Seguridad Social. Ejercicio 2014 Seguridad Social.Informe econ�omico-financiero. Gobierno de Espa~na: Secretaría de Estado de laSeguridad Social. Ministerio de empleo y seguridad social; 2014.
[45] Leontief W. The structure of American economy 1919-1929: an empiricalapplication of equilibrium analysis. Cambridge, Massachusetts: HarvardUniversity Press; 1941.
[46] Rasmussen PN. Studies in intersectoral relations. Copenhagen and Amster-dam: Einar Harcks Forlag & North-Holland; 1956.
[47] S�anchez J, Royo M, Moraga B, Soto S, Del Amo JA. Technological blocks in 1972,1978 and 1985 input-output tables of aragon. In: 3rd conference on aragoneseeconomy. Zaragoza (Spain): Regional Government of Aragon; 1994.