The “Elephant in the Room” Issues in pastoralism research: An informal conversation Peter D. Little and Waktole Tiki Academic Workshop on Mobile Pastoralism, Index Insurance, Computational Sustainability and Policy Innovations for the Arid and Semi-arid Lands of East Africa ILRI Campus, Nairobi Kenya, June 10-11, 2015
Transcript
The “Elephant in the Room” Issues in pastoralism research: An informal conversation
Peter D. Little and Waktole Tiki
Academic Workshop on Mobile Pastoralism, Index Insurance, Computational Sustainability and Policy Innovations for the
Arid and Semi-arid Lands of East AfricaILRI Campus, Nairobi Kenya, June 10-11, 2015
Goals of the presentation
• Are there some big fundamental issues and trends in pastoralism research that are missed in micro-level, project based research? I will discuss 10. It builds on an earlier paper I wrote for a volume by Catley, Lind, and Scoones (2012).
• Present some of the evidence from our current research program on “Climate-induced vulnerability: Pastoralism and livestock marketing chains in southern Ethiopia and northeastern Kenya (CHAINS). Not heavy on empirics!
• Have an informal conversation!
1. Population Issue
• Town and settlement growth• Demography of mobile pastoralists vs sedentary
pastoralists• Labor absorptive capacity ofPastoralism: low?• In the Borana case settle-ments often in dry seasonGrazing (deep well areas)• Impacts on grazing patterns?
2. Towns matter in pastoral areas
• For diversification: employment and investment
• Links to pastoral sector• Markets• Bring in large numbers of non-pastoralists• Politics and policy!
3. Governance and Democracy Issue
• Related to population and town growth• Mobile pastoralists becomes minority in its
own areas?• Implications for decentralization—”voice of
pastoralists?”• Elections and democracy
4. Basic Services Issue
• Health, water, and education always rank highest priorities in participatory assessments.
• What are we missing here?• Where do we start?
5. Education Issue
• Formal education matters for jobs—productive diversification.
• Political representation and giving a voice to communities.
• Fundamental tasks require literacy—basic math, etc.
• How to deliver education? • The costs of education in loss of labor, settlement,
etc.• Promote sub-division of commons? Youth vs elders
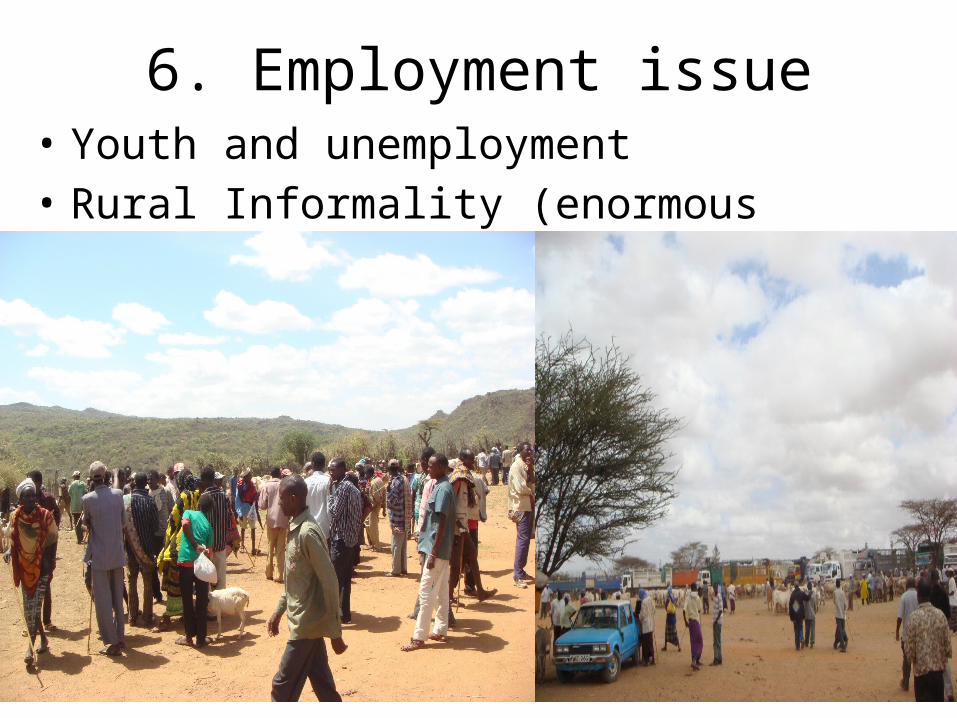
6. Employment issue• Youth and unemployment• Rural Informality (enormous employment)
6. Employment issue (cont)
• Do we understand the employment multipliers of livestock trade, pastoralism, etc.
> 300 BUSINESSES AT HAROBAKE MARKET, BORANA, ETHIOPIA
7. Domestic markets matterWhere is the highest value market?
Figure 2. Average prices for mature male cattle: source Ethiopian livestock market information system
Source: W. Tiki, 2014, p. 23
8. The credit Issue
• Credit flows up the market chain (from smallest to largest traders)
• Default on credit and risk is high—the smallest traders are hurt the most—more than 30 percent of traders experience credit default
Credit defaulters, amount (birr) in the second round of interviews
N Minimum Maximum Mean Std. Deviation
Amount lost (in Birrs) 27 960 2000000 311709.3 545477
Times defaulted 27 1 6 1.2 0.97
Number of defaulters 27 1 5 1.3 0.92
Source: W. Tiki, Third year annual report, 2014.
9. The Herd Structure Issue: why so little change?
Evidence: Dairy and breeding herds, Borana, Ethiopia, 2013
Male camels
Female camels
Male cattle
Female cattle
Male goats
Female goats
Total number 35 100 294 1313 246 964
% of herd 26 % 74% 18.5% 81.5% 20.5% 79.5%
SOURCE: DATA FROM CHAINS STUDY, 2013
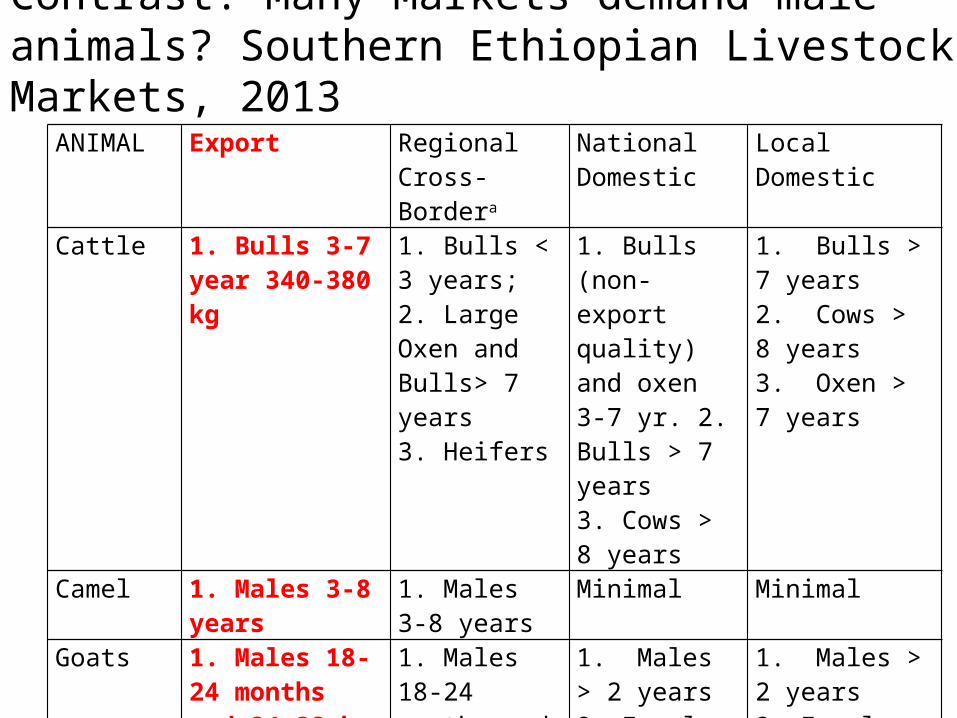
ANIMAL Export Regional Cross-Bordera
National Domestic
Local Domestic
Cattle 1. Bulls 3-7 year 340-380 kg
1. Bulls < 3 years;2. Large Oxen and Bulls> 7 years3. Heifers
1. Bulls (non-export quality) and oxen 3-7 yr. 2. Bulls > 7 years 3. Cows > 8 years
Livelihood Strategies Sell livestockGrain stocks decline Food expenditures increaseSearch for off-farm employ’tConserve cashSell woodBorrow from merchants and familyMaintain and invest in social networks
Livestock distress sales and weight loss; livestock consumedConsume wild roots/leaves search for off-farm emply’tOut-migrationGo to live with relativesLittle investment in social networksSell h’hold items+implementsIncreased sharecropping
Consume seedExtreme livestock mortalityGrain stocks dry upHomes deconstructed to sell wood and corrugated ironOutmigration if health allowsFamilies and communities unravelSocial networks difficult to maintain
Unknown
Market Characteristics Land rental rates increaseBorrowing costs increaseWage rate declines slightlyGrain prices rise slightlyLivestock prices begin to declineDiets and labor productivity maintained
Wage rates fall; land rental rates riseLabor demand declinesGrain prices spike in thin mktsLivestock prices plummet giving from the well-off to poor w/in community
Borrowing costs spikeLand rental rates fallWood/livestock prices collapseCereal prices uncertain due to food aidCommunity network collapsesMalnutrition, disease, death
Unknown
Climate/Drought Risk (multi-year cycles) (Roth and Little, 1998)
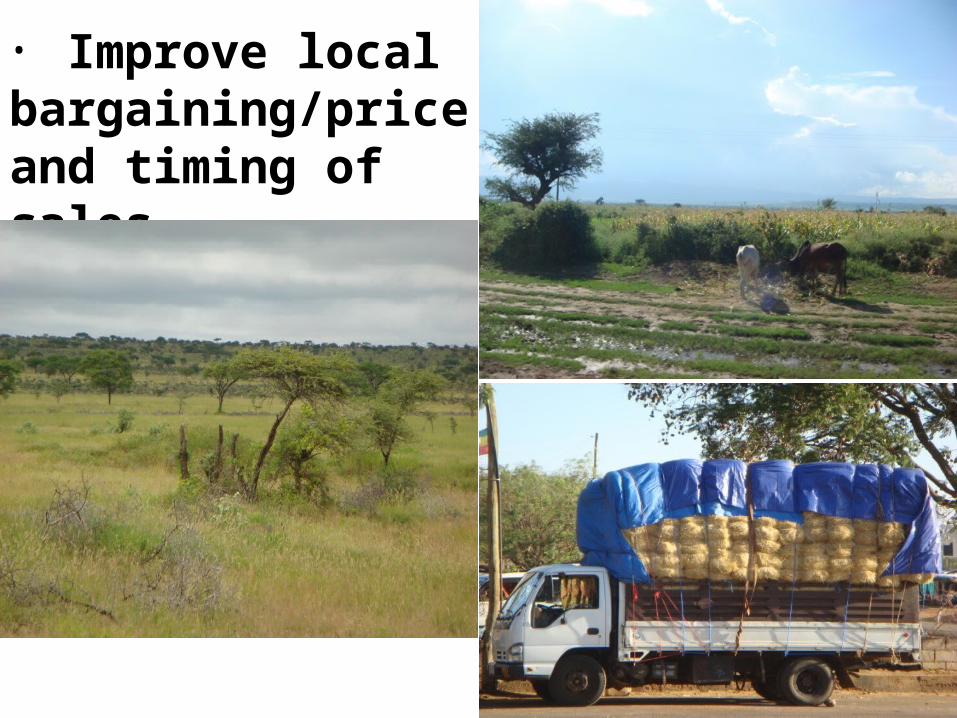
• Improve local bargaining/price and timing of sales–
•Address feed problem
Abattoirs Export traders Local traders Local pastoralists0.00%
10.00%
20.00%
30.00%
40.00%
50.00%
60.00%
70.00%
80.00%
Livestock Buyers (Access issue for herders), Borana, ETH
Buyers
Buyers
Per
cen
tag
e S
har
e o
f B
uye
rs
Mobility affects market access: Fixed markets are not where best grazing is, esp in droughts(map by Sarah Guagliardo)
Uneven Impacts and Losses due to Feed shortage (drought)
Photos by Dejene N. Debsu
ASANTE SANA
Acknowledgements: Support for this research was provided by the Climate-Induced Vulnerability and Pastoralist Livestock Marketing Chains in southern Ethiopia and northeastern Kenya (CHAINS) Project of the Innovation Lab for Adapting Livestock Systems to Climate Change (ALS-CC) Collaborative Research Program (USAID Grant No. EEM-A-00-10-00001). The opinions expressed herein are those of the authors and do not necessarily reflect the views of the U.S. Agency for International Development (USAID).
Thanks also due to members of CHAINS project: Dejene Negassa DebsuPolly EricksenUriel Kitron Hussein A. MahmoudWorkneh NegatuCarla Roncoli