20
The Ellevest Difference THE FINE PRINT ON EXPECTED RETURNS SYLVIA S. KWAN, PH.D., CFA, CHIEF INVESTMENT OFFICER LAST UPDATED: 6.4.2018 © 2016-2018 ELLEVEST, INC. ALL RIGHTS RESERVED. . .

The Ellevest Difference
THE FINE PRINT ON EXPECTED RETURNS
SYLVIA S. KWAN, PH.D., CFA, CHIEF INVESTMENT OFFICER
LAST UPDATED: 6.4.2018
© 2016-2018 ELLEVEST, INC. ALL RIGHTS RESERVED.
..

THE ELLEVEST DIFFERENCE
BY SYLVIA KWAN, CIO LAST UPDATED: 5.31.2018 • © 2016-2018 ELLEVEST, INC. ALL RIGHTS RESERVED. 2
We’ve received a tremendous amount of feedback from women as we’ve introduced
Ellevest. Some of our mathematically inclined users put themselves through the paces of
trying to calculate what we are projecting for portfolio returns based upon our forecasts;
some have then asked why our numbers might appear lower than they may have
expected. After all, investment professionals are forecasting global equities to return
4.5–7.1% in the medium to long term,1 and our forecasts appear to project returns closer
to 3-5% over a long horizon. So that begs the question:
How are Ellevest’s forecasts different from other digital advisors and what investment professionals are predicting in the press? No, it’s not because we are pessimists, or claim to know where markets are headed. And
it’s certainly not because we think our recommended portfolios will underperform other
low-cost portfolios with similar asset allocations.
Yes, our forecasts are different. That’s because, unlike other digital advisors who show
forecasts, we account for realities such as taxes and fees, and build layers of
conservatism into the projections we provide to you. Specifically, our forecasts:
● Show a higher likelihood of achievement. We shoot to get you to your goals in 70% of
markets, while some other digital advisors who show forecasts shoot for 50%
● Include more poor market scenarios that are more consistent with what has been
seen historically
1 From 2018 global economic and investment outlook publications from The Vanguard Group and JP Morgan Asset
Management.
THE ELLEVEST DIFFERENCE
BY SYLVIA KWAN, CIO LAST UPDATED: 5.31.2018 • © 2016-2018 ELLEVEST, INC. ALL RIGHTS RESERVED. 3
● Account for real-world realities such as taxes, fees, and inflation
● Account for the sequence and magnitude of investment returns, known as
compounding (averages published in the press aren’t usually compounded)
● Account for regular cash flows, such as monthly deposits
● Account for our customized glide paths, which generally reduce the risk of your
portfolio as you reach your goal
Rather than follow what other advisors do, we acted on the feedback and insights from
hundreds of hours of interviews with women. The result? Forecasts that are more
representative of what we believe investors may experience, and forecasts that have a
higher likelihood of achievement. While we could simply do what everyone else is doing,
we prefer to bring a high level of transparency to what we do at Ellevest, even if the news
isn’t as rosy. We believe that our clients make important savings and investment
decisions based upon the outcomes that we show in our Ellevest plans. Showing
outcomes that may be more optimistic by ignoring taxes and/or compounding may lead
our clients to make decisions that could result in a shortfall under realistic market
conditions. Rather, we believe our clients should understand what they could realistically
expect when investing under uncertainty. This paper explains why our forecasts are
intended to more realistically reflect investing in a world where taxes and fees are
certain, but future outcomes … not so much.
A higher likelihood of achievement At Ellevest, our recommendations are intended to help you reach your financial goals in
the majority of market scenarios — specifically, in 70% of market scenarios. Some digital

THE ELLEVEST DIFFERENCE
BY SYLVIA KWAN, CIO LAST UPDATED: 5.31.2018 • © 2016-2018 ELLEVEST, INC. ALL RIGHTS RESERVED. 4
advisors who provide forecasts highlight outcomes with just a 50% likelihood of
achievement; they might argue that, after all, that’s what you are likely to achieve on
average. But on average doesn’t cut it for us. Our forecasts show you outcomes with a
higher than average likelihood, so you can plan with greater confidence regarding the
financial goals that we project for you.
Charts A, B, and C below illustrate this difference. Chart A shows the distribution of
possible outcomes for a $100,000 investment in a high equity portfolio at the end of 20
years2. The far-left column shows a small number of instances where you may end up
close to where you started if markets perform well below average. Over towards the far
right, you can see a few instances where your $100,000 could grow to $1.5M or more,
although the frequency of those outcomes is very low, as illustrated by the very short
height of those columns. The tallest columns are where your portfolio is most likely to
end up, from $300,000 to $500,000.
2 These results were provided by Morningstar, Inc., using a Monte Carlo simulation— a forward looking, computer-
based calculation in which we run portfolios through a thousand different economic scenarios to determine a range of possible outcomes.

THE ELLEVEST DIFFERENCE
BY SYLVIA KWAN, CIO LAST UPDATED: 5.31.2018 • © 2016-2018 ELLEVEST, INC. ALL RIGHTS RESERVED. 5
As illustrated above, the final outcome of a 20-year investment of $100,000 (in a high
equity portfolio) can vary widely, depending upon stock market performance.
Chart B below is the same chart, showing that you may have $464,672 at the 50%
likelihood or “on average.” That means that your portfolio is equally likely to be above
$464,672 (light green columns) or below $464,672 (dark green columns). Hence, you
have a 50-50 chance of ending up somewhere in the light green regions or dark green
regions. This 50% forecast, $464,572, is the projection that some digital advisors (who
show forecasts) use.

THE ELLEVEST DIFFERENCE
BY SYLVIA KWAN, CIO LAST UPDATED: 5.31.2018 • © 2016-2018 ELLEVEST, INC. ALL RIGHTS RESERVED. 6
Chart C below illustrates the forecast that we show in your Ellevest plan. The forecast
that we show has a 70% likelihood of being in the light green columns, and a 30%
likelihood of ending up in the dark green columns. The 70% likelihood forecast,
$350,652, is clearly lower than the forecast at the 50% likelihood, but carries a higher
likelihood of achievement (or better). Because our clients prefer greater likelihood to
less, we developed our recommendations to maximize the chances of your portfolio
ending up in the light green region. Note that although we show you a forecast of
$350,652, there is a 70% chance it could be higher, and in some cases, very much higher.

THE ELLEVEST DIFFERENCE
BY SYLVIA KWAN, CIO LAST UPDATED: 5.31.2018 • © 2016-2018 ELLEVEST, INC. ALL RIGHTS RESERVED. 7
At Ellevest, we choose to project a lower forecast with a higher probability of
achievement over a higher forecast with a lower probability, even if that’s bad marketing
on our part.
The algorithms that drive our portfolio and savings recommendations seek to help you
achieve your goal with a 70% likelihood. In practical terms, that means that our Ellevest
plans are more likely to recommend that you save more as compared to other digital
advisors that aim for achievement at only a 50% likelihood. We believe our
recommendations give you a higher prospect of reaching your goal, and seek to mitigate
the potential for falling short.

THE ELLEVEST DIFFERENCE
BY SYLVIA KWAN, CIO LAST UPDATED: 5.31.2018 • © 2016-2018 ELLEVEST, INC. ALL RIGHTS RESERVED. 8
Simple averages versus the impact of compounding Many reputable investment firms publish forecasts for US and global equities based upon
extensive analyses and modeling of economic data. We are no exception. At Ellevest, we
partner with global investment research firm Morningstar3 to estimate economic
assumptions such as expected returns on global equities and the rate of long-term
inflation. These assumptions, which we call “valuation implied returns,” are important
because they drive the forecasting and advice algorithms that underlie the
recommendations in your Ellevest plan. Our return expectations over a 20-year period
are 5.3-9% for global equities, depending upon market capitalization and geographic
region.
That all sounds pretty good. That must mean that if these estimates come to fruition, we
can all expect our global equity portfolios to return 5.3-9% annually over the next 10 to
20 years, right? The answer is, well … not exactly. That’s because of the differences
between how these figures are determined and how your personal investment returns
are calculated. Neither is right nor wrong, but it’s important to understand the
differences between what’s commonly published and what is included in our forecasts of
your portfolio and the likelihood of achieving your goals.
Most estimated annual returns you read about in the paper are simple arithmetic
averages; they are commonly used to help facilitate apples-to-apples comparisons
among different types of investments. Arithmetic averages are calculated by adding up
each year’s expected returns and dividing by the number of years. They don’t include any
cash flows, like regular savings or withdrawals, taxes, or account for the compounding of
3 Morningstar Investment Management, LLC
THE ELLEVEST DIFFERENCE
BY SYLVIA KWAN, CIO LAST UPDATED: 5.31.2018 • © 2016-2018 ELLEVEST, INC. ALL RIGHTS RESERVED. 9
returns. Many investors erroneously assume that on average, over their investment
horizon, they can expect to earn these average returns annually. However, the returns an
investor will actually experience can be very different from these average annual returns.
A portfolio that went up 20% one year and down 20% the next has an average annual
arithmetic return of 0%, but in reality, you would actually be down 4%. This is due to the
impact of compounding, or more specifically, how each individual year’s return is tied to
the return of the prior year.
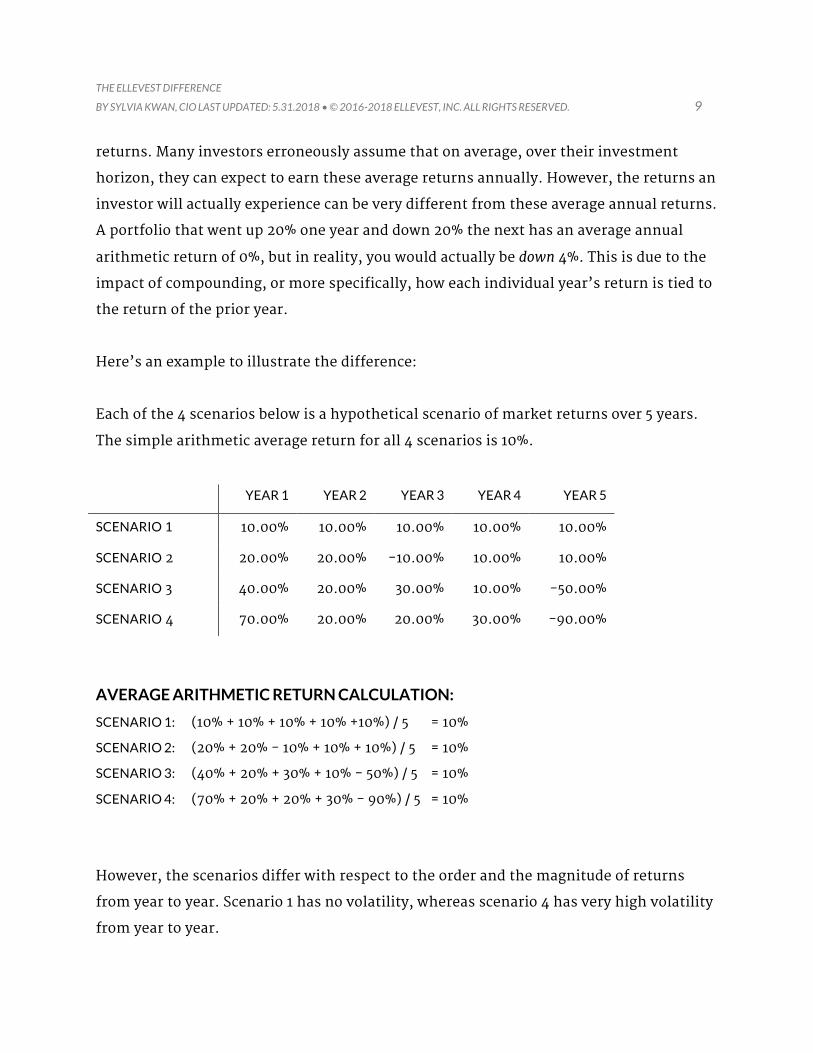
Here’s an example to illustrate the difference:
Each of the 4 scenarios below is a hypothetical scenario of market returns over 5 years.
The simple arithmetic average return for all 4 scenarios is 10%.
YEAR 1 YEAR 2 YEAR 3 YEAR 4 YEAR 5
SCENARIO1 10.00% 10.00% 10.00% 10.00% 10.00%
SCENARIO 2 20.00% 20.00% -10.00% 10.00% 10.00%
SCENARIO 3 40.00% 20.00% 30.00% 10.00% -50.00%
SCENARIO 4 70.00% 20.00% 20.00% 30.00% -90.00%
AVERAGE ARITHMETIC RETURN CALCULATION:
SCENARIO 1: (10% + 10% + 10% + 10% +10%) / 5 = 10%
SCENARIO 2: (20% + 20% - 10% + 10% + 10%) / 5 = 10%
SCENARIO 3: (40% + 20% + 30% + 10% - 50%) / 5 = 10%
SCENARIO 4: (70% + 20% + 20% + 30% - 90%) / 5 = 10%
However, the scenarios differ with respect to the order and the magnitude of returns
from year to year. Scenario 1 has no volatility, whereas scenario 4 has very high volatility
from year to year.

THE ELLEVEST DIFFERENCE
BY SYLVIA KWAN, CIO LAST UPDATED: 5.31.2018 • © 2016-2018 ELLEVEST, INC. ALL RIGHTS RESERVED. 10
Here’s how $100 invested at the beginning of each scenario would turn out at the end of 5
years:
GROWTH OF $100 COMPOUNDED ANNUAL RETURN
SCENARIO 1 $161.05 10%
SCENARIO 2 $156.82 9%
SCENARIO 3 $120.12 4%
SCENARIO 4 $31.82 -20%
Most investors will do the math using the estimated 10% average annual return, and
happily assume they’ll see $161 at the end of 5 years. But 4%? And negative 20%? How is
that possible? How can these 4 scenarios, each with a 10% average arithmetic return,
have such wide-ranging outcomes? The answer is … the power of compounding. In other
words, the order and magnitude of how you experience your returns year to year is a large
determinant of your personal rate of return.
There are also cash flows to consider. The arithmetic averages assume you buy and hold
your investment each year. However, investing over time — each month, once a quarter,
or even annually — impacts your personal rate of return. For example, if you invested
$100 and received a return of -20% in year one, and then +10% in year two, you would
end up with $88. However, if you invested $20 in year one and $80 in year two, you would
end up with $105.60. That’s because only $20 of your total $100 investment experienced
the down year, and more of your investment (i.e., $80) received the benefit of the up
year. Investing over time, like over 65% of Ellevest clients do, will impact your personal
rate of return, and cause it to differ from arithmetic average returns.

THE ELLEVEST DIFFERENCE
BY SYLVIA KWAN, CIO LAST UPDATED: 5.31.2018 • © 2016-2018 ELLEVEST, INC. ALL RIGHTS RESERVED. 11
At Ellevest, although our underlying models assume a 5.3%-9% arithmetic (pre-tax)
return for global equities, the sequence of returns you experience, as well as any cash
flows, will impact your personal rate of return. To get a realistic estimate of what you can
expect, we run your portfolio and your cash flows through many, many different market
scenarios — good, bad, high volatility, low volatility, etc. And the forecast that we show
you in your Ellevest plan projects achieving your goal in 70% of those market scenarios.
Models that include more downside scenarios
Every forecasting model, including ours, uses not only economic assumptions and
estimates of investment returns, but also models of how markets behave. No model is
perfect, but we strive to develop and use models of expected market returns that produce
results matching (as closely as possible) the returns we have seen historically. A popular
model used by advisors who generate forecasts assumes that stock returns are normally
distributed, meaning that equity returns resemble a bell curve, as seen below in Chart D.
These models are reasonably good predictors in the middle part of the curve, but not so
much at the tails. They predict very few extremely low or extremely high returns — when
historically, we’ve seen more of these types of returns, especially on the downside, than
a normal bell curve might predict.
Normal distribution models assume that very poor market scenarios4 have a probability
of occurring only one out of every 1,000 instances (in this case, months), or 0.13%.
However, history shows that these scenarios actually occur 10 times out of 1,000
instances, or closer to 1%.
Remember October of 1987? The S&P 500 fell more than 21.5% that month. And October
of 2008? Down 16.79% for the month. Those are 2 out of the 10 occurrences where equity
4 We define very poor market scenarios as those that are 3 standard deviations below the mean.

THE ELLEVEST DIFFERENCE
BY SYLVIA KWAN, CIO LAST UPDATED: 5.31.2018 • © 2016-2018 ELLEVEST, INC. ALL RIGHTS RESERVED. 12
returns returned lower than -15.0% for the month from 1926 through 2014. Most of us
would prefer to forget those episodes, but unfortunately, such events are part of the risks
of investing. We can prepare for them by forecasting how our portfolios would perform
under such conditions, and then invest and save appropriately so that our goals may be
achieved if poor market scenarios occur like they have in the past. Using a normal
distribution model, or any model that downplays or ignores the frequency of these poor
market scenarios result in forecasts that may be too optimistic. We hope for great
market returns yet prepare for bad markets, rather than hope for the best only to be
unpleasantly surprised.
In partnership with Morningstar, we use a model of returns behavior called truncated
Lévy flight (TLF) 5. We believe this model describes stock market returns that more
accurately reflect how markets have behaved historically, especially on the downside.
Chart D below illustrates the difference between using a normal and TLF distribution,
and how well the models would have predicted market returns historically.
5For more information:
https://corporate.morningstar.com/ib/documents/MethodologyDocuments/IBBAssociates/UsingTruncatedLevyFlightToEstimateDownsideRisk.pdf

THE ELLEVEST DIFFERENCE
BY SYLVIA KWAN, CIO LAST UPDATED: 5.31.2018 • © 2016-2018 ELLEVEST, INC. ALL RIGHTS RESERVED. 13
Source: Morningstar Investment Management LLC. Used with Permission.
As the chart illustrates, using a normal distribution model (red curve) fails to capture the
frequency of poor returns that we have seen historically, and likely results in forecasts
that are more optimistic. The TLF model (green curve) more closely matches the
historical data (green diamonds) for this period. At Ellevest, our models include these
bad market scenarios at a frequency that reflects what we’ve historically experienced:
about three October 2008-like events over a horizon of 30 years. Correspondingly, our
forecasts may be lower than those of advisors that use models assuming normally
distributed returns.
Taxes matter.

THE ELLEVEST DIFFERENCE
BY SYLVIA KWAN, CIO LAST UPDATED: 5.31.2018 • © 2016-2018 ELLEVEST, INC. ALL RIGHTS RESERVED. 14
The forecasts that we read about in the papers — those numbers that ranged from 4.5 to
7.1% for global equities — are estimated annual pre-tax returns. Generally, most
estimated returns you hear from advisors are pre-tax, to help facilitate an apples to
apples comparison between different types of investments. Our 5.3-9% estimated
arithmetic annual returns on global equities mentioned earlier are also pre-tax.
However, our forecasts of your portfolio in a taxable account includes the estimated taxes
you may pay in the course of investing, based upon an estimate of your personal tax rates.
For taxable accounts, the impact of including or ignoring taxes incurred from investing
can have a significant impact on your forecast and the achievement of your goals. For
most of us, paying taxes on dividends and interest earned, as well as realized capital
gains, is an annual affair. In a taxable account, these tax liabilities can’t be ignored or
deferred indefinitely.6 Ellevest’s forecasts include estimates of your personal tax impact,
and over long horizons, the amounts can add up.
Here’s an example. Let’s suppose you start with $20,000 and invest it for 11 years in a
low-cost diversified portfolio of about 80% equities, 20% bonds7. Chart E below shows
the estimated taxes that would be due each year, based upon an estimate of the interest
and dividends received, and any realized capital gains from rebalancing the portfolio.
Chart F illustrates the difference in outcomes. The red line shows the simulated growth
of the diversified portfolio assuming no taxes. The green line shows the simulated
growth under the same assumed market conditions, but including estimated taxes and
assuming those taxes are paid out of the account each year, as they are due (amounts
shown in Chart E). In this case, the taxes are estimated based upon a single woman
earning $80,000 and living in Texas. Both projections reflect a 70% likelihood of
achievement or better, and both accounts assume an advisory fee of 0.50% of assets,
6
Unless you have losses that offset all gains, and/or if the account is passed onto heirs and receives a step up in basis.
7 These results were provided by Morningstar, Inc., using a Monte Carlo simulation— a forward looking, computer-
based calculation in which we run portfolios through hundreds of different economic scenarios to determine a range of possible outcomes.

THE ELLEVEST DIFFERENCE
BY SYLVIA KWAN, CIO LAST UPDATED: 5.31.2018 • © 2016-2018 ELLEVEST, INC. ALL RIGHTS RESERVED. 15
which is paid out of the account each year. The forecast without taxes is 13% greater than
the forecast that includes taxes.
If your financial goal was to save and invest for a $48,000 down payment on a home, you
would probably feel pretty confident if your forecast showed you were on track to receive
$49,108, as shown in the chart above. However, if you account for the taxes you owe each
year for dividends, interest income, and realized capital gains, you would fall short of
your goal, netting less than $43,500 after tax. If you reside in a high-tax state (like New

THE ELLEVEST DIFFERENCE
BY SYLVIA KWAN, CIO LAST UPDATED: 5.31.2018 • © 2016-2018 ELLEVEST, INC. ALL RIGHTS RESERVED. 16
York or California) and have income placing you in a high marginal tax bracket, the
impact of ignoring taxes will be even more significant.
Some digital advisors’ forecasts are pre-tax, but you’ll need to read the fine print to
know this. And yes, with disclosure, showing pre-tax forecasts may not be wrong.
However, taxes are a real-world reality, and we believe that not accounting for them in
our forecasts would not benefit our clients in helping them achieve their financial goals.
This means that our forecasts, which incorporate taxes, will be lower than those of
advisors that show pre-tax forecasts. But we’d rather make it real (and personal to you)
than risk having you fall short of your goals.

THE ELLEVEST DIFFERENCE
BY SYLVIA KWAN, CIO LAST UPDATED: 5.31.2018 • © 2016-2018 ELLEVEST, INC. ALL RIGHTS RESERVED. 17
Glide paths: reducing portfolio risk as you reach your goal
The portfolios that we recommend at Ellevest begin at a specified equity level, which
generally decreases as you reach your goal, commonly called a “glide path.” Reducing
portfolio risk over time helps preserve principal and mitigate large losses as you near
your target goal. Each goal has its unique glide path, specifically designed to reduce the
chance of loss as you get closer to your goal. Some digital advisors who show forecasts do
not incorporate a glide path, but instead assume your current or target portfolio is
maintained for your entire investment horizon. Other digital advisors will use a glide
path in practice, but show forecasts that assume a constant target portfolio. This may
potentially lead to a mismatch between how your portfolio is managed over time and the
forecasted outcome. At Ellevest, our forecasts reflect the glide paths that we use to
manage your portfolio over time.
A HINT FOR YOU MATH GEEKS:
Because our forecasts are at the 70% likelihood, you can’t determine an implied average
expected return by dividing our forecast by your initial wealth and then annualizing. The
usual mathematical calculation for compounded returns doesn’t hold at the 70%
likelihood! For example, suppose you start with $10,000 to fund a Build Wealth goal.
Over 20 years, we forecast an outcome of $17,910 or better with a 70% likelihood.
Dividing this outcome by the original investment of $10,000 and annualizing the return
over 20 years results in an implied expected annual return of about 3%. Not terribly
compelling, right? Read on…
Remember that the forecast we show is at the 70% likelihood — that’s not the same as
average, it’s better than average. To determine an outcome at the 50% likelihood, the
70% forecast needs to be adjusted using a volatility correction. Doing so results in an

THE ELLEVEST DIFFERENCE
BY SYLVIA KWAN, CIO LAST UPDATED: 5.31.2018 • © 2016-2018 ELLEVEST, INC. ALL RIGHTS RESERVED. 18
estimated forecast of about $23,090. This estimate is an after-tax estimate that includes
the taxes that you incur (and pay) each year, the glide path towards less risky portfolios,
and the simulation of compounded returns with many market scenarios, including bad
ones that are modeled at a frequency consistent with history. For context, the after-tax
arithmetic expected returns we use in our underlying model for the Build Wealth goal
range from 6.22% at the beginning of the investment period to 4.92%, as the portfolio’s
risk glides down.
A final note: separating portfolio performance from projected outcomes
Well-documented research has shown that a portfolio's asset allocation (stock and bond
weightings) determines more than 93% of the variability in a portfolio's returns8. That
means that portfolios with like asset allocations and fees will perform similarly,
regardless of an advisor’s belief (or best guess) of how equities and bonds will perform in
the future. Whether your forecast is low or high, a low-cost, diversified portfolio of 80%
equities and 20% bonds will perform about the same over time, regardless of whether
you invest in this portfolio with Ellevest, another advisor, or create and manage the
portfolio yourself9. This is portfolio performance, which we won’t know until after the fact.
On the other hand, projected outcomes are exactly that —a projection or estimate that is
made before the fact. It’s important to remember that one doesn’t necessarily imply the
other. At Ellevest, we choose to show more realistic forecasts with higher likelihoods of
achievement, but our portfolios will perform similarly to other portfolios with similar
asset allocations, fees, and rebalancing policies.
8 Brinson, Gary P., L. Randolph Hood, and Gilbert L. Beebower. 1986. “Determinants of Portfolio Performance.” Financial Analysts Journal, vol. 42, no. 4 (July/August):39–44. 9 Excluding the deduction of advisory fees.

THE ELLEVEST DIFFERENCE
BY SYLVIA KWAN, CIO LAST UPDATED: 5.31.2018 • © 2016-2018 ELLEVEST, INC. ALL RIGHTS RESERVED. 19
IMPORTANT DISCLOSURES
The statements contained herein are the opinions of Ellevest. All opinions and views
constitute our judgments as of the date of writing and are subject to change at any time
without notice.
Forecasts or projections of investment outcomes are estimates only, based upon
numerous assumptions about future capital markets returns and economic factors. As
estimates, they are imprecise and hypothetical in nature, do not reflect actual
investment results, and are not guarantees of future results.
Information was obtained from third party sources, which we believe to be reliable but
not guaranteed for accuracy or completeness.
The information provided should not be relied upon as investment advice or
recommendations, does not constitute a solicitation to buy or sell securities and should
not be considered specific legal, investment or tax advice.
The information provided does not take into account the specific objectives, financial
situation or particular needs of any specific person.
Diversification does not ensure a profit or protect against a loss in a declining market.
There is no guarantee that any particular asset allocation or mix of funds will meet your
investment objectives or provide you with a given level of income.
The practice of investing a fixed dollar amount on a regular basis does not ensure a profit
and does not protect against loss in declining markets. It involves continuous investing
regardless of fluctuating price levels. Investors should consider their ability to continue
investing through periods of fluctuating market conditions.

THE ELLEVEST DIFFERENCE
BY SYLVIA KWAN, CIO LAST UPDATED: 5.31.2018 • © 2016-2018 ELLEVEST, INC. ALL RIGHTS RESERVED. 20
Investing entails risk including the possible loss of principal and there is no assurance
that the investment will provide positive performance over any period of time.
Morningstar Investment Management LLC is a registered investment adviser and
subsidiary of Morningstar, Inc. Morningstar Investment Management is a non-
discretionary consultant to Ellevest and provides fund-specific model portfolios, but is
not acting in the capacity of an adviser to individual investors. Morningstar Investment
Management provides investment recommendations to Ellevest; however, Ellevest
retains the discretion to accept, modify, or reject Morningstar Investment
Management’s recommendations.
COPYRIGHT • 2016-2018 ELLEVEST, INC. ALL RIGHTS RESERVED.


