22

The Emergency Food Assistance System—Findings From the Provider Survey,Volume I: Executive Summary. By James Ohls and Fazana Saleem-Ismail ofMathematica Policy Research, Inc., for Food and Rural Economics Division,Economic Research Service, U.S. Department of Agriculture. Food Assistance andNutrition Research Report No. 16-1.
Abstract
Findings of the first comprehensive government study of the Emergency FoodAssistance System (EFAS) suggest that public and private food assistance may workin tandem to provide more comprehensive food assistance than either could provide byitself. Five major types of organizations (emergency kitchens, food pantries, foodbanks, food rescue organizations, and emergency food organizations) that operate inthe EFAS were studied. About 5,300 emergency kitchens provide more than 173 mil-lion meals a year, and 32,700 food pantries distribute about 2.9 billion pounds of fooda year, which translates into roughly 2,200 million meals. Despite the substantialamounts of food distributed by the system, the EFAS remains much smaller in scalethan the Federal programs. The study, which was sponsored by USDA’s EconomicResearch Service, provides detailed information about the system’s operations andabout each of the five types of organizations. This report summarizes the results of thestudy. For more detail on the results, see The Emergency Food Assistance System—Findings From the Provider Survey, Volume II: Final Report at http://www.ers.usda.gov/publications/fanrr16. For more information on the survey methodology, see TheEmergency Food Assistance System—Findings From the Provider Survey, Volume III:Survey Methodology at http://www.ers.usda.gov/publications/efan01008.
Keywords: Food pantry, emergency kitchen, food bank, food rescue organization,emergency food organization, TEFAP.
This report was prepared by Mathematica Policy Research, Inc., under a research con-tract with the Economic Research Service. The views expressed are those ofMathematica and not necessarily those of ERS or USDA.
Washington, DC 20036-5831 June 2002

Acknowledgements
The authors would like to thank Linda Kantor, the USDA project officer for most ofthe study, for her guidance, assistance, and flexibility. Valuable input has also beenreceived from a number of other USDA staff members, including Laura Tiehen (theUSDA project officer for the final stage of the study), David Smallwood, MargaretAndrews, Steven Carlson, Craig Gundersen, Bob DeLorenzo, Pat McKinney, MarkNord, and Parke Wilde.
Important assistance in data collection was provided by Nancy Clusen and DaisyEwell, who helped to design the sampling approach and drew the sample; BarbaraKolln, who supervised the computer programming for the telephone data collection;Jennifer McNeill, who programmed the instrument for computer-assistance telephoneinterviewing; Renee Harris and Tom Barton, who managed the actual survey opera-tions; Kim Zito, who oversaw sample location activities; Bea Jones, who oversaw thedevelopment of the sampling frame; and Bharat Thakor, who developed the surveytracking computer system.
Larry Radbill made important contribution to the early design of the research andmade many valuable suggestions in his role as the quality assurance reader for thisreport. Amy Zambrowski provided highly effective work in designing and implement-ing the file construction process, while Melynda Ihrig efficiently produced manyrounds of SAS tabulations of the data. Julie Brys also helped with the programming atcritical points.
Valuable suggestions about an earlier draft of the report were provided by MarthaBurt, Ronette Briefel, Doug O'Brien, Lynn Parker, Barbara Cohen, and BrendanO'Flaherty.
Laura Berenson and Roy Grisham edited the entire manuscript, substantially improv-ing its clarity. They were helped by Patricia Ciaccio. Additional valuable editorial sup-port was provided by Courtney Knauth at USDA.
Jane Nelson provided extraordinary support in organizing the production of the manu-script of the report. She was assisted by Jill Miller, Cindy McClure, Marjorie Mitchell,Jennifer Baskwell, and Monica Capizzi-Linder.
ii � The Emergency Food Assistance System—Executive Summary/FANRR-16-1 Economic Research Service/USDA
Economic Research Service/USDA The Emergency Food Assistance System—Executive Summary/FANRR-16-1 � iii
Contents
Summary . . . . . . . . . . . . . . . . . . . . . . . . . . . . . . . . . . . . . . . . . . . . . . . . . . . . . . . . . . . . . . . . . . . . iii
Introduction . . . . . . . . . . . . . . . . . . . . . . . . . . . . . . . . . . . . . . . . . . . . . . . . . . . . . . . . . . . . . . . . . . . 1
Brief Description of the Organizations Participating in the EFAS . . . . . . . . . . . . . . . . . . . . . . 2
Overview of Findings . . . . . . . . . . . . . . . . . . . . . . . . . . . . . . . . . . . . . . . . . . . . . . . . . . . . . . . . . . . 4
Methods . . . . . . . . . . . . . . . . . . . . . . . . . . . . . . . . . . . . . . . . . . . . . . . . . . . . . . . . . . . . . . . . . . . . . . 6
Organizations in the EFAS . . . . . . . . . . . . . . . . . . . . . . . . . . . . . . . . . . . . . . . . . . . . . . . . . . . . . . . 7
Emergency Kitchens . . . . . . . . . . . . . . . . . . . . . . . . . . . . . . . . . . . . . . . . . . . . . . . . . . . . . . . . . . 7
Food Pantries . . . . . . . . . . . . . . . . . . . . . . . . . . . . . . . . . . . . . . . . . . . . . . . . . . . . . . . . . . . . . . . 8
Food Banks . . . . . . . . . . . . . . . . . . . . . . . . . . . . . . . . . . . . . . . . . . . . . . . . . . . . . . . . . . . . . . . . . 9
Food Rescue Organizations . . . . . . . . . . . . . . . . . . . . . . . . . . . . . . . . . . . . . . . . . . . . . . . . . . . 10
Commodity Programs and the EFAS . . . . . . . . . . . . . . . . . . . . . . . . . . . . . . . . . . . . . . . . . . . . . 11
Recent Changes in the Use of EFAS Services and Possible Unmet Demand . . . . . . . . . . . . . 12
EFAS Capacity To Meet Demand . . . . . . . . . . . . . . . . . . . . . . . . . . . . . . . . . . . . . . . . . . . . . . 13
Roles of the EFAS and the Federal Government in Providing Nutrition Assistance . . . . . . . . . . . . . . . . . . . . . . . . . . . . . . . . . . . . . . . . . . . . . . 15
References . . . . . . . . . . . . . . . . . . . . . . . . . . . . . . . . . . . . . . . . . . . . . . . . . . . . . . . . . . . . . . . . . . . 16
iv � The Emergency Food Assistance System—Executive Summary/FANRR-16-1 Economic Research Service/USDA
Summary
Findings of the first comprehensive government study of the Emergency FoodAssistance System (EFAS) suggest that public and private food assistance may workin tandem to provide more comprehensive services than either could provide by itself.Five major types of organizations (emergency kitchens, food pantries, food banks,food rescue organizations, and emergency food organizations) that operate in theEFAS were studied. The research, which was sponsored by USDA’s EconomicResearch Service, provides detailed information about the system’s operations andabout each of these five types of organizations. This report summarizes the results ofthe study.
The EFAS helps ensure adequate nutrition for low-income Americans who may nothave the resources to purchase sufficient food in stores and who may not be able toacquire sufficient food through government programs. Across the country, thousandsof emergency kitchens and food pantries provide food assistance to people throughoutthe year. Regional and national organizations, such as food banks and the food banks’national-level representatives, help the provider agencies obtain food and otherresources necessary to accomplish their mission. The EFAS provides meals and foodsupplies that, for many recipients, complement existing government food assistanceprograms.
The study was conducted when the effects of the 1996 national welfare reform werebecoming visible throughout the country. It examined how the EFAS is operating with-in the larger context of changes in America’s low-income assistance policies and howthe EFAS fits within the context of important government nutrition assistance pro-grams. It updates past studies of the EFAS and extends them to provide a broader,more nationally representative view of the system. Additional information will beobtained in a survey of EFAS clients, conducted in fall 2001.
Key findings:
• About 5,300 emergency kitchens and 32,700 food pantries participate in the EFAS.The kitchens provide more than 173 million meals. The pantries distribute an esti-mated 2.9 billion pounds of food per year, which translates into roughly 6 millionmeals per day, or 2,200 million meals per year.
• Despite the substantial amounts of food distributed by the system, the EFAS remainsmuch smaller in scale than the Federal programs that provide food assistance to thepoor.
• The EFAS is mostly locally based, with a wide variety of program structures andinnovative practices that meet differing local needs and that use differing localresources and local opportunities.
• Many direct service providers in the EFAS—65 percent of emergency kitchens and67 percent of food pantries—are faith-based organizations.
• The EFAS extensively uses volunteers.

Economic Research Service/USDA The Emergency Food Assistance System—Executive Summary/FANRR-16-1 � v
• Although most kitchens and pantries do not turn away people because of lack offood, they do limit their food distribution. In about 40 percent of pantries, house-holds are limited to receiving food once per month or less, and one-third of kitchensserve meals only one day per week.
• During the 12 months before our survey, about 25 percent of kitchens and 33 per-cent of pantries turned away people who requested services, mostly because theindividuals in question were disruptive, had substance abuse problems, or failed tomeet residency requirements or income guidelines. Most kitchens and pantries didnot turn away people because of lack of food.
• About one-fourth of both emergency kitchens and food pantries perceived that thereare unmet needs for their services. More than half of food banks and food rescueorganizations reported facing unmet needs.
• In contrast to the geographic distribution of the low-income population, emergencykitchens are disproportionately available in metropolitan (versus nonmetropolitan)settings. For example, only 15 percent of kitchens are located in nonmetropolitanareas, whereas 21 percent of America’s poor population live in these areas.Furthermore, kitchens in nonmetropolitan areas tend to serve fewer people thankitchens in metropolitan areas.
• The EFAS may not provide consistent coverage across different parts of the day ordays of the week.
• About 89 percent of kitchens and 87 percent of pantries believed they could dealwith a 5-percent increase in the need for their services, and about one-third thoughtthat they could deal effectively with as much as a 20-percent increase in need.

Introduction
This report describes the results of the first compre-hensive government study of the Emergency FoodAssistance System (EFAS). Sponsored by theEconomic Research Service (ERS) of the U.S.Department of Agriculture (USDA), the study providesdetailed information about the system’s operations andabout each of the major types of organizationsinvolved in the system.1
USDA’s decision to conduct the study reflects both theagency’s specific involvement with certain parts of theEFAS—most important, by providing commoditiesthrough the Emergency Food Assistance Program(TEFAP)—and a more general goal of examiningwhether existing public and private programs work incomplementary ways to end hunger and improve thenutrition of low-income people. Key objectives of theproject were as follows:
• Describe, using a nationally representative sample,the characteristics, operating structures, and serviceareas of food banks, food pantries, emergencykitchens, food rescue organizations, and emergencyfood organizations.
• Describe the resource bases of food banks, foodpantries, emergency kitchens, food rescue organiza-tions, and emergency food organizations, as well as
assess the capacity of these providers to managecurrent and future needs for emergency food.
• Estimate the total quantity and types of food, bysource, that flow into the food banks, food pantries,emergency kitchens, food rescue organizations, andemergency food organizations.
• Estimate the total number of recipients served byeach type of EFAS provider.
The study was conducted during a period when theeffects of the 1996 national welfare reform werebecoming increasingly visible throughout the country.It thus affords an opportunity to examine how theEFAS is operating within this larger context ofchanges in America’s low-income assistance policies.
The research also allows us to examine how the EFASfits within the context of important government nutri-tion assistance programs, such as the Food StampProgram (FSP) and the Special Supplemental NutritionProgram for Women, Infants, and Children (WIC). Itupdates past studies of the EFAS (Second Harvest,1998; Poppendieck, 1998; and Burt et al., 1999),extending these studies to provide a broader, morenationally representative view of the system.Additional information will be obtained in a survey ofEFAS clients, conducted in fall 2001.
Economic Research Service/USDA The Emergency Food Assistance System—Executive Summary/FANRR-16-1 � 1
The Emergency Food Assistance System—
Findings From the Provider Survey
Volume I: Executive Summary
James OhlsFazana Saleem-Ismail
1The complete findings of the study discussed in thissummary are available in Ohls and Saleem-Ismail, 2001.

Brief Description of theOrganizations Participating
in the EFAS
The EFAS helps ensure adequate nutrition for low-income Americans who may not have the resources topurchase sufficient food in stores and who may not beable to acquire sufficient food through governmentprograms. Across the country, thousands of emergencykitchens and food pantries provide food assistance topeople throughout the year. Regional and nationalorganizations, such as food banks and the food banks’national-level representatives, help the provider agen-cies obtain food and other resources necessary toaccomplish their mission. The EFAS, which functionslargely in the private sector, provides meals and foodsupplies that, for many recipients, complement exist-ing, government food assistance programs.
This report focuses on the operations of five types ofEFAS agencies (fig. 1). Emergency kitchens and foodpantries are the two major types of direct serviceproviders in the system in terms of volume of food dis-tributed. For purposes of the study, we defined emer-gency kitchens as organizations that provide low-income individuals with prepared food at little or nocost for consumption at the distribution site. In gener-al, but not always, the food is cooked at the site andserved heated. Food pantries are defined as organiza-tions that provide food, usually uncooked, to low-income individuals for consumption away from thedistribution site. (Further refinements of these defini-tions are provided in Ohls and Saleem-Ismael, 2001.)
The emergency kitchens and food pantries are support-ed by an extensive system of food banks, food rescueorganizations, and emergency food organizations, allof which obtain food and distribute it to the directproviders. Food banks focus on obtaining mostly non-
2 � The Emergency Food Assistance System—Executive Summary/FANRR-16-1 Economic Research Service/USDA
Figure 1
Emergency food assistance provider system
USDA
programs
National and
regionalfood
sources
Needyindividuals
andhouseholds
Emergencyfood organizationsest. number: 124
Foodbanks
est. number: 402
Food rescueprograms
est. number: 91
Localfood
sources
Foodpantries
est. number: 32,737
Emergencykitchens
est. number: 5,262Localfood
sources
Notes: Emergency shelters are also considered part of the Emergency Food Assistance System but were not included in the present study.Food sources include donated food from manufacturers, wholesalers, retailers, and growers; food purchased at market prices from those same sources; field-gleaning and other donations of unsalable food; leftover food from service organizations, such as restaurants and schools; community donations; State programs; and other sources. For purposes of this study, the term “emergency food organization” was limited to “wholesale” organizations that distributed government commodities primarily to emergency kitchens and pantries. In some States, the term isused more broadly to include organizations that distribute commodities directly to households. This is discussed further in Ohls and Saleem-Ismail, 2001.

perishable food from national and regional sources,such as food manufacturers, while food rescue organi-zations focus on receiving perishable food from retail-ers, food service operations, and farmers. The emer-gency food organizations typically are local govern-ments or private community action programs that dis-tribute commodities made available under the TEFAP,which is operated by USDA.
There is another important set of EFAS providers—emergency shelters for the homeless—but they werenot included in the current survey. They were recentlystudied by Burt et al. (1999).
Economic Research Service/USDA The Emergency Food Assistance System—Executive Summary/FANRR-16-1 � 3
Overview of Findings
Following are key findings of the study:
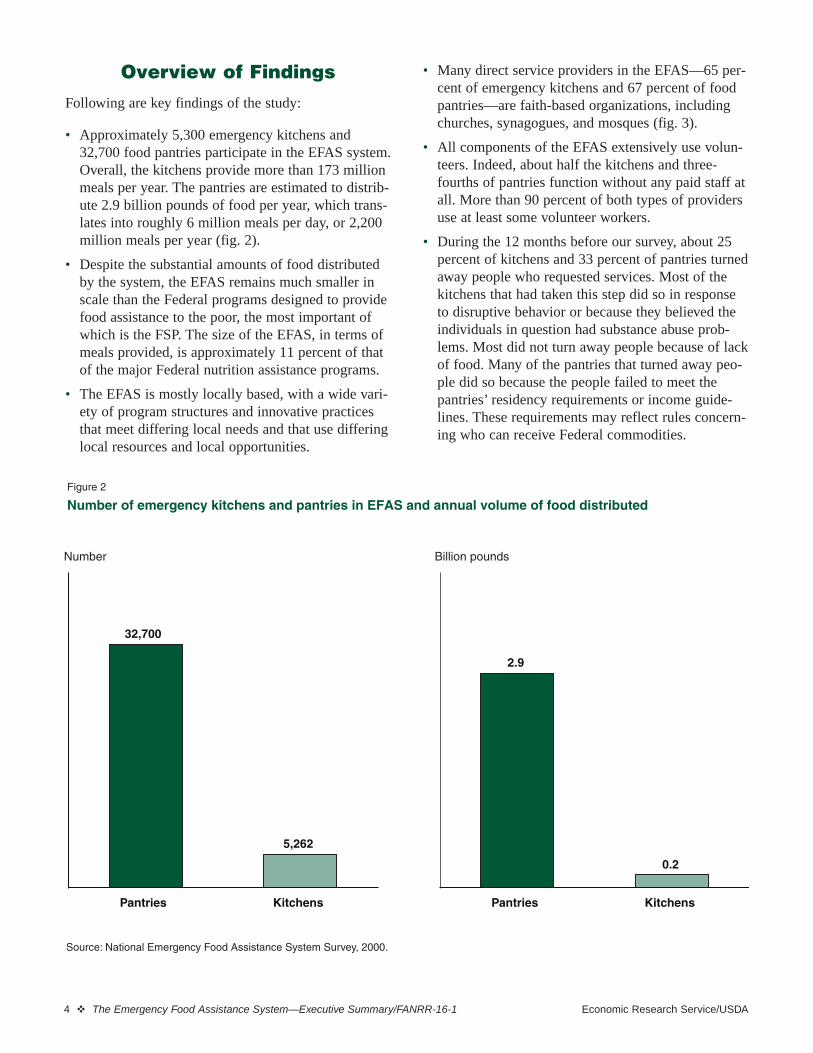
• Approximately 5,300 emergency kitchens and32,700 food pantries participate in the EFAS system.Overall, the kitchens provide more than 173 millionmeals per year. The pantries are estimated to distrib-ute 2.9 billion pounds of food per year, which trans-lates into roughly 6 million meals per day, or 2,200million meals per year (fig. 2).
• Despite the substantial amounts of food distributedby the system, the EFAS remains much smaller inscale than the Federal programs designed to providefood assistance to the poor, the most important ofwhich is the FSP. The size of the EFAS, in terms ofmeals provided, is approximately 11 percent of thatof the major Federal nutrition assistance programs.
• The EFAS is mostly locally based, with a wide vari-ety of program structures and innovative practicesthat meet differing local needs and that use differinglocal resources and local opportunities.
• Many direct service providers in the EFAS—65 per-cent of emergency kitchens and 67 percent of foodpantries—are faith-based organizations, includingchurches, synagogues, and mosques (fig. 3).
• All components of the EFAS extensively use volun-teers. Indeed, about half the kitchens and three-fourths of pantries function without any paid staff atall. More than 90 percent of both types of providersuse at least some volunteer workers.
• During the 12 months before our survey, about 25percent of kitchens and 33 percent of pantries turnedaway people who requested services. Most of thekitchens that had taken this step did so in responseto disruptive behavior or because they believed theindividuals in question had substance abuse prob-lems. Most did not turn away people because of lackof food. Many of the pantries that turned away peo-ple did so because the people failed to meet thepantries’ residency requirements or income guide-lines. These requirements may reflect rules concern-ing who can receive Federal commodities.
4 � The Emergency Food Assistance System—Executive Summary/FANRR-16-1 Economic Research Service/USDA
Figure 2
Number of emergency kitchens and pantries in EFAS and annual volume of food distributed
Pantries Kitchens
32,700
5,262
Pantries Kitchens
2.9
0.2
Number Billion pounds
Source: National Emergency Food Assistance System Survey, 2000.

• Although most kitchens and pantries do not turnaway people because of lack of food, they do limittheir food distribution. In about 40 percent ofpantries, households are limited to receiving foodonce per month or less, and one-third of kitchensserve meals only one day per week.
• About one-fourth of both emergency kitchens andfood pantries perceive that there are unmet needs fortheir services. More than half of food banks andfood rescue organizations reported facing unmetneeds.
• Compared with the geographic distribution of thelow-income population, emergency kitchens are dis-proportionately available in metropolitan (versusnonmetropolitan) settings. For example, only 15 per-cent of kitchens are located in nonmetropolitan
areas, whereas 21 percent of America’s poor popula-tion live in these areas. Pantries are more prevalentin nonmetropolitan areas. Overall, the findings sug-gest possible issues of adequacy of coverage, partic-ularly in nonmetropolitan areas.
• The study also found evidence that the EFAS maynot provide consistent coverage across differentparts of the day or days of the week. Data from theplanned client survey, which will be conducted aspart of the project, will be useful in examining thisissue in additional detail.
• Approximately 89 percent of kitchens and 87 per-cent of pantries believed they could deal with a 5-percent increase in the need for their services, andabout 30 percent thought that they could deal effec-tively with as much as a 20-percent increase in need.
Economic Research Service/USDA The Emergency Food Assistance System—Executive Summary/FANRR-16-1 � 5
Figure 3
Types of organizations providing EFAS services
Source: National Emergency Food Assistance System Survey, 2000.
Nonprofit, not religious
30%
Other 5%Nonprofit,
religious 65%
Nonprofit, not religious
25%
Other 8%
Nonprofit, religious
67%
Emergency kitchens Food pantries

Methods
The study was conducted by Mathematica PolicyResearch (MPR) under contract with USDA’sEconomic Research Service. The results presented inthis report are based on a telephone survey of approxi-mately 3,734 EFAS organizations—1,517 emergencykitchens, 1,617 pantries, 395 food banks, 88 food res-cue organizations, and 117 emergency food organiza-tions. The kitchens and pantries were clustered in asample of 360 primary sampling units (PSUs), whichare usually counties. These PSUs were selected withprobabilities of selection proportional to the number ofpeople in the PSUs who live in poverty. Some largerPSUs received multiple “hits” in the sampling; thus,the total number of discrete PSUs is 294.
The sample frame construction began with a compila-tion of the names of all the food banks in the countrythat could be identified through contacts with foodbanks and their national representatives, as well as
through discussions with people in each PSU whowere familiar with the EFAS. For food banks, foodrescue organizations, and emergency food organiza-tions, we attempted to interview all of the relevantorganizations that were identified. The sample framesof kitchens and pantries were constructed in twostages. First, we obtained provider listings from thefood bank or food banks serving the relevant PSUs.Second, we supplemented the listings from the foodbanks by making extensive telephone calls to localinformants—such as social service agencies, churches,and libraries—to ask for the names of all the EFASproviders known to them.
Interviews were conducted from MPR’s interviewingfacilities in Columbia, Maryland, and Princeton, NewJersey, using computer-assisted telephone-interviewingmethods. Response rates were high, varying from 94percent to 98 percent in the surveys of the five types oforganizations.
6 � The Emergency Food Assistance System—Executive Summary/FANRR-16-1 Economic Research Service/USDA

Organizations in the EFAS
The following describes the characteristics and opera-tions of emergency kitchens, food pantries, foodbanks, and food rescue organizations. Emergency foodorganizations will be discussed later.
Emergency KitchensEmergency kitchens serve an average of nearly half amillion meals per day. Nearly two-thirds of emergencykitchens nationwide are operated by faith-based orga-nizations—most often, churches. The other emergencykitchens tend to be private, nonprofit, nonreligiousinstitutions. Most have been operating longer than 5years, and many provide additional services, such asnutrition counseling, employment training, and sub-stance abuse counseling. Many are located in ZIP codeareas with high concentrations of minority groups—groups that tend to have relatively high rates of pover-ty and food insecurity.
Approximately 47 percent of kitchens serve meals onlyon weekdays, and another 10 percent serve only onweekends. About 66 percent serve lunch, 30 percentserve breakfast, and 52 percent serve supper (fig. 4).
The average kitchen that serves lunch provides mealsto about 70 people. Typically, 45 people are served at abreakfast, and 65 are served at a supper. Because asmall number of kitchens are quite large (mostly inmetropolitan areas), the average meal counts are sig-nificantly higher. For instance, the average lunch countis 112 people. Serving sizes at most kitchens are deter-mined by the kitchen staff.
Kitchens rely on a number of different sources toobtain food. Important sources include food banks,community donations, and commercial retailers andwholesalers. (Kitchens obtain both purchased food anddonated food from these last two sources.) Mostkitchens rely heavily on funding from local sources,
Economic Research Service/USDA The Emergency Food Assistance System—Executive Summary/FANRR-16-1 � 7
Figure 4
Characteristics of emergency kitchens
0 25 50 75 100
3728
33
7677
81
30
6652
2822
1433
Days open per week
Types of meals served
Sources of food
Average number of clients receiving lunch when lunch is served
Percent of kitchens
Note: Percentages may not add to 100 because of missing data; others may add to more than 100 because multiple responses were provided.Source: National Emergency Food Assistance System Survey (2000), weighted tabulations.
100 or more50 to 991 to 49
Wholesalers/retailersCommunity donations
Food banks
BreakfastLunchDinner
6 or 74 or 52 or 3
1

including the United Way, donations, and fundraisingactivities.
Food PantriesAs with emergency kitchens, about two-thirds of foodpantries are operated by faith-based organizations,while most of the rest are operated by private, non-profit, secular groups. Many have been operating formore than 5 years, and many provide other services inaddition to food distribution.
The typical food pantry distributes food 2 days a week.About 30 percent are open at least 5 days per week;approximately 16 percent are open less than once aweek (fig. 5). On a day when it is open for food distri-bution, the typical food pantry remains open for about3–4 hours.
Typically, pantries allow households to obtain foodonce or twice a month. About one-third of pantries
require that households live within their service areas,and about half have formal income guidelines. Manyof these rules reflect Federal or State TEFAP require-ments for the distribution of TEFAP commodities tohouseholds.
As with kitchens, food pantries obtain food from abroad range of sources. The three most frequentlyreported sources are (1) food banks, (2) communitydonations, and (3) wholesalers and retailers. In termsof staffing, most pantries—about 75 percent—relyentirely on volunteer staff.
Most food pantries are quite small. The median foodpantry serves 15 households on a day when it is open;many serve fewer than 10 households per day. A few,however, serve upwards of 100 households a day.While some pantries allow households to select theirown food, in most pantries, food is apportioned mainlyby food pantry staff.
8 � The Emergency Food Assistance System—Executive Summary/FANRR-16-1 Economic Research Service/USDA
Figure 5
Characteristics of food pantries
Days open per week
How frequentlyclients can get food
Sources of food
Household visitsper day
Percent of pantries
Note: Percentages may not add to 100 because of missing data; others may add to more than 100 because multiple responses were provided.Source: National Emergency Food Assistance System Survey (2000).
More than 5026 to 5010 to 25
Less than 10
Wholesalers/retailersCommunity donations
Food banks
Less than once a monthOnce a month
2 to 3 times a monthOnce a week or more
5 or more3 or 4
Less than 3
0 25 50 75 100
1714
2535
5276
80
1650
1313
3015
51

Food BanksFood banks are the “wholesalers” of the EFAS, obtain-ing food in bulk and distributing it to local serviceproviders. In the current survey, we attempted to iden-tify as many food banks as possible through contactswith America’s Second Harvest, a national organiza-tion that includes most U.S. food banks, and throughcontacts with other sources knowledgeable about theEFAS. In all, we located 402 food banks, about 80 per-cent of which are affiliates of America’s SecondHarvest.
We attempted to interview each of them and completedinterviews with 98 percent.
Typically, food banks are private, nonprofit, nonreli-gious organizations. More than 70 percent of the foodbanks interviewed have been operating longer than 5years, and about 50 percent have been operating atleast 10 years. In addition to distributing food, manyoffer technical assistance to the agencies they serve,particularly in the area of food handling and safety.
Food banks tend to serve multiple types of client agen-cies. On average, food banks serve 17 emergency
kitchens, 96 food pantries, 3 other food banks, and 12shelters, as well as other charitable provider agencies,such as hospitals and child care providers, which arenot included in the current study (fig. 6).
Food banks typically have policies limiting the typesof agencies they serve, with the most common restric-tion limiting assistance to nonprofit organizations with501(c)(3) tax status. Many of the food banks have for-mal certification or approval processes to assesswhether applicant agencies meet the food banks’ crite-ria for service. About 43 percent of the food banks hadturned away agencies that requested food during theprevious year; however, only 8 percent of the foodbanks that turned away agencies reported doing sospecifically because they had insufficient foodresources.
Food banks obtain food from many different sources.The two main sources cited were (1) other food banksand the Second Harvest network, and (2) wholesalersand retailers. About one-third of the food banks report-ed that wholesalers and retailers were a primarysource. (The food obtained from wholesalers andretailers included both food that could have been sold,
Economic Research Service/USDA The Emergency Food Assistance System—Executive Summary/FANRR-16-1 � 9
Figure 6
Number of organizations served by average food bank
Emergency kitchens Food pantries Other food banks Shelters Other0
20
40
60
80
100
120
17
96
3
12
69
Number
Note: "Other" includes various charitable organizations that serve food, including daycare centers, senior centers, and hospitals.Source: National Emergency Food Assistance System Survey, 2000.
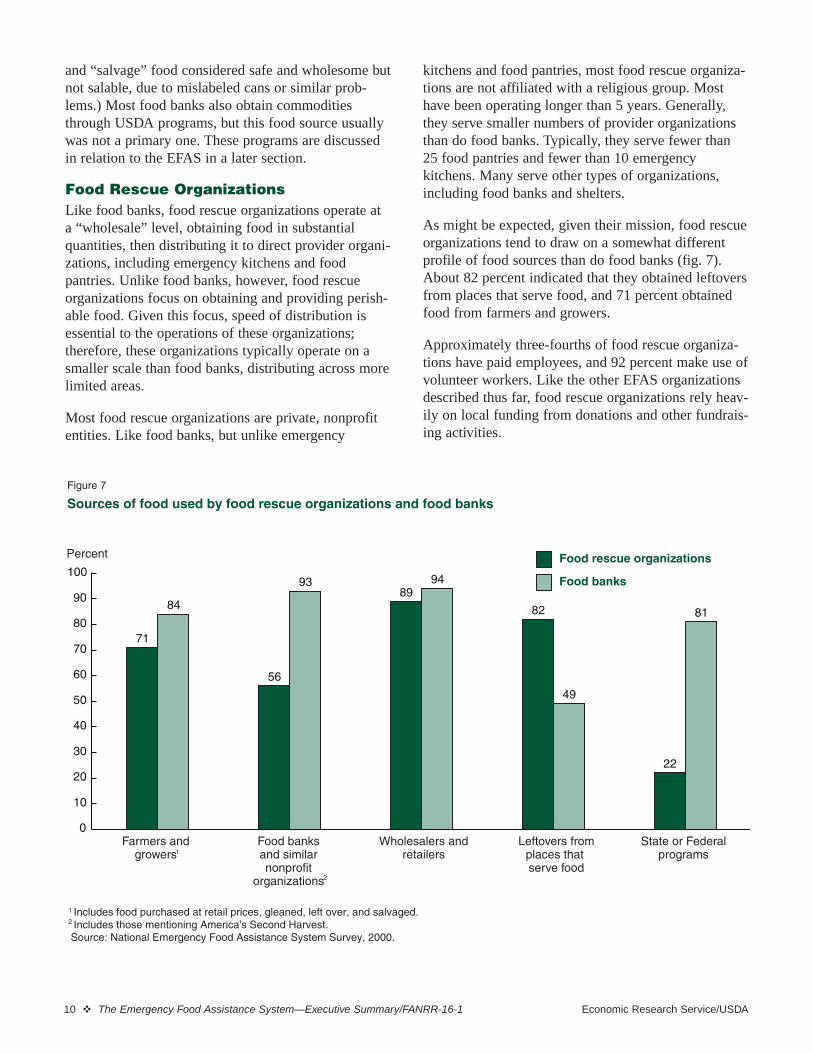
and “salvage” food considered safe and wholesome butnot salable, due to mislabeled cans or similar prob-lems.) Most food banks also obtain commoditiesthrough USDA programs, but this food source usuallywas not a primary one. These programs are discussedin relation to the EFAS in a later section.
Food Rescue OrganizationsLike food banks, food rescue organizations operate ata “wholesale” level, obtaining food in substantialquantities, then distributing it to direct provider organi-zations, including emergency kitchens and foodpantries. Unlike food banks, however, food rescueorganizations focus on obtaining and providing perish-able food. Given this focus, speed of distribution isessential to the operations of these organizations;therefore, these organizations typically operate on asmaller scale than food banks, distributing across morelimited areas.
Most food rescue organizations are private, nonprofitentities. Like food banks, but unlike emergency
kitchens and food pantries, most food rescue organiza-tions are not affiliated with a religious group. Mosthave been operating longer than 5 years. Generally,they serve smaller numbers of provider organizationsthan do food banks. Typically, they serve fewer than25 food pantries and fewer than 10 emergencykitchens. Many serve other types of organizations,including food banks and shelters.
As might be expected, given their mission, food rescueorganizations tend to draw on a somewhat differentprofile of food sources than do food banks (fig. 7).About 82 percent indicated that they obtained leftoversfrom places that serve food, and 71 percent obtainedfood from farmers and growers.
Approximately three-fourths of food rescue organiza-tions have paid employees, and 92 percent make use ofvolunteer workers. Like the other EFAS organizationsdescribed thus far, food rescue organizations rely heav-ily on local funding from donations and other fundrais-ing activities.
10 � The Emergency Food Assistance System—Executive Summary/FANRR-16-1 Economic Research Service/USDA
Figure 7
Sources of food used by food rescue organizations and food banks
Percent
0
10
20
30
40
50
60
70
80
90
100
71
84
56
9389
94
82
49
22
81
Food rescue organizations
Food banks
Includes food purchased at retail prices, gleaned, left over, and salvaged. Includes those mentioning America's Second Harvest. Source: National Emergency Food Assistance System Survey, 2000.
1
2
Food banksand similarnonprofit
organizations
Wholesalers andretailers
Leftovers fromplaces that serve food
State or Federalprograms
Farmers andgrowers1
2

Commodity Programs and the EFAS
The main direct connection that the FederalGovernment has with the EFAS is through its provi-sion of commodities to the system through two USDAprograms: TEFAP and the Commodity SupplementalFood Program (CSFP). Our discussion focuses on theTEFAP, which is the larger of the two and is moreclosely linked to the EFAS. The TEFAP distributed422 million pounds of commodities in 2000 (fig. 8).Most of this food was distributed through the EFAS,and the 422 million pounds represents about 14 per-cent of all EFAS food.
A majority of EFAS agencies distribute USDA com-modities under TEFAP. This includes 55 percent ofemergency kitchens, 52 percent of food pantries, and84 percent of food banks.
In addition, one type of EFAS organization, emergencyfood organizations (EFOs), focuses its EFAS activitiesmainly on the distribution of TEFAP commodities.When USDA commodities become available, emer-gency food organizations sometimes serve as conduitsfor those commodities from the TEFAP State offices to
local providers. The presence of EFOs tends to vary byState, partly because the States are given flexibility inhow TEFAP commodities are distributed. Some Statesuse EFOs as a principal distribution mechanism forTEFAP commodities; other States either distributeTEFAP commodities mainly through food banks ordistribute them directly to needy individuals.
Most EFOs exist primarily for other, non-EFAS, pur-poses, such as to provide community services, andonly participate in the EFAS from time to time, whenTEFAP commodities become available. Approximatelyone-third of EFOs are run by government entities;most of the rest are private, nonprofit organizations.Most—80 percent—have been operating longer than 5years. They tend to be more limited in scope in theirEFAS activities than food banks, with 80 percent serv-ing fewer than 25 pantries and 76 percent serving 5 orfewer kitchens.
Most EFOs—89 percent—have paid employees; 74percent employ volunteer staff. EFOs reported TEFAPadministrative funds and other government sources astheir main sources of funding for their food distribu-tion work.
Economic Research Service/USDA The Emergency Food Assistance System—Executive Summary/FANRR-16-1 � 11
Figure 8
Estimated food distribution by the EFAS and TEFAP, 2000
Million pounds
Sources: EFAS total: National Emergency Food System Survey, 2000; TEFAP total: R. De Lorenzo, Food and Nutrition Service,USDA, August 2001.
EFAS TEFAP
3,100
422

Recent Changes in the Use of EFAS Services andPossible Unmet Demand
Welfare rolls and the official U.S. poverty rate havedeclined substantially in recent years. For instance,between 1997 and 2000, the number of people receiv-ing welfare assistance declined from 11 million to 6million, while the U.S poverty rate decreased from13.3 to 11.8 percent. These changes are widely attrib-uted to welfare reform legislation enacted in 1996 andto the strong U.S. economy. Other factors may also beat work.
We examined changes in the use of EFAS servicesduring these years to see if they mirrored changes inpoverty and welfare rates. The survey asked providersto estimate whether (and how much) use of their ser-vices had changed between 1997 and 2000. Note thatour information is based on provider estimates, not ondirect reference to agency records, because manyEFAS providers, particularly the smaller ones, do notmaintain records in consistent formats over time. Also,of necessity, these data include only organizations thatwere operating in at least 1997 and were still operatingat the time of the survey.
All the organizations studied reported, on average, thatthe use of their services had gone up, with the annualincreases ranging from 4 percent per year for emer-gency food organizations to 11 percent for food rescueorganizations (fig. 9). The increases for kitchens andpantries were 4 and 5 percent, respectively. Thus, thedata suggest that use of the EFAS was rising consider-ably at a time when the economy was strong and wel-fare rolls were declining.
Recent studies by the U.S. Conference of Mayors andrecent food bank distribution data from America’sSecond Harvest administrative records are consistentwith the finding that use of EFAS services has beenrising, and the data from these sources imply higherrates of growth than those just reported. However,analysis of yearly data from the U.S. Bureau of theCensus, Current Population Survey, on the proportionof households using EFAS facilities does not show aclear, consistent pattern.
An examination of factors associated with larger orsmaller changes in use, in terms of characteristics ofthe providers or their locations, failed to show clearpatterns. The reason for the increase in EFAS use dur-ing a time of widespread prosperity is not clear.
12 � The Emergency Food Assistance System—Executive Summary/FANRR-16-1 Economic Research Service/USDA
Figure 9
Annual percentage increase in use of EFAS services, as reported by EFAS agencies, 1997-2000
Source: National Emergency Food Assistance System Survey, 2000.
Emergency food organizations
Food rescue organizations
Food banks
Food pantries
Emergency kitchens
Percent
4
11
7
5
4

EFAS Capacity To Meet DemandA critical question for assessing the overall success ofthe EFAS is: Does the EFAS have adequate capacity tomeet the need for its services? The evidence from thestudy about this question is mixed. Many, perhapsmost, EFAS agencies believe that they are currentlyable to meet the need for their services. The data alsosuggest, however, that some EFAS agencies do nothave the staff and supplies necessary to keep up withdemand. Relevant evidence is highlighted here.
Many direct EFAS service providers—about three-quarters of kitchens and two-thirds of pantries—indi-cated that they did not have to turn away clients inneed during the previous year (fig. 10). Further, mostkitchens that had turned away clients in need citeddrug or behavioral problems as the reason rather thanlack of capacity. Lack of food was seldom mentionedas the reason. Pantries frequently mentioned thatpotential clients had not met income or residenceguidelines as reasons for turning clients away; as withkitchens, most had not turned away clients because oflack of food.
About 21 percent of kitchens and 39 percent ofpantries indicated that they had to limit food distribu-tion because of lack of food during the previous 12months. Also, more than 60 percent of both pantriesand kitchens indicated that they believed they wouldbe able to deal adequately with at least a 10-percentincrease in demand for their services (and, in manyinstances, with more than a 10-percent increase). Thisresponse suggests that they believe they have theresources they need to cope adequately with their cur-rent level of demand.
However, the same statistics just cited also suggest thatmany providers believe they lack the resources to fullysatisfy current demand. For each variable discussed,usually 10-40 percent of respondents indicated problemsin meeting the needs of everyone requesting services.
When asked directly if they where meeting the needfor their services, about 25 percent each of kitchensand pantries, together with 52 percent of food banks,indicated that they perceived more need for their ser-vices than they could fulfill. Further, most of the agen-cies providing this response indicated that they would
Economic Research Service/USDA The Emergency Food Assistance System—Executive Summary/FANRR-16-1 � 13
Figure 10
Possible indicators of unmet needs
Source: National Emergency Food Assistance System Survey, 2000.
Percent0 10 20 30 40 50 60 70
3358
522525
676363
6168
1642
4333
25
Emergency food organizationsFood rescue organizations
Food banksPantriesKitchens
Emergency food organizationsFood rescue organizations
Food banksPantriesKitchens
Emergency food organizationsFood rescue organizations
Food banksPantriesKitchens
During past 12 months, turnedaway clients requesting food
Could handle a 10-percentincrease in demand
Unable to fill additional needsfor food-related services

like to both increase services for existing clients andextend existing services to new groups of clients.
Overall, the picture that emerges is one in which mostEFAS providers perceive themselves as coping ade-quately with the immediate needs for their services.Others either are not able to meet immediate needs orperceive other services that they could offer to helptheir clientele.
Furthermore, the food banks, with their somewhatbroader perspective (as compared with local kitchensand pantries), were more likely than kitchens andpantries to indicate that they perceived unmet needsfor their services.
14 � The Emergency Food Assistance System—Executive Summary/FANRR-16-1 Economic Research Service/USDA

Roles of the EFAS and theFederal Government in
Providing Nutrition Assistance
Some observers have been puzzled by the seemingredundancy of the EFAS and the major governmentnutrition assistance programs. Are both private and thepublic programs needed? If so, what roles do theyplay?
Our analysis suggests that the EFAS may serve a num-ber of functions to complement the available publicprograms. First, the EFAS supplies additional help topeople who receive government food assistance butwho find government benefits insufficient to meet allof their needs. Second, the EFAS provides assistanceto some people who may have immediate needs forfood but are unable to meet the administrative or sub-stantive eligibility requirements of government pro-grams. Third, the availability of the EFAS provides aprivate option to people who, because of fear of stigmaor other reasons, are reluctant to accept governmenthelp.
However, evidence suggests that a continuing majorrole for the Federal sector in nutrition assistance isessential for accomplishing America’s nutrition assis-tance goals. Perhaps the most important evidence of
this is the sheer relative size of government programscompared with the EFAS. Government programs cur-rently contribute nearly 90 percent of the combinedpublic and private food assistance in this country. It isextremely unlikely that, in the absence of Federal pro-grams, the EFAS could obtain the resources to fill thisgap. Another important issue is entitlement. Certaingovernment programs—most important, the FoodStamp Program—provide a legal entitlement to assis-tance, thus furthering the goal of ensuring that all peo-ple in the United States have adequate food. It is notclear that the EFAS, which relies on the decentralizeddecisionmaking of many independent organizations,can ensure comparable entitlement and full coverageof the needy population. Even with an expandedEFAS, coverage gaps could remain, and there wouldbe no obvious mechanism to ensure that they would befilled.
These arguments suggest that the EFAS and the publicsector may work in tandem to provide more compre-hensive food assistance than either could provide byitself. The client survey planned for the second phaseof the current project will provide significant addition-al information with which to explore these connectionsby examining patterns of multiple benefit use and thefactors that draw clients to the EFAS.
Economic Research Service/USDA The Emergency Food Assistance System—Executive Summary/FANRR-16-1 � 15

References
Burt, Martha R., Laudan Y. Aron, Toby Douglas, JesseValente, Edgar Lee, and Britta Iwen. Homelessness:Programs and the People They Serve. Washington,DC: The Urban Institute Press, September 1999.
Ohls, James C., and Fazana Saleem-Ismail. ProvidingFood for the Poor: Findings from the ProviderSurvey for the Emergency Food Assistance System
Study. Princeton, NJ: Mathematica Policy Research,Inc., May 2001.
Poppendieck, Janet. Sweet Charity? Emergency Foodand the End of Entitlement. New York: VikingPenguin, 1998.
Second Harvest. Hunger 1997: The Faces and Facts.Chicago, Il: America’s Second Harvest, 1998.
16 � The Emergency Food Assistance System—Executive Summary/FANRR-16-1 Economic Research Service/USDA


