The Emerging Role of SGLT Inhibitors in Individualized Treatment of T2DM New Perspectives in Diabetes: New Targets, New Therapies, and a New Approach to Patient Management George L. Bakris, MD Professor of Medicine Director, ASH Comprehensive Hypertension Center The University of Chicago Chicago, Illinois
Transcript
The Emerging Role of SGLT Inhibitors in Individualized Treatment of T2DM
New Perspectives in Diabetes: New Targets, New Therapies, and a New Approach to Patient Management
George L. Bakris, MDProfessor of Medicine
Director, ASH Comprehensive Hypertension CenterThe University of Chicago
Chicago, Illinois
Faculty DisclosureIt is the policy of The France Foundation to ensure balance, independence, objectivity, and scientific rigor in all its sponsored educational activities. All faculty, activity planners, content reviewers, and staff participating in this activity will disclose to the participants any significant financial interest or other relationship with manufacturer(s) of any commercial product(s)/device(s) and/or provider(s) of commercial services included in this educational activity. The intent of this disclosure is not to prevent a person with a relevant financial or other relationship from participating in the activity, but rather to provide participants with information on which they can base their own judgments. The France Foundation has identified and resolved any and all conflicts of interest prior to the release of this activity.
George L. Bakris, MD, has received grant and research support from Takeda and has served as a consultant for Janssen, Medtronic, Relypsa, Takeda, Daiichi-Sankyo, Boehringer Ingelheim, and Bristol-Myers Squibb
Learning Objectives
• Define individual T2DM and cardiovascular disease targets
• Establish patient targets for the “ABCs”: A1C, Blood pressure, and Cholesterol
• Explain the rationale for targeting renal glucose transport, and interpret related clinical data and the potential role of SGLT2 inhibition in personalized T2DM therapies
• Distinguish the potential differences among new SGLT2 inhibitors and discuss the clinical implications of these differences on appropriate patient selection
Glucose Homeostasis
Adapted from CDA Clinical Practice Guidelines Expert Committee. Can J Diabetes. 2008;32(suppl 1):S1-S201.
Euglycemia
Hypoglycemia • Cognitive
impairment • Seizure • Coma • Brain death • Arrhythmia• Heart attack• Palpitations
Learning Objectives• Define individual T2DM and cardiovascular disease
goals • Formulate a patient management strategy that
targets the “ABCs”: A1C, Blood pressure, and Cholesterol
• Explain the rationale for targeting renal glucose transport, and interpret related clinical data and the potential role of SGLT2 inhibition in individualized T2DM therapies
• Distinguish the unique differences between new SGLT2 inhibitors and discuss the clinical implications of these differences on appropriate patient selection
• Blood pressure (mmHg)– Systolic < 140 for most people
– Diastolic < 80 (< 90 per Joint National Committee-8 2014 guideline)
Inzucchi SE, et al. Diabetes Care. 2012;35(6):1364-1379. http://ndep.nih.gov/publications/PublicationDetail.aspx?PubId=114. Accessed Nov 2013.James PA, et al. JAMA. 2013 Dec 18. [Epub ahead of print]. http://jama.jamanetwork.com. Accessed Dec 2013.American Diabetes Association. Diabetes Care. 2014; 37:S14-S80.
Inzucchi SE, et al. Diabetes Care. 2012;35(6):1364-1379. http://ndep.nih.gov/publications/PublicationDetail.aspx?PubId=114. Accessed Nov 2013.James PA, et al. JAMA. 2013 Dec 18. [Epub ahead of print]. http://jama.jamanetwork.com. Accessed Dec 2013.American Diabetes Association. Diabetes Care. 2014; 37:S14-S80.
Treatment Goals: ABCs of Diabetes(cont.)
Impact of ABC ControlOverview
• Glucose Control– Benefits both type 1 or type 2 diabetes– Every point drop in HbA1C reduces risk of complications
Microvascular 40% lowerMacrovascular 16% lower
• Blood Pressure Control– Reduces the risk of CV disease by 33 to 50% – Reduces the risk of microvascular complications by about 33%– A 10 mmHg reduction in systolic BP reduces the risk for any
complication related to diabetes by 12 percent– Systolic BP goal < 140 mmHg based on expert opinion
NIDDK National Diabetes Information Clearinghouse (NDIC). National Diabetes Statistics, 2011.http://diabetes.niddk.nih.gov/dm/pubs/statistics/#pdc. Accessed Nov 2013.
Impact of ABC ControlOverview (cont.)
• Control of Blood Lipids– Improved control of LDL can reduce CV complications by
20 to 50%
NIDDK National Diabetes Information Clearinghouse (NDIC). National Diabetes Statistics, 2011.http://diabetes.niddk.nih.gov/dm/pubs/statistics/#pdc. Accessed Nov 2013.
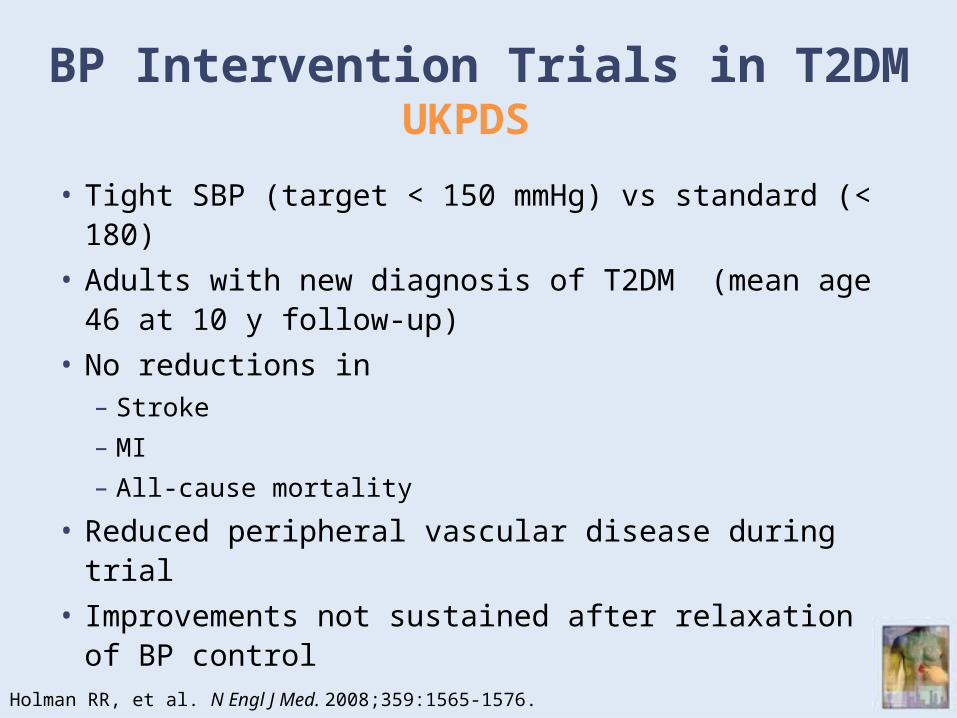
BP Intervention Trials in T2DMUKPDS
• Tight SBP (target < 150 mmHg) vs standard (< 180)• Adults with new diagnosis of T2DM (mean age 46 at
10 y follow-up) • No reductions in
– Stroke – MI – All-cause mortality
• Reduced peripheral vascular disease during trial• Improvements not sustained after relaxation of BP
controlHolman RR, et al. N Engl J Med. 2008;359:1565-1576.
Impact of LDL Control
• Meta-analysis of statin trials– 14 randomized trials
Kearney PM, et al. Lancet. 2008;371(9607):117-125.
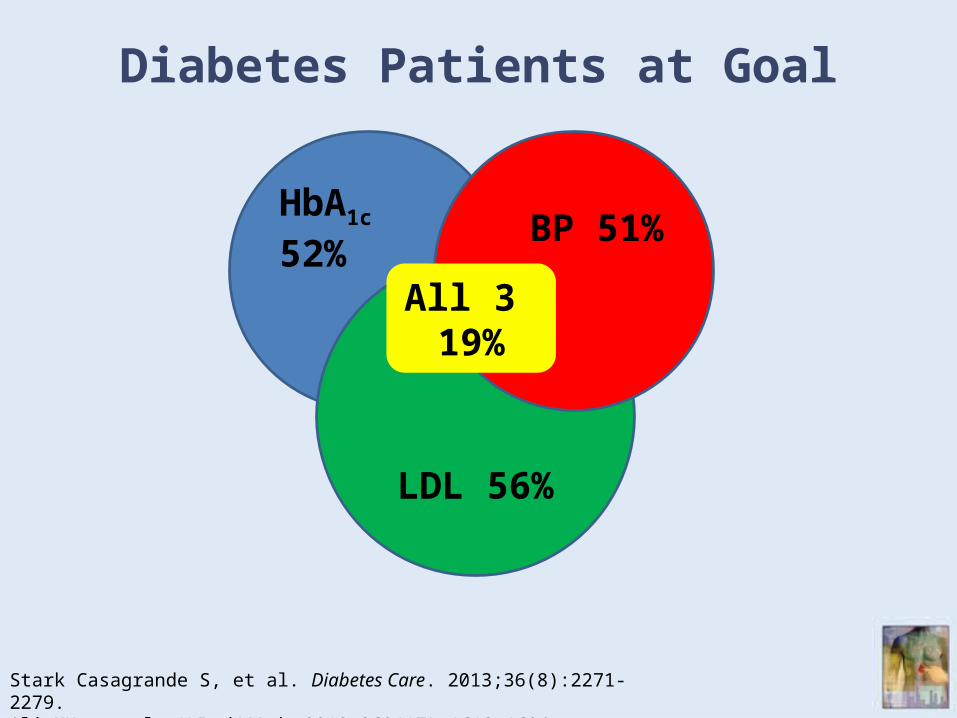
Diabetes Patients at Goal
Stark Casagrande S, et al. Diabetes Care. 2013;36(8):2271-2279. Ali MK, et al. N Engl J Med. 2013;368(17):1613-1624.
HbA1c 52%
LDL 56%
BP 51%
All 3 19%
Learning Objectives• Define individual T2DM and cardiovascular disease
goals • Formulate a patient management strategy that
targets the “ABCs”: A1C, Blood pressure, and Cholesterol
• Explain the rationale for targeting renal glucose transport, and interpret related clinical data and the potential role of SGLT2 inhibition in individualized T2DM therapies
• Distinguish the unique differences between new SGLT2 inhibitors and discuss the clinical implications of these differences on appropriate patient selection
Considerations for Patient Management
• Where is the patient now?
• What are the goals for this patient?
• What are the specific approaches to A, B, and C?
• Monitoring and office visit frequency
• How is this patient special?– Multiple medications/interactions– Efficacy of current medications– Side effects experienced– Adherence
Willingness to take medicationsCognitive stateSupportCostPill burden/needle aversionSide effect tolerance
Considerations for Patient Management(cont.)
Diabetes Management ScheduleEach Visit
Quarterly
Annually
Weight and BP X
Foot exam X
Smoking cessation and alcohol use X
Review medications X
Self management: glucose monitoring, diet, physical activity X
Assess for depression/mood disorder x
HbA1c X
Lipids, serum creatinine, urine albumin/creatinine ratio X
Eye, foot, dental exams X
Influenza vaccination X
http://ndep.nih.gov/publications/PublicationDetail.aspx?PubId=114. Accessed Dec 2013.
Learning Objectives• Define individual T2DM and cardiovascular disease
goals • Formulate a patient management strategy that
targets the “ABCs”: A1C, Blood pressure, and Cholesterol
• Explain the rationale for targeting renal glucose transport, and interpret related clinical data and the potential role of SGLT2 inhibition in individualized T2DM therapies
• Distinguish the unique differences between new SGLT2 inhibitors and discuss the clinical implications of these differences on appropriate patient selection
Role of the Kidney in Glucose Metabolism
22Wright EM, et al. J Intern Med. 2007;261(1):32-43.
Production Utilization
Reabsorption
Ferrannini E, Solini A. Nat Rev Endocrinol. 2012;8:495-502.
Glucose: From Blood to Urine
90%
10%
(180 g/day)
(180 g/day)
(0 g/day)
Upregulation of SGLT2 Transporter and Enhanced Cellular Glucose Uptake in Type 2 Diabetes
Rahmoune H, et al. Diabetes. 2005;54(12):3427-3434.
Glucose Uptake by Tubular Cells
Protein Expression
Healthy (n=3) Type 2 Diabetes (n=3)
0
500
1000
1500
2000
2500
AMG
* U
ptak
e (C
PM; m
ean
±SE)
P < 0.05
SGLT2 GLUT20
1
2
3
4
5
6
7
Healthy (n=4)
Type 2 Diabetes (n=4)
Nor
mal
ized
Glu
cose
Tr
ansp
orte
r Lev
els
(mea
n ±S
E)
P < 0.05
P < 0.05
0
25
50
75
100
125
150
The Renal Glucose Threshold (RTG) Conceptin Healthy Subjects
Adapted from:1. Guyton AC, Hall JE. Textbook of Medical Physiology. 11th ed. Philadelphia, PA: Elsevier Saunders; 2006.2. DeFronzo RA, et al. Diab Obes Metab. 2012;14:5-14.
• Predict weight loss and reduction in blood pressure
Renal Impairment Restricts Diabetes Options
Adapted from Scheen AJ. Expert Opin Drug Metab Toxicol. 2013;9(5):529-550.
Canagliflozin
Learning Objectives
• Define individual T2DM and cardiovascular disease goals • Formulate a patient management strategy that targets
the “ABCs”: A1C, Blood pressure, and Cholesterol • Explain the rationale for targeting renal glucose
transport, and interpret related clinical data and the potential role of SGLT2 inhibition in individualized T2DM therapies
• Distinguish the unique differences between new SGLT2 inhibitors and discuss the clinical implications of these differences on appropriate patient selection
• Canagliflozin: Approved in United States 2013 Approved in Europe 2013
• Dapagliflozin: Approved in United States 2014Approved in Europe 2012
• Empagliflozin: Application submitted to EMA and FDA 2013 Approval likely in 2014
Taylor SR, et al. Pharmacotherapy. 2013;33(9):984-999.
SGLT2 Inhibitors Reduce HbA1c
Monotherapy
• Canagliflozin1 – 26 weeks, 300 mg
• Dapagliflozin2
– 24 weeks, 10 mg
• Empagliflozin3
– 90 weeks open label, 25 mg
• Ipragliflozin4
– 12 weeks, 300 mg
-1.14% vs placebo
1. Stenlöf K, et al. Diabetes Obes Metab. 2013;15:372-382.2. FDA Background Document Dapagliflozin. www.fda.gov. Accessed Jan 2014.3. Ferrannini E, et al. Diabetes Care. 2013;36(12):4015-4021.4. Fonseca VA, et al. J Diabetes Complications. 2013;27(3):268-273.
-0.66% vs placebo
-0.47% vs baseline
-0.81% vs placebo
Treatment Group
Baseline
8.0%
7.82%
7.99%
7.90%
SGLT2 Inhibitors Reduce HbA1c
Added to Metformin
• Canagliflozin1 – 26 weeks, 300 mg
• Dapagliflozin2
– 52 weeks, up to 10 mg
• Empagliflozin3
– 90 weeks open label, 25 mg
• Ipragliflozin4
– 12 weeks, 300 mg
1. Lavalle-González FJ, et al. Diabetologia. 2013;56(12):2582-2592. 2. Nauck MA, et al. Diabetes Care. 2011;34:2015-2022.3. Ferrannini E, et al. Diabetes Care. 2013;36(12):4015-4021.4. Wilding JP, et al. Diabetes Obes Metab. 2013;15(5):403-409.
-0.52% vs baseline
-0.63% vs baseline
-0.77% vs placebo
-0.48 % vs placebo
Treatment Group
Baseline
8.0%
7.69%
7.89%
7.87%
SGLT2 Inhibitors Reduce Body Weight Monotherapy
• Canagliflozin1 – 26 weeks, 300 mg
• Dapagliflozin2
– 24 weeks, 10 mg
• Empagliflozin3
– 90 weeks open label, 25 mg
• Ipragliflozin4
– 12 weeks, 300 mg
-2.9 kg vs placebo
1. Stenlöf K, et al. Diabetes Obes Metab. 2013;15:372-382.2. Forxiga Summary of Product Characteristics. http://www.ema.europa.eu. Accessed Jan 2014. 3. Ferrannini E, et al. Diabetes Care. 2013;36(12):4015-4021.4. Fonseca VA, et al. J Diabetes Complications. 2013;27(3):268-273.
-2.61 kg vs baseline
-0.97 kg vs placebo
-1.67 kg vs placebo
Treatment Group
Baseline
86.9 kg
94.1 kg
83.5 kg
86.7 kg
SGLT2 Inhibitors Reduce Body Weight Added to Metformin
• Canagliflozin1 – 26 weeks, 300 mg
• Dapagliflozin2
– 24 weeks, 10 mg
• Empagliflozin3
– 90 weeks open label, 25 mg
• Ipragliflozin4
– 12 weeks, 300 mg
1. Lavalle-González FJ, et al. Diabetologia. 2013;56(12):2582-2592. 2. Bolinder J, et al. J Clin Endocrinol Metab. 2012;97(3):1020-1031.3. Ferrannini E, et al. Diabetes Care. 2013;36(12):4015-4021.4. Wilding JP, et al. Diabetes Obes Metab. 2013;15(5):403-409.
-2.08 kg vs placebo
-4.03 kg vs baseline
-2.9 kg vs placebo
-1.73 kg vs placebo
Treatment Group
Baseline
85.4 kg
88.4 kg
89.7 kg
89.3 kg
SGLT2 Inhibitors Reduce SBPMonotherapy
• Canagliflozin1 – 26 weeks, 300 mg
• Dapagliflozin2
– 12 weeks, 10 mg
• Empagliflozin3
– 90 weeks open label, 25 mg
• Ipragliflozin4
– 12 weeks, 300 mg
-5.4 vs placebo
1. Stenlöf K, et al. Diabetes Obes Metab. 2013;15:372-382.2. Lambers Heerspink HJ, et al. Diabetes Obes Metab. 2013;15(9):853-862.3. Ferrannini E, et al. Diabetes Care. 2013;36(12):4015-4021.4. Fonseca VA, et al. J Diabetes Complications. 2013;27(3):268-273.
-8.3 vs placebo
-1.7 vs baseline
-2.6 vs baseline
Treatment Group
Baseline
128.5
141
131.9
Not Available
(NA)
All in mmHg:
SGLT2 Inhibitors Reduce SBPAdded to Metformin
• Canagliflozin1 – 26 weeks, 300 mg
• Dapagliflozin2
– 24 weeks, 10 mg
• Empagliflozin3
– 12 weeks, 25 mg
• Ipragliflozin4
– 12 weeks, 300 mg
1. Lavalle-González FJ, et al. Diabetologia. 2013;56(12):2582-2592. 2. Bolinder J, et al. J Clin Endocrinol Metab. 2012;97(3):1020-1031.3. Rosenstock J, et al. Diabetes Obes Metab. 2013;15(12):1154-1160.4. Wilding JP, et al. Diabetes Obes Metab. 2013;15(5):403-409.
-2.8 vs placebo
-6.6 vs placebo
-6.3 vs placebo
-4.3 vs placebo
Treatment Group
Baseline
128.7
135.9
135.3
NA
All in mmHg:
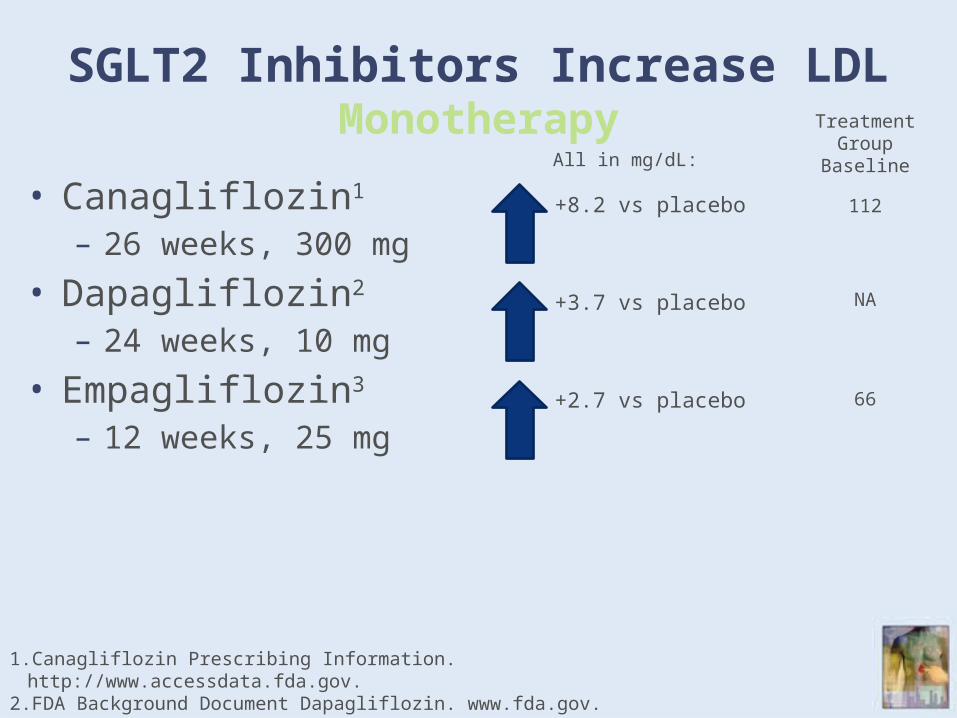
SGLT2 Inhibitors Increase LDLMonotherapy
• Canagliflozin1 – 26 weeks, 300 mg
• Dapagliflozin2
– 24 weeks, 10 mg
• Empagliflozin3
– 12 weeks, 25 mg
+8.2 vs placebo
1. Canagliflozin Prescribing Information. http://www.accessdata.fda.gov.2. FDA Background Document Dapagliflozin. www.fda.gov. Accessed Jan 2014. 3. Rosenstock J, et al. Diabetes Obes Metab. 2013;15(12):1154-1160.
+3.7 vs placebo
+2.7 vs placebo
Treatment Group
Baseline
112
NA
66
All in mg/dL:
Dapagliflozin: InfectionsMonotherapy, 24 weeks
Ferrannini E, et al. Diabetes Care. 2010;33(10):2217-2224.
Genital Infections Urinary Tract Infections
Patie
nts
(%)
PBO 5 mg 10 mg PBO 5 mg 10 mg0
2
4
6
8
10
12
14
4
12.5
5.7
1.3
7.8
12.9
N = 75 64 70 75 64 70
Canagliflozin: InfectionsMonotherapy, 26 weeks
Genital Infections Urinary Tract Infections
Patie
nts
(%)
PBO 100 mg 300 mg PBO 100 mg 300 mg0
2
4
6
8
10
12
14
2.1
6.2 6.6
4.2
7.2
5.1
N = 192 195 197
Stenlöf K, et al. Diabetes Obes Metab. 2013;15:372-382.
192 195 197
Empagliflozin: Infections78 Week Open Label Extension Study
Met 10 mg Empa
25 mg Empa
Met 10 mg Empa
25 mg Empa
0
2
4
6
8
10
12
14
0
4.15.3
0 0
7
3.6
5.35.8
7.1 75.8
MenWomen
Ferrannini E, et al. Diabetes Care. 2013;36(12):4015-4021.
• Bacterial urinary tract infections– 1% to 12% excess over placebo– No observed episodes of pyelonephritis or urosepsis
• Infections were manageable and rarely led to discontinuation of treatment
– Managed with standard antimycotic creams and hygienic measures
Ferrannini E, et al. Diabetes Obes Metab. 2013;15(8):721-728.Fonseca V, et al. J Diabetes Complications. 2013;27:268-273. Nauck MA, et al. Diabetes Care. 2011;34:2015-2022.Stenlöf K, et al. Diabetes Obes Metab. 2013;15:372-382.Wilding JPH, et al. Diabetes Obes Metab. 2013;15:403-409.
SGLT2 Inhibition as a Treatment for Diabetes
• Efficacy– Reduction in HbA1C of 0.5% to 1.0%– Weight reduction of ~3 kg– Reduction in systolic BP of 3 to 5 mmHg– Effective as monotherapy and in combination
• Safety– Little or no risk of hypoglycemia– Increased risk of mycotic genital infections – Uncommon hyperkalemia in select populations
Elderly ACE inhibitors ARB Diuretic
• Side Effects– Polyuria– Transient mild hypotension