Public and private formal sector hiring is insufficient
On current trends the employment outlook for young people in Africa is challenging, in spite of strong job growth before the crisis. The arithmetic of population and job growth illustrates the challenge well: although job growth was strong during the decade preceding the global economic crisis, it was nowhere near enough to absorb the growing labour force. The existing private and public employment capacity is simply too small. For 2000-07, the ILO (2011b) estimates that the working age population of Africa grew by 21% (2.6% per year). Job growth during the same period was even stronger at 23%, i.e. 2.9% per year. But in absolute numbers, while the working age population grew by 96 million, the number of jobs grew only by 63 million. With 10 to 12 million young people entering the African labour market every year, job growth must be much stronger to make a dent in the number of unemployed and discouraged youth.
Growth of good jobs in wage employment is even more limited. The estimates presented in the preceding paragraph were for total job creation, not only for good jobs in wage employment but also vulnerable employment. Wage employment creation is much more difficult to estimate as data are scarce. Assuming that wage employment is being created at a similar, or even higher, pace than vulnerable employment, its overall growth will still be very small given the low rates of wage employment in most African countries. In Uganda, for example, although wage jobs grew at 13% every year between 2003 and 2006, they only accounted for one out of five of the new jobs created (World Bank, 2011c).
This is especially true of the public sector, which has been significantly downsized in many African countries over the last two decades. According to Gallup World Poll data only 21% of those aged under 30 with at least secondary education work for the government, compared to 37% among adults aged 30 and over, or almost double. In many countries, this discrepancy is even larger. In Egypt, Morocco and Uganda, for example, the proportion of government workers among young people is only one third that of adults. In South Africa, Nigeria and Tanzania it is around 40% and in Kenya and Tunisia around 50%. To put this in context, in Egypt government work accounts for over 50% of employment among those over 30 with at least secondary education, in Tunisia 35% in South Africa 25% and in Kenya 16%.
Given strong population growth, the role of the public sector as an employer will continue to shrink. Gallup World Poll data would indicate that African governments currently employ about 25 million people aged 30-64, which corresponds to about 10% of Africa’s population in this age group, and 14 million aged 15-29 which corresponds to about 5% of Africa’s population in this age group.12 Taking into account rapid population growth, to keep these ratios until 2025, African governments would have to create 29 million new public sector jobs, or 1.9 million a year – an unlikely prospect. North African countries in particular have very high ratios of public sector employment. Based on the same calculation, Egypt would have to create 230 000 public sector jobs annually until 2025 and Tunisia 25 000.
The formal private sector is too small to absorb the growing labour force and transition between formal and informal work seems limited. For most of the young, working as a salaried employee in the formal sector remains a distant dream, especially in countries where the public sector has been shedding labour over the last two decades. Instead, those young people who cannot afford unemployment and a prolonged job search are confined to the informal sector and low quality jobs. Once they are stuck in the informal sector, a move into the formal sector other than through self-employment becomes difficult. Analysing
panel data of youth and adults from Ethiopia, Ghana and Tanzania, Falco et al. (2010) and Sandefur et al. (2007) find very low transition rates from self-employment into private wage employment or public employment. In all three countries more than 80% of those in self-employment or unemployment were still in that category two years later (2004-06). Figures 6.12. and 6.13. also suggest a significant degree of labour market segmentation, given that the shares of wage and vulnerable employment remain the same across age cohorts of 30 years and above. Unfortunately, only very few studies exist that follow individuals over time to give a better understanding of the transition dynamics between labour market segments.
Box 6.5. Senegal an example of insufficient employment capacity in the formal sector
The high rate of unemployment and underemployment suggests that not enough jobs are being created : around 100 000 higher education graduates arrive on the labour market each year and fewer than 30 000 formal hiring contracts are registered by the service that gathers employment statistics.
An inquiry carried out as part of the YEN/YIF (2009) study among 378 businesses in 26 key sectors found that 10 264 jobs had been created for young people between 2010 and 2014, of which 6 183 were temporary. The size of the latter category reflects the trend among employers to outsource services for the sake of greater flexibility.
The formal private sector, therefore, does not provide a significant number of job op-portunities. The IMF (2010) reports that the volume of employment in the formal sec-tor has stagnated for the past 15 years; the informal sector remains the chief source of jobs. The World Bank (2007), the YEN/YIF (2009) study and the national report on competitiveness in Senegal estimate that the informal sector accounts for 80% to 97% of jobs created. Commerce is the main sector of activity in the informal sector and the principal source of employment in the periurban areas with a large number of street vendors. USAID (2011) shows that the great majority of young Senegalese think the in-formal sector could not be a best final choice and accept a temporary job while waiting for a formal one.
Source : AEO 2012 Country Note Senegal
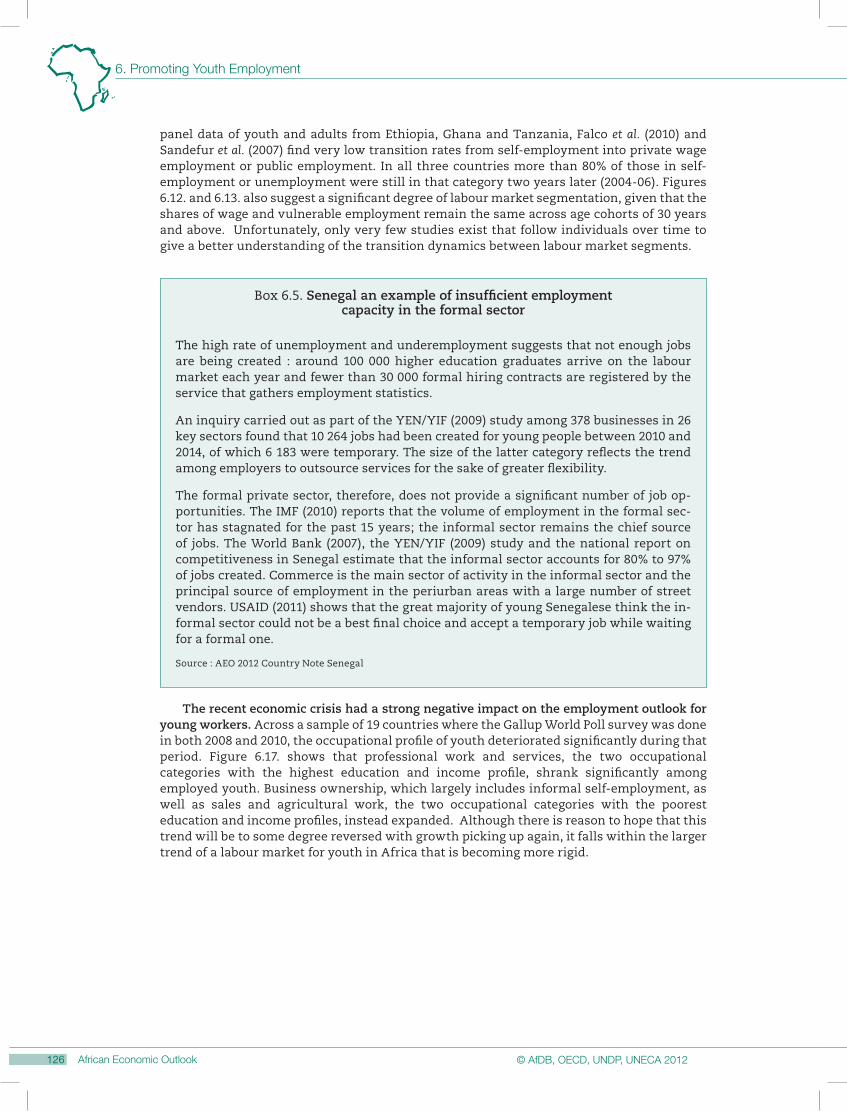
The recent economic crisis had a strong negative impact on the employment outlook for young workers. Across a sample of 19 countries where the Gallup World Poll survey was done in both 2008 and 2010, the occupational profile of youth deteriorated significantly during that period. Figure 6.17. shows that professional work and services, the two occupational categories with the highest education and income profile, shrank significantly among employed youth. Business ownership, which largely includes informal self-employment, as well as sales and agricultural work, the two occupational categories with the poorest education and income profiles, instead expanded. Although there is reason to hope that this trend will be to some degree reversed with growth picking up again, it falls within the larger trend of a labour market for youth in Africa that is becoming more rigid.
Figure 6.17. Youth employment by occupation 2008 and 2010: Informal sector activities and farming have absorbed the impact of the crisis
Source: Gallup World Poll (2010), authors' calculations.12 http://dx.doi.org/10.1787/888932600583
Professional Business Owner Services Sales worker Constr&Manuf Farming Other
Youth employment in the informal sector: an opportunity, not a nuisance
The preceding analysis leads to three conclusions.
• First, the formal sector is incapable of absorbing the large amount of new entrants to the labour market.
• Second, informality and vulnerable employment are the norm for many young Afri-cans and provide an alternative to unemployment and inactivity.
• Third, given quantity constraints on formal sector employment, the informal sec-tor will continue to play an important role in absorbing young entrants to the la-bour market and has to be part of any policy that addresses youth employment.
The fact that labour markets are segmented and that developing economies often contain several sectors operating at very different levels of productivity has been among the early insights of development economists. Although true, this had led to ignoring the potential of rural and informal employment. For Lewis (1954) the movement of workers from unproductive agriculture into the productive industrial sector is the very process of development itself. Once most agricultural workers have migrated to industry and the rural workforce has been reduced to a size at which its members can work with high productivity, wages across the economy would start to rise, like a tide lifting all boats. The rural or “traditionalist” sector has since been primarily seen as the pool of unproductive agricultural surplus labour and urban areas as the centres of industrial growth. The informal sector has suffered a similar fate in the development debate. The traditional view holds that it consists of a large share of subsistence entrepreneurs and a rather small share of growth-oriented firms. As a result, little attention has been paid to the potential of the rural and informal sectors as engines for growth.
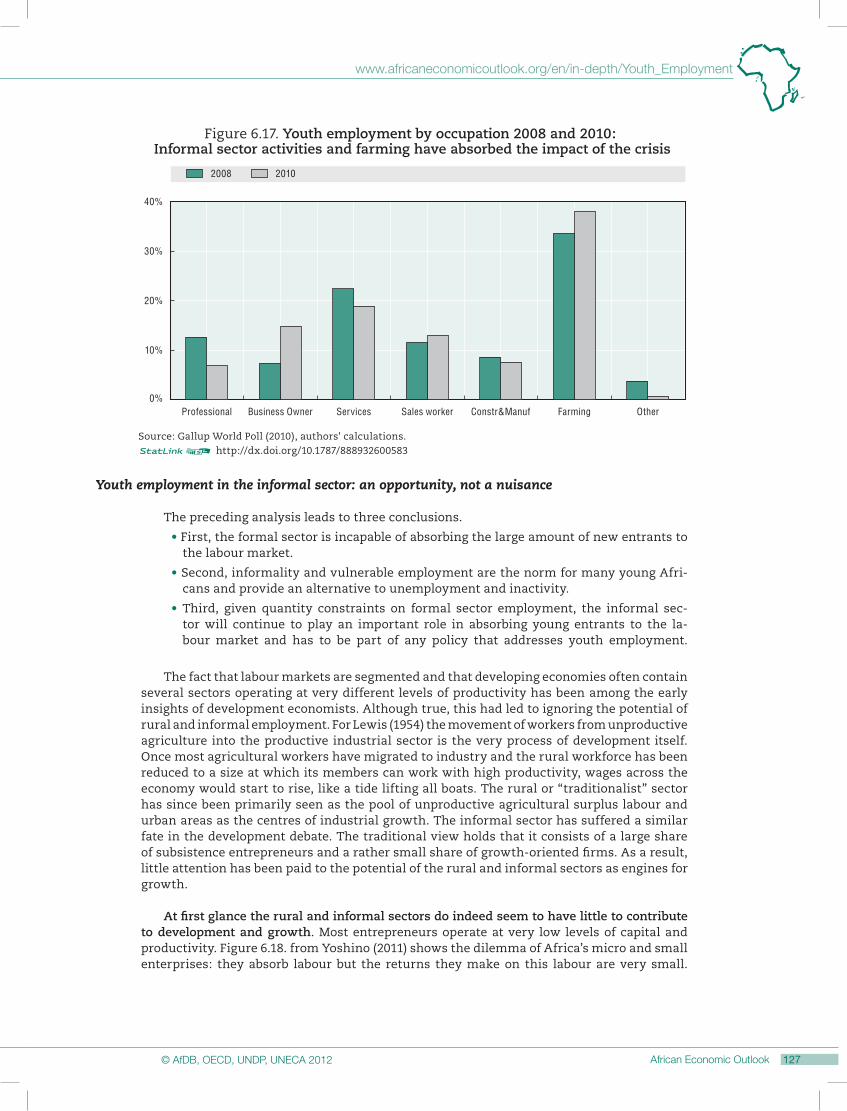
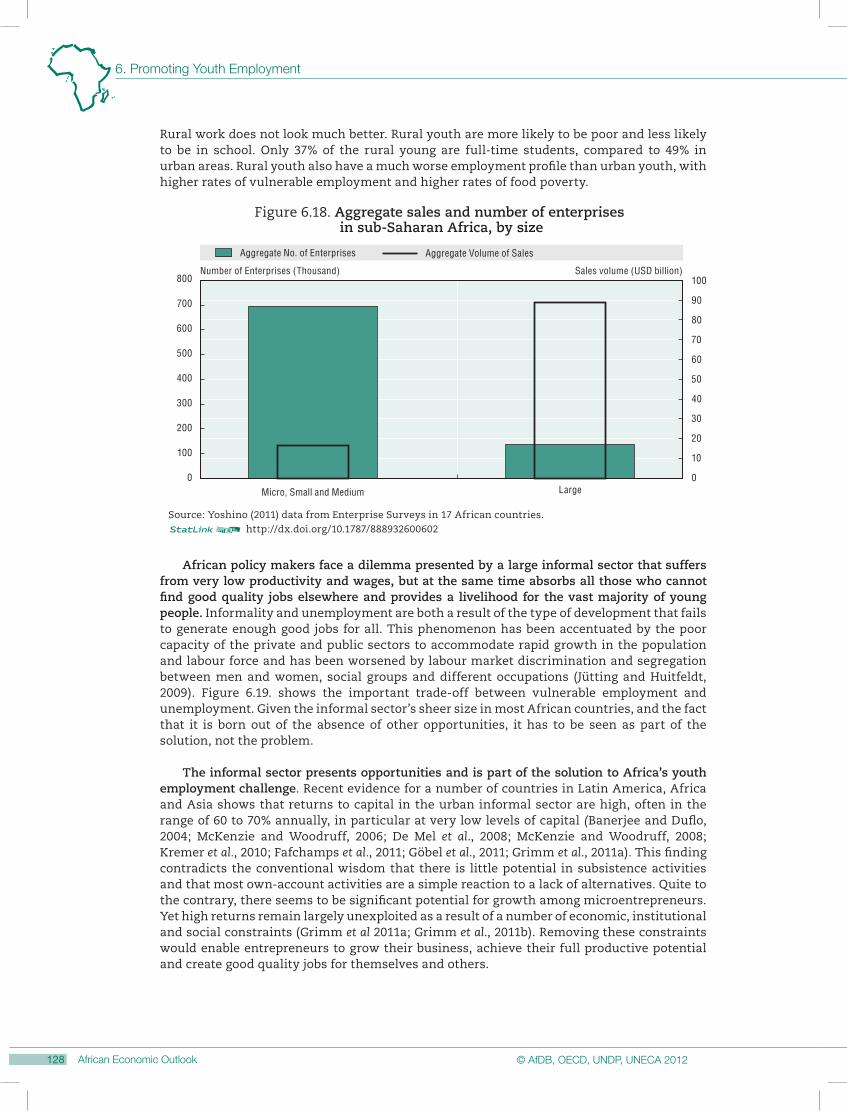
At first glance the rural and informal sectors do indeed seem to have little to contribute to development and growth. Most entrepreneurs operate at very low levels of capital and productivity. Figure 6.18. from Yoshino (2011) shows the dilemma of Africa’s micro and small enterprises: they absorb labour but the returns they make on this labour are very small.
Rural work does not look much better. Rural youth are more likely to be poor and less likely to be in school. Only 37% of the rural young are full-time students, compared to 49% in urban areas. Rural youth also have a much worse employment profile than urban youth, with higher rates of vulnerable employment and higher rates of food poverty.
800
700
600
500
400
300
200
100
0 0
10
20
30
40
50
60
70
90
100
80
Aggregate No. of Enterprises Aggregate Volume of Sales
Figure 6.18. Aggregate sales and number of enterprises in sub-Saharan Africa, by size
Number of Enterprises (Thousand) Sales volume (USD billion)
Source: Yoshino (2011) data from Enterprise Surveys in 17 African countries.12 http://dx.doi.org/10.1787/888932600602
Micro, Small and Medium Large
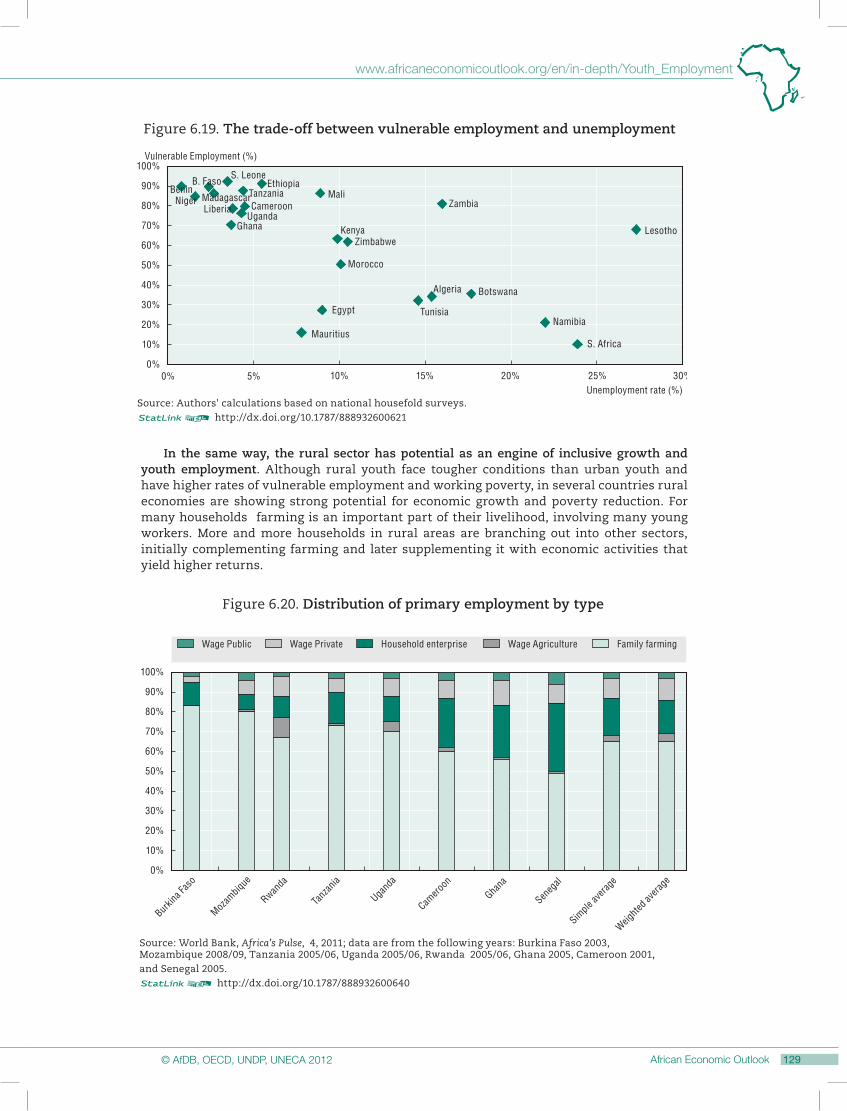
African policy makers face a dilemma presented by a large informal sector that suffers from very low productivity and wages, but at the same time absorbs all those who cannot find good quality jobs elsewhere and provides a livelihood for the vast majority of young people. Informality and unemployment are both a result of the type of development that fails to generate enough good jobs for all. This phenomenon has been accentuated by the poor capacity of the private and public sectors to accommodate rapid growth in the population and labour force and has been worsened by labour market discrimination and segregation between men and women, social groups and different occupations (Jütting and Huitfeldt, 2009). Figure 6.19. shows the important trade-off between vulnerable employment and unemployment. Given the informal sector’s sheer size in most African countries, and the fact that it is born out of the absence of other opportunities, it has to be seen as part of the solution, not the problem.
The informal sector presents opportunities and is part of the solution to Africa’s youth employment challenge. Recent evidence for a number of countries in Latin America, Africa and Asia shows that returns to capital in the urban informal sector are high, often in the range of 60 to 70% annually, in particular at very low levels of capital (Banerjee and Duflo, 2004; McKenzie and Woodruff, 2006; De Mel et al., 2008; McKenzie and Woodruff, 2008; Kremer et al., 2010; Fafchamps et al., 2011; Göbel et al., 2011; Grimm et al., 2011a). This finding contradicts the conventional wisdom that there is little potential in subsistence activities and that most own-account activities are a simple reaction to a lack of alternatives. Quite to the contrary, there seems to be significant potential for growth among microentrepreneurs. Yet high returns remain largely unexploited as a result of a number of economic, institutional and social constraints (Grimm et al 2011a; Grimm et al., 2011b). Removing these constraints would enable entrepreneurs to grow their business, achieve their full productive potential and create good quality jobs for themselves and others.
Figure 6.19. The trade-off between vulnerable employment and unemployment
Vulnerable Employment (%)
Source: Authors' calculations based on national housefold surveys.12 http://dx.doi.org/10.1787/888932600621
Unemployment rate (%)
Lesotho
Mauritius
Egypt Tunisia
Algeria Botswana
Morocco
ZimbabweKenya
ZambiaMali
GhanaUgandaCameroonTanzania
EthiopiaS. Leone
B. Faso
Namibia
S. Africa
MadagascarNigerBenin
Liberia
In the same way, the rural sector has potential as an engine of inclusive growth and youth employment. Although rural youth face tougher conditions than urban youth and have higher rates of vulnerable employment and working poverty, in several countries rural economies are showing strong potential for economic growth and poverty reduction. For many households farming is an important part of their livelihood, involving many young workers. More and more households in rural areas are branching out into other sectors, initially complementing farming and later supplementing it with economic activities that yield higher returns.
100%
90%
80%
70%
60%
50%
40%
30%
20%
10%
0%
Wage Public Wage Private Household enterprise Wage Agriculture Family farming
Burkin
a Fas
o
Mozam
bique
Rwanda
Tanz
ania
Ugand
a
Camero
onGha
na
Seneg
al
Simple
avera
ge
Weighte
d ave
rage
Source: World Bank, Africa’s Pulse, 4, 2011; data are from the following years: Burkina Faso 2003, Mozambique 2008/09, Tanzania 2005/06, Uganda 2005/06, Rwanda 2005/06, Ghana 2005, Cameroon 2001, and Senegal 2005.12 http://dx.doi.org/10.1787/888932600640
Figure 6.20. Distribution of primary employment by type
Fox and Pimhidzai (2011) show that in Uganda “the phenomenal growth of farm household enterprises in the informal sector drove household livelihood transformation; ownership of a non-farm enterprise is a significant predictor of welfare”. In sub-Saharan countries, higher country income levels are associated with a growing number of household enterprises and less subsistence farming, rather than a significant increase in wage jobs (Figure 6.20.) tells a similar story for countries of all income levels: MICs have fewer young people engaged in farming and more business owners, who are largely micro-entrepreneurs. In upper middle-income countries this trend is even stronger. Yet the proportion of young people who are professional workers, which is the core category of wage employees, is only marginally larger in MICs than in LICs.
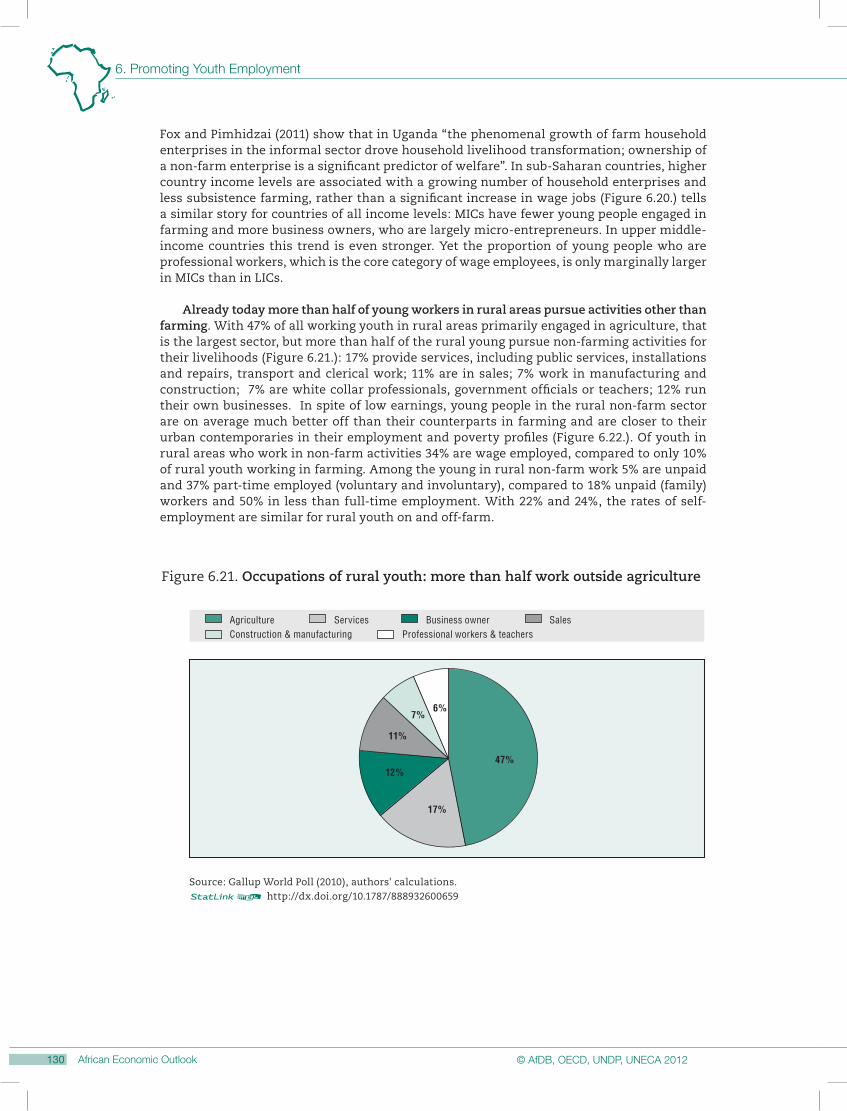
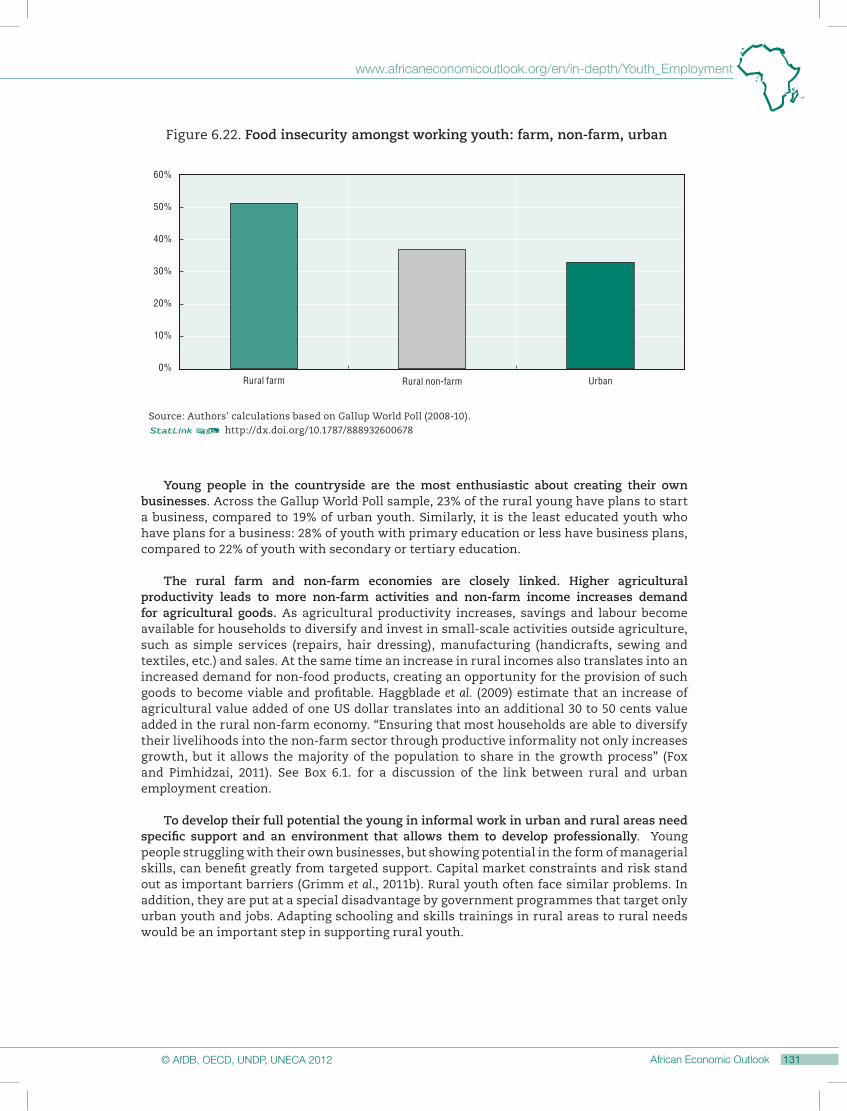
Already today more than half of young workers in rural areas pursue activities other than farming. With 47% of all working youth in rural areas primarily engaged in agriculture, that is the largest sector, but more than half of the rural young pursue non-farming activities for their livelihoods (Figure 6.21.): 17% provide services, including public services, installations and repairs, transport and clerical work; 11% are in sales; 7% work in manufacturing and construction; 7% are white collar professionals, government officials or teachers; 12% run their own businesses. In spite of low earnings, young people in the rural non-farm sector are on average much better off than their counterparts in farming and are closer to their urban contemporaries in their employment and poverty profiles (Figure 6.22.). Of youth in rural areas who work in non-farm activities 34% are wage employed, compared to only 10% of rural youth working in farming. Among the young in rural non-farm work 5% are unpaid and 37% part-time employed (voluntary and involuntary), compared to 18% unpaid (family) workers and 50% in less than full-time employment. With 22% and 24%, the rates of self-employment are similar for rural youth on and off-farm.
47%12%
11%
7%6%
17%
Agriculture Services Business owner SalesConstruction & manufacturing Professional workers & teachers
Figure 6.21. Occupations of rural youth: more than half work outside agriculture
Source: Gallup World Poll (2010), authors' calculations.12 http://dx.doi.org/10.1787/888932600659
Source: Authors' calculations based on Gallup World Poll (2008-10).12 http://dx.doi.org/10.1787/888932600678
Rural farm Rural non-farm Urban
Figure 6.22. Food insecurity amongst working youth: farm, non-farm, urban
Young people in the countryside are the most enthusiastic about creating their own businesses. Across the Gallup World Poll sample, 23% of the rural young have plans to start a business, compared to 19% of urban youth. Similarly, it is the least educated youth who have plans for a business: 28% of youth with primary education or less have business plans, compared to 22% of youth with secondary or tertiary education.
The rural farm and non-farm economies are closely linked. Higher agricultural productivity leads to more non-farm activities and non-farm income increases demand for agricultural goods. As agricultural productivity increases, savings and labour become available for households to diversify and invest in small-scale activities outside agriculture, such as simple services (repairs, hair dressing), manufacturing (handicrafts, sewing and textiles, etc.) and sales. At the same time an increase in rural incomes also translates into an increased demand for non-food products, creating an opportunity for the provision of such goods to become viable and profitable. Haggblade et al. (2009) estimate that an increase of agricultural value added of one US dollar translates into an additional 30 to 50 cents value added in the rural non-farm economy. “Ensuring that most households are able to diversify their livelihoods into the non-farm sector through productive informality not only increases growth, but it allows the majority of the population to share in the growth process” (Fox and Pimhidzai, 2011). See Box 6.1. for a discussion of the link between rural and urban employment creation.
To develop their full potential the young in informal work in urban and rural areas need specific support and an environment that allows them to develop professionally. Young people struggling with their own businesses, but showing potential in the form of managerial skills, can benefit greatly from targeted support. Capital market constraints and risk stand out as important barriers (Grimm et al., 2011b). Rural youth often face similar problems. In addition, they are put at a special disadvantage by government programmes that target only urban youth and jobs. Adapting schooling and skills trainings in rural areas to rural needs would be an important step in supporting rural youth.
Box 6.6. Settlement dynamics and rural employment creation in West Africa
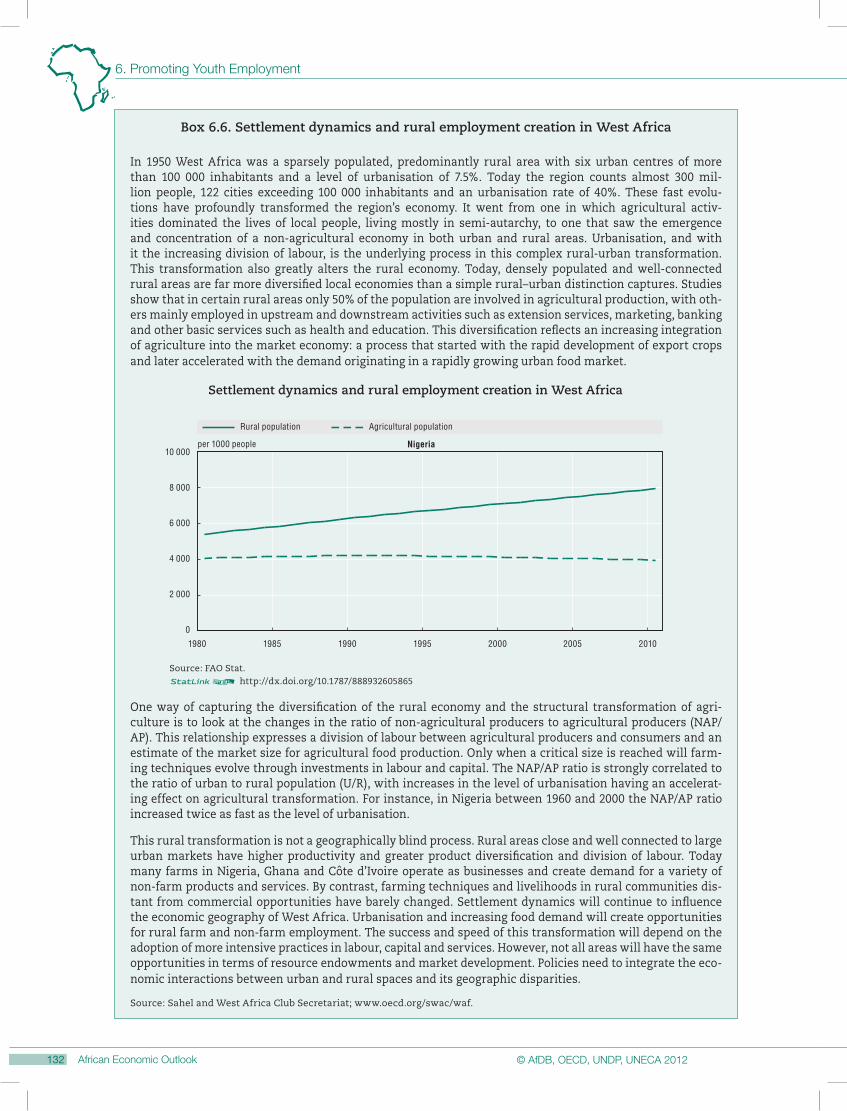
In 1950 West Africa was a sparsely populated, predominantly rural area with six urban centres of more than 100 000 inhabitants and a level of urbanisation of 7.5%. Today the region counts almost 300 mil-lion people, 122 cities exceeding 100 000 inhabitants and an urbanisation rate of 40%. These fast evolu-tions have profoundly transformed the region’s economy. It went from one in which agricultural activ-ities dominated the lives of local people, living mostly in semi-autarchy, to one that saw the emergence and concentration of a non-agricultural economy in both urban and rural areas. Urbanisation, and with it the increasing division of labour, is the underlying process in this complex rural-urban transformation. This transformation also greatly alters the rural economy. Today, densely populated and well-connected rural areas are far more diversified local economies than a simple rural–urban distinction captures. Studies show that in certain rural areas only 50% of the population are involved in agricultural production, with oth-ers mainly employed in upstream and downstream activities such as extension services, marketing, banking and other basic services such as health and education. This diversification reflects an increasing integration of agriculture into the market economy: a process that started with the rapid development of export crops and later accelerated with the demand originating in a rapidly growing urban food market.
One way of capturing the diversification of the rural economy and the structural transformation of agri-culture is to look at the changes in the ratio of non-agricultural producers to agricultural producers (NAP/AP). This relationship expresses a division of labour between agricultural producers and consumers and an estimate of the market size for agricultural food production. Only when a critical size is reached will farm-ing techniques evolve through investments in labour and capital. The NAP/AP ratio is strongly correlated to the ratio of urban to rural population (U/R), with increases in the level of urbanisation having an accelerat-ing effect on agricultural transformation. For instance, in Nigeria between 1960 and 2000 the NAP/AP ratio increased twice as fast as the level of urbanisation.
This rural transformation is not a geographically blind process. Rural areas close and well connected to large urban markets have higher productivity and greater product diversification and division of labour. Today many farms in Nigeria, Ghana and Côte d’Ivoire operate as businesses and create demand for a variety of non-farm products and services. By contrast, farming techniques and livelihoods in rural communities dis-tant from commercial opportunities have barely changed. Settlement dynamics will continue to influence the economic geography of West Africa. Urbanisation and increasing food demand will create opportunities for rural farm and non-farm employment. The success and speed of this transformation will depend on the adoption of more intensive practices in labour, capital and services. However, not all areas will have the same opportunities in terms of resource endowments and market development. Policies need to integrate the eco-nomic interactions between urban and rural spaces and its geographic disparities.
Source: Sahel and West Africa Club Secretariat; www.oecd.org/swac/waf.
1980 1985 1990 1995 2000 2005 2010
0
2 000
4 000
6 000
8 000
10 000
Rural population Agricultural population
Settlement dynamics and rural employment creation in West Africa
Obstacles and needs of young people in African labour markets
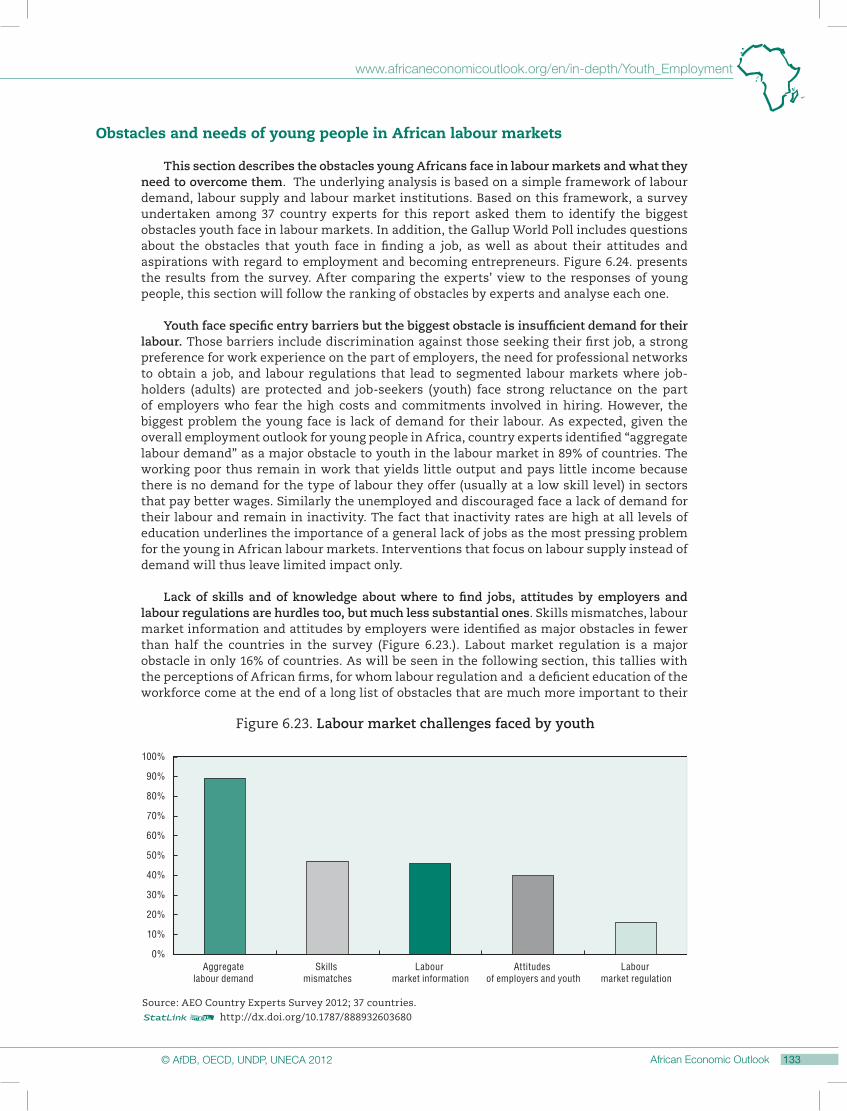
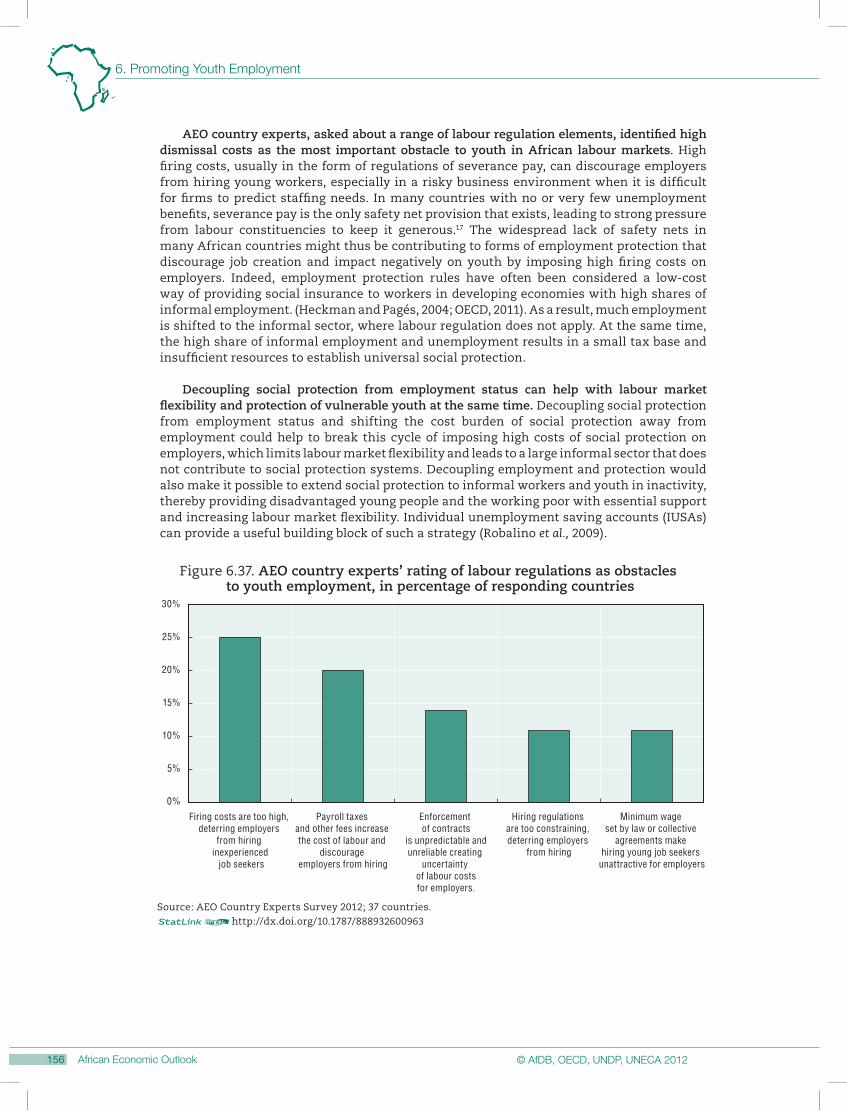
This section describes the obstacles young Africans face in labour markets and what they need to overcome them. The underlying analysis is based on a simple framework of labour demand, labour supply and labour market institutions. Based on this framework, a survey undertaken among 37 country experts for this report asked them to identify the biggest obstacles youth face in labour markets. In addition, the Gallup World Poll includes questions about the obstacles that youth face in finding a job, as well as about their attitudes and aspirations with regard to employment and becoming entrepreneurs. Figure 6.24. presents the results from the survey. After comparing the experts’ view to the responses of young people, this section will follow the ranking of obstacles by experts and analyse each one.
Youth face specific entry barriers but the biggest obstacle is insufficient demand for their labour. Those barriers include discrimination against those seeking their first job, a strong preference for work experience on the part of employers, the need for professional networks to obtain a job, and labour regulations that lead to segmented labour markets where job-holders (adults) are protected and job-seekers (youth) face strong reluctance on the part of employers who fear the high costs and commitments involved in hiring. However, the biggest problem the young face is lack of demand for their labour. As expected, given the overall employment outlook for young people in Africa, country experts identified “aggregate labour demand” as a major obstacle to youth in the labour market in 89% of countries. The working poor thus remain in work that yields little output and pays little income because there is no demand for the type of labour they offer (usually at a low skill level) in sectors that pay better wages. Similarly the unemployed and discouraged face a lack of demand for their labour and remain in inactivity. The fact that inactivity rates are high at all levels of education underlines the importance of a general lack of jobs as the most pressing problem for the young in African labour markets. Interventions that focus on labour supply instead of demand will thus leave limited impact only.
Lack of skills and of knowledge about where to find jobs, attitudes by employers and labour regulations are hurdles too, but much less substantial ones. Skills mismatches, labour market information and attitudes by employers were identified as major obstacles in fewer than half the countries in the survey (Figure 6.23.). Labout market regulation is a major obstacle in only 16% of countries. As will be seen in the following section, this tallies with the perceptions of African firms, for whom labour regulation and a deficient education of the workforce come at the end of a long list of obstacles that are much more important to their
100%
0%
10%
20%
30%
40%
50%
60%
70%
80%
90%
Skills mismatches
Source: AEO Country Experts Survey 2012; 37 countries.12 http://dx.doi.org/10.1787/888932603680
Aggregate labour demand
Labour market information
Attitudes of employers and youth
Labour market regulation
Figure 6.23. Labour market challenges faced by youth
business development and hence their ability to create jobs (Figure 6.24.).Interventions that focus on labour supply instead of demand will thus have limited impact only. As will be seen most governments turn to initiatives targeting skills to address youth employment.
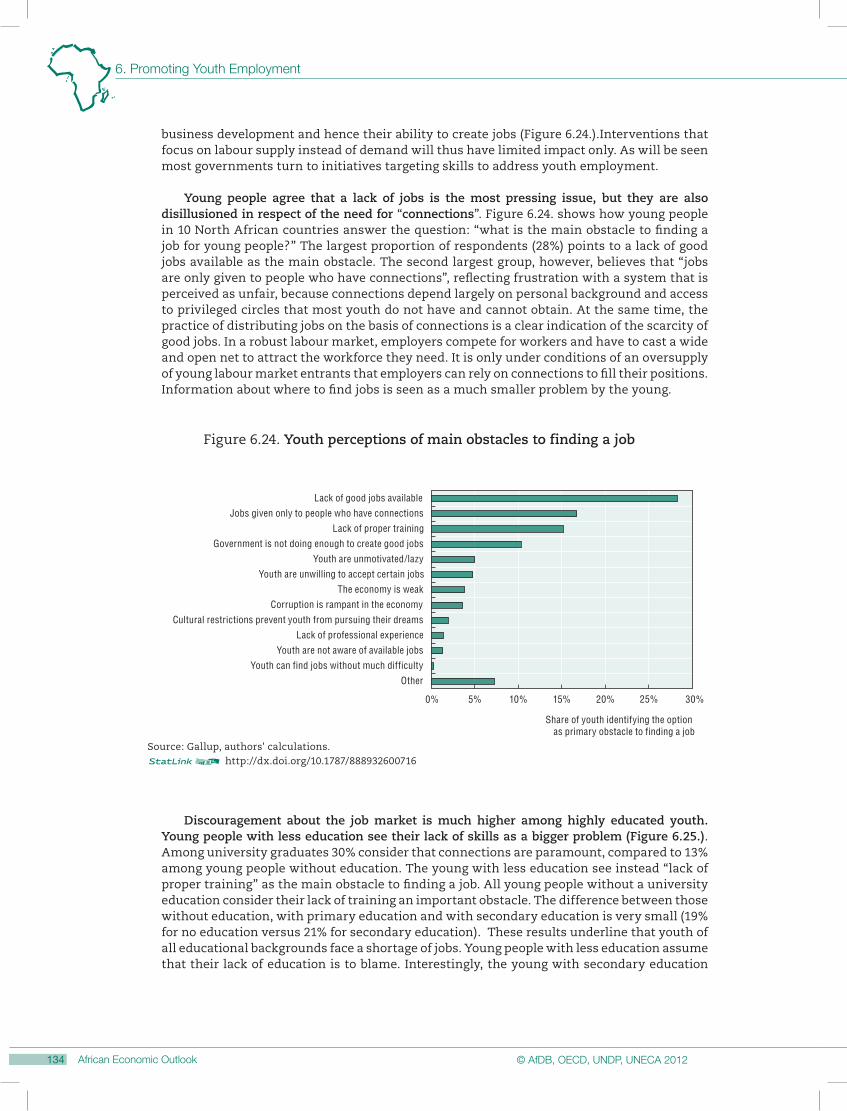
Young people agree that a lack of jobs is the most pressing issue, but they are also disillusioned in respect of the need for “connections”. Figure 6.24. shows how young people in 10 North African countries answer the question: “what is the main obstacle to finding a job for young people?” The largest proportion of respondents (28%) points to a lack of good jobs available as the main obstacle. The second largest group, however, believes that “jobs are only given to people who have connections”, reflecting frustration with a system that is perceived as unfair, because connections depend largely on personal background and access to privileged circles that most youth do not have and cannot obtain. At the same time, the practice of distributing jobs on the basis of connections is a clear indication of the scarcity of good jobs. In a robust labour market, employers compete for workers and have to cast a wide and open net to attract the workforce they need. It is only under conditions of an oversupply of young labour market entrants that employers can rely on connections to fill their positions. Information about where to find jobs is seen as a much smaller problem by the young.
Share of youth identifying the option as primary obstacle to finding a job
Lack of good jobs available
Jobs given only to people who have connections
Lack of proper training
Government is not doing enough to create good jobs
Youth are unmotivated/lazy
Youth are unwilling to accept certain jobs
The economy is weak
Corruption is rampant in the economy
Cultural restrictions prevent youth from pursuing their dreams
Lack of professional experience
Youth are not aware of available jobs
Youth can find jobs without much difficulty
Other
Figure 6.24. Youth perceptions of main obstacles to finding a job
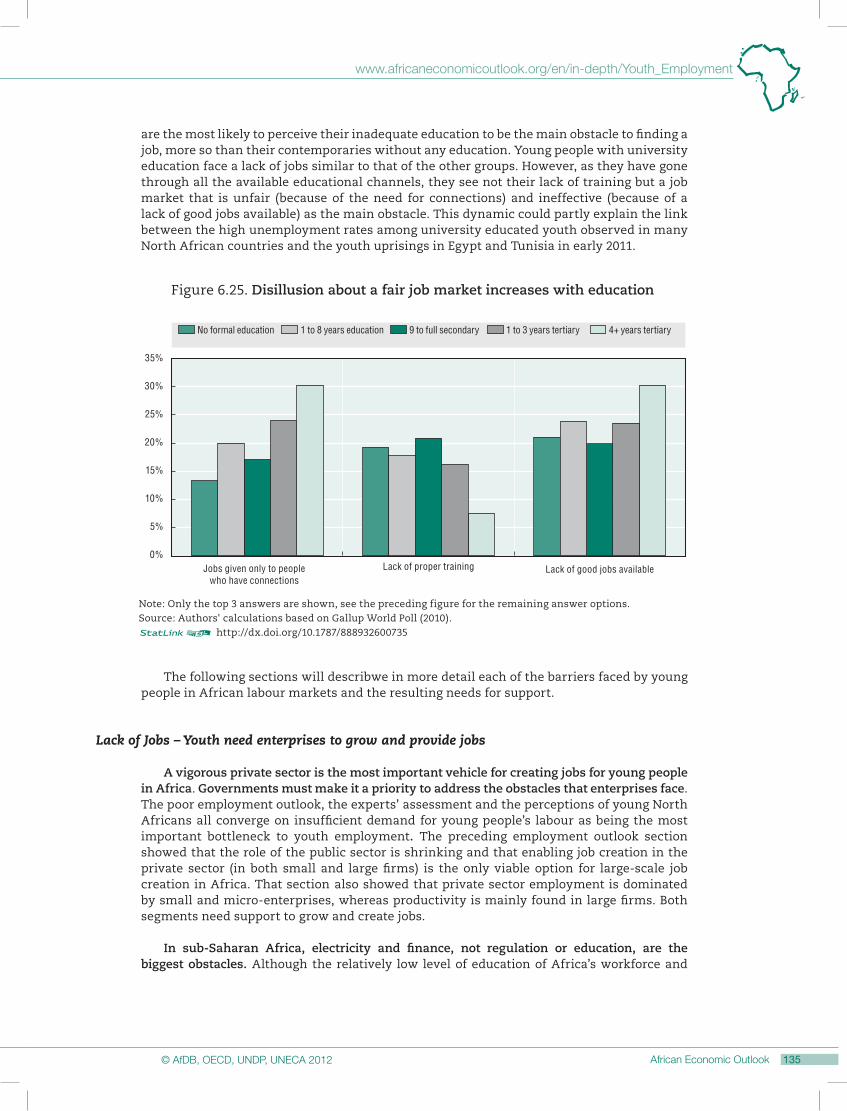
Discouragement about the job market is much higher among highly educated youth. Young people with less education see their lack of skills as a bigger problem (Figure 6.25.). Among university graduates 30% consider that connections are paramount, compared to 13% among young people without education. The young with less education see instead “lack of proper training” as the main obstacle to finding a job. All young people without a university education consider their lack of training an important obstacle. The difference between those without education, with primary education and with secondary education is very small (19% for no education versus 21% for secondary education). These results underline that youth of all educational backgrounds face a shortage of jobs. Young people with less education assume that their lack of education is to blame. Interestingly, the young with secondary education
are the most likely to perceive their inadequate education to be the main obstacle to finding a job, more so than their contemporaries without any education. Young people with university education face a lack of jobs similar to that of the other groups. However, as they have gone through all the available educational channels, they see not their lack of training but a job market that is unfair (because of the need for connections) and ineffective (because of a lack of good jobs available) as the main obstacle. This dynamic could partly explain the link between the high unemployment rates among university educated youth observed in many North African countries and the youth uprisings in Egypt and Tunisia in early 2011.
35%
30%
25%
20%
15%
10%
5%
0%
No formal education 1 to 8 years education 9 to full secondary 1 to 3 years tertiary 4+ years tertiary
Note: Only the top 3 answers are shown, see the preceding figure for the remaining answer options.Source: Authors' calculations based on Gallup World Poll (2010).12 http://dx.doi.org/10.1787/888932600735
Jobs given only to peoplewho have connections
Lack of proper training Lack of good jobs available
Figure 6.25. Disillusion about a fair job market increases with education
The following sections will describwe in more detail each of the barriers faced by young people in African labour markets and the resulting needs for support.
Lack of Jobs – Youth need enterprises to grow and provide jobs
A vigorous private sector is the most important vehicle for creating jobs for young people in Africa. Governments must make it a priority to address the obstacles that enterprises face. The poor employment outlook, the experts’ assessment and the perceptions of young North Africans all converge on insufficient demand for young people’s labour as being the most important bottleneck to youth employment. The preceding employment outlook section showed that the role of the public sector is shrinking and that enabling job creation in the private sector (in both small and large firms) is the only viable option for large-scale job creation in Africa. That section also showed that private sector employment is dominated by small and micro-enterprises, whereas productivity is mainly found in large firms. Both segments need support to grow and create jobs.
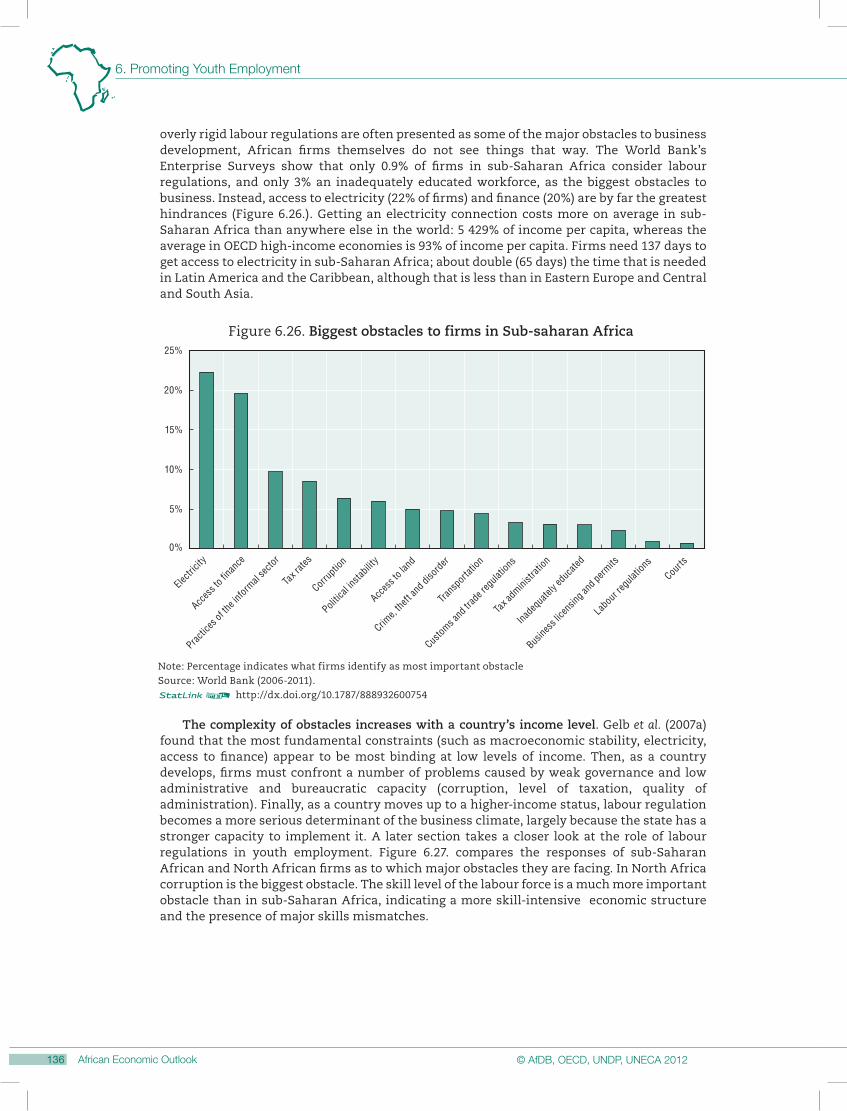
In sub-Saharan Africa, electricity and finance, not regulation or education, are the biggest obstacles. Although the relatively low level of education of Africa’s workforce and
overly rigid labour regulations are often presented as some of the major obstacles to business development, African firms themselves do not see things that way. The World Bank’s Enterprise Surveys show that only 0.9% of firms in sub-Saharan Africa consider labour regulations, and only 3% an inadequately educated workforce, as the biggest obstacles to business. Instead, access to electricity (22% of firms) and finance (20%) are by far the greatest hindrances (Figure 6.26.). Getting an electricity connection costs more on average in sub-Saharan Africa than anywhere else in the world: 5 429% of income per capita, whereas the average in OECD high-income economies is 93% of income per capita. Firms need 137 days to get access to electricity in sub-Saharan Africa; about double (65 days) the time that is needed in Latin America and the Caribbean, although that is less than in Eastern Europe and Central and South Asia.
25%
0%
5%
10%
15%
20%
Note: Percentage indicates what firms identify as most important obstacleSource: World Bank (2006-2011).12 http://dx.doi.org/10.1787/888932600754
Electr
icity
Acces
s to f
inanc
e
Practic
es of
the i
nform
al se
ctor
Corrup
tion
Tax r
ates
Politic
al ins
tabilit
y
Acces
s to l
and
Crime,
theft a
nd di
sord
er
Trans
porta
tion
Custom
s and
trad
e reg
ulatio
ns
Tax a
dmini
strati
on
Inade
quate
ly ed
ucate
d
Busine
ss lic
ensin
g and
perm
its
Labou
r reg
ulatio
ns
Courts
Figure 6.26. Biggest obstacles to firms in Sub-saharan Africa
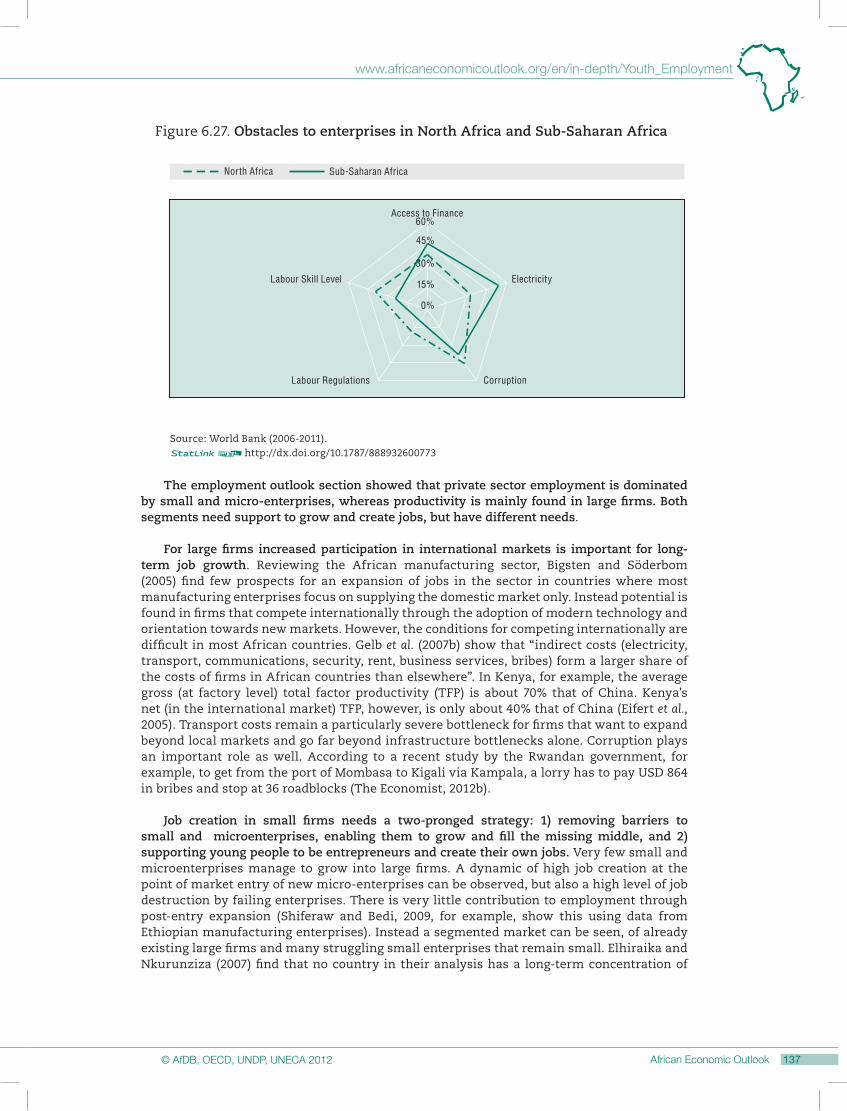
The complexity of obstacles increases with a country’s income level. Gelb et al. (2007a) found that the most fundamental constraints (such as macroeconomic stability, electricity, access to finance) appear to be most binding at low levels of income. Then, as a country develops, firms must confront a number of problems caused by weak governance and low administrative and bureaucratic capacity (corruption, level of taxation, quality of administration). Finally, as a country moves up to a higher-income status, labour regulation becomes a more serious determinant of the business climate, largely because the state has a stronger capacity to implement it. A later section takes a closer look at the role of labour regulations in youth employment. Figure 6.27. compares the responses of sub-Saharan African and North African firms as to which major obstacles they are facing. In North Africa corruption is the biggest obstacle. The skill level of the labour force is a much more important obstacle than in sub-Saharan Africa, indicating a more skill-intensive economic structure and the presence of major skills mismatches.
Figure 6.27. Obstacles to enterprises in North Africa and Sub-Saharan Africa
Source: World Bank (2006-2011).12http://dx.doi.org/10.1787/888932600773
The employment outlook section showed that private sector employment is dominated by small and micro-enterprises, whereas productivity is mainly found in large firms. Both segments need support to grow and create jobs, but have different needs.
For large firms increased participation in international markets is important for long-term job growth. Reviewing the African manufacturing sector, Bigsten and Söderbom (2005) find few prospects for an expansion of jobs in the sector in countries where most manufacturing enterprises focus on supplying the domestic market only. Instead potential is found in firms that compete internationally through the adoption of modern technology and orientation towards new markets. However, the conditions for competing internationally are difficult in most African countries. Gelb et al. (2007b) show that “indirect costs (electricity, transport, communications, security, rent, business services, bribes) form a larger share of the costs of firms in African countries than elsewhere”. In Kenya, for example, the average gross (at factory level) total factor productivity (TFP) is about 70% that of China. Kenya’s net (in the international market) TFP, however, is only about 40% that of China (Eifert et al., 2005). Transport costs remain a particularly severe bottleneck for firms that want to expand beyond local markets and go far beyond infrastructure bottlenecks alone. Corruption plays an important role as well. According to a recent study by the Rwandan government, for example, to get from the port of Mombasa to Kigali via Kampala, a lorry has to pay USD 864 in bribes and stop at 36 roadblocks (The Economist, 2012b).
Job creation in small firms needs a two-pronged strategy: 1) removing barriers to small and microenterprises, enabling them to grow and fill the missing middle, and 2) supporting young people to be entrepreneurs and create their own jobs. Very few small and microenterprises manage to grow into large firms. A dynamic of high job creation at the point of market entry of new micro-enterprises can be observed, but also a high level of job destruction by failing enterprises. There is very little contribution to employment through post-entry expansion (Shiferaw and Bedi, 2009, for example, show this using data from Ethiopian manufacturing enterprises). Instead a segmented market can be seen, of already existing large firms and many struggling small enterprises that remain small. Elhiraika and Nkurunziza (2007) find that no country in their analysis has a long-term concentration of
firms in the medium-size group. To foster job creation governments must focus on removing the barriers that are specific to small and micro-enterprises and support their growth into productive firms. At the same time for many young people entering self-employment is the only viable alternative given a lack of opportunities for wage employment. These young people face specific challenges and need special support to develop their businesses.
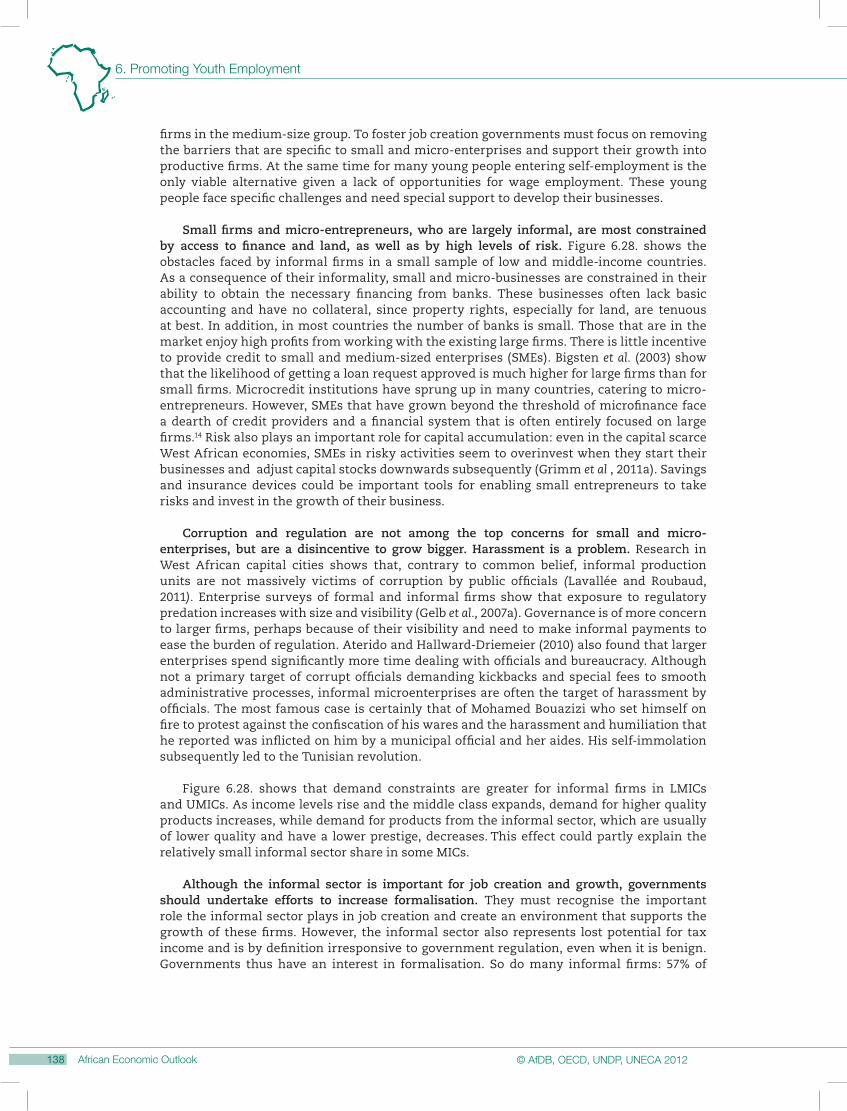
Small firms and micro-entrepreneurs, who are largely informal, are most constrained by access to finance and land, as well as by high levels of risk. Figure 6.28. shows the obstacles faced by informal firms in a small sample of low and middle-income countries. As a consequence of their informality, small and micro-businesses are constrained in their ability to obtain the necessary financing from banks. These businesses often lack basic accounting and have no collateral, since property rights, especially for land, are tenuous at best. In addition, in most countries the number of banks is small. Those that are in the market enjoy high profits from working with the existing large firms. There is little incentive to provide credit to small and medium-sized enterprises (SMEs). Bigsten et al. (2003) show that the likelihood of getting a loan request approved is much higher for large firms than for small firms. Microcredit institutions have sprung up in many countries, catering to micro-entrepreneurs. However, SMEs that have grown beyond the threshold of microfinance face a dearth of credit providers and a financial system that is often entirely focused on large firms.14 Risk also plays an important role for capital accumulation: even in the capital scarce West African economies, SMEs in risky activities seem to overinvest when they start their businesses and adjust capital stocks downwards subsequently (Grimm et al , 2011a). Savings and insurance devices could be important tools for enabling small entrepreneurs to take risks and invest in the growth of their business.
Corruption and regulation are not among the top concerns for small and micro-enterprises, but are a disincentive to grow bigger. Harassment is a problem. Research in West African capital cities shows that, contrary to common belief, informal production units are not massively victims of corruption by public officials (Lavallée and Roubaud, 2011). Enterprise surveys of formal and informal firms show that exposure to regulatory predation increases with size and visibility (Gelb et al., 2007a). Governance is of more concern to larger firms, perhaps because of their visibility and need to make informal payments to ease the burden of regulation. Aterido and Hallward-Driemeier (2010) also found that larger enterprises spend significantly more time dealing with officials and bureaucracy. Although not a primary target of corrupt officials demanding kickbacks and special fees to smooth administrative processes, informal microenterprises are often the target of harassment by officials. The most famous case is certainly that of Mohamed Bouazizi who set himself on fire to protest against the confiscation of his wares and the harassment and humiliation that he reported was inflicted on him by a municipal official and her aides. His self-immolation subsequently led to the Tunisian revolution.
Figure 6.28. shows that demand constraints are greater for informal firms in LMICs and UMICs. As income levels rise and the middle class expands, demand for higher quality products increases, while demand for products from the informal sector, which are usually of lower quality and have a lower prestige, decreases. This effect could partly explain the relatively small informal sector share in some MICs.
Although the informal sector is important for job creation and growth, governments should undertake efforts to increase formalisation. They must recognise the important role the informal sector plays in job creation and create an environment that supports the growth of these firms. However, the informal sector also represents lost potential for tax income and is by definition irresponsive to government regulation, even when it is benign. Governments thus have an interest in formalisation. So do many informal firms: 57% of
them see formalisation as way to obtain better access to financing (Enterprise Surveys). Nevertheless there are many good reasons for firms to stay informal( see Box 6.7.). Policies to increase formalisation must therefore aim at providing incentives and information, not penalisation of informality. Jütting and de Laiglesia (2009) propose a strategy that combines providing incentives for formalisation to those in the upper tier of informality with giving those excluded from the formal labour market the necessary means to become more productive and improve their risk management.
Box 6.7. Why are most of Africa’s firms informal?
Contrary to common assumption, the primary reason why so many firms are informal is a lack of information about what is required to register (33% of firms chose this re-sponse; Enterprise surveys). Other reasons are the taxes that formal businesses have to pay (24%) and the high costs of registration (20%).
When there are fluctuations in demand, an informal firm finds it easier to adjust be-cause of its simple and flexible technology, and hence it can avoid some of the costs as-sociated with idle capacity. The ease with which an informal firm can vary its employ-ment level can save on wage costs. (Bigsten and Söderbom 2005)
Skills required for business activities are usually gained outside formal education, therefore training opportunities and access to informal networks are another advan-tage: working in the informal sector may be the only chance of accumulating experi-ence or even of training and apprenticeship for low-skilled young workers. Moreover, talented workers may have better prospects for upward mobility in the informal sector (Jütting et al., 2008). Although wages are generally lower in the informal sector, indi-viduals with specific characteristics may have a comparative advantage in informal employment that can be translated into higher earnings compared to potential pay in the formal sector (Jütting et al., 2008).
0%
10%
20%
30%
40%
50%
60%
LICs LMICs UMICs
Figure 6.28. The chief obstacles faced by informal firms
Limited access to finance
Restricted access to land
Limited demand for product or services
Crime, theft and disorder
Inadequately educated workforce
Source: World Bank (2008-10), authors' calculations.12 http://dx.doi.org/10.1787/888932600792
Young people can benefit from specific programmes that support their entrepreneurial activities, but these must be well targeted. Support for young entrepreneurs ranges from measures that provide jobseekers with financial and technical assistance to create their own businesses, including microcredit and entrepreneurship training and mentoring, to measures that improve their chances to expand. Self-employment programmes are relatively cheap and can create permanent and value-added jobs, as long as projects are carefully selected and supported, and entrepreneurs have access to credit and markets (Puerto, 2007). Based on personal characteristics such as education and managerial ability, Grimm et al. (2011c) identify a large group of ‘constrained gazelles’. These are micro-entrepreneurs who exhibit similar characteristics to successful entrepreneurs but operate at very low levels of capital, held back by the many constraints listed above. Based on data from urban informal entrepreneurs in West Africa in the early 2000s, they estimate the share of constrained gazelles among young people to be 27% compared to 49% among adults. Assuming similar distributions elsewhere, support programmes must strive to identify these 27% of young entrepreneurs with potential and help them overcome the many barriers they face in terms of access to finance, risks and skills.
Without appropriate targeting, support programmes are likely to fail and even do harm, especially when providing finance. Where firms and young entrepreneurs are not chosen carefully, based on their skill, drive and business plans, providing credit can be wasteful and harmful. Many small firms collapse as a result of using credit (Nkurunziza, 2008) or simply do not pay the money back. In Tunisia, for example only around 50% of young entrepreneurs have repaid their loans, mainly because of the lack of clients (MDGF, 2009). In Benin, the Fonds National de Promotion de l’Entreprise et de l’Emploi des Jeunes (FNPEEJ), created in 2007, encourages the entrepreneurial spirit of young people by financing business creation, but because of the non-repayment by a large number of beneficiaries (up to 81%), in September 2011, the deficit reached more than 1.6 billion CFA francs. In the long run such high rates of non-repayment can create the impression that funding provided for young entrepreneurs is free and not a credit.
Programmes to support youth must be comprehensive. To start a business, young people do not only need capital: knowledge on how to run a company is also required. Entrepreneurship training provides young people with the skills they need to create and manage a sustainable business likely to generate jobs. Mentoring and business incubators can be valuable tools to convey these skills. To be efficient, training has to mix (Henry et al., 2005) technical skills, such as written and oral communication; technical management and organising skills; business management skills, such as planning, decision making, marketing and accounting; and personal entrepreneurial skills such as self-discpline, risk taking and innovation. The following section discusses the educational and training needs of youth in more detail.
To better understand how to support young entrepreneurs, more rigorous evaluation is necessary. In spite of some positive examples of well-functioning programmes that offer comprehensive support to young entrepreneurs (see Box 6.8.), far too little is known about how to support young entrepreneurs in Africa. In many cases training activities, and especially financing mechanisms, fail to create lasting jobs. Particularly where financing is provided directly through government services the failure rate is high (CGAP, 2004). Rigorous evaluations are necessary to identify what works and what does not work and develop evidence based programmes.
Box 6.8. Senegal’s Synapse Centre – an example of a comprehensive training and financing approach for young entrepreneurs
A good example of a comprehensive programme for young entrepreneurs can be found in Senegal, where the minimum cost of setting up a formalised business is 255% of annual average per capita income. To overcome this barrier, the Synapse Centre was created in 2003. It provides potential young entrepreneurs with the experience, sup-port and advice they need to establish and run successful businesses and contribute to overall economic growth and job creation. Its initiative, Promise Programme, is a highly intensive youth entrepreneurship training programme of 14 months that com-bines traditional entrepreneurship theory with interactive case-based studies, practi-cal experience, personal development retreats, and professional business consulting and mentoring. This support has included the provision of incubator facilities including office space, monthly training workshops, group learning, mentoring, and counselling (provided by some of the best-known companies in Senegal). The centre also serves to link young entrepreneurs to the government’s National Fund for Youth Employment (FNEJ) giving them access to low-interest loans for their businesses. Its objective is to ensure that each participant establishes a successful business which in turn gives something back to society. By 2008 17 promising entrepreneurs had graduated from the first class; nine young participants had become entrepreneurs as founders of new com-panies; and 35 business leaders had been recruited to mentor young entrepreneurs. The nine successful entrepreneurs have created 137 jobs within their businesses. Synapse’s annual budget of USD 80 000 equates to one job created for every USD 584 spent. The experience of Synapse has shown that the increased self-confidence resulting from the mentoring initiative enables entrepreneurs to expand their personal vision through a leadership experience that they otherwise might not have had.
Education and skills mismatches – Young people need more comprehensive education that re-sponds to labour market needs
Education is not the biggest bottleneck to youth employment but it is a major one. Figure 6.29. showed that AEO country experts consider lack of education and skills mismatches to be major obstacles for young people in labour markets in about half the countries in the survey. Figure 6.30. showed that a lack of proper training is the third most cited reason by young people from North Africa why they do not find jobs.
The preceding analysis has established a number of facts about youth employment and education:
• The chances of being wage employed rather than in vulnerable employment are sig-nificantly higher for young people with more education. For those in employment wages are higher.
• Higher education is linked to higher unemployment among young people but lower unemployment among adults.
• Among those with higher education the unemployment rate varies by type of educa-tional degree.
• Young people with education face a higher likelihood of unemployment and discour-agement in MICs than in LICs
• Discouragement and being out of the labour force are higher among young people with no, or only a little, education. Overall, NEET rates are lowest among young people with tertiary education.
The analysis suggests that much unemployment, and even discouragement, observed among educated young people are largely transitory phenomena and the result of queuing for good jobs by the better off. However, the length of this transition, which can often take many years, and the strong link between field of study and unemployment rate, suggest a serious mismatch between the skills young people bring with them when they leave the education system and those that are sought after in labour markets.
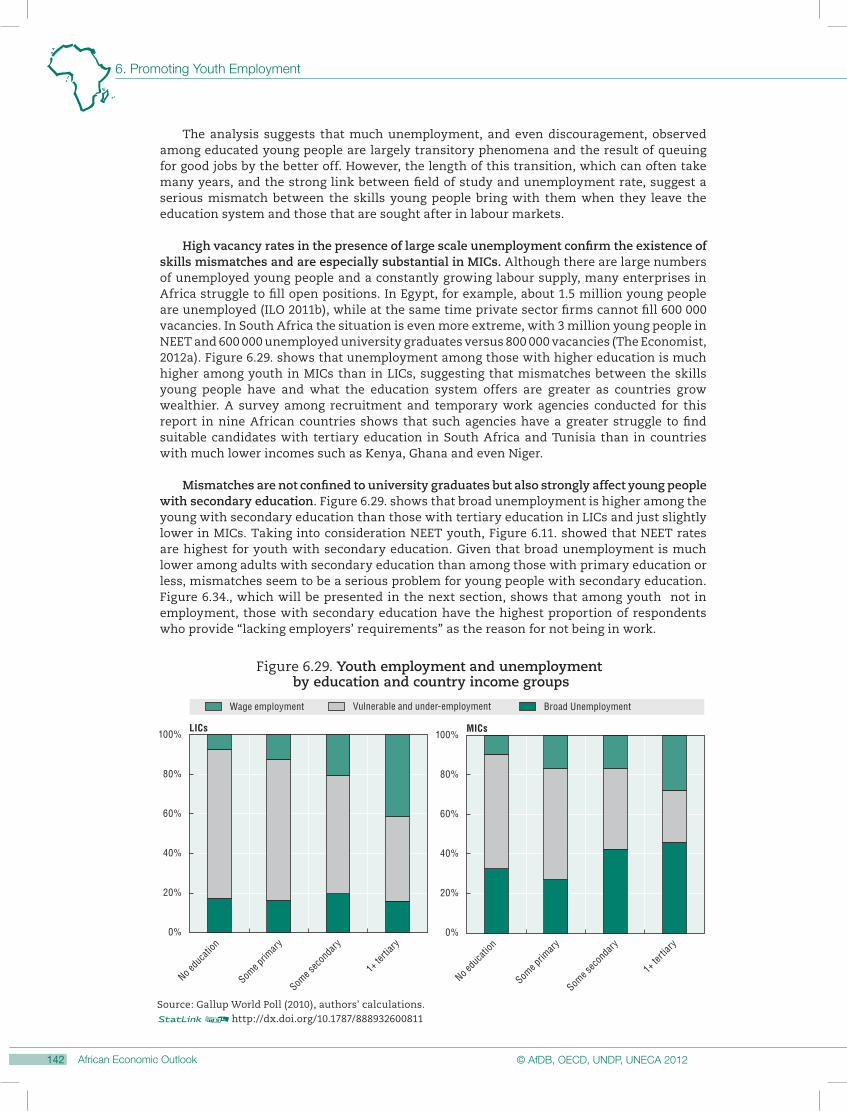
High vacancy rates in the presence of large scale unemployment confirm the existence of skills mismatches and are especially substantial in MICs. Although there are large numbers of unemployed young people and a constantly growing labour supply, many enterprises in Africa struggle to fill open positions. In Egypt, for example, about 1.5 million young people are unemployed (ILO 2011b), while at the same time private sector firms cannot fill 600 000 vacancies. In South Africa the situation is even more extreme, with 3 million young people in NEET and 600 000 unemployed university graduates versus 800 000 vacancies (The Economist, 2012a). Figure 6.29. shows that unemployment among those with higher education is much higher among youth in MICs than in LICs, suggesting that mismatches between the skills young people have and what the education system offers are greater as countries grow wealthier. A survey among recruitment and temporary work agencies conducted for this report in nine African countries shows that such agencies have a greater struggle to find suitable candidates with tertiary education in South Africa and Tunisia than in countries with much lower incomes such as Kenya, Ghana and even Niger.
Mismatches are not confined to university graduates but also strongly affect young people with secondary education. Figure 6.29. shows that broad unemployment is higher among the young with secondary education than those with tertiary education in LICs and just slightly lower in MICs. Taking into consideration NEET youth, Figure 6.11. showed that NEET rates are highest for youth with secondary education. Given that broad unemployment is much lower among adults with secondary education than among those with primary education or less, mismatches seem to be a serious problem for young people with secondary education. Figure 6.34., which will be presented in the next section, shows that among youth not in employment, those with secondary education have the highest proportion of respondents who provide “lacking employers’ requirements” as the reason for not being in work.
100%
0%
20%
40%
60%
80%
100%
0%
20%
40%
60%
80%
Wage employment Broad Unemployment Vulnerable and under-employment
Figure 6.29. Youth employment and unemployment by education and country income groups
Source: Gallup World Poll (2010), authors' calculations.12http://dx.doi.org/10.1787/888932600811
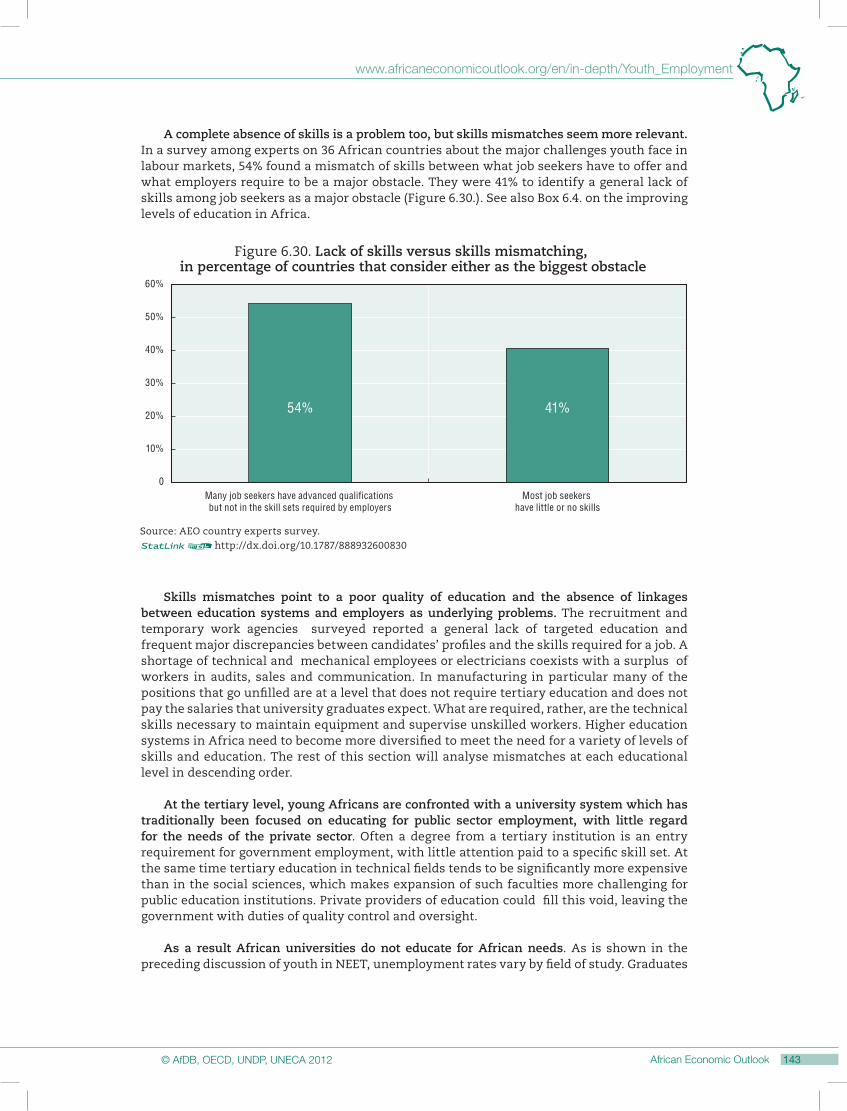
A complete absence of skills is a problem too, but skills mismatches seem more relevant. In a survey among experts on 36 African countries about the major challenges youth face in labour markets, 54% found a mismatch of skills between what job seekers have to offer and what employers require to be a major obstacle. They were 41% to identify a general lack of skills among job seekers as a major obstacle (Figure 6.30.). See also Box 6.4. on the improving levels of education in Africa.
0
10%
20%
30%
40%
50%
60%
54% 41%
Figure 6.30. Lack of skills versus skills mismatching, in percentage of countries that consider either as the biggest obstacle
Source: AEO country experts survey.12http://dx.doi.org/10.1787/888932600830
Many job seekers have advanced qualifications but not in the skill sets required by employers
Most job seekers have little or no skills
Skills mismatches point to a poor quality of education and the absence of linkages between education systems and employers as underlying problems. The recruitment and temporary work agencies surveyed reported a general lack of targeted education and frequent major discrepancies between candidates’ profiles and the skills required for a job. A shortage of technical and mechanical employees or electricians coexists with a surplus of workers in audits, sales and communication. In manufacturing in particular many of the positions that go unfilled are at a level that does not require tertiary education and does not pay the salaries that university graduates expect. What are required, rather, are the technical skills necessary to maintain equipment and supervise unskilled workers. Higher education systems in Africa need to become more diversified to meet the need for a variety of levels of skills and education. The rest of this section will analyse mismatches at each educational level in descending order.
At the tertiary level, young Africans are confronted with a university system which has traditionally been focused on educating for public sector employment, with little regard for the needs of the private sector. Often a degree from a tertiary institution is an entry requirement for government employment, with little attention paid to a specific skill set. At the same time tertiary education in technical fields tends to be significantly more expensive than in the social sciences, which makes expansion of such faculties more challenging for public education institutions. Private providers of education could fill this void, leaving the government with duties of quality control and oversight.
As a result African universities do not educate for African needs. As is shown in the preceding discussion of youth in NEET, unemployment rates vary by field of study. Graduates
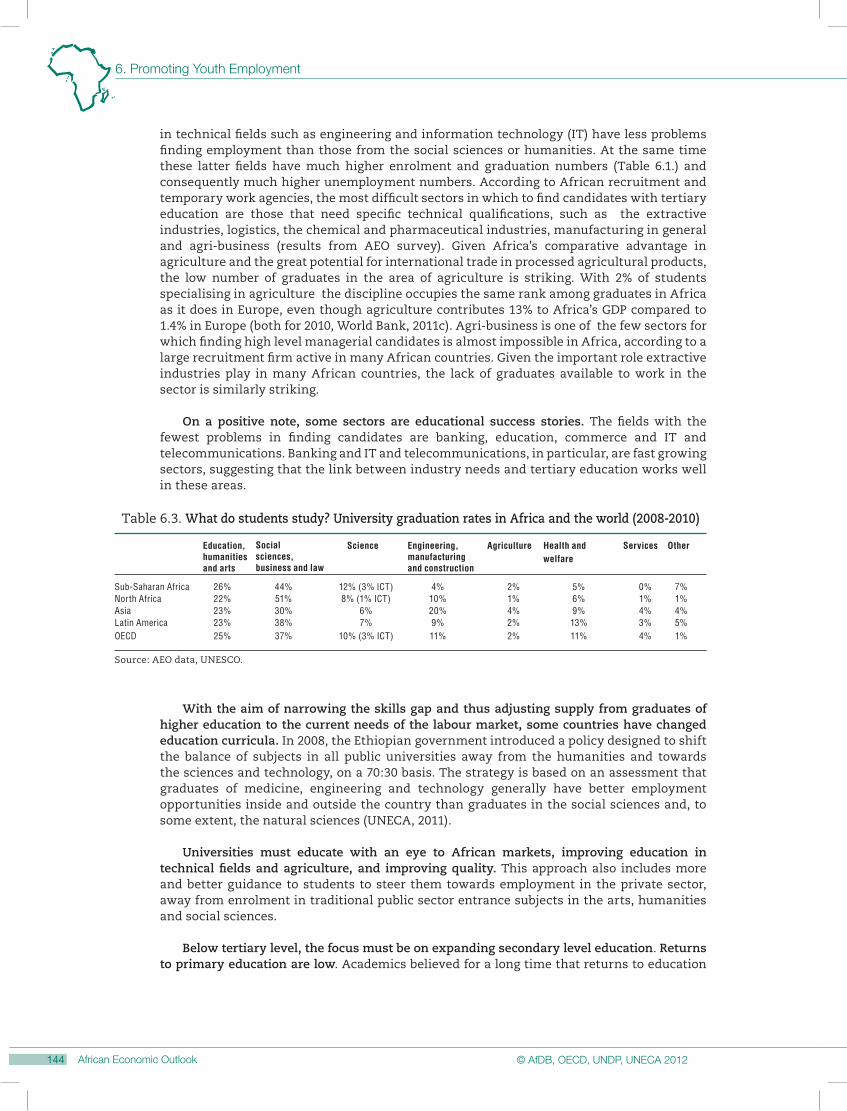
in technical fields such as engineering and information technology (IT) have less problems finding employment than those from the social sciences or humanities. At the same time these latter fields have much higher enrolment and graduation numbers (Table 6.1.) and consequently much higher unemployment numbers. According to African recruitment and temporary work agencies, the most difficult sectors in which to find candidates with tertiary education are those that need specific technical qualifications, such as the extractive industries, logistics, the chemical and pharmaceutical industries, manufacturing in general and agri-business (results from AEO survey). Given Africa’s comparative advantage in agriculture and the great potential for international trade in processed agricultural products, the low number of graduates in the area of agriculture is striking. With 2% of students specialising in agriculture the discipline occupies the same rank among graduates in Africa as it does in Europe, even though agriculture contributes 13% to Africa’s GDP compared to 1.4% in Europe (both for 2010, World Bank, 2011c). Agri-business is one of the few sectors for which finding high level managerial candidates is almost impossible in Africa, according to a large recruitment firm active in many African countries. Given the important role extractive industries play in many African countries, the lack of graduates available to work in the sector is similarly striking.
On a positive note, some sectors are educational success stories. The fields with the fewest problems in finding candidates are banking, education, commerce and IT and telecommunications. Banking and IT and telecommunications, in particular, are fast growing sectors, suggesting that the link between industry needs and tertiary education works well in these areas.
Table 6.3. What do students study? University graduation rates in Africa and the world (2008-2010)
Science Engineering, manufacturing and construction
Agriculture Health and welfare
Services Other
With the aim of narrowing the skills gap and thus adjusting supply from graduates of higher education to the current needs of the labour market, some countries have changed education curricula. In 2008, the Ethiopian government introduced a policy designed to shift the balance of subjects in all public universities away from the humanities and towards the sciences and technology, on a 70:30 basis. The strategy is based on an assessment that graduates of medicine, engineering and technology generally have better employment opportunities inside and outside the country than graduates in the social sciences and, to some extent, the natural sciences (UNECA, 2011).
Universities must educate with an eye to African markets, improving education in technical fields and agriculture, and improving quality. This approach also includes more and better guidance to students to steer them towards employment in the private sector, away from enrolment in traditional public sector entrance subjects in the arts, humanities and social sciences.
Below tertiary level, the focus must be on expanding secondary level education. Returns to primary education are low. Academics believed for a long time that returns to education
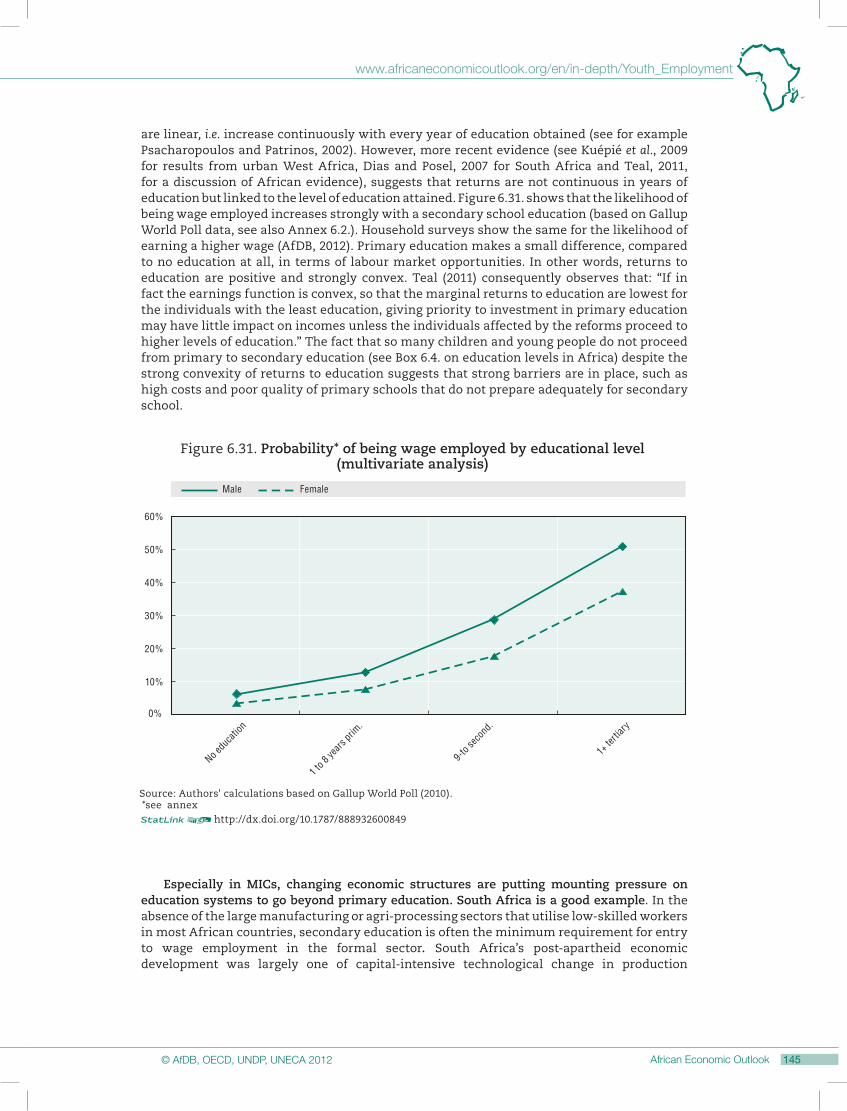
are linear, i.e. increase continuously with every year of education obtained (see for example Psacharopoulos and Patrinos, 2002). However, more recent evidence (see Kuépié et al., 2009 for results from urban West Africa, Dias and Posel, 2007 for South Africa and Teal, 2011, for a discussion of African evidence), suggests that returns are not continuous in years of education but linked to the level of education attained. Figure 6.31. shows that the likelihood of being wage employed increases strongly with a secondary school education (based on Gallup World Poll data, see also Annex 6.2.). Household surveys show the same for the likelihood of earning a higher wage (AfDB, 2012). Primary education makes a small difference, compared to no education at all, in terms of labour market opportunities. In other words, returns to education are positive and strongly convex. Teal (2011) consequently observes that: “If in fact the earnings function is convex, so that the marginal returns to education are lowest for the individuals with the least education, giving priority to investment in primary education may have little impact on incomes unless the individuals affected by the reforms proceed to higher levels of education.” The fact that so many children and young people do not proceed from primary to secondary education (see Box 6.4. on education levels in Africa) despite the strong convexity of returns to education suggests that strong barriers are in place, such as high costs and poor quality of primary schools that do not prepare adequately for secondary school.
0%
10%
20%
30%
40%
50%
60%
Male Female
Source: Authors' calculations based on Gallup World Poll (2010). *see annex12http://dx.doi.org/10.1787/888932600849
No edu
catio
n
1 to 8
years
prim
.
1+ te
rtiary
9-to se
cond
.
Figure 6.31. Probability* of being wage employed by educational level(multivariate analysis)
Especially in MICs, changing economic structures are putting mounting pressure on education systems to go beyond primary education. South Africa is a good example. In the absence of the large manufacturing or agri-processing sectors that utilise low-skilled workers in most African countries, secondary education is often the minimum requirement for entry to wage employment in the formal sector. South Africa’s post-apartheid economic development was largely one of capital-intensive technological change in production
methods and a shift towards skill-intensive services (banking, telecommunications) away from the low-skilled manufacturing which had previously been the employer of large parts of the labour force. The shift has led to stronger demand for skilled labour and less demand for unskilled labour16 (Bhorat and Hodge, 1999; Dias and Posel 2007; Banerjee et al. (2008); Fourie, 2011; Rodrik, 2006). Rodrik observes that “this structural change away from the most low-skills intensive parts – and resultant skills supply-and demand mismatches – is key to understanding the concentration of unemployment among the young, unskilled and black population.” Given these dramatic changes and the move of the economy towards equilibrium with demand for higher skills, the only chance for South Africa’s youth is a concerted effort in investing in better education. Africa is making progress with the provision of education but serious quality gaps remain (Box 6.9.).
Box 6.9. Education levels in Africa and the world
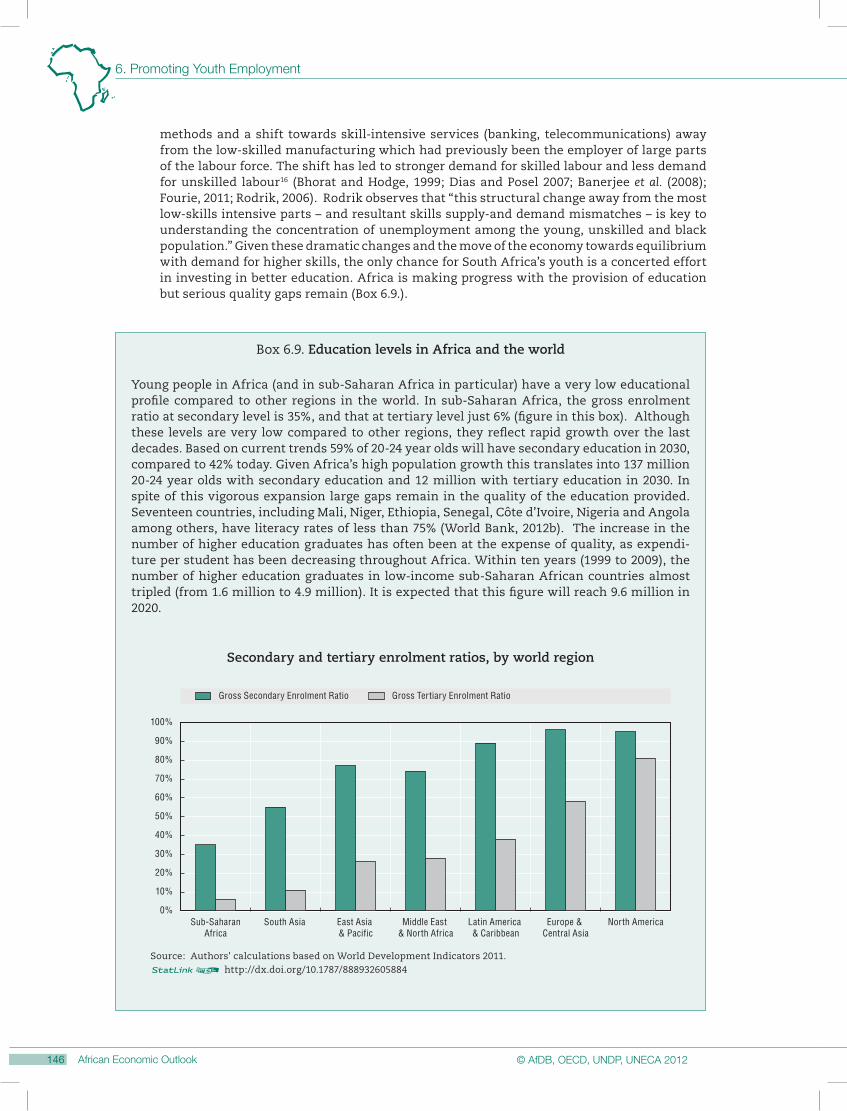
Young people in Africa (and in sub-Saharan Africa in particular) have a very low educational profile compared to other regions in the world. In sub-Saharan Africa, the gross enrolment ratio at secondary level is 35%, and that at tertiary level just 6% (figure in this box). Although these levels are very low compared to other regions, they reflect rapid growth over the last decades. Based on current trends 59% of 20-24 year olds will have secondary education in 2030, compared to 42% today. Given Africa’s high population growth this translates into 137 million 20-24 year olds with secondary education and 12 million with tertiary education in 2030. In spite of this vigorous expansion large gaps remain in the quality of the education provided. Seventeen countries, including Mali, Niger, Ethiopia, Senegal, Côte d’Ivoire, Nigeria and Angola among others, have literacy rates of less than 75% (World Bank, 2012b). The increase in the number of higher education graduates has often been at the expense of quality, as expendi-ture per student has been decreasing throughout Africa. Within ten years (1999 to 2009), the number of higher education graduates in low-income sub-Saharan African countries almost tripled (from 1.6 million to 4.9 million). It is expected that this figure will reach 9.6 million in 2020.
0%
10%
20%
30%
40%
50%
60%
70%
80%
90%
100%
Gross Secondary Enrolment Ratio Gross Tertiary Enrolment Ratio
Source: Authors' calculations based on World Development Indicators 2011.12 http://dx.doi.org/10.1787/888932605884
South Asia North America
Secondary and tertiary enrolment ratios, by world region
Expansion is not enough. Quality and relevance of education must be improved to reduce the skills mismatch. The previous analysis has shown that the level of broad unemployment is especially high at secondary level, suggesting serious skills mismatches. Most general secondary education in Africa has long followed the ideal of providing the prerequisites for an academic education or a white collar (office) job in the formal (and urban) sector. Yet, as earlier sections have shown, only a small minority of young people have access to either of these options. Moreover, the skill set many formal employers are looking for is a more practical and applied one than that provided in most schools, including behavioural and interpersonal skills, as well as basic familiarity with concepts relevant to business.
Technical and vocational skills development (TVSD) has the potential to provide young people with more applied skills and better chances in the labour market. Skills can be obtained either through structured and specialised institutions or through on-the-job practical experience, or both – the so-called “dual” training. In a review of training programmes in 90 countries Fares and Puerto (2009) find that programmes that combine on-the-job and in-class training provide a combination of soft skills (behavioural skills) and hard skills (technical or administrative skills) that can have a significant positive impact on employment and earnings of programme participants. Dual training, such as internships or apprenticeships, allows young people to apply the theories learnt in class in real environments, to develop professional skills, such as time management and professionalism, and to gain practical experience (Angel-Urdinola et al., 2010). Our analysis of labour force surveys and household surveys finds higher marginal returns for vocational training than general secondary education in five out of eight countries (see Annex 2). Kuépié et al. (2009) show that returns to vocational education are higher than to general secondary education in urban West Africa.
However, TVSD provided by government has suffered from neglect and irrelevance. TVSD accounts for less than 5% of training among youth in Africa (AEO, 2008). Where they exist, TVSD systems in Africa suffer from a shortage of qualified staff, obsolete equipment, ill-adapted programmes and weak links with the job market.
Instead traditional apprenticeship in the informal sector predominates. For instance, in Senegal some 400 000 young people are in apprenticeship annually, compared to some 7 000 graduates from the formal vocational training centres; and up to 80% of skill development in Ghana is through the apprentice system (AEO, 2008). In urban informal sectors in West Africa apprenticeships in small (informal) firms and on-the-job learning account for over 90% of the training of young workers (Nordman and Pasquier-Doumer, 2011). The informal sector is also an important beneficiary of skills training. Kuépié et al. (2009) show that returns to vocational training are highest in the informal sector, emphasising the importance of practical skills for this sector.
Given the importance of the informal sector, TVSD systems must adapt to its needs in terms of skills and course structure, especially in rural areas. In view of the very large informal sector in African labour markets, vocational training should emphasise the qualification of workers in this sector. But the provision of public TVSD has often been inadequate as courses are rigid, and it is biased toward white collar jobs in the urban wage sector (Adams, 2008). Unresponsive TVSD is a particular challenge in rural areas, where this form of education could have significant impact on the lives of the poor by enhancing agricultural skills and productivity. Research undertaken in Tanzania in 2011 showed that of 23 vocational training centres in rural areas directly managed and financed by the Vocational Education and Training Authority, only three were offering training connected with the agricultural sector. In most African countries the situation is even more extreme, as in Malawi, where no agricultural training is provided in vocational centres (Dalla Valle, 2012). A recent World Bank report finds similar problems in Uganda, where government-provided vocational training does
not reach young people in the rural non-farm economy because it is too focused on formal post-secondary training, offering courses of long duration, which people in informal sector enterprises cannot attend without losing their source of livelihood (Bakiene et al., 2012).
Instead of excluding informal sector training, governments should address poor identification of job seekers by introducing skills certification systems that attest to competencies and thereby facilitate recognition and comparison in the labour market, reducing asymmetric information between job seekers and employers (AEO, 2008, World Bank, 2010). Certification and recognition contribute to building an employment history which will favour access to better employment opportunities in formal sector jobs. Benin, for example, created a Vocational Skill Certificate (national diploma attesting to the attainment of skilled worker level through a reformed traditional apprenticeship) and the Occupational Skill Certificate (certificate attesting to the completion of an apprenticeship) to recognise the skills acquired through informal apprenticeships. It has also put in place a consultative mechanism involving the National Federation of Craftworkers, local craft workers groups and the relevant ministry to steer the process (AEO, 2008).
To be successful TVSD systems need a clear vision of the desired outcome and have to be focused on sectors with promising employment prospects. In many African countries responsibilities for TVSD are scattered across a large range of ministries and agencies and are not integrated with the overall education system. In Egypt for example TVSD centres are run by a wide range of 22 ministries and agencies, depending on the field of specialisation of the respective centre (AEO, 2008, country note Egypt). In addition two ministries deal with education-related issues, namely the ministry of education and the ministry of higher education, and are also involved in developing TVSD specific policies and frameworks. In recognition of the need for coherence the Supreme Council for Human Resource Development was established in 2000. However, coherence continues to be work in progress. Effective TVSD systems must provide the economy with the skills it needs. In South Africa the sector education training authorities (SETAs), set up by the 1998 National Development Act, aim to identify the skill needs of industrial sectors (including skill shortages and gaps), as well as constraints on the effective utilisation of skills in relation to the objectives of the national skills development strategy. All training initiatives in the enterprises are competency-based, depending on the specific competences required by the world of work (AEO, 2008).
African countries should strengthen partnerships with the private sector at all levels of education. The 2008 edition of the AEO showed that a deeper involvement of employers in the provision of in-service training has significant potential to increase the relevance as well as the cost-effectiveness of training systems. Close co-ordination with the private sector ensures that TVSD systems are aligned with the skills needs of the labour market. Partnerships with industry help accurately define the qualifications for each trade and the content of relevant occupational standards. Moreover, programmes offered by the private sector, such as on-the-job training or internships, allow both firms and workers to obtain information on the other side of the market and eliminate constraints on information asymmetry problems, such as the unidentified quality of workers from the employers’ side, and unknown sorts of skills required from the workers’ side (Attanasio et al., 2009).
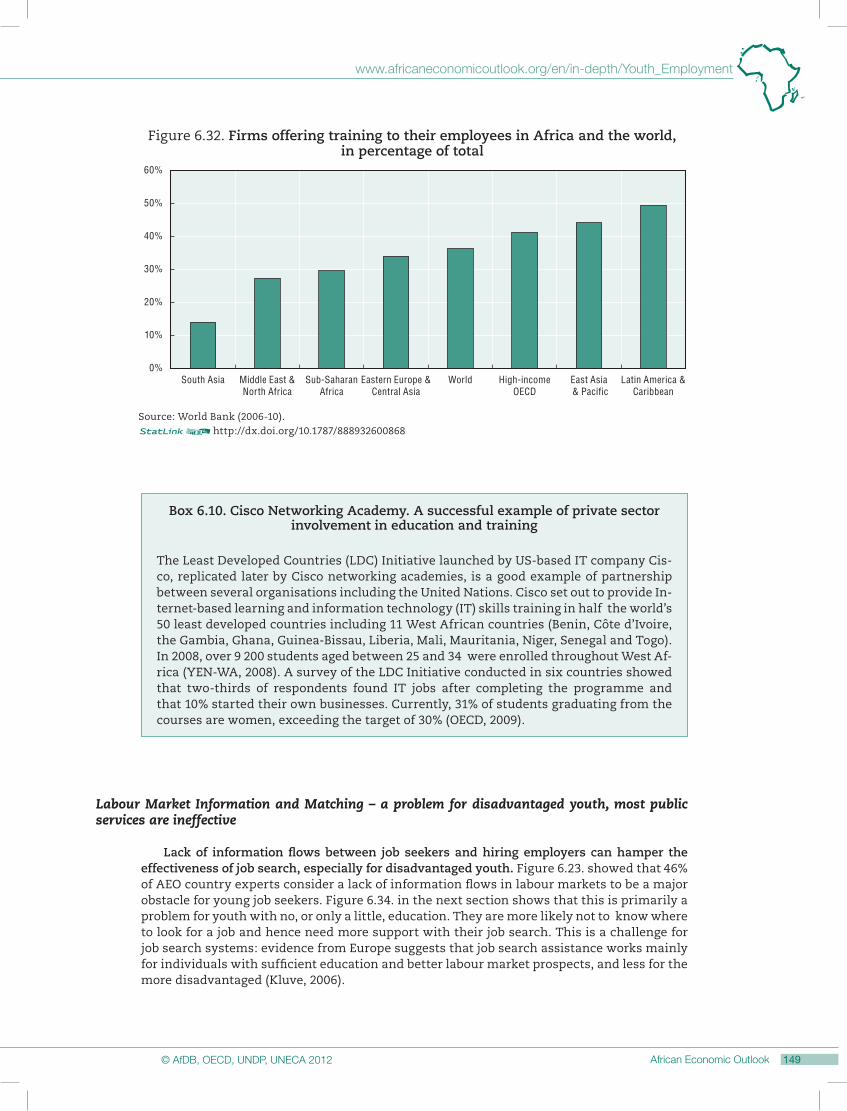
Africa trails other regions of the world in the proportion of enterprises offering training to their employees. Figure 6.32. shows that fewer than a third of formal firms in sub-Saharan Africa and the Middle East-North Africa (MENA) region offer training programmes for their permanent employees. Although this analysis is not restricted to young people, it shows that there is room for improvement in the involvement of firms in training and education. Both enterprises and governments must strive for closer co-operation and a stronger involvement of firms in the education of young people. Box 6.5. presents a successful example of training provision for young people in Africa by a large multinational company.
Source: World Bank (2006-10).12http://dx.doi.org/10.1787/888932600868
South Asia Middle East &North Africa
Sub-SaharanAfrica
Eastern Europe &Central Asia
World High-incomeOECD
East Asia & Pacific
Latin America &Caribbean
Figure 6.32. Firms offering training to their employees in Africa and the world,in percentage of total
Box 6.10. Cisco Networking Academy. A successful example of private sector involvement in education and training
The Least Developed Countries (LDC) Initiative launched by US-based IT company Cis-co, replicated later by Cisco networking academies, is a good example of partnership between several organisations including the United Nations. Cisco set out to provide In-ternet-based learning and information technology (IT) skills training in half the world’s 50 least developed countries including 11 West African countries (Benin, Côte d’Ivoire, the Gambia, Ghana, Guinea-Bissau, Liberia, Mali, Mauritania, Niger, Senegal and Togo). In 2008, over 9 200 students aged between 25 and 34 were enrolled throughout West Af-rica (YEN-WA, 2008). A survey of the LDC Initiative conducted in six countries showed that two-thirds of respondents found IT jobs after completing the programme and that 10% started their own businesses. Currently, 31% of students graduating from the courses are women, exceeding the target of 30% (OECD, 2009).
Labour Market Information and Matching – a problem for disadvantaged youth, most public services are ineffective
Lack of information flows between job seekers and hiring employers can hamper the effectiveness of job search, especially for disadvantaged youth. Figure 6.23. showed that 46% of AEO country experts consider a lack of information flows in labour markets to be a major obstacle for young job seekers. Figure 6.34. in the next section shows that this is primarily a problem for youth with no, or only a little, education. They are more likely not to know where to look for a job and hence need more support with their job search. This is a challenge for job search systems: evidence from Europe suggests that job search assistance works mainly for individuals with sufficient education and better labour market prospects, and less for the more disadvantaged (Kluve, 2006).
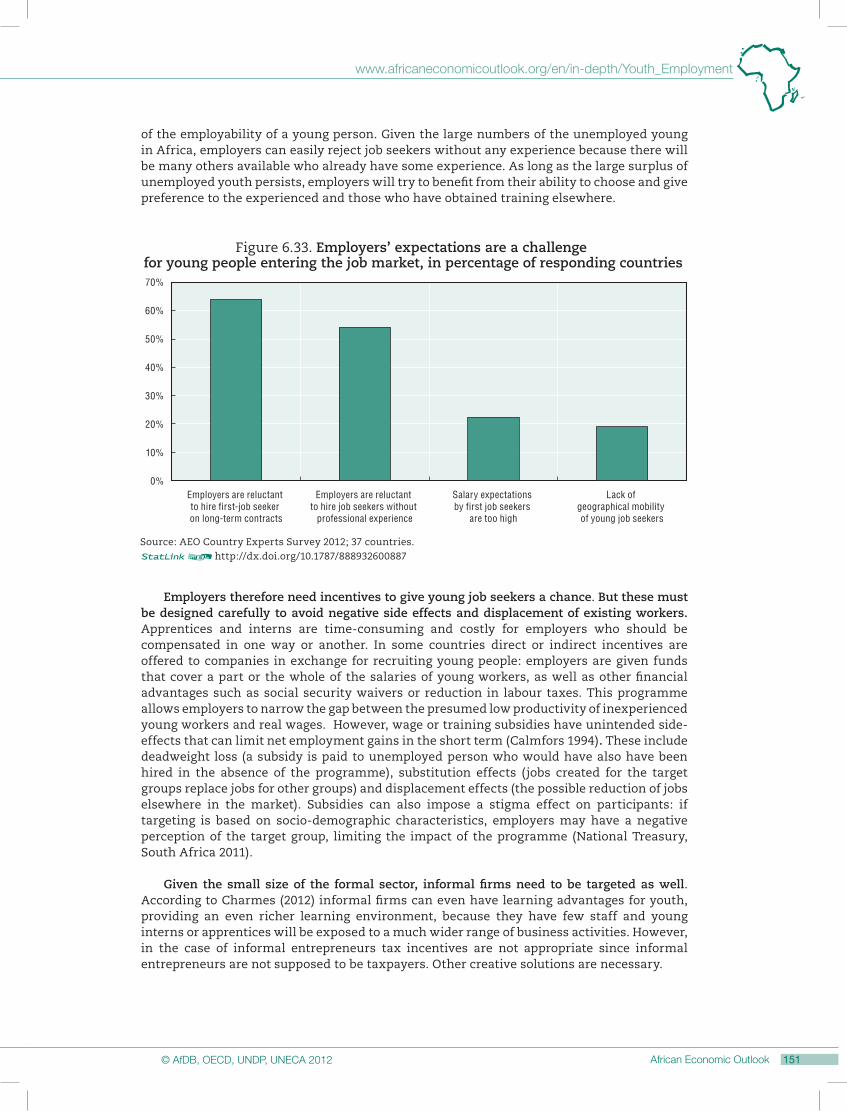
Young people themselves do not see knowledge about where to find jobs as a major problem. In North Africa young people do not seem to consider knowledge about job opportunities to be a serious constraint. In Figure 6.33. it is ranked below many other problems that are considered to be bigger obstacles for young job seekers. In many countries, it is mainly through informal placement methods – typically through family and friends – that a young person finds work. In Algeria for example, access to jobs is linked to personal or family relations at a proportion of 41 % (AEO 2012 Algeria country note).
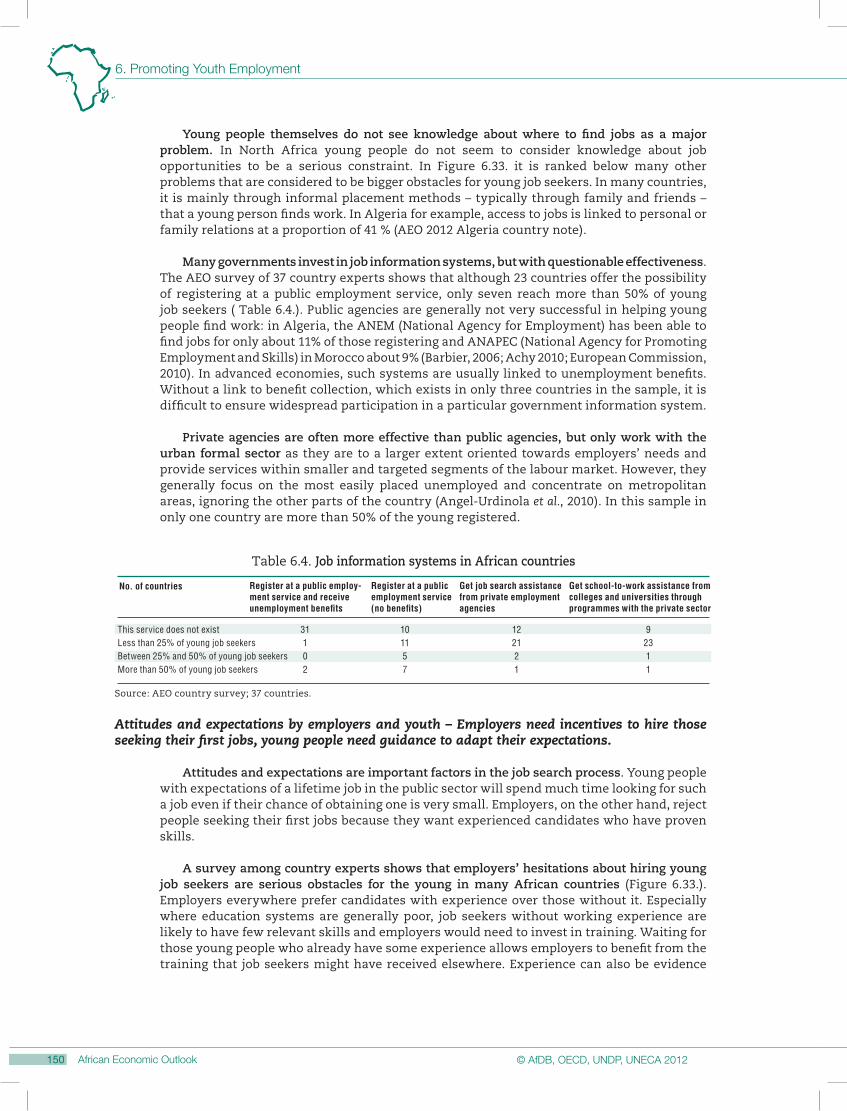
Many governments invest in job information systems, but with questionable effectiveness. The AEO survey of 37 country experts shows that although 23 countries offer the possibility of registering at a public employment service, only seven reach more than 50% of young job seekers ( Table 6.4.). Public agencies are generally not very successful in helping young people find work: in Algeria, the ANEM (National Agency for Employment) has been able to find jobs for only about 11% of those registering and ANAPEC (National Agency for Promoting Employment and Skills) in Morocco about 9% (Barbier, 2006; Achy 2010; European Commission, 2010). In advanced economies, such systems are usually linked to unemployment benefits. Without a link to benefit collection, which exists in only three countries in the sample, it is difficult to ensure widespread participation in a particular government information system.
Private agencies are often more effective than public agencies, but only work with the urban formal sector as they are to a larger extent oriented towards employers’ needs and provide services within smaller and targeted segments of the labour market. However, they generally focus on the most easily placed unemployed and concentrate on metropolitan areas, ignoring the other parts of the country (Angel-Urdinola et al., 2010). In this sample in only one country are more than 50% of the young registered.
Source: AEO country survey; 37 countries.
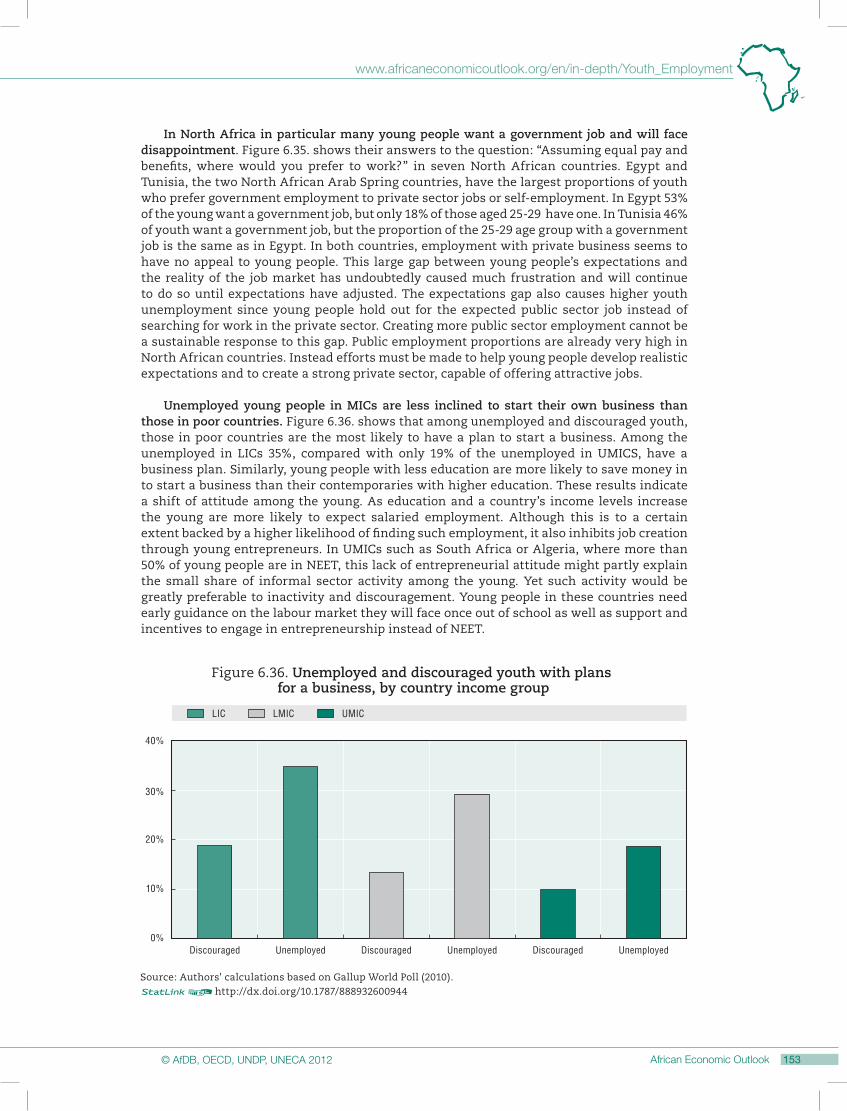
Table 6.4. Job information systems in African countries
This service does not exist 31 10 12 9 Less than 25% of young job seekers 1 11 21 23 Between 25% and 50% of young job seekers 0 5 2 1 More than 50% of young job seekers 2 7 1 1
No. of countries Register at a public employ-ment service and receive unemployment benefits
Register at a public employment service (no benefits)
Get job search assistance from private employment agencies
Get school-to-work assistance from colleges and universities through programmes with the private sector
Attitudes and expectations by employers and youth – Employers need incentives to hire those seeking their first jobs, young people need guidance to adapt their expectations.
Attitudes and expectations are important factors in the job search process. Young people with expectations of a lifetime job in the public sector will spend much time looking for such a job even if their chance of obtaining one is very small. Employers, on the other hand, reject people seeking their first jobs because they want experienced candidates who have proven skills.
A survey among country experts shows that employers’ hesitations about hiring young job seekers are serious obstacles for the young in many African countries (Figure 6.33.). Employers everywhere prefer candidates with experience over those without it. Especially where education systems are generally poor, job seekers without working experience are likely to have few relevant skills and employers would need to invest in training. Waiting for those young people who already have some experience allows employers to benefit from the training that job seekers might have received elsewhere. Experience can also be evidence
of the employability of a young person. Given the large numbers of the unemployed young in Africa, employers can easily reject job seekers without any experience because there will be many others available who already have some experience. As long as the large surplus of unemployed youth persists, employers will try to benefit from their ability to choose and give preference to the experienced and those who have obtained training elsewhere.
0%
10%
20%
30%
40%
50%
60%
70%
Figure 6.33. Employers’ expectations are a challenge for young people entering the job market, in percentage of responding countries
Employers are reluctant to hire first-job seeker on long-term contracts
Employers are reluctant to hire job seekers without
professional experience
Salary expectations by first job seekers
are too high
Lack of geographical mobility of young job seekers
Source: AEO Country Experts Survey 2012; 37 countries.12http://dx.doi.org/10.1787/888932600887
Employers therefore need incentives to give young job seekers a chance. But these must be designed carefully to avoid negative side effects and displacement of existing workers. Apprentices and interns are time-consuming and costly for employers who should be compensated in one way or another. In some countries direct or indirect incentives are offered to companies in exchange for recruiting young people: employers are given funds that cover a part or the whole of the salaries of young workers, as well as other financial advantages such as social security waivers or reduction in labour taxes. This programme allows employers to narrow the gap between the presumed low productivity of inexperienced young workers and real wages. However, wage or training subsidies have unintended side-effects that can limit net employment gains in the short term (Calmfors 1994). These include deadweight loss (a subsidy is paid to unemployed person who would have also have been hired in the absence of the programme), substitution effects (jobs created for the target groups replace jobs for other groups) and displacement effects (the possible reduction of jobs elsewhere in the market). Subsidies can also impose a stigma effect on participants: if targeting is based on socio-demographic characteristics, employers may have a negative perception of the target group, limiting the impact of the programme (National Treasury, South Africa 2011).
Given the small size of the formal sector, informal firms need to be targeted as well. According to Charmes (2012) informal firms can even have learning advantages for youth, providing an even richer learning environment, because they have few staff and young interns or apprentices will be exposed to a much wider range of business activities. However, in the case of informal entrepreneurs tax incentives are not appropriate since informal entrepreneurs are not supposed to be taxpayers. Other creative solutions are necessary.
No formal education 1 to 8 years primary 9 to full secondary 1+ tertiary
Figure 6.34. Unemployed and discouraged youth: Self-reported reasons for not working
Source: Authors' calculations based on Gallup World Poll (2010).12http://dx.doi.org/10.1787/888932600906
Believe no suitable work available
(in an area relevant to ones' skills/capacities)
Lack employers' requirements
(qualifications, training,
experience, age, etc.)
Cannot find suitable work
Don't know how or where to seek work
I am unemployed Other (Do not list)
Many young Africans have expectations that do not match the realities of the labour markets they face. Young people with higher education, in particular, are often unwilling to take jobs that do not fit their profile and may well offer lower pay or less job security than they expect. Figure 6.34. shows that among unemployed and discouraged youth with at least one year of tertiary education 25% report not being able to find work that suits their skills and capacities. For young people without education this share is only 8%. Along similar lines, De Vreyer and Roubaud (2012) find that in the early 2000s in West Africa 82% of jobs created were in the informal sector, but only 48% of the young wanted informal sector jobs. The public sector, which created virtually no jobs in the two years preceding the survey (fewer than 4% of new jobs), was still the target of 27% of young people’s aspirations.
0% 20% 40% 60% 80% 100%
Government Private business Nonprofit organizationSelf-employment
Figure 6.35. Where do you want to work, assuming equal pay and benefits?
Morocco Youth
Algeria Youth
Sudan Youth
Mauritania Youth
Djibouti Youth
Tunisia Youth
Egypt Youth
Source: Silatech (2009), based on Gallup World Poll data.12http://dx.doi.org/10.1787/888932600925
In North Africa in particular many young people want a government job and will face disappointment. Figure 6.35. shows their answers to the question: “Assuming equal pay and benefits, where would you prefer to work?” in seven North African countries. Egypt and Tunisia, the two North African Arab Spring countries, have the largest proportions of youth who prefer government employment to private sector jobs or self-employment. In Egypt 53% of the young want a government job, but only 18% of those aged 25-29 have one. In Tunisia 46% of youth want a government job, but the proportion of the 25-29 age group with a government job is the same as in Egypt. In both countries, employment with private business seems to have no appeal to young people. This large gap between young people’s expectations and the reality of the job market has undoubtedly caused much frustration and will continue to do so until expectations have adjusted. The expectations gap also causes higher youth unemployment since young people hold out for the expected public sector job instead of searching for work in the private sector. Creating more public sector employment cannot be a sustainable response to this gap. Public employment proportions are already very high in North African countries. Instead efforts must be made to help young people develop realistic expectations and to create a strong private sector, capable of offering attractive jobs.
Unemployed young people in MICs are less inclined to start their own business than those in poor countries. Figure 6.36. shows that among unemployed and discouraged youth, those in poor countries are the most likely to have a plan to start a business. Among the unemployed in LICs 35%, compared with only 19% of the unemployed in UMICS, have a business plan. Similarly, young people with less education are more likely to save money in to start a business than their contemporaries with higher education. These results indicate a shift of attitude among the young. As education and a country’s income levels increase the young are more likely to expect salaried employment. Although this is to a certain extent backed by a higher likelihood of finding such employment, it also inhibits job creation through young entrepreneurs. In UMICs such as South Africa or Algeria, where more than 50% of young people are in NEET, this lack of entrepreneurial attitude might partly explain the small share of informal sector activity among the young. Yet such activity would be greatly preferable to inactivity and discouragement. Young people in these countries need early guidance on the labour market they will face once out of school as well as support and incentives to engage in entrepreneurship instead of NEET.
0%
30%
40%
10%
20%
LIC LMIC UMIC
Source: Authors' calculations based on Gallup World Poll (2010).12http://dx.doi.org/10.1787/888932600944
Figure 6.36. Unemployed and discouraged youth with plans for a business, by country income group
Labour market regulation – The young need rules that make employing young people attractive
Young people need labour market regulations that ensure, as far as possible, that work is decent but at the same time do not inhibit labour market turnover and do not create dual labour markets with a well protected segment of older incumbents and a less protected segment of youth who would have to bear the full brunt of any adjustments. The country survey finds that severance pay provisions are the major type of employment protection with negative impact on youth employment. In developing countries, employment protection rules are often a low-cost alternative to providing social insurance to workers. Decoupling social protection from employment status would thus be an important step that could help with labour market flexibility and protection of vulnerable youth at the same time. Individual unemployment saving accounts (IUSAs) can provide a useful building block in such a strategy. In addition, young people need more flexible labour regulations which allow for internships and shorter term contracts for young people to help them obtain their first working experience and prove their employability.
Both African enterprises and AEO country experts consider labour regulations to be far down a long list of more important obstacles to youth employment (Figure 6.34. and Figure 6.37.). This is not because labour regulations in Africa are very youth friendly but because enforcement is often low and other problems are more pressing. In fact, World Bank Doing Business (2012a) data, which are based on assessments of labour regulations as they are stipulated in national law, rather than their implementation in practice, shows labour regulations in Africa to be the most rigid in the world. The average rigidity of employment of sub-Saharan African labour regulation in 2008 was 47.1, compared to 35.8 in North Africa; 23.0 in East Asia and 31.7 in Latin America (Fox and Sekkel, 2006). According to enterprise survey data, which are based on responses by firms based on their day-to-day experience, on the other hand, only 1% of firms in sub-Saharan Africa consider labour regulations to be their most important obstacle, compared to 8% in Latin America, the region with the highest value. Among African countries, those with higher income are more likely to rate labour regulations as an important obstacle than poorer countries, suggesting that governments have stronger implementation capacity but also that other constituencies, such as organised labour gain in strength (Gelb et al., 2007a).
Nevertheless, overly rigid labour regulations exercise a burden on youth. Although the evidence is mixed as to whether employment protection legislation (EPL) has a negative impact on total employment, the link between stricter EPL and negative outcomes for youth has been more clearly established. International experience shows that EPL can push employment from the formal to the informal sector and reduce turnover, thereby limiting opportunities for new entrants, i.e. young people (Box 6.11.). Furthermore, even though de jure labour regulations might have little practical meaning in many poor countries because of low enforcement capacity on the part of the government and a large informal sector, they may still discourage investors. Foreign investors with limited knowledge of the local context in particular might be deterred by seemingly strict labour regulations that could increase operating costs if enforced.
In North African countries labour regulations are particularly rigid. Morocco (132nd) and Egypt (141st) rank amongst the countries with the least efficient labour markets according to the World Economic Forum’s Global Competitiveness Index (GCI) of 142 countries. The rules in these countries are so strict that they have a doubly negative impact on young job seekers. On the one hand, employers are reluctant to employ youth in permanent positions because of very high job protection and dismissal costs. On the other hand, the rules make it very difficult to set up internships or short-term contracts which would help graduates to acquire valuable skills for the market place while allowing companies to test the employees
over a fixed period before making a longer-term hiring decision (World Economic Forum, Arab World Competitiveness Report 2011/12). Both sets of rules need urgent reform. Establishing new rules for internships and short-term contracts only, without also easing the protection requirements on existing contracts, could easily lead to the creation of a dual labour market where the brunt of adjustment will always be felt by the unprotected workers, who are often the young (Box 6.11.).
Box 6.11. Effects of employment protection legislation around the world
Fears that EPL might significantly lower aggregate employment have not materialised, according to the available evidence, although there are notable differences from country to country. The assessment of evi-dence for OECD countries (OECD, 2006) concludes that the effect of EPL on overall unemployment is probably small. Studies of its impact on total employment find negative effects in some countries and none at all in others. Much of the evidence comes from Latin America, which tends to have both more costly job security provisions (Heckman and Pagés, 2000) and more available data. Even within Latin American economies, the evidence is mixed (Freeman, 2009): there are sizeable effects on unemployment in Colombia, but not in Chile, while findings from cross-country analysis do not always coincide with those from time-series or panel studies (see Kucera and Xenogiani, 2009). This suggests that measures of job protection legislation and its cost taken across countries tend to hide important differences in implementation.
On the other hand, there are also cautionary tales of employment protection that is overly restrictive or increases costs while offering only limited benefits. The inference is that the quality and details of employ-ment protection legislation matter. In stark contrast with the modest aggregate effects observed in Latin American studies, research in India not only finds that pro-worker employment legislation shifts workers and output from the formal to informal sector (Besley and Burgess, 2003), but that pro-worker legislation brings workers no gains. Similarly, Kucera and Xenogiani (2009) interpret findings that link the regulatory burden to the size of the informal economy as representing how labour is regulated (especially through firm entry) rather than how much it is regulated. The effects of labour regulation on employment outcomes also depend on enforcement, which is typically imperfect. Increased enforcement efforts in the case of Brazil led to lower rates of informality but also to more unemployment and smaller firms (Almeida and Carneiro, 2009). In Indonesia during the 1990s, increased compliance with minimum wages was the key pathway to increased pay in the textile, footwear and apparel industry (Harrison and Scorse, 2010).
EPL may have a larger effect on youth employment in another respect, insofar as it limits turnover in the la-bour market and therefore creates barriers for new entrants. Studies of changes in EPL for Chile and Colom-bia do find that weaker EPL is associated with declines in job tenure, higher separation rates, and increased hiring in the formal sector (Freeman, 2009). Using a firm-level dataset for a set of 16 industrialised and developing countries, Haltiwanger et al. (2008) find that, although industry and firm size account for a large share of gross job flows, labour regulations are associated with lower job flows. If labour legislation reduces the ability of firms to adjust their workforce accordingly, particularly in downturns, it may have effects on aggregate performance.
Lower gross flows may raise youth unemployment by increasing the time new entrants need to find a job. This may only be a transitional difficulty for many young people, but those who remain unemployed for long periods may develop disadvantages that will affect them permanently throughout their careers. One answer to such challenges is the creation of specific non-standard employment contracts (with limited protection) for the young. However, experience suggests that such fixes, albeit effective, can create a trap which leads to those eligible remaining caught in fixed-term contracts with relatively little prospect of upgrading human capital. From a general standpoint, this leads to dual labour markets – although in quite a different form from the divide between formal and informal employment – which can seriously harm social cohesion. If labour regulations generate two-speed labour markets, the brunt of adjustment is felt mostly in the more flexible part of the market, usually the most unprotected one. Informal workers, and those with little job security, therefore feel all the more insecure.
AEO country experts, asked about a range of labour regulation elements, identified high dismissal costs as the most important obstacle to youth in African labour markets. High firing costs, usually in the form of regulations of severance pay, can discourage employers from hiring young workers, especially in a risky business environment when it is difficult for firms to predict staffing needs. In many countries with no or very few unemployment benefits, severance pay is the only safety net provision that exists, leading to strong pressure from labour constituencies to keep it generous.17 The widespread lack of safety nets in many African countries might thus be contributing to forms of employment protection that discourage job creation and impact negatively on youth by imposing high firing costs on employers. Indeed, employment protection rules have often been considered a low-cost way of providing social insurance to workers in developing economies with high shares of informal employment. (Heckman and Pagés, 2004; OECD, 2011). As a result, much employment is shifted to the informal sector, where labour regulation does not apply. At the same time, the high share of informal employment and unemployment results in a small tax base and insufficient resources to establish universal social protection.
Decoupling social protection from employment status can help with labour market flexibility and protection of vulnerable youth at the same time. Decoupling social protection from employment status and shifting the cost burden of social protection away from employment could help to break this cycle of imposing high costs of social protection on employers, which limits labour market flexibility and leads to a large informal sector that does not contribute to social protection systems. Decoupling employment and protection would also make it possible to extend social protection to informal workers and youth in inactivity, thereby providing disadvantaged young people and the working poor with essential support and increasing labour market flexibility. Individual unemployment saving accounts (IUSAs) can provide a useful building block of such a strategy (Robalino et al., 2009).
0%
5%
10%
15%
20%
25%
30%
Source: AEO Country Experts Survey 2012; 37 countries.12http://dx.doi.org/10.1787/888932600963
Firing costs are too high, deterring employers
from hiring inexperienced job seekers
Payroll taxes and other fees increase the cost of labour and
discourage employers from hiring
Enforcement of contracts
is unpredictable and unreliable creating
uncertainty of labour costsfor employers.
Hiring regulations are too constraining, deterring employers
from hiring
Minimum wage set by law or collective
agreements make hiring young job seekers
unattractive for employers
Figure 6.37. AEO country experts’ rating of labour regulations as obstacles to youth employment, in percentage of responding countries