Introduction 2 Small Area Deprivation 5 Area Summaries – Local Authority Districts 9 Income Deprivation and Employment Deprivation 17 Area Summary Case Study – London 20 Accompanying Tables, Reports and Resources 21 Technical Notes 25 Statistical Release 26 September 2019 About this release: • This release updates the English Indices of Deprivation 2015 • The English Indices of Deprivation measure relative levels of deprivation in 32,844 small areas or neighbourhoods, called Lower-layer Super Output Areas, in England • The data indicators used to construct the IoD2019 are based on the most up-to-date information available Key findings: • Overall, 88 per cent of neighbourhoods that are in the most deprived decile according to the Index of Multiple Deprivation 2019 (IMD2019) were also the most deprived according to the IMD2015 • Deprivation is dispersed across England. 61 per cent of local authority districts contain at least one of the most deprived neighbourhoods in England • Middlesbrough, Liverpool, Knowsley, Kingston upon Hull and Manchester are the local authorities with the highest proportions of neighbourhoods among the most deprived in England. This is largely unchanged from the IMD2015 • Many London Boroughs have seen a reduction in the proportions of their neighbourhoods that are highly deprived from the IMD2015 • Seven of the 10 local authority districts with the highest levels of income deprivation among older people are in London – this is unchanged from the IMD2015 • Middlesbrough and Blackpool rank as the most deprived districts regarding income deprivation among children Responsible Statistician: Bowie Penney Statistical enquiries: office hours: 0303 444 0033 indices.deprivation@communities. gov.uk Media Enquiries: 0303 444 1209 [email protected]The English Indices of Deprivation 2019 (IoD2019)
Transcript
Introduction 2
Small Area Deprivation 5
Area Summaries –
Local Authority Districts
9
Income Deprivation and
Employment
Deprivation
17
Area Summary Case
Study – London
20
Accompanying Tables,
Reports and Resources
21
Technical Notes
25
Statistical Release 26 September 2019
u
s
i
n
g
R
e
s
e
a
r
c
h
S
u
m
m
a
About this release:
• This release updates the English Indices of Deprivation 2015
• The English Indices of Deprivation measure relative levels of deprivation in 32,844 small areas or neighbourhoods, called Lower-layer Super Output Areas, in England
• The data indicators used to construct the IoD2019 are based on the most up-to-date information available
Key findings:
• Overall, 88 per cent of neighbourhoods that are in the most deprived decile according to the Index of Multiple Deprivation 2019 (IMD2019) were also the most deprived according to the IMD2015
• Deprivation is dispersed across England. 61 per cent of local authority districts contain at least one of the most deprived neighbourhoods in England
• Middlesbrough, Liverpool, Knowsley, Kingston upon Hull and Manchester are the local authorities with the highest proportions of neighbourhoods among the most deprived in England. This is largely unchanged from the IMD2015
• Many London Boroughs have seen a reduction in the proportions of their neighbourhoods that are highly deprived from the IMD2015
• Seven of the 10 local authority districts with the highest levels of income deprivation among older people are in London – this is unchanged from the IMD2015
• Middlesbrough and Blackpool rank as the most deprived districts regarding income deprivation among children
(such as Blackpool or Hastings), and parts of east London. There are also pockets of deprivation
surrounded by less deprived places in every region of England.
The most deprived neighbourhood in England according to the IMD2019 is to the east of the Jaywick
area of Clacton on Sea (Tendring 018a). This area was also ranked as the most deprived nationally
according to the IMD2015 and IMD2010. Neighbourhoods in Blackpool then account for eight of the
ten most deprived neighbourhoods nationally, with the Anfield area in the centre of Liverpool
(Liverpool 019C) making up the ten most deprived areas in England (see Key Info box).
Deprivation in some areas has persisted across iterations of the Indices. There are five
neighbourhoods which have been ranked among the most deprived 100 LSOAs on each Index of
Multiple Deprivation update since 2004. Two of these are located in Liverpool (Liverpool 024A and
Liverpool 024B) and one in Wirral (Wirral 011C), Rochdale (Rochdale 010C) and Middlesbrough
(Middlesbrough 003F)2. See section 5.4 of the Research Report for further detail.
According to the IoD2019, many of the most deprived 10 per cent of neighbourhoods in England
face multiple challenges across the domains comprising the IMD2019 (see Table 1). Almost all of
these areas (98.7 per cent) are ranked as highly deprived (i.e. in the most deprived decile) on at
least two of the seven domains of deprivation. Nearly two-thirds (65.5 per cent) are highly deprived
on four or more domains, and just under a third (30.7 per cent) are highly deprived on five or six of
the seven domains. No neighbourhoods fall into the most deprived decile across all seven domains.
2 Analysis based on 31,672 Lower-layer Super Output Areas that have not changed boundaries between 2001 and 2011 updates.
Most deprived LSOAs based on IMD2019 Rank
LSOA name Local Authority name
1. Tendring 018A Tendring
2. Blackpool 010A Blackpool
3. Blackpool 006A Blackpool
4. Blackpool 013B Blackpool
5. Blackpool 013A Blackpool
6. Blackpool 013D Blackpool
7. Blackpool 010E Blackpool
8. Blackpool 011A Blackpool
9. Blackpool 008D Blackpool
10. Liverpool 019C Liverpool
Key Info
LSOAs
Lower-Layer Super Output Areas (LSOAs) are
small areas designed to be of a similar population
size, with an average of approximately 1,500
residents or 650 households. There are 32,844
Lower-layer LSOAs in England. LSOAs are a
standard statistical geography produced by the
Office for National Statistics for the reporting of
small area statistics. LSOAs are also referred to
as neighbourhoods throughout this release.
6 The English Indices of Deprivation 2019 - Statistical Release
Map 1: Distribution of the Index of Multiple Deprivation (IMD) 2019 by LSOA in England
7 The English Indices of Deprivation 2019 - Statistical Release
Of these most deprived 10 per cent of neighbourhoods in England (3,284), 137 rank as highly
deprived on six of the seven domains. These neighbourhoods are not evenly distributed across
England: 88, or 64 per cent of them, are located within just 8 local authority districts - Blackpool
contains 15 such neighbourhoods; Liverpool, 14; Birmingham and Leeds, 13 each, and Bradford,
11. Blackpool and Burnley have proportionately more neighbourhoods ranked as highly deprived on
six of the seven domains: 15 (or 16 per cent) of 94 neighbourhoods in Blackpool met this criterion,
as did 7 (or 12 per cent) of 60 neighbourhoods in Burnley.
Change since the Indices of Deprivation 2015 (IoD2015) The IoD2019 is broadly based on
the same methodology as the 2015
Indices. Although it is not possible
to use the Indices to measure
absolute changes in deprivation
over time, it is possible to explore
changes in relative deprivation, or
changes in the pattern of
deprivation, between iterations – as
if comparing two snapshots in time.
Chart 1 shows the proportion of
neighbourhoods in each decile of
the IMD2019 that were in the same
decile according to the IMD2015.
Overall, 65 per cent of
neighbourhoods remained in the
same decile of deprivation between
iterations. There was relatively little
movement of neighbourhoods
between deciles at the extreme
ends of the distribution. This indicates that, in relative terms at least, the most deprived areas and
least deprived areas have tended to remain the same between updates.
Table 1: The most deprived 10 per cent of neighbourhoods nationally based on the IMD2019, by the number of domains on which they are also in the most deprived decile
9 The English Indices of Deprivation 2019 - Statistical Release
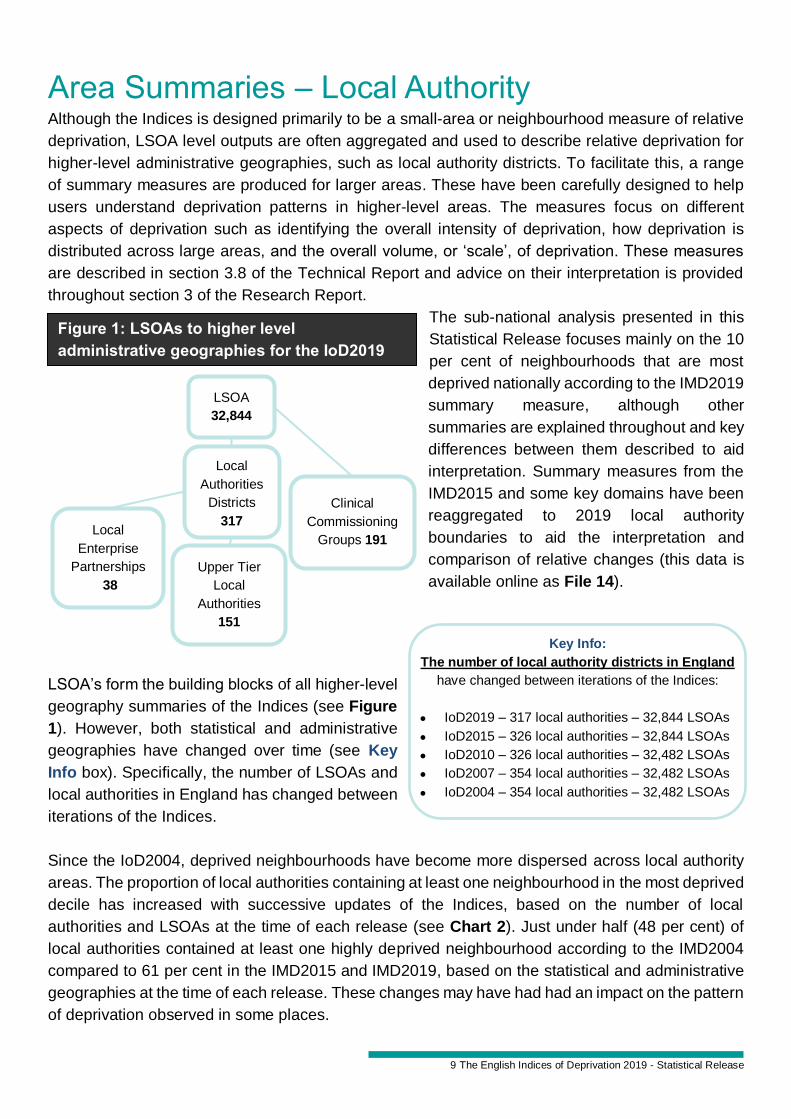
Area Summaries – Local Authority Although the Indices is designed primarily to be a small-area or neighbourhood measure of relative
deprivation, LSOA level outputs are often aggregated and used to describe relative deprivation for
higher-level administrative geographies, such as local authority districts. To facilitate this, a range
of summary measures are produced for larger areas. These have been carefully designed to help
users understand deprivation patterns in higher-level areas. The measures focus on different
aspects of deprivation such as identifying the overall intensity of deprivation, how deprivation is
distributed across large areas, and the overall volume, or ‘scale’, of deprivation. These measures
are described in section 3.8 of the Technical Report and advice on their interpretation is provided
throughout section 3 of the Research Report.
The sub-national analysis presented in this
Statistical Release focuses mainly on the 10
per cent of neighbourhoods that are most
deprived nationally according to the IMD2019
summary measure, although other
summaries are explained throughout and key
differences between them described to aid
interpretation. Summary measures from the
IMD2015 and some key domains have been
reaggregated to 2019 local authority
boundaries to aid the interpretation and
comparison of relative changes (this data is
available online as File 14).
LSOA’s form the building blocks of all higher-level
geography summaries of the Indices (see Figure
1). However, both statistical and administrative
geographies have changed over time (see Key
Info box). Specifically, the number of LSOAs and
local authorities in England has changed between
iterations of the Indices.
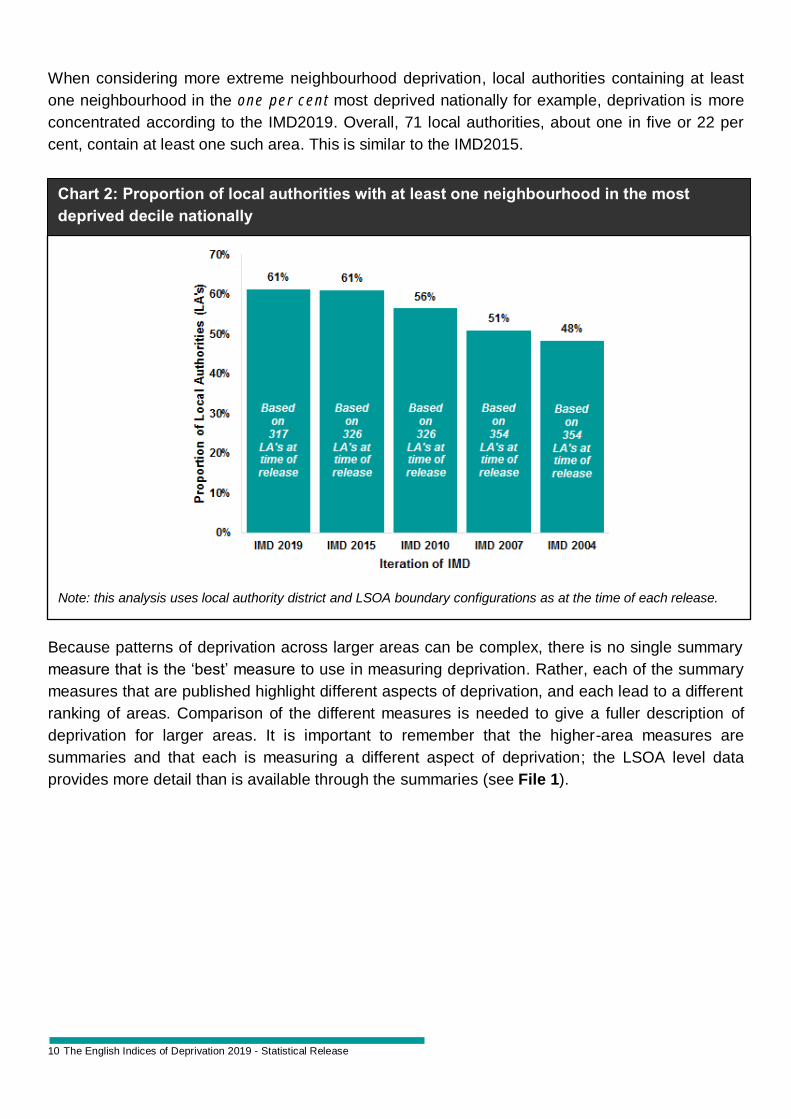
Since the IoD2004, deprived neighbourhoods have become more dispersed across local authority
areas. The proportion of local authorities containing at least one neighbourhood in the most deprived
decile has increased with successive updates of the Indices, based on the number of local
authorities and LSOAs at the time of each release (see Chart 2). Just under half (48 per cent) of
local authorities contained at least one highly deprived neighbourhood according to the IMD2004
compared to 61 per cent in the IMD2015 and IMD2019, based on the statistical and administrative
geographies at the time of each release. These changes may have had had an impact on the pattern
of deprivation observed in some places.
Figure 1: LSOAs to higher level
administrative geographies for the IoD2019
LSOA
32,844
Local
Authorities
Districts
317
Upper Tier
Local
Authorities
151
Clinical
Commissioning
Groups 191 Local
Enterprise
Partnerships
38
Key Info:
The number of local authority districts in England
have changed between iterations of the Indices:
• IoD2019 – 317 local authorities – 32,844 LSOAs
• IoD2015 – 326 local authorities – 32,844 LSOAs
• IoD2010 – 326 local authorities – 32,482 LSOAs
• IoD2007 – 354 local authorities – 32,482 LSOAs
• IoD2004 – 354 local authorities – 32,482 LSOAs
10 The English Indices of Deprivation 2019 - Statistical Release
When considering more extreme neighbourhood deprivation, local authorities containing at least
one neighbourhood in the one per cent most deprived nationally for example, deprivation is more
concentrated according to the IMD2019. Overall, 71 local authorities, about one in five or 22 per
cent, contain at least one such area. This is similar to the IMD2015.
Because patterns of deprivation across larger areas can be complex, there is no single summary
measure that is the ‘best’ measure to use in measuring deprivation. Rather, each of the summary
measures that are published highlight different aspects of deprivation, and each lead to a different
ranking of areas. Comparison of the different measures is needed to give a fuller description of
deprivation for larger areas. It is important to remember that the higher-area measures are
summaries and that each is measuring a different aspect of deprivation; the LSOA level data
provides more detail than is available through the summaries (see File 1).
Note: this analysis uses local authority district and LSOA boundary configurations as at the time of each release.
Chart 2: Proportion of local authorities with at least one neighbourhood in the most
deprived decile nationally
11 The English Indices of Deprivation 2019 - Statistical Release
Summary measures help describe relative deprivation at a higher geographical scale. Local
authority level summaries are used here to help illustrate three of the most widely used summary
measures, their differences and outcomes. Further breakdowns and rankings by the full range of
summary measures can be found in the accompanying online tables and technical documentation.
Table 3.2 of the Technical Report provides a more detailed summary of each.
(Rank of) Average Rank – this measure summarises the average level of deprivation across an
area, based on the population weighted ranks of all the neighbourhoods within it. For example, all
LSOAs in a local authority, whether highly deprived or not so deprived, contribute to this summary
measure. Overall, highly deprived areas and less-deprived areas will tend to average out in the
overall rank, so an area that is more uniformly deprived will tend to rank higher on this measure
compared to other summary measures.
(Rank of) Average Score - this measure summarises the average level of deprivation across an
area, based on the scores of all the neighbourhoods contained within. Scores are calculated by
taking the population weighted average of the combined scores for the neighbourhoods in a larger
area. This measure also covers the whole area including both deprived and less-deprived
neighbourhoods. The main difference from the average rank measure is that more deprived
neighbourhoods tend to have more ‘extreme’ scores than ranks, so highly deprived areas will not
tend to average out in the same way as when using ranks. With scores, highly polarised authorities
will tend to score higher on the average score measure than on the average rank.
Proportion of LSOAs in most deprived 10 per cent nationally – this measure summarises the
proportion of neighbourhoods in a larger area that are in the most deprived 10 per cent of
neighbourhoods in the country. As such, this measure is only focused on illustrating the number of
neighbourhoods within a larger area which are the most deprived in England. However,
neighbourhoods just outside the 10 per cent most deprived are not included as part of this measure,
so large areas, such as local authorities or local enterprise partnerships, may not appear to be so
deprived relative to others if they contain zero or few of the most deprived neighbourhoods in the
country.
Most deprived local
authorities based on Rank
1. Blackpool
2. Manchester
3. Knowsley
4. Liverpool
5. Barking and Dagenham
6. Birmingham
7. Hackney
8. Sandwell
9. Kingston upon Hull
10. Nottingham
Most deprived local
authorities based on Score
1. Blackpool
2. Knowsley
3. Liverpool
4. Kingston upon Hull
5. Middlesbrough
6. Manchester
7. Birmingham
8. Burnley
9. Blackburn with Darwen
10. Hartlepool
Most deprived local authorities
based on the Proportion of
LSOAs in the most deprived 10%
nationally
1. Middlesbrough
2. Liverpool
3. Knowsley
4. Kingston upon Hull
5. Manchester
6. Blackpool
7. Birmingham
8. Burnley
9. Blackburn with Darwen
10. Hartlepool
12 The English Indices of Deprivation 2019 - Statistical Release
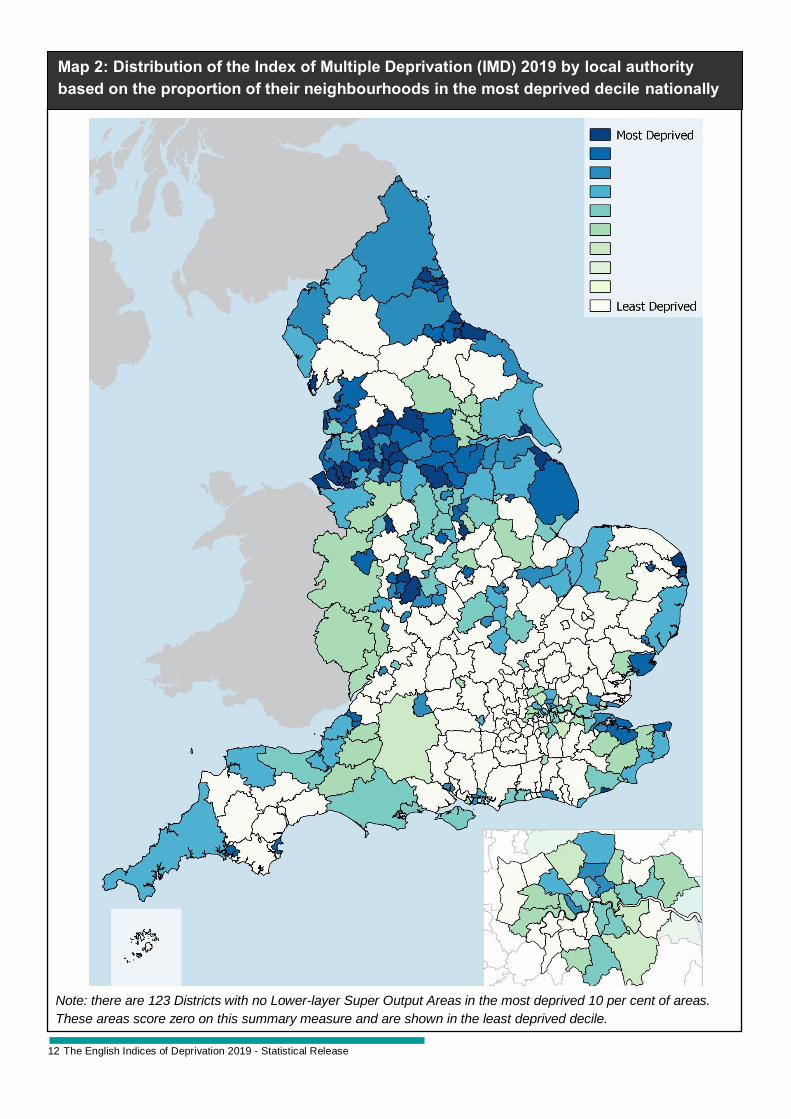
Note: there are 123 Districts with no Lower-layer Super Output Areas in the most deprived 10 per cent of areas.
These areas score zero on this summary measure and are shown in the least deprived decile.
Map 2: Distribution of the Index of Multiple Deprivation (IMD) 2019 by local authority
based on the proportion of their neighbourhoods in the most deprived decile nationally
13 The English Indices of Deprivation 2019 - Statistical Release
Map 2 illustrates the geographical spread of deprivation for local authority districts across England
according to the proportion of neighbourhoods in the most deprived decile nationally. This higher-
level geography masks some pockets of deprivation that are visible in Map 1. Areas shaded dark
blue are the 10 per cent of local authority districts in England that contain the largest proportion of
highly deprived neighbourhoods. Areas shaded pale green contain proportionately few highly
deprived neighbourhoods and are relatively less deprived. In total, 123 of the 317 districts (39 per
cent) do not contain any highly deprived neighbourhoods and are therefore equally ranked on this
measure. These 123 districts are banded together and shown in pale green, corresponding to the
least deprived decile.
Change at Local Authority Level since the Indices of Deprivation
2015 (IoD2015) This section focuses on changes in relative deprivation at a local authority district level from the
IoD2015 to the IoD2019. Care should be taken in interpreting change between updates of the
Indices. The changes being described are relative, in terms of changes in the degree to which the
neighbourhoods in a local authority district are among the most deprived nationally, as determined
by each version of the Indices. If an area experienced some absolute decrease (i.e. improvement)
in deprivation levels but less so than other areas, the Index would still show an increase in relative
deprivation. Summary measures from the IMD2015 and some key domains have been reaggregated
to 2019 local authority boundaries to aid the interpretation of relative changes (this data is available
online as File 14).
It should be noted that geographically large local authorities shown on the Map 2 may have relatively
small populations, while geographically small authorities may contain larger populations. However,
neighbourhood level LSOAs have a broadly consistent total population (see Key Info box on pg.5).
Middlesbrough, Liverpool, Knowsley, Kingston upon Hull and Manchester are the five local authority
districts with the largest proportions of highly deprived neighbourhoods in England, ranging from 49
per cent in Middlesbrough to 43 per cent in Manchester (see Table 3). By definition, each district
would contain just 10 per cent of such highly deprived neighbourhoods if deprivation was evenly
distributed across all local authorities in England.
The same five local authority districts have the greatest proportions of highly deprived
neighbourhoods according to both the IMD2015 and the IMD2019 (Table 3). Middlesbrough was
ranked most deprived according to the IMD2015 with just under half (49 per cent) of all
neighbourhoods in the authority ranked as in the most deprived decile nationally. This has remained
the same according to the IMD2019. The other areas have shifted in the rankings but remain in the
top five for this summary measure.
Of the very most deprived neighbourhoods, the most deprived 1 per cent or 328 from 32,844 LSOAs
in England, Liverpool is the local authority with the largest number of the most deprived areas (31
out of its 298 neighbourhoods, or 10 per cent are in this group). But Blackpool has the highest
proportion of its neighbourhoods in the most deprived one per cent nationally (22 out of 94, or 23
per cent). See Table 4.4 of the Research Report for further analysis.
14 The English Indices of Deprivation 2019 - Statistical Release
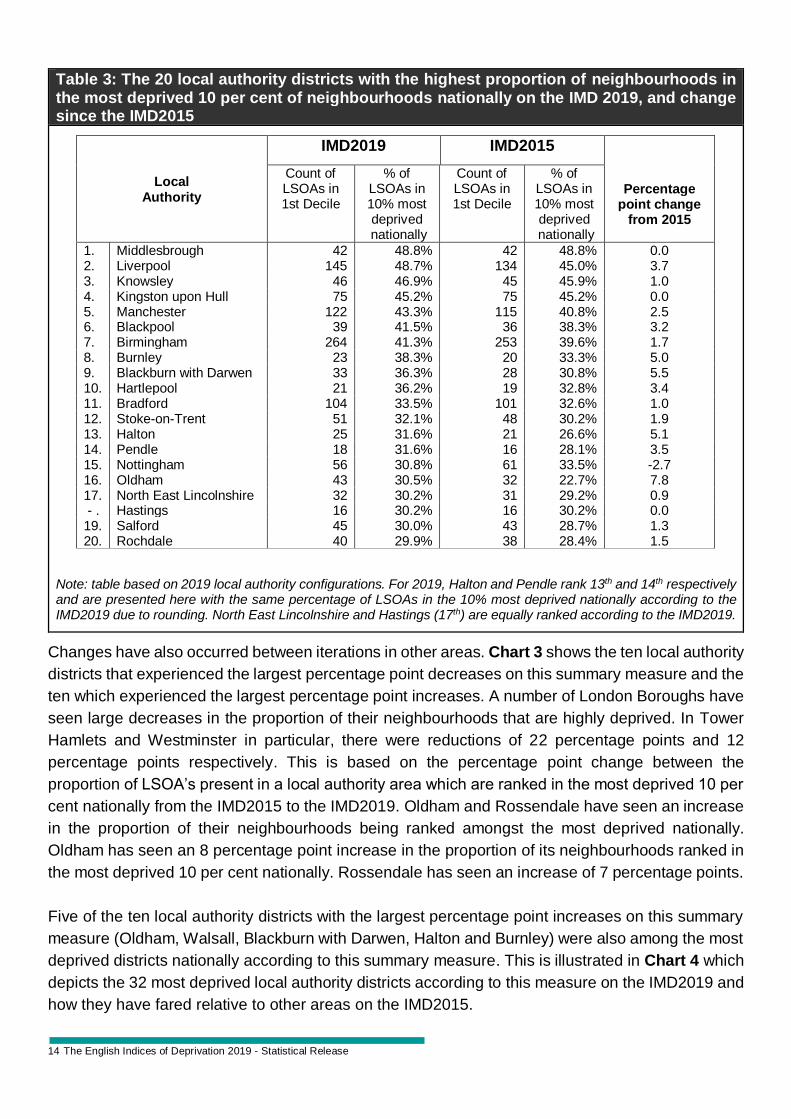
Table 3: The 20 local authority districts with the highest proportion of neighbourhoods in the most deprived 10 per cent of neighbourhoods nationally on the IMD 2019, and change since the IMD2015
Note: table based on 2019 local authority configurations. For 2019, Halton and Pendle rank 13th and 14th respectively and are presented here with the same percentage of LSOAs in the 10% most deprived nationally according to the IMD2019 due to rounding. North East Lincolnshire and Hastings (17th) are equally ranked according to the IMD2019.
Changes have also occurred between iterations in other areas. Chart 3 shows the ten local authority
districts that experienced the largest percentage point decreases on this summary measure and the
ten which experienced the largest percentage point increases. A number of London Boroughs have
seen large decreases in the proportion of their neighbourhoods that are highly deprived. In Tower
Hamlets and Westminster in particular, there were reductions of 22 percentage points and 12
percentage points respectively. This is based on the percentage point change between the
proportion of LSOA’s present in a local authority area which are ranked in the most deprived 10 per
cent nationally from the IMD2015 to the IMD2019. Oldham and Rossendale have seen an increase
in the proportion of their neighbourhoods being ranked amongst the most deprived nationally.
Oldham has seen an 8 percentage point increase in the proportion of its neighbourhoods ranked in
the most deprived 10 per cent nationally. Rossendale has seen an increase of 7 percentage points.
Five of the ten local authority districts with the largest percentage point increases on this summary
measure (Oldham, Walsall, Blackburn with Darwen, Halton and Burnley) were also among the most
deprived districts nationally according to this summary measure. This is illustrated in Chart 4 which
depicts the 32 most deprived local authority districts according to this measure on the IMD2019 and
how they have fared relative to other areas on the IMD2015.
15 The English Indices of Deprivation 2019 - Statistical Release
Chart 3: Change in the proportion of neighbourhoods in the most deprived decile according to the IMD2019 and the IMD2015 by local authority district: the ten authorities with the largest percentage point decreases and increases respectively
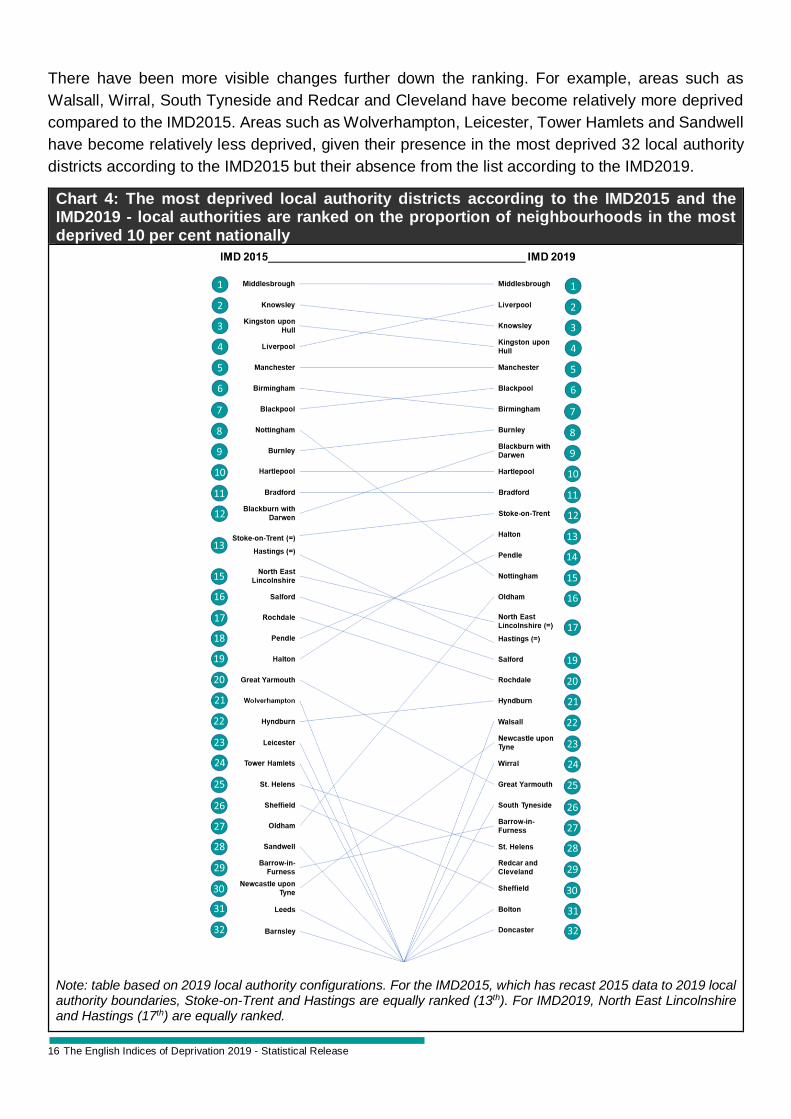
Chart 4 ranks local authority districts according to the proportion of their neighbourhoods that were
in the most deprived decile of the Index at the time. The slope of the lines indicates change in rank
position, that is whether the local authority district has become relatively more or less deprived. It is
possible that a district may have become less deprived in real terms since the previous Index but
more deprived relative to all other districts (or vice versa). However, any change in rank – even of
several places – may not represent a large increase or decrease in absolute levels of deprivation.
The absence of any notable changes in rank among the five most deprived local authority districts
is of interest as this indicates areas that have been persistently most deprived across historic
iterations of the Indices. As well as being the five most deprived local authorities according to the
IMD2019 and IMD2015, Middlesbrough, Liverpool, Knowsley, Kingston upon Hull, and Manchester
have comprised the most deprived five local authorities since the IMD2010. These five areas were
also among the ten most deprived local authorities according to the 2007 and 2004 updates (see
Chart 5.4 of the Research Report).
16 The English Indices of Deprivation 2019 - Statistical Release
There have been more visible changes further down the ranking. For example, areas such as
Walsall, Wirral, South Tyneside and Redcar and Cleveland have become relatively more deprived
compared to the IMD2015. Areas such as Wolverhampton, Leicester, Tower Hamlets and Sandwell
have become relatively less deprived, given their presence in the most deprived 32 local authority
districts according to the IMD2015 but their absence from the list according to the IMD2019.
Chart 4: The most deprived local authority districts according to the IMD2015 and the IMD2019 - local authorities are ranked on the proportion of neighbourhoods in the most deprived 10 per cent nationally
Note: table based on 2019 local authority configurations. For the IMD2015, which has recast 2015 data to 2019 local authority boundaries, Stoke-on-Trent and Hastings are equally ranked (13th). For IMD2019, North East Lincolnshire and Hastings (17th) are equally ranked.
17 The English Indices of Deprivation 2019 - Statistical Release
Income Deprivation and Employment Deprivation The analysis so far has focused on the Index of Multiple Deprivation (IMD). This section focuses on
the two domains of deprivation which contribute the most weight to the overall Index: the Income
Deprivation Domain and Employment Deprivation Domain. In addition, this section explores the
supplementary indices of income deprivation among children (IDACI) and older people (IDAOPI).
These indices describe deprivation in terms of proportions of deprived people so allow for direct
comparison of deprivation between areas.
Chart 5: Proportion of the population living in income deprived households, for all LSOAs grouped into deciles by Income Deprivation Domain rank (left) and proportion of working-age adults in employment deprivation, for all LSOAs grouped into deciles by Employment Deprivation Domain rank (right)
Levels of income deprivation and employment deprivation vary widely between neighbourhoods. In
the most deprived decile of neighbourhoods on the Income Deprivation Domain, on average, 33 per
cent of the population are income deprived. But in the least deprived decile of this deprivation
domain, only 3 per cent of people are income deprived (Chart 5, left side). A similar pattern is
observed for employment deprivation among the working-age population. In the most deprived
decile of neighbourhoods on the Employment Deprivation Domain, on average, 25 per cent of the
working-age adults are employment deprived, compared with 2 per cent of those in the least
deprived decile of this domain (Chart 5, right side).
Because people experiencing employment deprivation are very likely to also experience income
deprivation, the local authority districts that are ranked as most deprived on the Income Deprivation
Domain are also ranked as most deprived on the Employment Deprivation Domain (see Table 4).
Levels of income deprivation and employment deprivation are both highest in Knowsley,
Middlesbrough, Blackpool, Liverpool and Hartlepool.
18 The English Indices of Deprivation 2019 - Statistical Release
Table 4: The 20 local authority districts with the highest proportions of income deprivation and employment deprivation, respectively
Rank
Income Deprivation Domain Employment Deprivation Domain
Local Authority District
Score - Proportion of population
living in income deprived
households
Local Authority District
Score - Proportion of working age
adults in employment deprivation
1. Middlesbrough 25.1% Blackpool 20.9%
2. Knowsley 25.1% Knowsley 20.2%
3. Blackpool 24.7% Middlesbrough 19.1%
4. Liverpool 23.5% Hartlepool 18.5%
5. Hartlepool 22.8% Liverpool 17.6%
6. Kingston upon Hull 22.7% South Tyneside 17.2%
7. Birmingham 22.2% Kingston upon Hull 16.6%
8. Manchester 21.9% Redcar and Cleveland 16.5%
9. Sandwell 21.5% St. Helens 16.5%
10. Blackburn with Darwen 21.2% Burnley 16.3%
11. Wolverhampton 21.1% Blackburn with Darwen 16.2%
12. South Tyneside 20.6% Great Yarmouth 16.2%
13. Burnley 20.3% Sunderland 16.1%
14. Hastings 20.2% Hastings 16.0%
15. Rochdale 20.1% Halton 15.8%
16. Walsall 20.0% Rochdale 15.8%
17. Nottingham 19.9% Wirral 15.7%
18. Leicester 19.6% Thanet 15.5%
19. Hackney 19.6% Wolverhampton 15.4%
20. Barking and Dagenham 19.4% Birmingham 15.3% Note: proportions derived from the published ‘average score’ statistics for the Income Deprivation Domain and the Employment Deprivation Domain.
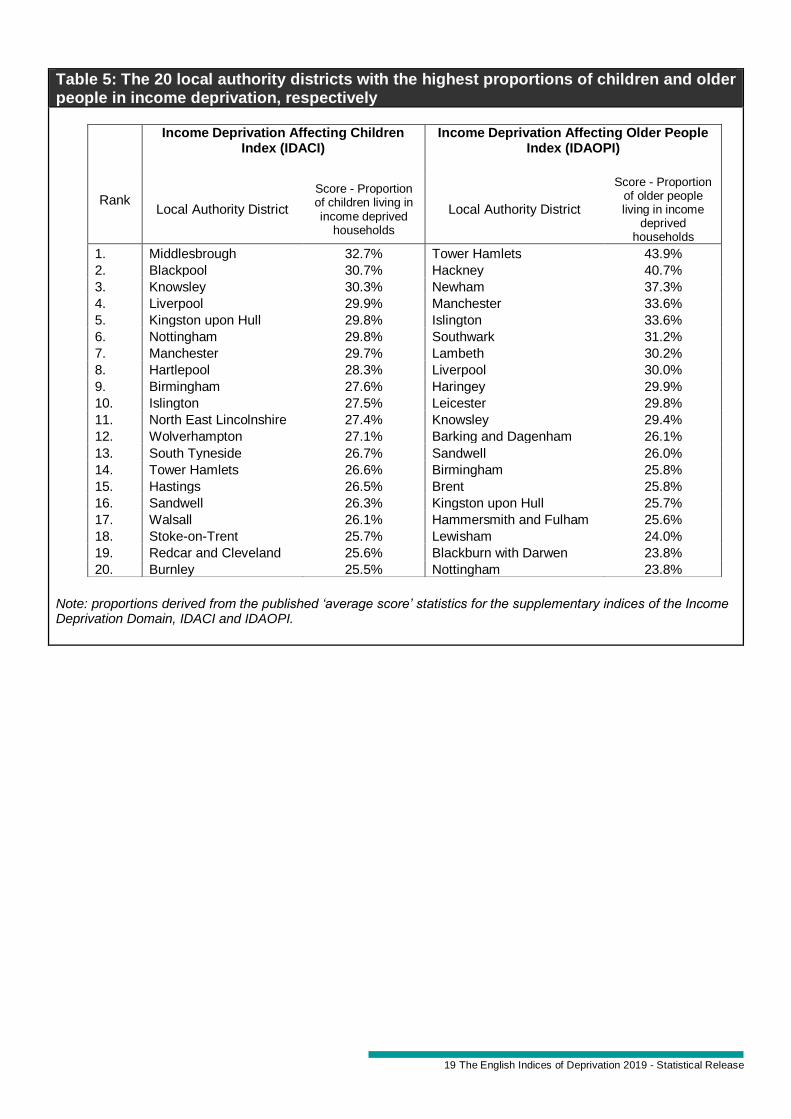
The Income Deprivation Affecting Children Index (IDACI) measures the proportion of all children
aged 0 to 15 living in income deprived families. This is one of two supplementary indices and is a
sub-set of the Income Deprivation Domain. The most deprived local authorities on this measure are
typically found in the Midlands or the north of England. Around 30 per cent of children in Liverpool,
Kingston upon Hull, Nottingham and Manchester are living in income-deprived families according to
this measure. In Middlesbrough, Blackpool and Knowsley, over 30 per cent of children are living in
income-deprived families (see Table 5).
The Income Deprivation Affecting Older People Index (IDAOPI) measures the proportion of all those
aged 60 or over who experience income deprivation. This is a second supplementary indices which
is a sub-set of the Income Deprivation Domain. According to the IDAOPI, more than two in five older
people are income deprived in Tower Hamlets and Hackney. Seven of the most deprived ten districts
based on the IDAOPI are London boroughs.
Nine local authorities appear in the most deprived 20 nationally across both supplementary indices
19 The English Indices of Deprivation 2019 - Statistical Release
Table 5: The 20 local authority districts with the highest proportions of children and older people in income deprivation, respectively
Rank
Income Deprivation Affecting Children Index (IDACI)
Income Deprivation Affecting Older People Index (IDAOPI)
Local Authority District
Score - Proportion of children living in income deprived
households
Local Authority District
Score - Proportion of older people living in income
deprived households
1. Middlesbrough 32.7% Tower Hamlets 43.9%
2. Blackpool 30.7% Hackney 40.7%
3. Knowsley 30.3% Newham 37.3%
4. Liverpool 29.9% Manchester 33.6%
5. Kingston upon Hull 29.8% Islington 33.6%
6. Nottingham 29.8% Southwark 31.2%
7. Manchester 29.7% Lambeth 30.2%
8. Hartlepool 28.3% Liverpool 30.0%
9. Birmingham 27.6% Haringey 29.9%
10. Islington 27.5% Leicester 29.8%
11. North East Lincolnshire 27.4% Knowsley 29.4%
12. Wolverhampton 27.1% Barking and Dagenham 26.1%
13. South Tyneside 26.7% Sandwell 26.0%
14. Tower Hamlets 26.6% Birmingham 25.8%
15. Hastings 26.5% Brent 25.8%
16. Sandwell 26.3% Kingston upon Hull 25.7%
17. Walsall 26.1% Hammersmith and Fulham 25.6%
18. Stoke-on-Trent 25.7% Lewisham 24.0%
19. Redcar and Cleveland 25.6% Blackburn with Darwen 23.8%
20. Burnley 25.5% Nottingham 23.8%
Note: proportions derived from the published ‘average score’ statistics for the supplementary indices of the Income Deprivation Domain, IDACI and IDAOPI.
20 The English Indices of Deprivation 2019 - Statistical Release
Area Summary Case Study – London Some areas have become less deprived between the IoD2015 and IoD2019. As a case study, local
authority districts in London have seen a relative decrease in their levels of deprivation between the
IMD2015 and the IMD2019. This overall pattern is shown in Map 3. According to the IMD2015, eight
London Boroughs were ranked in the most deprived 30 per cent of local authorities when looking at
the proportion of their neighbourhoods which were the most deprived nationally - Tower Hamlets,
Haringey, Hackney, Islington, Westminster, Enfield, Kensington and Chelsea and Waltham Forest
(see Map 3, left side). According to the IMD2019, only three London Boroughs are ranked in the
most deprived three deciles (Hackney, Haringey Kensington and Chelsea). Tower Hamlets has
become considerably less deprived on this measure, ranking 24 in the IMD2015 and 175 in the
IMD2019 indicating that the neighbourhoods within the authority have become less deprived relative
to other neighbourhoods in England.
This change can also be seen at LSOA level. According to the IMD2015, 274 LSOAs, or
neighbourhoods, in London were in the most deprived decile. For the IMD2019, this has reduced to
107. This change is illustrated in Map 3 (right side).
Map 3: Distribution of the IMD2015 and IMD2019 in London by local authority (left, based
on the proportion of their neighbourhoods in the most deprived decile nationally) and
LSOA (right, by IMD decile)
21 The English Indices of Deprivation 2019 - Statistical Release
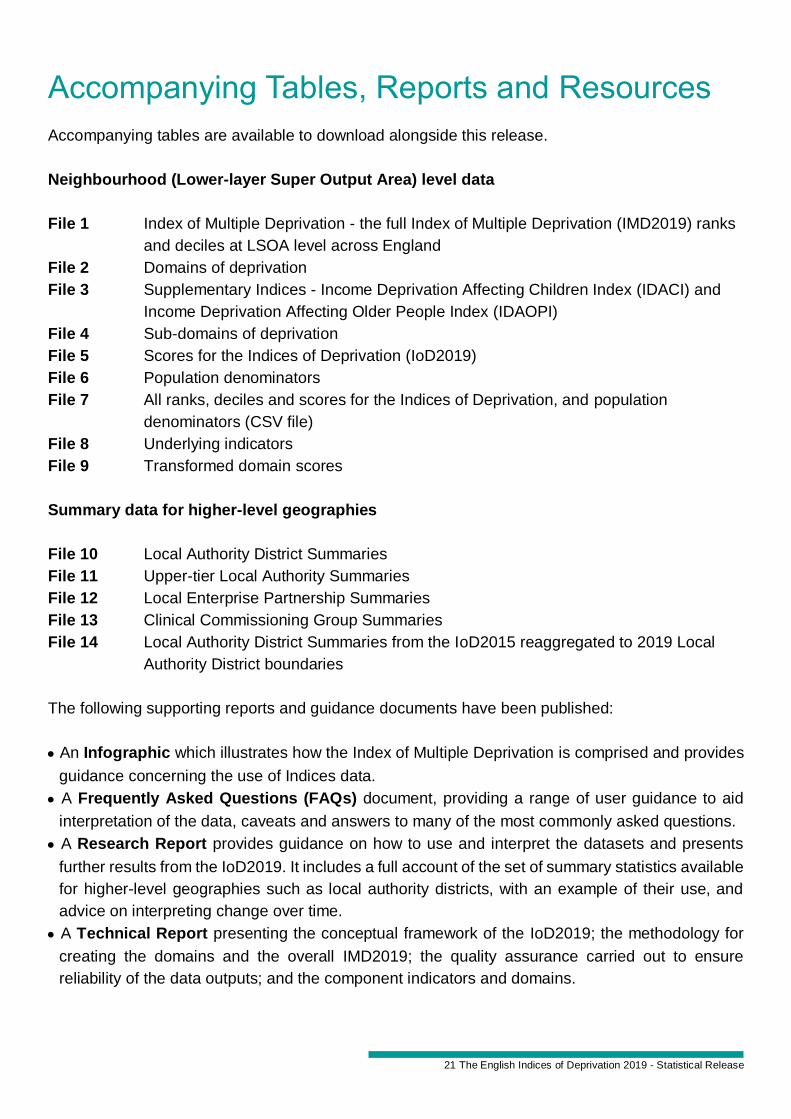
Accompanying Tables, Reports and Resources
Accompanying tables are available to download alongside this release.
Neighbourhood (Lower-layer Super Output Area) level data
File 1 Index of Multiple Deprivation - the full Index of Multiple Deprivation (IMD2019) ranks
and deciles at LSOA level across England
File 2 Domains of deprivation
File 3 Supplementary Indices - Income Deprivation Affecting Children Index (IDACI) and
Income Deprivation Affecting Older People Index (IDAOPI)
File 4 Sub-domains of deprivation
File 5 Scores for the Indices of Deprivation (IoD2019)
File 6 Population denominators
File 7 All ranks, deciles and scores for the Indices of Deprivation, and population
denominators (CSV file)
File 8 Underlying indicators
File 9 Transformed domain scores
Summary data for higher-level geographies
File 10 Local Authority District Summaries
File 11 Upper-tier Local Authority Summaries
File 12 Local Enterprise Partnership Summaries
File 13 Clinical Commissioning Group Summaries
File 14 Local Authority District Summaries from the IoD2015 reaggregated to 2019 Local
Authority District boundaries
The following supporting reports and guidance documents have been published:
• An Infographic which illustrates how the Index of Multiple Deprivation is comprised and provides
guidance concerning the use of Indices data.
• A Frequently Asked Questions (FAQs) document, providing a range of user guidance to aid
interpretation of the data, caveats and answers to many of the most commonly asked questions.
• A Research Report provides guidance on how to use and interpret the datasets and presents
further results from the IoD2019. It includes a full account of the set of summary statistics available
for higher-level geographies such as local authority districts, with an example of their use, and
advice on interpreting change over time.
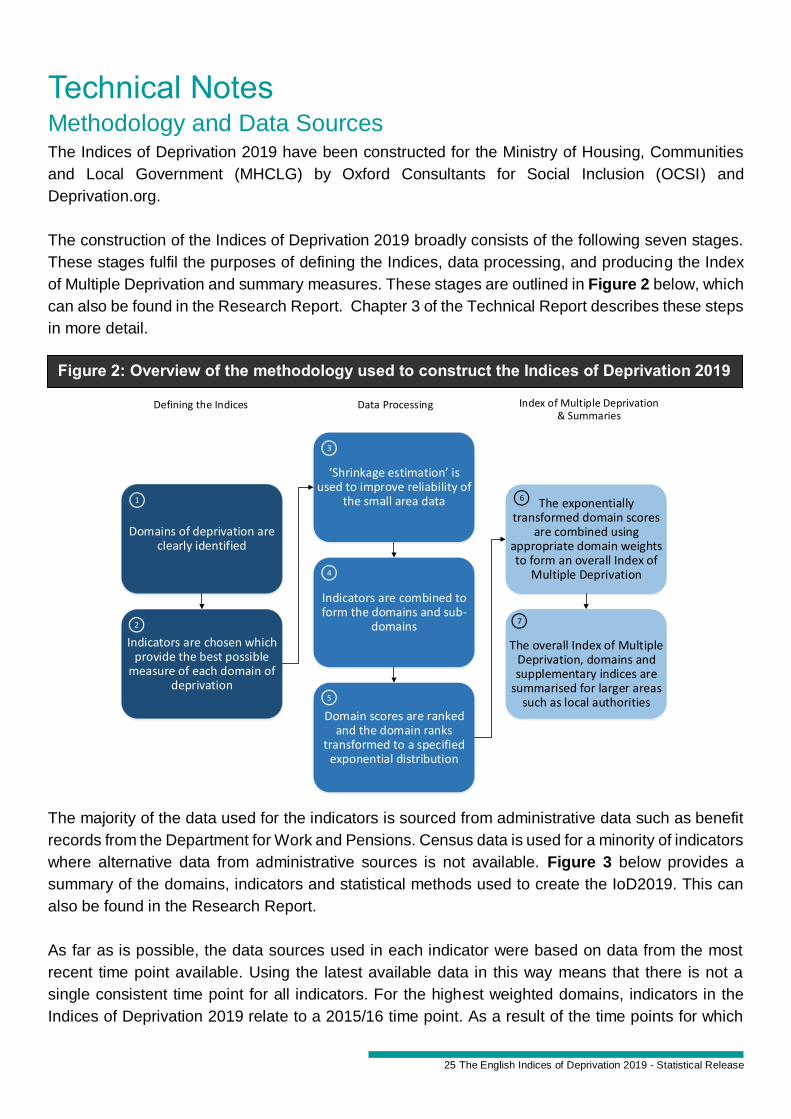
• A Technical Report presenting the conceptual framework of the IoD2019; the methodology for
creating the domains and the overall IMD2019; the quality assurance carried out to ensure
reliability of the data outputs; and the component indicators and domains.
22 The English Indices of Deprivation 2019 - Statistical Release
All of the data files and supporting documents are available from:
The IoD2019 Local Authority dashboard allows users to explore the range of summary measures
across the IoD2019 at local authority level and the LSOAs within each district. The maps displayed
illustrate the location of the local authority within England, the LSOAs within the selected local
authority and which decile each LSOA is in for the IMD2019 – https://www.gov.uk/guidance/english-
indices-of-deprivation-2019-mapping-resources
A Geopackage, shapefiles, mapping templates and further mapping resources are available online here - https://www.gov.uk/guidance/english-indices-of-deprivation-2019-mapping-resources MHCLG in collaboration with the University of Sheffield have created a suite of Local Authority
maps covering all 317 districts in England. These are available online here -
https://imd2019.group.shef.ac.uk/#. Each map uses the IMD2019 to illustrate deprivation at LSOA
level within each area. Each map also displays the number of LSOAs each area has in each decile
of deprivation.
Definitions
Indices of Deprivation (IoD2019)
The Indices of Deprivation 2019 provide a set of relative measures of deprivation for small areas
(Lower-layer Super Output Areas) across England, based on seven different domains of deprivation:
Income Deprivation, Employment Deprivation, Education, Skills and Training Deprivation, Health
This document/publication is also available on our website at www.gov.uk/MHCLG If you have any enquiries regarding this document/publication, email [email protected] or write to us at:
Ministry of Housing, Communities and Local Government Fry Building 2 Marsham Street London SW1P 4DF Telephone: 030 3444 0000 September 2019 For all our latest news and updates follow us on Twitter: https://twitter.com/mhclg