The Enhanced Fujita Scale for Wind Damage Rating David Sills Cloud Physics and Severe Weather Research Section Meteorological Research Division, Science and Technology Branch Toronto, ON 21 Aug 2011 Goderich, ON Confirmed F3 1 Fatality 37 Injuries Global TV
Transcript
The Enhanced Fujita Scale for Wind Damage Rating
David SillsCloud Physics and Severe Weather Research Section
Meteorological Research Division, Science and Technology BranchToronto, ON
21 Aug 2011 Goderich, ONConfirmed F31 Fatality37 Injuries
Global TV
Outline
• Brief history of wind damage rating• The EF-scale – why and how?• EF-scale evaluation in Canada• Problems and solutions• Using the EF-scale
Fujita Scale• Developed by Ted
Fujita at Univ. of Chicago in the 1960s
• Wind speeds were educated guesses
• Limited number of damage indicators
• Used for tornadic and non-tornadic wind damage
• Implemented in US by NWS in 1970s
From Fujita (1981)
Presenter
Presentation Notes
Residential home primary damage indicator
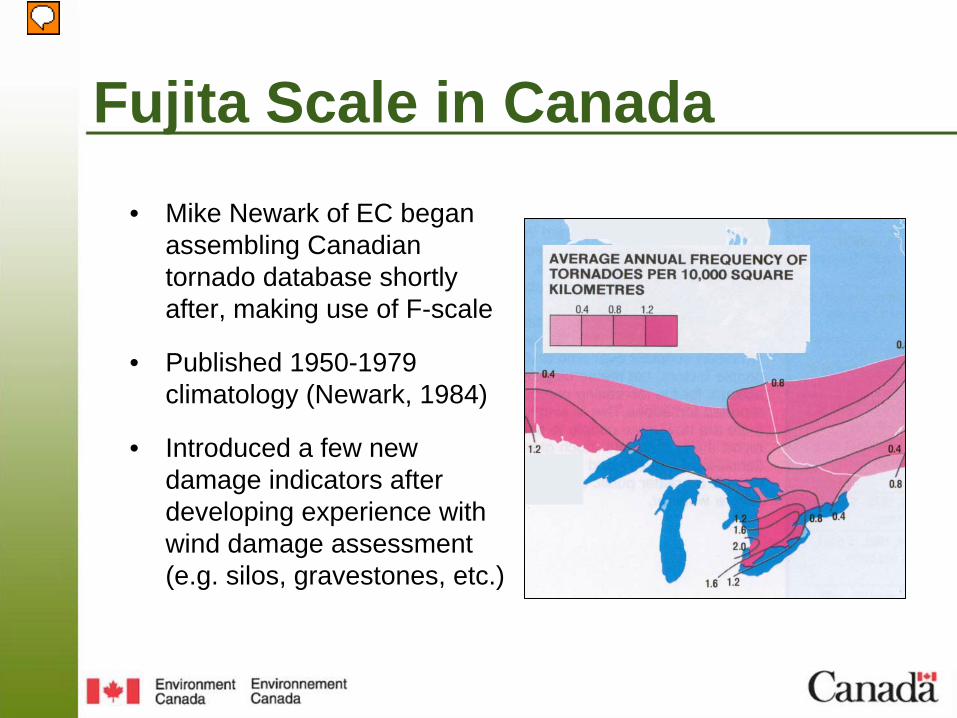
Fujita Scale in Canada• Mike Newark of EC began
assembling Canadian tornado database shortly after, making use of F-scale
• Published 1950-1979 climatology (Newark, 1984)
• Introduced a few new damage indicators after developing experience with wind damage assessment (e.g. silos, gravestones, etc.)
Presenter
Presentation Notes
Tornado analysis from Mike Newark, 1983
Enhanced Fujita Scale• The EF-scale was developed at Texas
Tech Univ. involving many US interests
• Has much improved wind speed / wind damage correlation with large number of damage indicators while consistent with existing US database
• Adopted for use in the United States in 2007, Sills and McCarthy have been monitoring progress and improvements to EF-scale since that time
• Adopted officially at EC on April 1, 2013
• First tornado rated using the EF-scale occurred on April 18th, 2013, at Shelburne, ON – rated EF1
Why the EF-scale was created
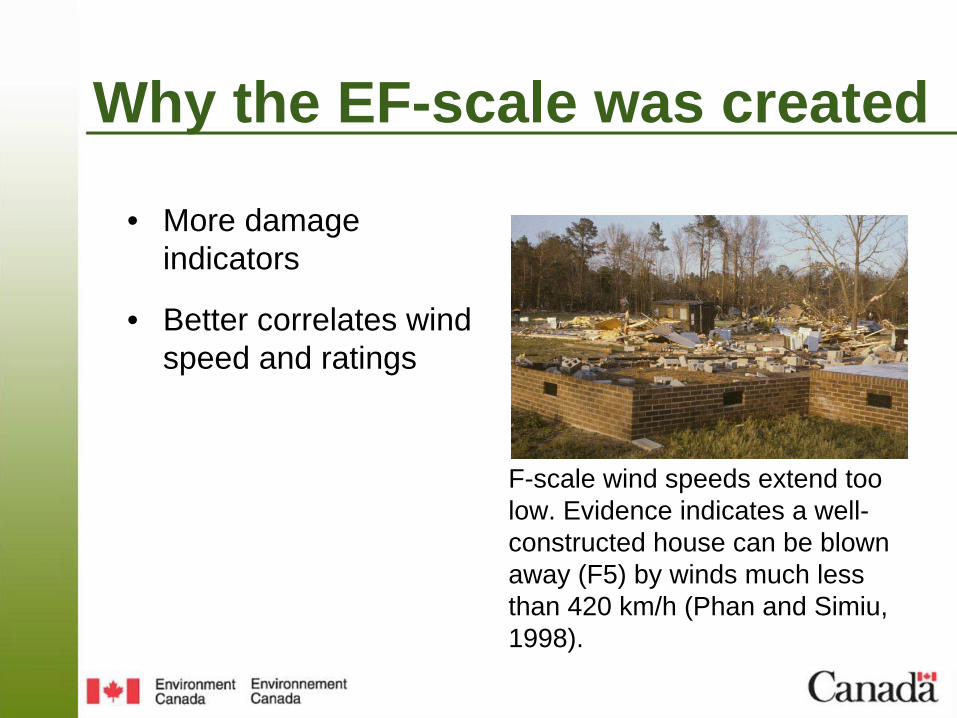
• More damage indicators
The ‘framed house’ was one of only a small number of damage indicators used with the original F-scale
Why the EF-scale was created
• More damage indicators
• Better correlates wind speed and ratings
F-scale wind speeds extend too low. Evidence indicates a well- constructed house can be blown away (F5) by winds much less than 420 km/h (Phan and Simiu, 1998).
Why the EF-scale was created
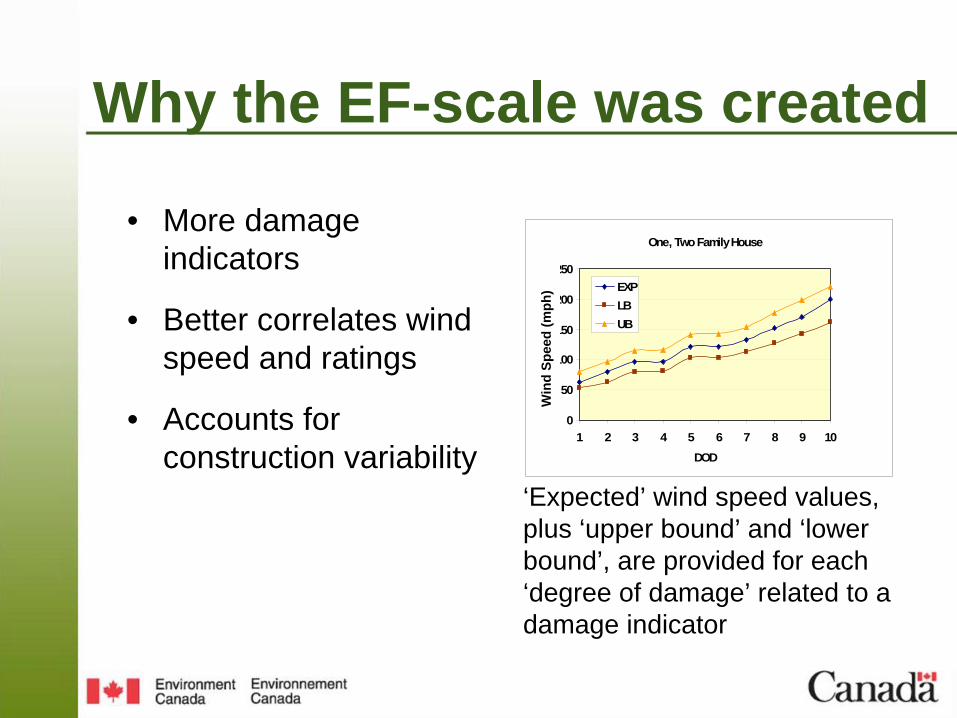
• More damage indicators
• Better correlates wind speed and ratings
• Accounts for construction variability
‘Expected’ wind speed values, plus ‘upper bound’ and ‘lower bound’, are provided for each ‘degree of damage’ related to a damage indicator
One, Two Family House
0
50
100
150
200
250
1 2 3 4 5 6 7 8 9 10DOD
WIn
d Sp
eed
(mp EXP
LBUB
Win
d Sp
eed
(mph
)
Degrees of Damage (DoD)DOD Damage Description EXP LB UB1 Threshold of visible damage 63 53 802 Loss of roof covering material (<20%), gutters and/or awning; loss of
vinyl or metal siding 79 63 97
3 Broken glass in doors and windows 96 79 1144 Uplift of roof deck and loss of significant roof covering material (>20%);
collapse of chimney; garage doors collapse inward or outward; failure of porch or carport
97 81 116
5 Entire house shifts off foundation 121 103 1416 Large sections of roof structure removed; most walls remain standing 122 104 1427 Exterior walls collapsed 132 113 1538 Most walls collapsed except small interior rooms. 152 127 1789 All walls collapsed 170 142 19810 Destruction of engineered and/or well constructed residence; slab swept
clean200 162 220
DODs for Framed House DI (FR12), winds in mphWDTB
Degrees of Damage (DoD)One, Two Family House
0
50
100
150
200
250
1 2 3 4 5 6 7 8 9 10DOD
WIn
d Sp
eed
(m
EXPLBUB
Win
d Sp
eed
(mph
)
DODs for Framed House DI (FR12)
WDTB
How was EF-scale created?• Developed 2000-2004 by the Fujita Scale
Enhancement Project led by the Wind Science and Engineering Research Center at Texas Tech (McDonald and Mehta, 2006)
• Wind speed / damage intensity relationships obtained through process of ‘Expert Elicitation’ – used various engineering studies and the field experience of meteorology and engineering experts
• Experts included two meteorologists, two engineers, one architect and one meteorologist / engineer – all with extensive experience
Presenter
Presentation Notes
Expert Elicitation is a method created by the Senior Seismic Hazard Assessment Committee (SSHAC, 1997) to estimate risk potential in seismic zones. EXPERTS: Greg Forbes – Meteorologist, TWC Don Burgess – Meteorologist, NSSL Doug Smith – Engineer, TTU Tim Reinhold – Engineer, Clemson University Tom Smith – Architect, Consultant Tim Marshall – Meteorologist/Engineer, Haag Engineers
How was EF-scale created?
• Raw ‘expected value’ estimates in mph from the six experts (e.g. for high-rise buildings)
• Differences up to 150 mph (240 km/h) but most estimates similar
McDonald and Mehta (2006)
Presenter
Presentation Notes
Raw data from the first expert elicitation Six ‘expected value’ columns are wind speed estimates for each degree of damage (incorrectly labelled ‘damage indicator’ here) in mph by each expert
Deriving EF-scale• A second Expert Elicitation process was undertaken to obtain mean expected winds for each DOD using the original F-scale
• Estimates in mph from six NWS assessment experts (e.g. for trees)
• Differences of up to 4 F-scale categories, but again most estimates similar
McDonald and Mehta (2006)
Presenter
Presentation Notes
Raw data from the second expert elicitation Six columns in red are Fujita rating estimates for each degree of damage (labelled ‘DOD’) by each expert EXPERTS: Bill Bunting – NWSFO – Fort Worth, Texas Brian Peters – NWSFO – Calera, Alabama John Ogren – NWSFO – Indianapolis, Indiana Dennis Hull – NWSFO – Pendleton, Oregon Tom Matheson – NWSFO – Wilmington, North Carolina Brian Smith – NWSFO – Valley, Nebraska *This strategy does not eliminate all artifacts that could occur in the climatology by switching to the EF-Scale. There are some differences in the DoDs that can result in deriving a different rating between the two scales, though very likely not a difference greater than one rating value. But it may be possible in some cases. How these differences will impact the climatology is not entirely known.
Deriving EF-scale
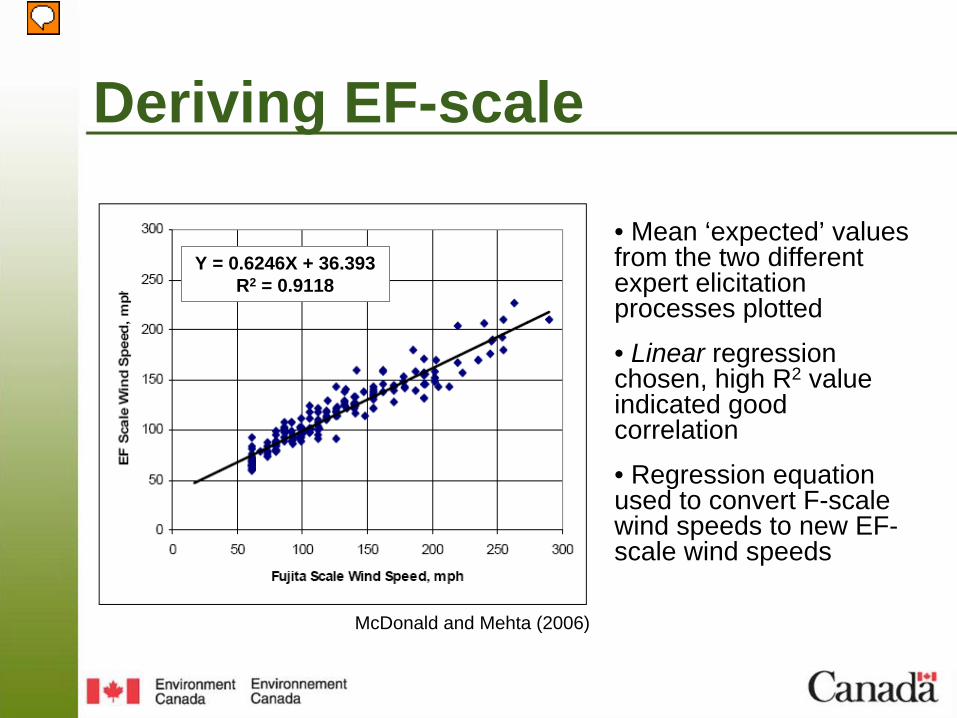
• Mean ‘expected’ values from the two different expert elicitation processes plotted
• Linear regression chosen, high R2 value indicated good correlation
• Regression equation used to convert F-scale wind speeds to new EF- scale wind speeds
Y = 0.6246X + 36.393R2 = 0.9118
McDonald and Mehta (2006)
Presenter
Presentation Notes
EE1 = expert elicitation 1 EE2 = expert elicitation 2 No reason was given for selecting a linear regression
Deriving EF-scale
Y = 0.6246x + 36.393All winds at 10 m
McDonald and Mehta (2006)
Presenter
Presentation Notes
Regression equation used to convert 3-sec gust speeds from F-scale to new EF-scale values
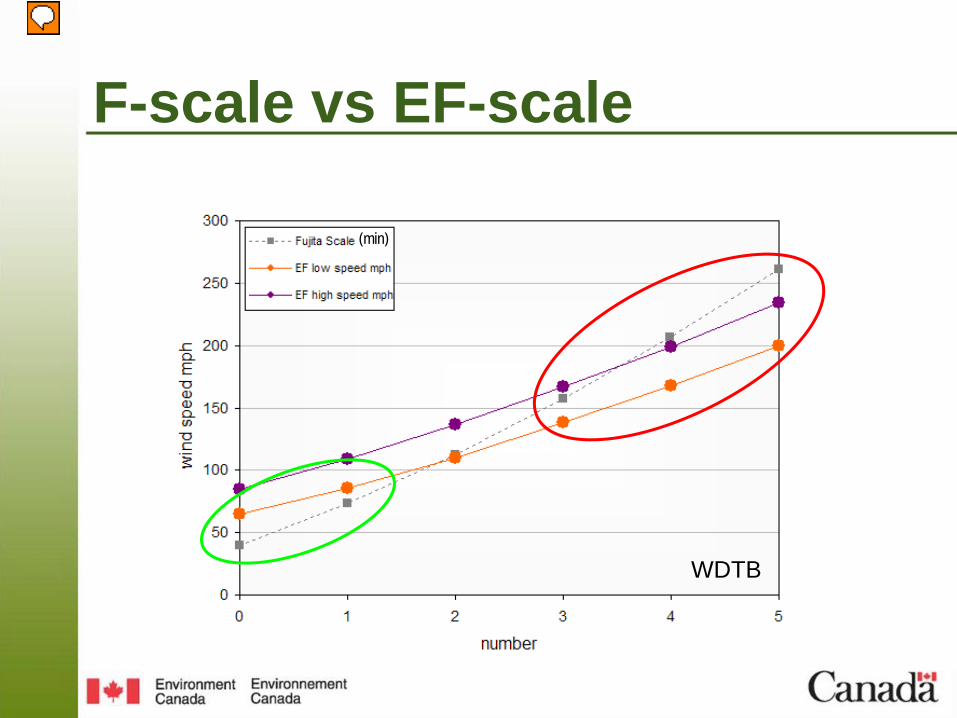
F-scale vs EF-scale
WDTB
(min)
Presenter
Presentation Notes
Numbers at bottom are F/EF-scale number EF-scale has higher wind speeds with lower end damage and lower wind speeds with higher end damage
F-scale vs EF-scale
• Though F-scale and EF-scale wind speeds are different, both still have the same damage scales
• Hence, ratings based on damage will be the same for older events rated with the F-scale and newer events rated with the EF-scale
• For example, the roof removed from a framed house is F/EF2, and a framed house swept from its foundation is F/EF5.
2011 Parallel Test at EC• Only two weak tornadoes remotely surveyed in Prairie Region, 17 tornadoes in Ontario from F0-F3• Some results:
• Many F/EF-scale ratings the same• Metal truss hydro towers: F2 vs EF3 (Watford, ON)• Double-brick house: F3 vs EF2 (Goderich, ON)• Snapped power poles: F1 vs EF2 (Shauvavon, SK)• Major differences in tree damage ratings• A number of missing DIs: farm silos / grain bins, heritage churches, sheds, etc.
An Additional Problem
Lower bound of EF0 too high
• EF0 lower bound = 65 mph = 105 km/h• 90 km/h threshold for damage wind gusts used for warning program• Even in US, 58 mph (93 km/h) threshold is used for severe thunderstorm warnings• So a wind speed gap is present; best if lower bound of EF0 changed to ~90 km/h
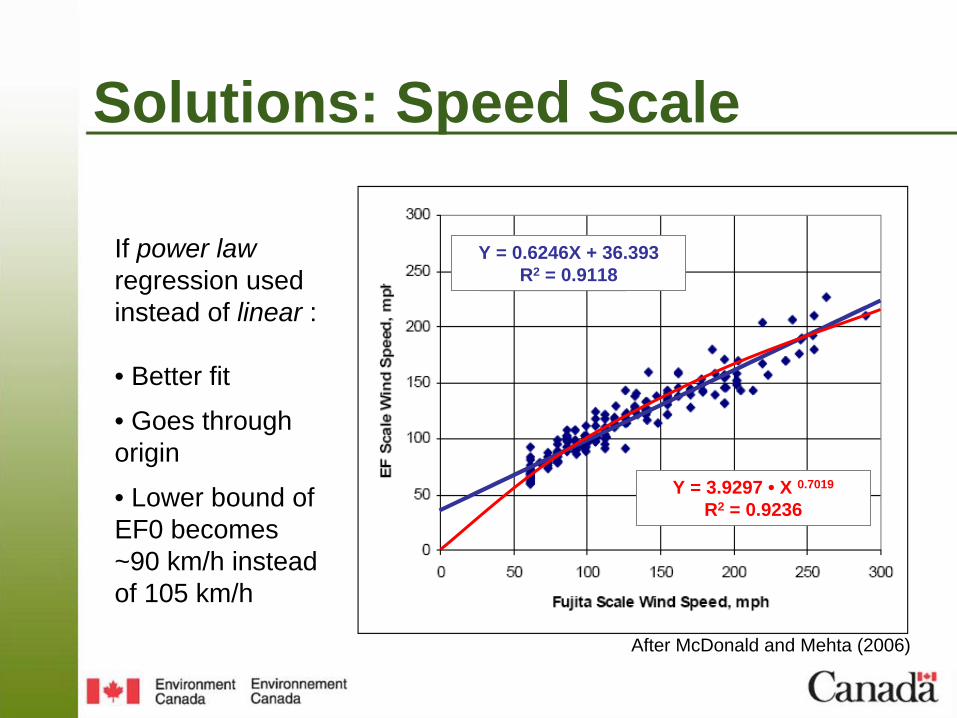
Solutions: Speed Scale
Y = 0.6246X + 36.393R2 = 0.9118
Y = 3.9297 • X 0.7019
R2 = 0.9236
If power law regression used instead of linear :
• Better fit
• Goes through origin
• Lower bound of EF0 becomes ~90 km/h instead of 105 km/h
After McDonald and Mehta (2006)
Enhanced Fujita Scale @ EC
Solutions: DI / DODs
New and Revised DI/DODs for the following:• Electrical Transmission Lines• Trees• Heritage Churches• Solid Masonry Houses (e.g. double brick)• Farm Silos / Grain Bins• Sheds, Fences or Lawn Furniture
31 Damage IndicatorsFarms / Residences
Commercial / retail structures
Schools
Professional buildings
Metal buildings / canopies
Towers / poles
New Canadian DIs!
Degrees of Damage (DoD)
DODs for Framed House DI (FR12), converted to km/h
DOD Damage Description EXP LB UB
1 Threshold of visible damage 105 85 129
2Loss of roof covering material (less than 20%), gutters and/or awning; loss of vinyl or metal siding 127 101 156
3 Broken glass in doors and windows 154 127 183
4
Uplift of roof deck and loss of significant roof covering material (20% or more); collapse of chimney; garage doors collapse inward; failure of porch or carport 156 130 187
5 Entire house shifts off foundation 195 166 227
6Large sections of roof structure removed; most walls remain standing 196 167 229
7 Exterior walls collapsed 212 182 246
8 Most walls collapsed, except small interior rooms 245 204 286
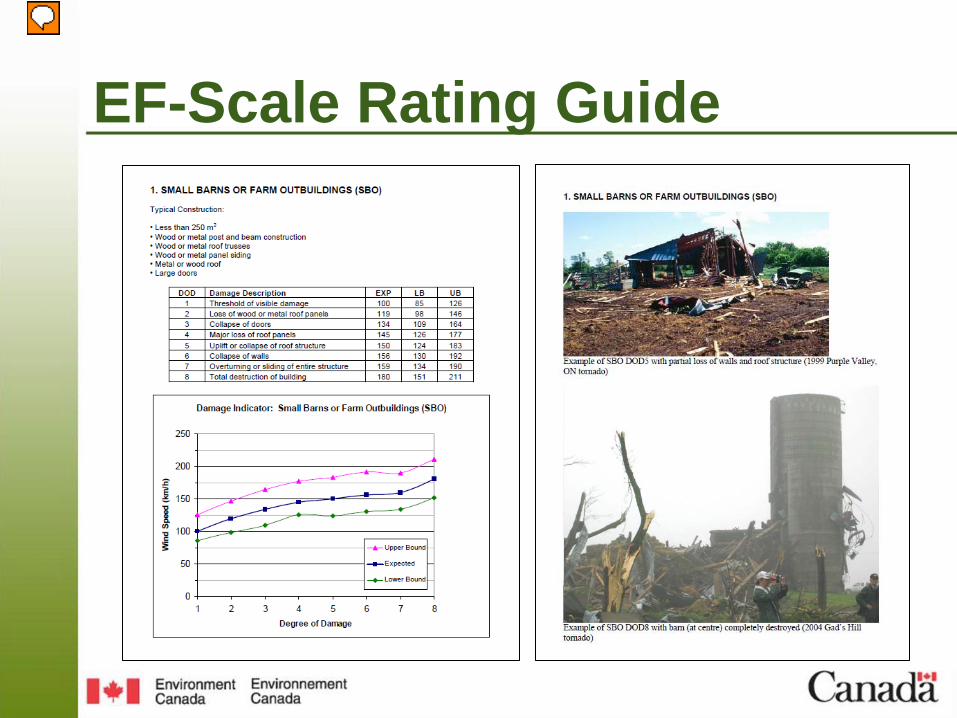
- EF-Scale rating guide distributed to all regions along with several other storm survey tools
Using the EF-scale1. Identify the appropriate Damage Indicator
2. Assess the Degree of Damage
3. Adjust the wind speed based on any deviations from typical construction quality and adjacent Damage Indicators
4. Assign a final EF-scale rating (e.g. EF2) based on the adjusted wind speed
5. Tornado rating is the max EF along path
Presenter
Presentation Notes
When using the F-scale to rate wind damage, one identifies the worst damage then chooses the F-scale category that best relates to the damage. Wind speeds are obtained using the upper and lower bounds of the F-scale category (e.g. roof removed from well-constructed frame house is low-end F2 with winds between 180 and 210 km/h). The procedure is somewhat different with the EF-scale. Here, one identifies the worst damage and relates that the DOD for the appropriate DI to get the expected wind speed. The wind speed can then be adjusted upward or downward. The adjusted wind speed is then compared to the EF-scale categories to get the appropriate EF-scale category and therefore rating (e.g. a roof removed from well-constructed frame house would give an EF2 rating with an ‘expected value’ wind speed near 200 km/h).
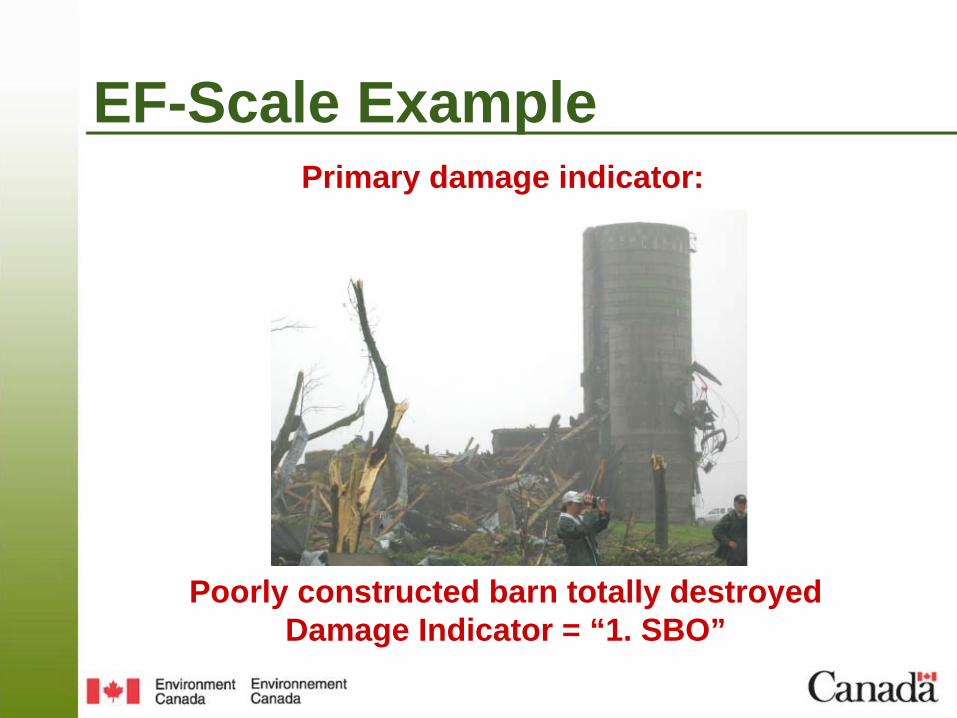
EF-Scale Example
Poorly constructed barn totally destroyedDamage Indicator = “1. SBO”
Primary damage indicator:
EF-Scale Example
Poorly constructed barn totally destroyedPrimary damage indicator:
Use lower bound of DOD8 due to poor construction
EF Rating
EF-Scale Wind Speed Rounded to 5 km/h
0 90 – 1301 135 – 1752 180 – 2203 225 – 2654 270 – 3105 315 or more
EF1
EF-Scale Example
Poorly constructed barn totally destroyedPrimary damage indicator:
151 km/h
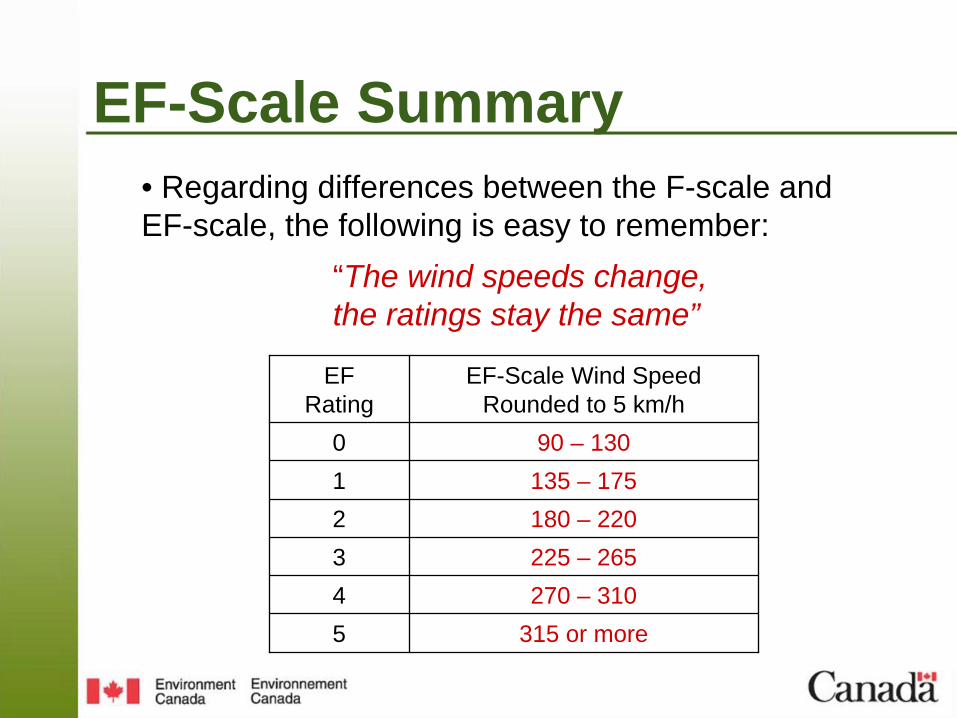
• Regarding differences between the F-scale and EF-scale, the following is easy to remember:
“The wind speeds change, the ratings stay the same”
EF Rating
EF-Scale Wind Speed Rounded to 5 km/h
0 90 – 1301 135 – 1752 180 – 2203 225 – 2654 270 – 3105 315 or more
EF-Scale Summary
Acknowledgements
• Patrick McCarthy (PASPC)• Ed Mahoney / Jim LaDue at NWS
Warning Decision Training Branch• Greg Kopp (Western University)
ReferencesFujita, T.T., 1981: Tornadoes and downbursts in the
context of generalized planetary scales. J. Atmos. Sci., 38, 1511-1534.
McDonald, J. and K. C. Mehta, 2006: A Recommendation for an Enhanced Fujita Scale (EF-Scale), Revision 2. Wind Science and Engineering Research Center, Texas Tech University, Lubbock, TX, 111 pp.
Newark, M. J., 1984: Canadian Tornadoes, 1950-1979. Atmos.-Ocean, 22, 343-353.
Phan, L.T. and E. Simiu, 1998: The Fujita tornado intensity scale: a critique based on observations of the Jarrell tornado of May 27, 1997. NIST Tech. Note 1426, U.S. Department of Commerce, Gaithersburg, MD, 20 pp.