58
EN
VI
RO
NM
EN
TA
L
HE
AL
TH
I
ND
IC
AT
OR
S
FO
R
EU
RO
PE
•
A
P
IL
OT
I
ND
IC
AT
OR
-B
AS
ED
R
EP
OR
T
World Health OrganizationRegional Office for Europe
Scherfigsvej 8, DK-2100 Copenhagen Ø, Denmark
Tel.: +45 39 17 17 17Fax: +45 39 17 18 18
E-mail: [email protected] site: www.euro.who.int
The Environment and Health Information System (EHIS) is a valuable tool for monitoring and evaluating the implementation and modification of policies. The crucial element of a harmonized EHIS is a set of indicators that allows for the monitoring of public health and its determinants. This report is the product of a pilot study completed within the WHO process of developing a methodology for a pan-European EHIS. It illustrates the application of indicators for integrated public health assessment and reporting in four topic areas: air pollution, noise, transport accidents, and water and sanitation. The report provides an insight into effective methods for integrating information from environmental monitoring and health surveillance, using the scientific knowledge of exposure–response associations. These methods can both help in answering key questions on the effect of policies on health and the environment, and provide guidance on future policies and actions. The report also demonstrates the limitations of routinely collected data and outlines the need for strengthening cooperation between international agencies and the Member States.
E82938
PilotCover.indd 1PilotCover.indd 1 27-05-2004 10:41:5027-05-2004 10:41:50

ENVIRONMENTAL HEALTH INDICATORS FOR EUROPE
A PILOT INDICATORBASED REPORT
June 2004

© World Health Organization 2004All rights reserved. The Regional Office for Europe of the World Health Organization welcomes requests for permission to reproduce or translate its publications, in part or in full. The designations employed and the presentation of the material in this publication do not imply the expression of any opinion whatsoever on the part of the World Health Organization concerning the legal status of any coun-try, territory, city or area or of its authorities, or concerning the delimitation of its frontiers or boundaries. Where the designation “country or area” appears in the headings of tables, it covers countries, territories, cities, or areas. Dotted lines on maps represent approximate border lines for which there may not yet be full agreement.The mention of specific companies or of certain manufacturers’ products does not imply that they are endorsed or recommended by the World Health Organization in preference to others of a similar nature that are not men-tioned. Errors and omissions excepted, the names of proprietary products are distinguished by initial capital letters.The World Health Organization does not warrant that the information contained in this publication is complete and correct and shall not be liable for any damages incurred as a result of its use. The views expressed by authors or editors do not necessarily represent the decisions or the stated policy of the World Health Organization.
Address requests about publications of the WHO Regional Office to:
• by e-mail [email protected] (for copies of publications) [email protected] (for permission to reproduce them) [email protected] (for permission to translate them)
• by post Publications WHO Regional Office for Europe Scherfigsvej 8 DK-2100 Copenhagen Ø, Denmark
ABSTRACTThe Environment and Health Information System (EHIS) is a valuable tool for monitoring and evaluating the implementation and modification of policies. The crucial element of a harmonized EHIS is a set of indicators that allows for the monitoring of public health and its determinants. This report is the product of a pilot study completed within the WHO process of developing a methodol-ogy for a pan-European EHIS. It illustrates the application of indicators for inte-grated public health assessment and reporting in four topic areas: air pollution, noise, transport accidents, and water and sanitation. The report provides an insight into effective methods for integrating information from environmental monitoring and health surveillance, using the scientific knowledge of exposure–response associations. These methods can both help in answering key questions on the effect of policies on health and the environment, and provide guidance on future policies and actions. The report also demonstrates the limitations of routinely collected data and outlines the need for strengthening cooperation be-tween international agencies and the Member States.
Keywords
ENVIRONMENTAL HEALTH
ENVIRONMENTALEXPOSURE
HEALTH STATUS INDICATORS
INFORMATION SYSTEMS
ENVIRONMENTAL MONITORING - METHODS
EUROPE
E82938

CONTENTS
Foreword 1
Executive summary 2
1 Introduction 4
The need for EHIS in policy-making. The approach of the Regional Office.
The process of developing EH indicators for Europe.
2 Format of the report 8
3 Air pollution 9
Causal chain and indicators. Potential for health benefits from lowering
pollution. Trends and international comparisons.
Potential impact of public health policy.
4 Noise 16
Causal chain and indicators. Potential for health benefits from
reducing noise exposure. Trends and international comparisons.
Potential impact of public health policy.
5 Transport accidents 23
Causal chain and indicators. Potential for health benefits from
improving road safety. Trends and international comparisons.
Potential impact of public health policy.
6 Water and sanitation 29
Causal chain and indicators. Potential for health benefits from
safe water. Trends and international comparisons.
Potential impact of public health policy.
7 Conclusion 36
Feasibility. Usefulness and added value. Future developments.
Annex 1 40
Overall feasibility rating of core indicators.
Annex 2 41
Software tools: EuroIndy and ENHIS.
Annex 3 44
Example of fact sheet.

Nune Bakunts a
State Hygienic and Anti-
epidemic Inspection, Yerevan,
Armenia
Hristina Mileva a
Ministry of Health, Sofia,
Bulgaria
Ružena Kubínová a
National Institute of Public
Health, Prague, Czech Republic
Vladimíra Puklová a
National Institute of Public
Health, Prague, Czech Republic
Hans-Guido Mücke a, b
Federal Environmental Agency
(WHO collaborating centre),
Air Quality Management,
Berlin, Germany
Angela Queste c
Institute for Hygiene and Public
Health, University of Bonn,
Bonn, Germany
Jürgen Thelen a
Federal Environmental Agency
(WHO collaborating centre),
Air Quality Management,
Berlin, Germany
Mihály Kádár a
National Institute of
Environmental Health,
Budapest, Hungary
Tibor Málnási a
National Institute of
Environmental Health,
Budapest, Hungary
Anna Páldy a
National Institute of
Environmental Health,
Budapest, Hungary
Piero Borgia a
Public Health Agency of
the Lazio Region, Rome, Italy
Sara Farchi c
Public Health Agency of
the Lazio Region, Rome, Italy
Aida Laukaitiene a
State Public Health Centre,
Vilnius, Lithuania
Ingrida Zurlytè a
State Public Health Centre,
Vilnius, Lithuania
Diane Houweling a, c
National Institute of Public
Health and the Environment
(RIVM), Bilthoven,
Netherlands
Kees Huijsmans a
National Institute of Public
Health and the Environment
(RIVM), Bilthoven,
Netherlands
Anne Knol a
National Institute of Public
Health and the Environment
(RIVM), Bilthoven,
Netherlands
Brigit Staatsen a, b
National Institute of Public
Health and the Environment
(RIVM), Bilthoven,
Netherlands
Øystein Solevåg c
Bergfald & Co., Eidsnes,
Norway
Dorota Jarosinska c
Institute of Occupational
Medicine and Environmental
Health, Sosnowiec, Poland
Bogdan Wojtyniak b, c
National Institute of Hygiene,
Warsaw, Poland
Alexandra Cucu a
Ministry of Health, Bucharest,
Romania
Adriana Galan a
Institute of Public Health,
Bucharest, Romania
Milada Estokova-
Mikulčikova a
Public Health Institute,
Bratislava, Slovakia
María José Carroquino a, b ,c
Instituto de Salud Carlos III
(CISATER), Madrid, Spain
Luis Soldevilla Benito a
Instituto de Salud Carlos III
(CISATER), Madrid, Spain
Antonis Georgellis b, c
Occupational and
Environmental Health,
Stockholm County Council,
Stockholm, Sweden
Mats Rosenlund b
Occupational and
Environmental Health,
Stockholm County Council,
Stockholm, Sweden
Sonja Kahlmeier a
Institute of Social and
Preventive Medicine, Basel
University, Basel, Switzerland
David Kay c
University of Wales, Ceredigion,
United Kingdom
Maya Sadeh a
London School of Hygiene &
Tropical Medicine, London,
United Kingdom
Paul Wilkinson b, c
London School of Hygiene &
Tropical Medicine, London,
United Kingdom
Project coordination
and management
Dafina Dalbokova
Rokho Kim
Michal Krzyzanowski
WHO European Centre
for Environment and Health,
Bonn, Germany
CONTRIBUTORS
a. National pilot study team
or assistanceb. Drafting group c. Editorial group

1
Information is an essential tool for public health policy- and decision-making.
WHO, and its Regional Office for Europe in particular, is making a substantial
effort to help Member States in improving and sharing information on health and
its determinants. This is an important way of assisting countries to select policy
options that best suit their needs and to monitor the effectiveness of their actions.
The policy-relevance, availability and comparability of information on environ-
ment and health still need to be improved in the Region. This is why the Regional
Office, together with the Member States and several international organizations,
is working towards a comprehensive European environment and health informa-
tion system that will allow priorities to be set on the basis of evidence, thus en-
hancing access to information and facilitating communication with the public.
This document presents examples of the application of environmental health in-
dicators, which are important components of the information system. They are
based on data from several Member States and on knowledge of causal chains
between health and selected environmental factors and actions affecting environ-
mental determinants of health. A large group of experts from the Member States,
coordinated by the team from the Regional Office, prepared this document. I am
most thankful for their contributions. I hope that this work, and the further dy-
namic development of the environment and health information system, will
strengthen our capacity for action in improving the health of the European popu-
lation.
Marc Danzon
WHO Regional Director for Europe
FOREWORD

2
This report is the result of a pilot study of the WHO project on environmental
health (EH) indicators for the WHO European Region and, in particular, of the
illustrative application of the indicators in four topic areas: air pollution, noise,
transport accidents, and water and sanitation. Using a standardized approach to
describe complex EH problems and policy responses, this analysis demonstrates
the usefulness of indicators for assessment and reporting. It also demonstrates the
limitations of routinely collected data.
The pilot study is part of the process of developing an Environment and Health
Information System (EHIS) by the WHO Regional Office for Europe in collabora-
tion with a number of Member States, the European Environment Agency and the
European Commission (EC). The process comprises various activities, from the
selection of policy-relevant issues and the development of indicator methodology
to feasibility and pilot testing, resulting in the selection of a core set of indica-
tors that reflect the links between health and the environment and can be applied
using existing data. Analysis and reporting methods have also been developed
throughout the process, together with tools and methods for extracting relevant
information from existing national statistical, monitoring and surveillance sys-
tems. The core set of indicators focuses on 10 thematic environmental areas of
relevance to health and uses the DPSEEA (driving forces–pressures–state–expo-
sure–effects–actions) model as a conceptual framework.
On each of the selected topics, the report provides a brief overview of the problem,
assesses the potential for health benefits from policies and interventions, and gives
a short explanation of the core indicators. Temporal trends and intercountry vari-
ability of environmental indicators relevant to health are assessed in a structured
way, providing information on the EH situation and key environmental determi-
nants, public health policy and interventions, and the potential impact on health.
Case studies illustrate the effects of selected interventions on reducing morbidity
and mortality. The information is presented graphically whenever possible to fa-
cilitate communication with different user groups.
Analysis of indicators of the effects on health of exposure to air pollution demon-
strates the potential for a significant improvement in health from a reduction in
air pollution. The core set of indicators covers most of the links in the DPSEEA
chain, ranging from energy consumption, intensity of motor transport, pollutant
emissions and ambient air pollution concentrations to health effects, and includes
action indicators. This extent of the information is useful in drawing conclusions
relevant to policy-making.
EXECUTIVE SUMMARY
3
Analysis of noise-related indicators suggests the need for better harmonization of
assessment methods among Member States. A case study from the Netherlands
shows that the ability to track certain information on environmental noise and its
determinants has been used to support decision-making for reducing the adverse
effects on health.
Intercountry differences in the definition of basic data can also make difficult the
direct comparison of indicators related to transport accidents. Nevertheless, as-
sessing trends can provide a valuable indication for use in policy-making. Joint
analysis of several indicators gives insights into the links between health and de-
terminants of traffic intensity, pointing to the role of actions in preventing acci-
dents and related injuries.
Analysis of the set of core indicators for water and sanitation shows that they are
useful in monitoring the links between water supply/sanitation and public health
across Europe. They convey information that can be used to support national poli-
cies and that is useful in international comparisons. The added value of indicators
is recognized in monitoring the effectiveness of EC Directives as well as national
laws and regulations aimed at improving water management. Joint analysis of the
indicators suggests that the true incidence of waterborne diseases is underesti-
mated in the participating countries.
This report shows that indicators are powerful communication tools for policy-
makers, experts and the general public. When fed into the policy-making process,
they can evaluate and demonstrate the effectiveness of environment and health
policies, thus facilitating the setting of priorities among competing policies. If im-
plemented throughout Europe, they would provide evidence that could be used
alongside published epidemiological research to inform policy development at
national and international levels.
The report suggests that the level of comparability of indicators across Europe
is currently limited, often because of deficiencies in surveillance and reporting
methodologies in some countries. The value of EHIS and its ability to support
environment and health decision-making can be increased by progressive devel-
opment and harmonization of data collection and processing, aiming at improv-
ing comparability of information among the Member States. The analysis demon-
strates the need for cooperation between international agencies and the Member
States if that objective is to be attained.

4
The Fourth Ministerial Conference on Environment and Health, to take place in
Budapest in June 2004, is a continuation of the process of integrating environment
and health initiated by the WHO Regional Office for Europe. The Conference
will review progress made on environment and health in Europe since the first
conference in 1989, with special attention to the current situation in the newly
independent states of the former USSR. The Conference will address issues of in-
creasing concern for health, such as housing and energy policies, and indicate the
way forward through the adoption of a Children’s Environment and Health Action
Plan for Europe. A significant part of the Conference will be devoted to strength-
ening the policy-making base through harmonized tools and approaches for the
entire European Region of WHO. The Environment and Health Information
System (EHIS) is one of the crucial policy tools that will be presented for political
endorsement.
This report is the product of a pilot study within the WHO project to develop en-
vironmental health (EH) indicators for the European Region. The aim of the pilot
study was to test the feasibility and demonstrate the usefulness of WHO indica-
tors as a tool for EH decision-making throughout Europe. This report illustrates
the application of indicators in four topic areas: air pollution, noise, transport ac-
cidents, and water and sanitation.
1. INTRODUCTION
Fig. 1.1. Contribution of EHIS to policy formulation and evaluation
IMPLEMENTATION
FORMULATIONPERFORMANCE
EVALUATION AND MONITORING
EHIS
POLICY

5
1 Albania, Armenia,
Bulgaria, Czech Republic,
Estonia, Finland,
Germany, Hungary, Latvia,
Lithuania, Netherlands,
Poland, Romania, Russian
Federation (Sverdlovsk
Region), Slovakia, Spain,
Switzerland.
2 Austria, Belgium,
Denmark, France,
Finland, Germany, Italy,
Netherlands, Portugal,
Spain, Sweden.
1.1 THE NEED FOR EHIS IN POLICYMAKINGEHIS is regarded as a valuable tool for monitoring and evaluating the implemen-
tation and modification of policies, by providing systematically collected and ana-
lysed evidence (Fig. 1.1). The objective is to develop a harmonized and evidence-
based information system that will serve policy-makers at European, national and
local levels and be accessible by the media and the general public. In addition,
EHIS will contribute to an integrated assessment of progress within the broader
objective of reporting on sustainable development in Europe.
1.2 THE APPROACH OF THE REGIONAL OFFICECrucial to developing a pan-European EHIS is a set of indicators to measure the
situation and changes over time. Traditional indicators often show only effects
on health or the environment. To be policy-relevant, indicators must monitor the
linkages between environmental changes and human health effects and be based
on scientific evidence. The indicators must also ensure effective monitoring of
policies and actions and evaluation of their potential effects on health.
The Regional Office’s approach to this specification was to adopt the DPSEEA
(driving forces–pressures–state–exposure–effects–actions) model (Box 1.1). The
detailed methodology for individual indicators was developed by experts and re-
viewed at working group meetings involving a wide range of multidisciplinary
expertise and several Member States. A set of “core” EH indicators in 10 thematic
areas was evaluated for feasibility by 15 countries (see Annex 1).
1.3 THE PROCESS OF DEVELOPING EH INDICATORS FOR EUROPE The main tools and methods for EH indicators were developed and tested through
internationally coordinated work, in the framework of the Regional Office projects
on EH indicators. The work was carried out in collaboration with several Member
States, the European Environment Agency (EEA) and the Health and Consumer
Protection Directorate-General of the European Commission (EC) within the
framework of the development of EH indicators for European Union (EU) coun-
tries. Between 1999 and 2003, project activities aimed at combining diverse re-
sults, experiences and analyses into a comprehensive and practical framework.
Several countries1 provided active input and partnership throughout the pilot
project. Experts in specific EH areas from many countries are also contributing to
developing the methodology.
Project activities include the development of a methodology for the indicators fol-
lowing a review of national environment and health action plan (NEHAPs), a fea-
sibility study to reach consensus on a “core” set of indicators, and pilot testing of
the indicator set coupled with analysis and reporting methods. Fifteen countries
evaluated the overall feasibility and usefulness of the proposed methodology (see
Annex 1). Within the continuing project on the development of EH indicators for
EU countries, implemented in partnership with 11 of them,2 the indicators were
also checked for compatibility vis-à-vis EC legislation. Software tools to facilitate
data collection and a prototype of a web tool for organizing and publishing the EH
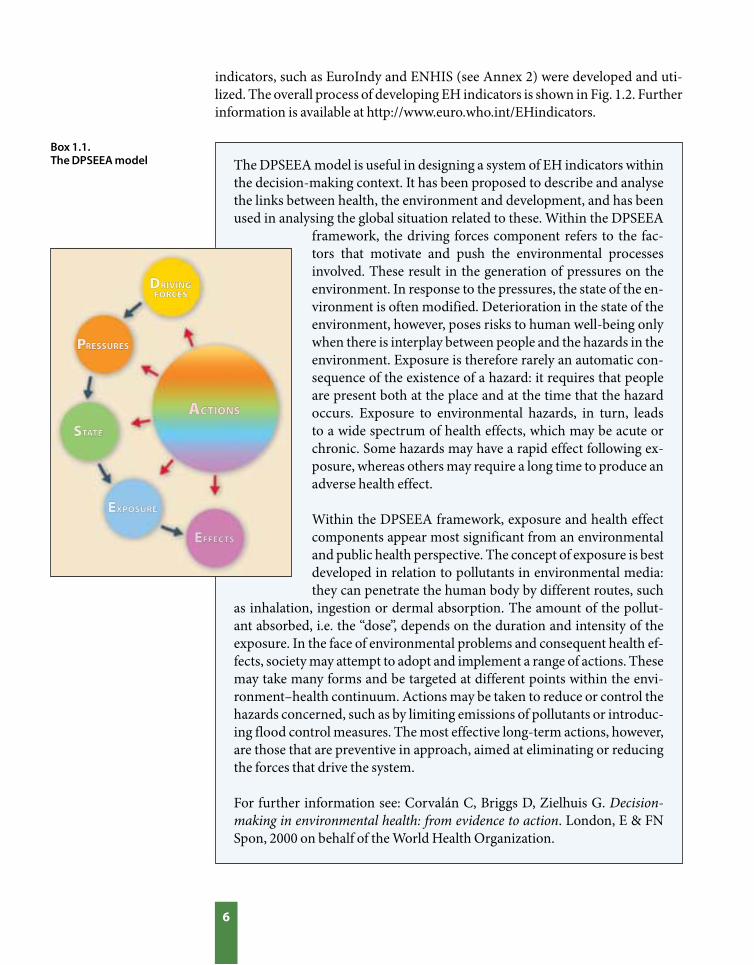
Box 1.1. The DPSEEA model
PPRESSURESRESSURES
STATETATE
EXPOSUREXPOSURE
EFFECTSFFECTS
ACTIONSCTIONS
DRIVING RIVING FORCESFORCES
6
The DPSEEA model is useful in designing a system of EH indicators within
the decision-making context. It has been proposed to describe and analyse
the links between health, the environment and development, and has been
used in analysing the global situation related to these. Within the DPSEEA
indicators, such as EuroIndy and ENHIS (see Annex 2) were developed and uti-
lized. The overall process of developing EH indicators is shown in Fig. 1.2. Further
information is available at http://www.euro.who.int/EHindicators.
framework, the driving forces component refers to the fac-
tors that motivate and push the environmental processes
involved. These result in the generation of pressures on the
environment. In response to the pressures, the state of the en-
vironment is often modified. Deterioration in the state of the
environment, however, poses risks to human well-being only
when there is interplay between people and the hazards in the
environment. Exposure is therefore rarely an automatic con-
sequence of the existence of a hazard: it requires that people
are present both at the place and at the time that the hazard
occurs. Exposure to environmental hazards, in turn, leads
to a wide spectrum of health effects, which may be acute or
chronic. Some hazards may have a rapid effect following ex-
posure, whereas others may require a long time to produce an
adverse health effect.
Within the DPSEEA framework, exposure and health effect
components appear most significant from an environmental
and public health perspective. The concept of exposure is best
developed in relation to pollutants in environmental media:
they can penetrate the human body by different routes, such
as inhalation, ingestion or dermal absorption. The amount of the pollut-
ant absorbed, i.e. the “dose”, depends on the duration and intensity of the
exposure. In the face of environmental problems and consequent health ef-
fects, society may attempt to adopt and implement a range of actions. These
may take many forms and be targeted at different points within the envi-
ronment–health continuum. Actions may be taken to reduce or control the
hazards concerned, such as by limiting emissions of pollutants or introduc-
ing flood control measures. The most effective long-term actions, however,
are those that are preventive in approach, aimed at eliminating or reducing
the forces that drive the system.
For further information see: Corvalán C, Briggs D, Zielhuis G. Decision-
making in environmental health: from evidence to action. London, E & FN
Spon, 2000 on behalf of the World Health Organization.
7
Policies, common problems,
balanced picture
CORE INDICATOR
SETREFINED
INDICATOR SET
Data systems, validity,
health relevance
Feasibility study
Pilot study EH assessment and reporting
FOURTH FOURTH MINISTERIAL MINISTERIAL
CONFERENCE ONCONFERENCE ONENVIRONMENT ENVIRONMENT
ANDANDHEALTH FOR HEALTH FOR
ENDORSEMENTENDORSEMENT
INDIC
ATOR R
EPORT
GUIDELI
NES
SELECTING ISSUES
EXPERT
MEETINGS
THEORY
PRACTICE
INITIALINDICATORPROPOSAL
1999 2000 2001 2002 2003 2004
3 Armenia, Bulgaria, Czech
Republic, Germany,
Hungary, Lithuania,
Netherlands, Romania,
Slovakia, Spain,
Switzerland.
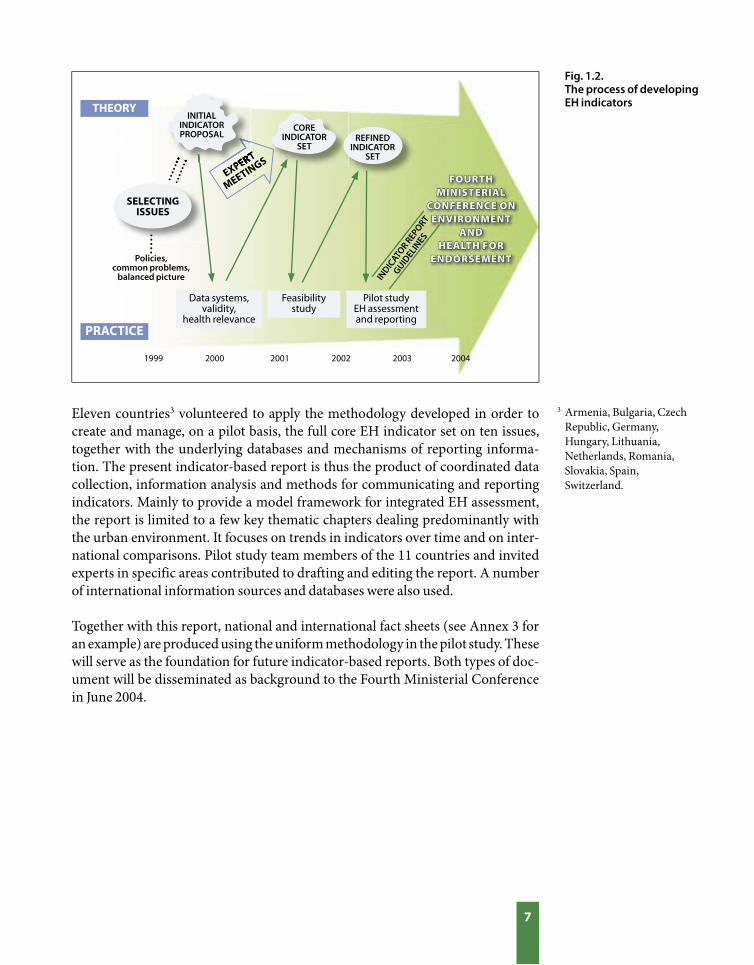
Fig. 1.2. The process of developing EH indicators
Eleven countries3 volunteered to apply the methodology developed in order to
create and manage, on a pilot basis, the full core EH indicator set on ten issues,
together with the underlying databases and mechanisms of reporting informa-
tion. The present indicator-based report is thus the product of coordinated data
collection, information analysis and methods for communicating and reporting
indicators. Mainly to provide a model framework for integrated EH assessment,
the report is limited to a few key thematic chapters dealing predominantly with
the urban environment. It focuses on trends in indicators over time and on inter-
national comparisons. Pilot study team members of the 11 countries and invited
experts in specific areas contributed to drafting and editing the report. A number
of international information sources and databases were also used.
Together with this report, national and international fact sheets (see Annex 3 for
an example) are produced using the uniform methodology in the pilot study. These
will serve as the foundation for future indicator-based reports. Both types of doc-
ument will be disseminated as background to the Fourth Ministerial Conference
in June 2004.
8
2. FORMAT OF THE REPORT
Air pollution Passenger transport demand by mode of transport Driving forces
Road transport fuel consumption Driving forces
Emissions of air pollutants Pressures
Exposure to ambient air pollutants (urban) Exposure
Years of life expectancy lost in one year Effects
Noise Population annoyance from noise Effects
Application of regulations, restrictions and noise abatement measures Actions
Transport accidents Mortality from transport accidents Effects
Road accident injuries Effects
Water and sanitation Urban wastewater treatment Pressures
Drinking-water exceedences of microbiological guidelines State
Microbiological quality of recreational waters State
Access to piped, regulated drinking-water Exposure
Outbreaks of waterborne diseases Effects
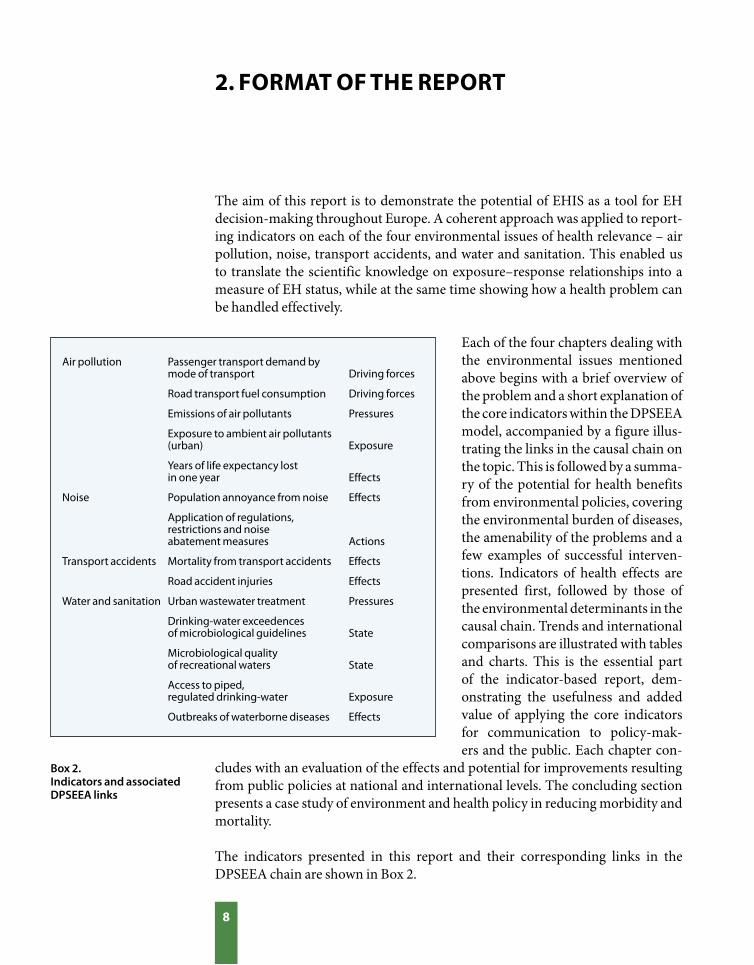
The aim of this report is to demonstrate the potential of EHIS as a tool for EH
decision-making throughout Europe. A coherent approach was applied to report-
ing indicators on each of the four environmental issues of health relevance – air
pollution, noise, transport accidents, and water and sanitation. This enabled us
to translate the scientific knowledge on exposure–response relationships into a
measure of EH status, while at the same time showing how a health problem can
be handled effectively.
Each of the four chapters dealing with
the environmental issues mentioned
above begins with a brief overview of
the problem and a short explanation of
the core indicators within the DPSEEA
model, accompanied by a figure illus-
trating the links in the causal chain on
the topic. This is followed by a summa-
ry of the potential for health benefits
from environmental policies, covering
the environmental burden of diseases,
the amenability of the problems and a
few examples of successful interven-
tions. Indicators of health effects are
presented first, followed by those of
the environmental determinants in the
causal chain. Trends and international
comparisons are illustrated with tables
and charts. This is the essential part
of the indicator-based report, dem-
onstrating the usefulness and added
value of applying the core indicators
for communication to policy-mak-
ers and the public. Each chapter con-
cludes with an evaluation of the effects and potential for improvements resulting
from public policies at national and international levels. The concluding section
presents a case study of environment and health policy in reducing morbidity and
mortality.
The indicators presented in this report and their corresponding links in the
DPSEEA chain are shown in Box 2.
Box 2. Indicators and associated DPSEEA links
9
MONITORING • LEGIS
LAT
ION
• T
AX
PO
LIC
Y • TECHNOLOGY
! Passenger-km! Fuel use
! Emissions to air
! Exposure to pollution
! Mortality! YLL
PP
S
E
E
ACTIONSCTIONS
D
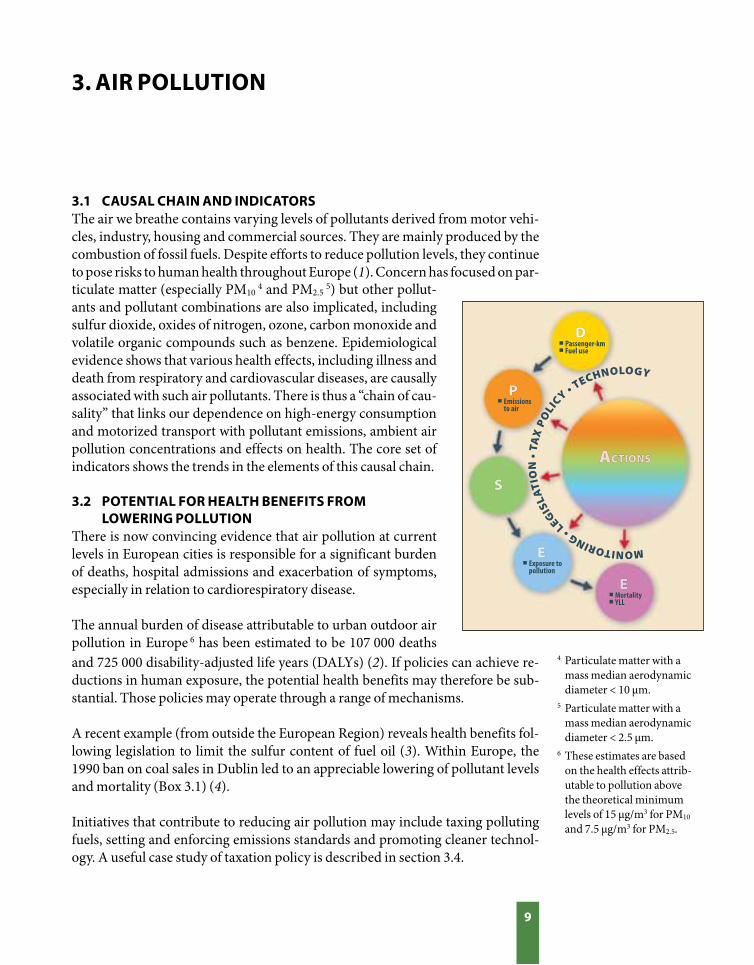
3.1 CAUSAL CHAIN AND INDICATORSThe air we breathe contains varying levels of pollutants derived from motor vehi-
cles, industry, housing and commercial sources. They are mainly produced by the
combustion of fossil fuels. Despite efforts to reduce pollution levels, they continue
to pose risks to human health throughout Europe (1). Concern has focused on par-
3. AIR POLLUTION
and 725 000 disability-adjusted life years (DALYs) (2). If policies can achieve re-
ductions in human exposure, the potential health benefits may therefore be sub-
stantial. Those policies may operate through a range of mechanisms.
A recent example (from outside the European Region) reveals health benefits fol-
lowing legislation to limit the sulfur content of fuel oil (3). Within Europe, the
1990 ban on coal sales in Dublin led to an appreciable lowering of pollutant levels
and mortality (Box 3.1) (4).
Initiatives that contribute to reducing air pollution may include taxing polluting
fuels, setting and enforcing emissions standards and promoting cleaner technol-
ogy. A useful case study of taxation policy is described in section 3.4.
ticulate matter (especially PM10 4 and PM2.5
5) but other pollut-
ants and pollutant combinations are also implicated, including
sulfur dioxide, oxides of nitrogen, ozone, carbon monoxide and
volatile organic compounds such as benzene. Epidemiological
evidence shows that various health effects, including illness and
death from respiratory and cardiovascular diseases, are causally
associated with such air pollutants. There is thus a “chain of cau-
sality” that links our dependence on high-energy consumption
and motorized transport with pollutant emissions, ambient air
pollution concentrations and effects on health. The core set of
indicators shows the trends in the elements of this causal chain.
3.2 POTENTIAL FOR HEALTH BENEFITS FROM LOWERING POLLUTIONThere is now convincing evidence that air pollution at current
levels in European cities is responsible for a significant burden
of deaths, hospital admissions and exacerbation of symptoms,
especially in relation to cardiorespiratory disease.
The annual burden of disease attributable to urban outdoor air
pollution in Europe 6 has been estimated to be 107 000 deaths 4 Particulate matter with a
mass median aerodynamic
diameter < 10 µm.
5 Particulate matter with a
mass median aerodynamic
diameter < 2.5 µm.
6 These estimates are based
on the health effects attrib-
utable to pollution above
the theoretical minimum
levels of 15 µg/m3 for PM10
and 7.5 µg/m3 for PM2.5.
10
120
100
80
60
40
20
0
60
50
40
30
20
10
0
Pollu
tant
con
cent
ratio
n (µ
g/m
3 )
Sulfur dioxide
1984
1985
1986
1987
1988
1989
1990
1991
1992
1993
1994
1995
1996
1997
13
12
11
10
9
8
7
6
5
4
3
Mor
talit
y p
er 1
00 0
00 p
opul
atio
n
Cardiovascular deaths
Black smoke Total deaths
1984
1985
1986
1987
1988
1989
1990
1991
1992
1993
1994
1995
1996
1997
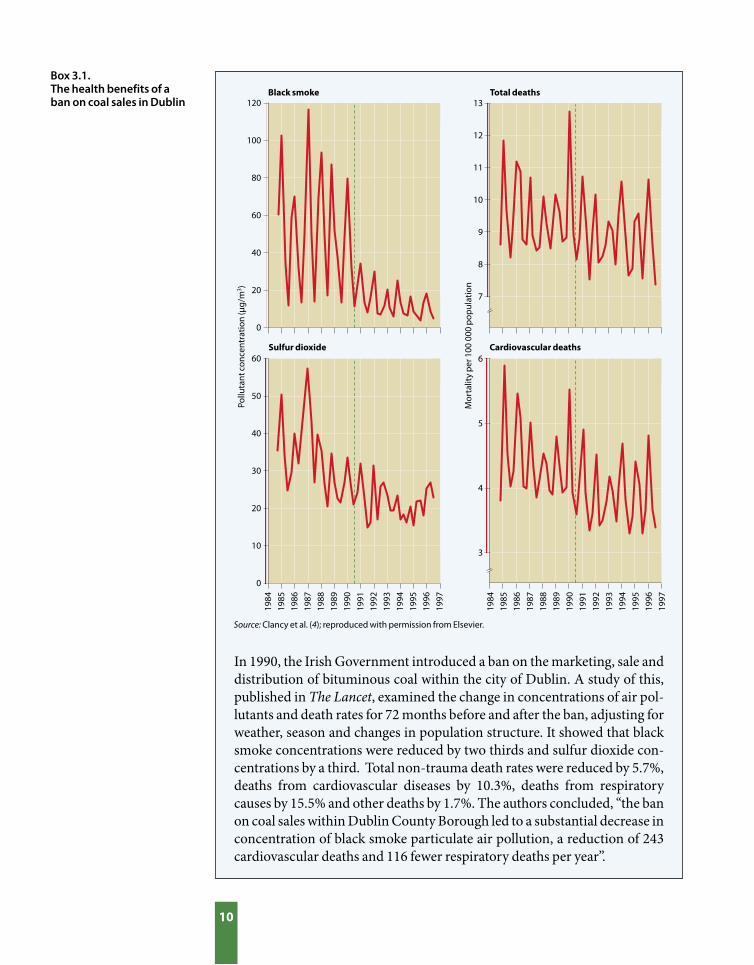
In 1990, the Irish Government introduced a ban on the marketing, sale and
distribution of bituminous coal within the city of Dublin. A study of this,
published in The Lancet, examined the change in concentrations of air pol-
lutants and death rates for 72 months before and after the ban, adjusting for
weather, season and changes in population structure. It showed that black
smoke concentrations were reduced by two thirds and sulfur dioxide con-
centrations by a third. Total non-trauma death rates were reduced by 5.7%,
deaths from cardiovascular diseases by 10.3%, deaths from respiratory
causes by 15.5% and other deaths by 1.7%. The authors concluded, “the ban
on coal sales within Dublin County Borough led to a substantial decrease in
concentration of black smoke particulate air pollution, a reduction of 243
cardiovascular deaths and 116 fewer respiratory deaths per year”.
Source: Clancy et al. (4); reproduced with permission from Elsevier.
Box 3.1. The health benefits of a ban on coal sales in Dublin

11
Czech Republic 19.1 837 (220–1455)
Germany 17.3 700 (184–1216)
Hungary 16.1 830 (218–1444)
Israel 24.7 711 (187–1232)
Netherlands 19.7 773 (203–1343)
Romania 23.5 1140 (300–1979)
Spain 21.2 861 (226–1494)
Switzerland 17.0 552 (145– 959)
Country Population-weighted PM2.5 concentration (µg/m3)
Years of life expectancy lost in one year per 100 000 population (95% CI)
3.3 TRENDS AND INTERNATIONAL COMPARISONSHealth impactsEstimates of the burden of ill-health related to air pollution in pilot countries are
shown in Table 3.3.1. The measure of health impact used here is years of life ex-
pectancy lost in one year per 100 000 population. The estimates used local pollu-
tion data and evidence from published epidemiological studies, and they repre-
sent the health effects attributable to exposures to PM2.5 above 7.5 µg/m3.
Table 3.3.1. The health effects of exposure to PM2.5 in countries participating in the pilot studySource: EuroIndy and the EEA air quality information system (AirBase)
The loss of life expectancy depends not only on pollution levels but also on the
underlying prevalence of cardiorespiratory disease and the age distribution of the
population. Although the estimated burdens for each country are imprecise, the
figures indicate in broad terms the scope for improving health through air pollu-
tion measures and the general relationship between ambient concentrations and
health burden.
Population exposure to airborne particles and its determinantsTrends in air pollution and its determinants over recent years – particularly vehi-
cle and fuel use and emission levels – have been generally mixed or disappointing
(Fig. 3.3.1–3.3.4). The situation can be summarized as follows.
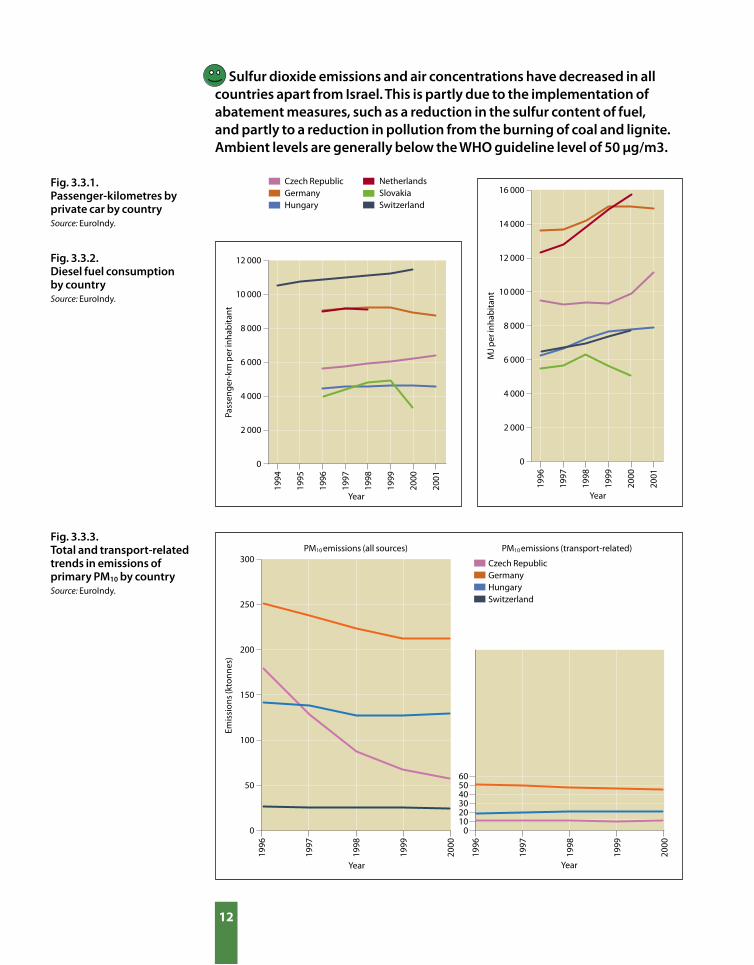
The number of passenger-kilometres by private vehicles has increased steadily in most countries (Fig. 3.3.1) while passenger-kilometres by bus and train are showing mixed trends.
Total consumption of diesel fuel and consumption by road transport are increasing across Europe (Fig. 3.3.2).
Although particulate emissions from energy and industry are generally decreasing, transport-related emissions (usually more important for the exposure of people in urban settings) show a mixed picture (though a significant fall in Germany) (Fig. 3.3.3).
12
300
250
200
150
100
50
0
PM10 emissions (all sources)
605040302010
0
Emis
sion
s (k
tonn
es)
PM10 emissions (transport-related)
1996
1997
1998
1999
2000
Czech RepublicGermanyHungarySwitzerland
Year
1996
1997
1998
1999
2000
Year
12 000
10 000
8 000
6 000
4 000
2 000
0
Pass
enge
r-km
per
inha
bita
nt
Year
16 000
14 000
12 000
10 000
8 000
6 000
4 000
2 000
0
MJ p
er in
hab
itant
Year
1994
1995
1996
1997
1998
1999
2000
2001
1996
1997
1998
1999
2000
2001
Czech RepublicGermanyHungary
NetherlandsSlovakiaSwitzerland
Fig. 3.3.3. Total and transport-related trends in emissions of primary PM10 by countrySource: EuroIndy.
Sulfur dioxide emissions and air concentrations have decreased in all countries apart from Israel. This is partly due to the implementation of abatement measures, such as a reduction in the sulfur content of fuel, and partly to a reduction in pollution from the burning of coal and lignite. Ambient levels are generally below the WHO guideline level of 50 µg/m3.
Fig. 3.3.1. Passenger-kilometres by private car by countrySource: EuroIndy.
Fig. 3.3.2. Diesel fuel consumption by countrySource: EuroIndy.
13
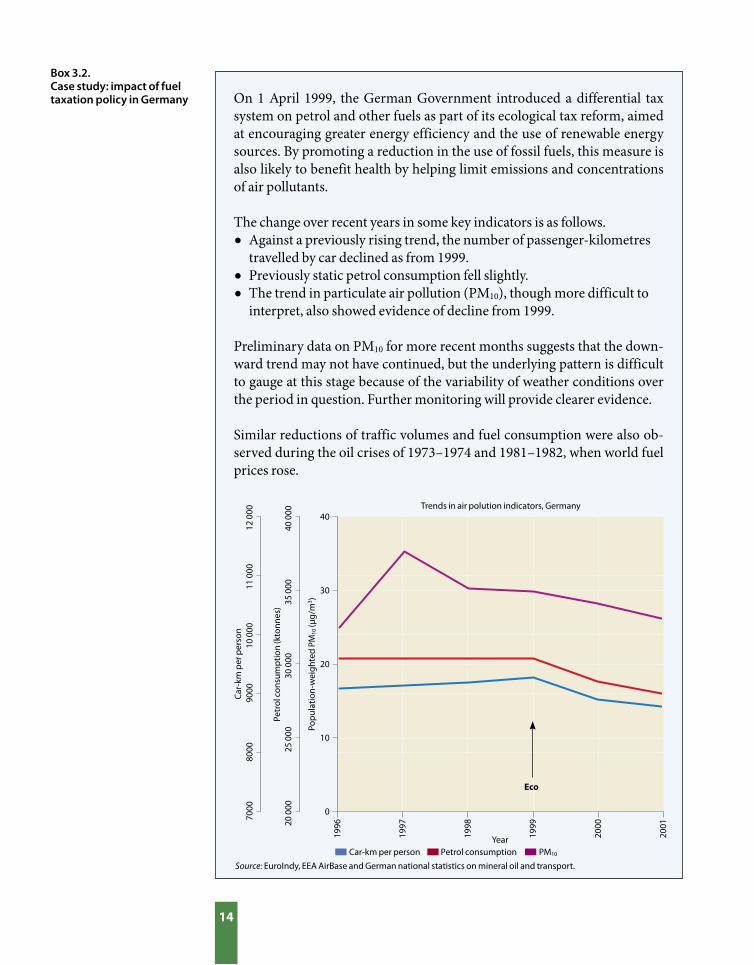
Fig. 3.4.1. Loss of life expectancy theoretically preventable in one year by a 10% reduction in PM2.5
Source: EuroIndy and the EEA air quality information system (AirBase)
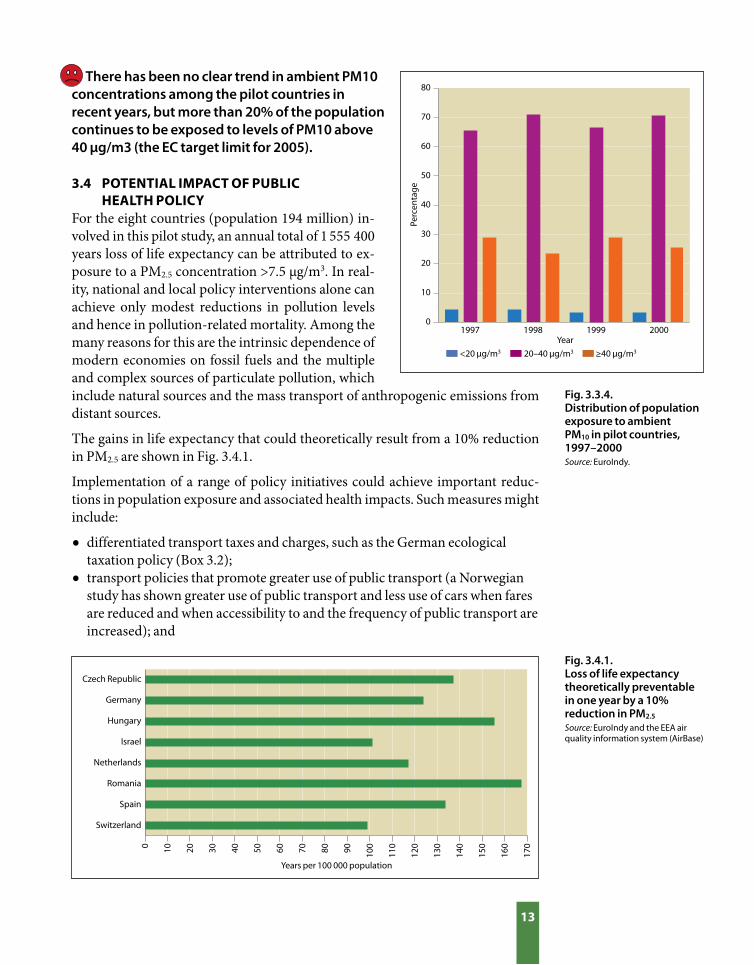
Fig. 3.3.4. Distribution of population exposure to ambient PM10 in pilot countries, 1997–2000Source: EuroIndy.
<20 µg/m3 20–40 µg/m3 ≥40 µg/m3
1997 1998 1999 2000
Perc
enta
ge
80
70
60
50
40
30
20
10
0
Year
There has been no clear trend in ambient PM10 concentrations among the pilot countries in recent years, but more than 20% of the population continues to be exposed to levels of PM10 above 40 µg/m3 (the EC target limit for 2005).
3.4 POTENTIAL IMPACT OF PUBLIC HEALTH POLICY For the eight countries (population 194 million) in-
volved in this pilot study, an annual total of 1 555 400
years loss of life expectancy can be attributed to ex-
posure to a PM2.5 concentration >7.5 µg/m3. In real-
ity, national and local policy interventions alone can
achieve only modest reductions in pollution levels
and hence in pollution-related mortality. Among the
many reasons for this are the intrinsic dependence of
modern economies on fossil fuels and the multiple
and complex sources of particulate pollution, which
include natural sources and the mass transport of anthropogenic emissions from
distant sources.
The gains in life expectancy that could theoretically result from a 10% reduction
in PM2.5 are shown in Fig. 3.4.1.
Implementation of a range of policy initiatives could achieve important reduc-
tions in population exposure and associated health impacts. Such measures might
include:
• differentiated transport taxes and charges, such as the German ecological
taxation policy (Box 3.2);
• transport policies that promote greater use of public transport (a Norwegian
study has shown greater use of public transport and less use of cars when fares
are reduced and when accessibility to and the frequency of public transport are
increased); and
Czech Republic
Germany
Hungary
Israel
Netherlands
Romania
Spain
Switzerland
Years per 100 000 population
0 10 20 30 40 50 60 70 80 90 100
110
120
130
140
150
160
170
14
Car
-km
per
per
son
700
0 8
000
900
0 10
000
11
000
12
000
Car-km per person Petrol consumption PM10
40
30
20
10
0
Petr
ol c
onsu
mp
tion
(kto
nnes
)20
000
25
000
30
000
35
000
40
000
Pop
ulat
ion-
wei
ghte
d PM
10 (µ
g/m
3 )
1996
1997
1998
1999
2000
2001
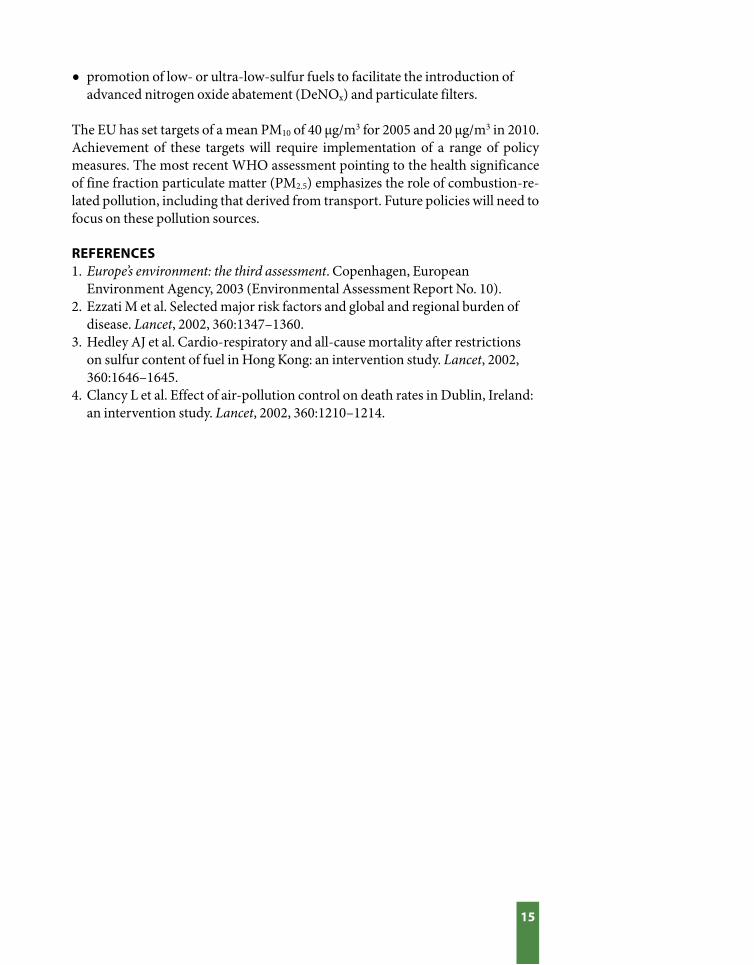
Trends in air polution indicators, Germany
Source: EuroIndy, EEA AirBase and German national statistics on mineral oil and transport.
Eco
Year
On 1 April 1999, the German Government introduced a differential tax
system on petrol and other fuels as part of its ecological tax reform, aimed
at encouraging greater energy efficiency and the use of renewable energy
sources. By promoting a reduction in the use of fossil fuels, this measure is
also likely to benefit health by helping limit emissions and concentrations
of air pollutants.
The change over recent years in some key indicators is as follows.
• Against a previously rising trend, the number of passenger-kilometres
travelled by car declined as from 1999.
• Previously static petrol consumption fell slightly.
• The trend in particulate air pollution (PM10), though more difficult to
interpret, also showed evidence of decline from 1999.
Preliminary data on PM10 for more recent months suggests that the down-
ward trend may not have continued, but the underlying pattern is difficult
to gauge at this stage because of the variability of weather conditions over
the period in question. Further monitoring will provide clearer evidence.
Similar reductions of traffic volumes and fuel consumption were also ob-
served during the oil crises of 1973–1974 and 1981–1982, when world fuel
prices rose.
Box 3.2. Case study: impact of fuel taxation policy in Germany
15
• promotion of low- or ultra-low-sulfur fuels to facilitate the introduction of
advanced nitrogen oxide abatement (DeNOx) and particulate filters.
The EU has set targets of a mean PM10 of 40 µg/m3 for 2005 and 20 µg/m3 in 2010.
Achievement of these targets will require implementation of a range of policy
measures. The most recent WHO assessment pointing to the health significance
of fine fraction particulate matter (PM2.5) emphasizes the role of combustion-re-
lated pollution, including that derived from transport. Future policies will need to
focus on these pollution sources.
REFERENCES1. Europe’s environment: the third assessment. Copenhagen, European
Environment Agency, 2003 (Environmental Assessment Report No. 10).
2. Ezzati M et al. Selected major risk factors and global and regional burden of
disease. Lancet, 2002, 360:1347–1360.
3. Hedley AJ et al. Cardio-respiratory and all-cause mortality after restrictions
on sulfur content of fuel in Hong Kong: an intervention study. Lancet, 2002,
360:1646–1645.
4. Clancy L et al. Effect of air-pollution control on death rates in Dublin, Ireland:
an intervention study. Lancet, 2002, 360:1210–1214.
MONITORING N
OISE A
ND
AN
NO
YAN
CE • LEGISLATION
� Passenger-km
� Noise exposure
� Annoyance � Sleep disturbance
PP
S
E
E
ACTIONSCTIONS
D
16
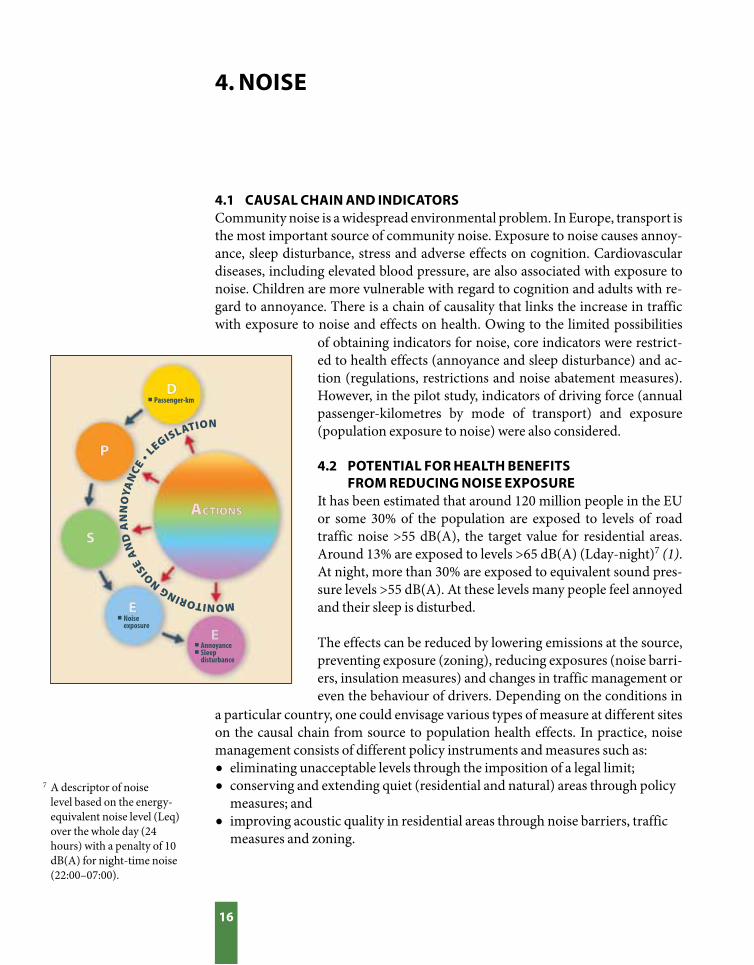
4.1 CAUSAL CHAIN AND INDICATORSCommunity noise is a widespread environmental problem. In Europe, transport is
the most important source of community noise. Exposure to noise causes annoy-
ance, sleep disturbance, stress and adverse effects on cognition. Cardiovascular
diseases, including elevated blood pressure, are also associated with exposure to
noise. Children are more vulnerable with regard to cognition and adults with re-
gard to annoyance. There is a chain of causality that links the increase in traffic
with exposure to noise and effects on health. Owing to the limited possibilities
4. NOISE
7 A descriptor of noise
level based on the energy-
equivalent noise level (Leq)
over the whole day (24
hours) with a penalty of 10
dB(A) for night-time noise
(22:00–07:00).
of obtaining indicators for noise, core indicators were restrict-
ed to health effects (annoyance and sleep disturbance) and ac-
tion (regulations, restrictions and noise abatement measures).
However, in the pilot study, indicators of driving force (annual
passenger-kilometres by mode of transport) and exposure
(population exposure to noise) were also considered.
4.2 POTENTIAL FOR HEALTH BENEFITS FROM REDUCING NOISE EXPOSUREIt has been estimated that around 120 million people in the EU
or some 30% of the population are exposed to levels of road
traffic noise >55 dB(A), the target value for residential areas.
Around 13% are exposed to levels >65 dB(A) (Lday-night)7 (1).
At night, more than 30% are exposed to equivalent sound pres-
sure levels >55 dB(A). At these levels many people feel annoyed
and their sleep is disturbed.
The effects can be reduced by lowering emissions at the source,
preventing exposure (zoning), reducing exposures (noise barri-
ers, insulation measures) and changes in traffic management or
even the behaviour of drivers. Depending on the conditions in
a particular country, one could envisage various types of measure at different sites
on the causal chain from source to population health effects. In practice, noise
management consists of different policy instruments and measures such as:
• eliminating unacceptable levels through the imposition of a legal limit;
• conserving and extending quiet (residential and natural) areas through policy
measures; and
• improving acoustic quality in residential areas through noise barriers, traffic
measures and zoning.

17
Tota
l
Road
traf
fic
Nei
ghb
ours
Air
traf
fic
Indu
stry
Ente
rtai
nmen
t
Railw
ay tr
affic
Road
traf
fic
Nei
ghb
ours
Air
traf
fic
Indu
stry
Railw
ay tr
affic
Road
traf
ficN
eigh
bou
rsEn
tert
ainm
ent
Nei
ghb
ours
Czech Republic
Germany Netherlands Spain
Perc
enta
ge v
ery
anno
yed
80
70
60
50
40
30
20
10
0
19961998
19931998
199619971998
199820002002
A few successful interventions in relation to children are described in a recent
review (2):
• In New York City, the installation of rubber pads on railway tracks and sound-
absorbing ceilings in schools reduced noise levels in classrooms by 6–8 dB(A)
and improved reading ability among children in classrooms facing railway
tracks (3).
• The Los Angeles Airport Study showed that noise levels were reduced by 7
dB(A) in classrooms subject to noise-abatement measures, resulting in some
small improvements in cognitive performance and motivation but not in
reading scores (4).
• Closure of the old Munich Airport resulted in a reduction in noise levels
from 68 to 54 dB(A) and an improvement in children’s long-term recall
and reading, whereas the reverse occurred in children living near the new
airport. Acoustic treatment of classrooms that reduced background noise
by 5–7 dB(A) resulted in improved speech and word intelligibility among
schoolchildren (5) and better cognitive performance among children of
preschool age (6,7).
4.3 TRENDS AND INTERNATIONAL COMPARISONSBecause most information on the various aspects of noise is available from the
Netherlands, data from that country are used as examples throughout this chap-
ter. When available, international information derived from EuroIndy and other
sources is presented.
Health effectsThe main sources of noise annoyance are transport, neighbours and air traffic
(Fig 4.3.1). A problem in comparing national data is the use of different questions
There are considerable differences in annoyance levels between countries.
Fig. 4.3.1. Percentages of the population highly annoyed by noise in the Czech Republic, Germany, the Netherlands and SpainSource: EuroIndy.
Note: The methods used in the Czech Republic differ from those used in other countries; this at least partly explains the high percentage of the population annoyed by noise.
18
to assess annoyance. The recently published ISO technical specification ISO/TS
15666:2003 provides a basis for further harmonization of annoyance assessment.
Environmental determinantsDriving forces
Transport noise is and will remain a major problem, owing to the enormous growth
in traffic (especially road and air) and the 24-hour economy. The Organisation for
Economic Co-operation and Development predicts an increase in motor vehicle-
kilometres of 40% in the next 20 years. Fig. 3.3.1 (page 12) shows the increase in
passenger-kilometres by private car between 1994 and 2001 in various countries.
Exposure
No indicator for noise exposure has so far been included in EuroIndy, and thus the
information given below is derived from another source (8). Different methodol-
ogies used in countries preclude comparison of the noise situation. Differences in
noise exposures between countries reflect only partly the actual situation, as dif-
ferences in methodologies used may lead to artefacts of the order of 10–15 dB(A).
This has to be considered in intercountry comparisons of noise exposure. The EU
guidelines on the harmonization of noise indices and calculation methods, once
implemented, will facilitate comparative analysis. Information on noise exposure
can be derived from noise level maps. According to the EU Environmental Noise
Directive, member states are obliged to make noise maps for high-risk areas. Table
4.3.1 shows the distribution of traffic noise exposure in the EU. A more detailed
noise map of the Netherlands (Fig. 4.3.2) illustrates the close relationship between
exposure and underlying driving forces, mainly transport and habitation.
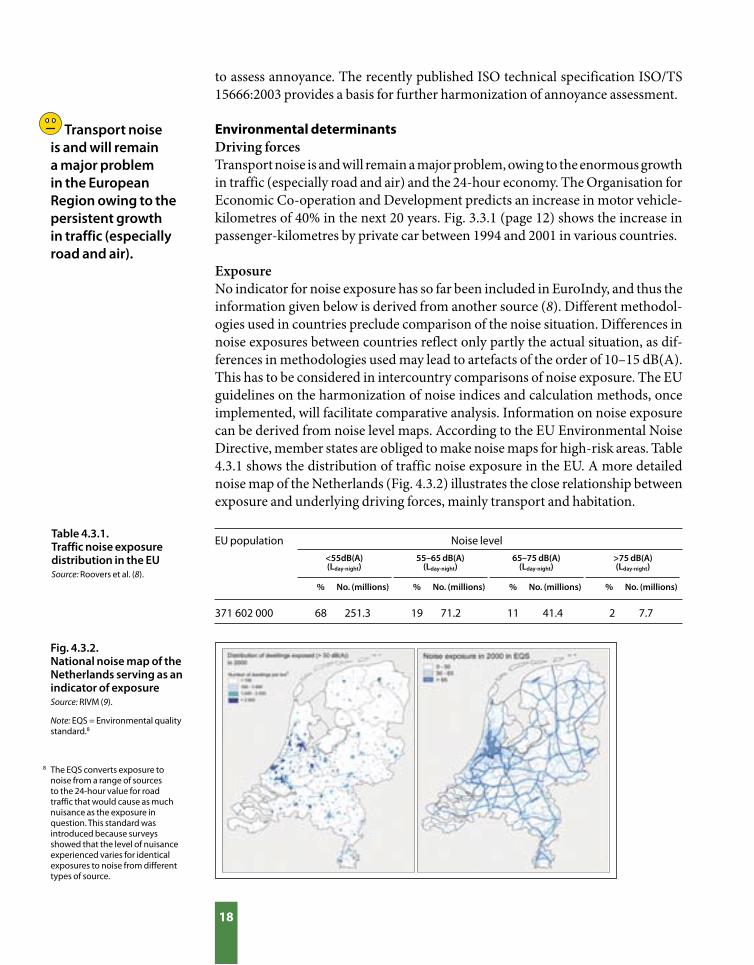
Table 4.3.1. Traffic noise exposure distribution in the EUSource: Roovers et al. (8).
EU population Noise level
<55dB(A)(Lday-night)
55–65 dB(A)(Lday-night)
65–75 dB(A)(Lday-night)
>75 dB(A)(Lday-night)
% No. (millions)
68 251.3371 602 000
% No. (millions) % No. (millions) % No. (millions)
19 71.2 11 41.4 2 7.7
Fig. 4.3.2. National noise map of the Netherlands serving as an indicator of exposureSource: RIVM (9).
Note: EQS = Environmental quality standard.8
8 The EQS converts exposure to noise from a range of sources to the 24-hour value for road traffic that would cause as much nuisance as the exposure in question. This standard was introduced because surveys showed that the level of nuisance experienced varies for identical exposures to noise from different types of source.
Transport noise is and will remain a major problem in the European Region owing to the persistent growth in traffic (especially road and air).

19
Clearly stated, implemented or enforced
Improvement grants for existing dwellings with high noise loads
Noise levels of annoyance are monitored on a regular basis
Legislation on noise prevention for new airports
Local authorities required to deal with nuisance complaints
Building regulations require insulation between houses
Legislation on noise prevention for new railways
Legislation on noise prevention for new roads
Percentage of countries
Clearly stated, partly implemented or enforced
Not existing, not clearly stated
0 20 40 60 80 100
Fig. 4.3.3. Application of regulations, restrictions and noise abatement procedures (composite index) in pilot countriesa
Source: EuroIndy.
aAlbania, Armenia, Bulgaria, Czech Republic, Germany, Hungary, Lithuania, Netherlands, Poland, Slovakia, Spain and Switzerland.
Actions
Most pilot countries reported clear and, in most cases, fully implemented legisla-
tion on the prevention of noise in relation to new roads, railways and airports,
as well as building regulations that require insulation between houses. In most
pilot countries local authorities are obliged to deal with noise complaints, and in
many this is implemented or enforced. Noise annoyance is regularly monitored in
one third of the reporting countries, while in others current regulations are par-
tially enforced. Improvement grants for existing dwellings with high noise loads
are available in one third of the pilot countries. Fig. 4.3.3 shows the application of
noise control measures in the pilot countries.
4.4 POTENTIAL IMPACT OF PUBLIC HEALTH POLICYThe links between noise indicators can be used in the development of policies to
improve public health. One difficulty in determining the potential health effects
of noise abatement measures is that annoyance depends not only on noise expo-
sure levels. Examples of non-acoustical factors are individual noise sensitivity, fear
with respect to the source, attitudes towards the source, perceived control over the
situation, and perceived economic or societal advantages of the noise-generating
activity. Interventions on these factors can also succeed in reducing noise annoy-
ance.
In 2002, an important step towards improving the comparability of data and
monitoring of noise throughout the EU was taken by the European Parliament in
the form of Directive 2002/49/EC. The Directive aims, inter alia, at harmonizing
noise indices and noise calculation methods. The indices Lden9 and Lnight
10 are the
harmonized noise indices, to be used throughout the EU for all modes of trans-
Almost all reporting countries have policies in place and partially enforced to prevent, restrict and abate noise pollution.
9 Day–evening–night noise
level based on the energy-
equivalent noise level (Leq)
over the whole day (24
hours) with a penalty of
5 dB(A) for evening-time
(19:00–23:00) noise and
of 10 dB(A) for night-
time (23:00–07:00) noise
(Directive 2002/49/EC).
10 Night noise level based on
the energy-equivalent noise
level over the night-time
period (23:00–07:00).
20
port. Member states are obliged to make noise maps for all agglomerations with
more than 250 000 inhabitants and for all main roads (those with more than 6
million vehicle passages a year), railways with more than 60 000 train passages a
year and major airports. Furthermore, the Directive proclaims the development
of a common noise calculation model, and designates for the time being so-called
interim methods (the French method for road traffic noise, the Dutch method
for railway noise and the European Civil Aviation Conference method for aircraft
noise). Nevertheless, as long as they “do not differ too much from the interim
methods” national methods may still be used for noise assessment and for report-
ing to Brussels. Thus in the near future noise exposure assessments will most like-
ly still be made using the different national methods. The EU noise policy, besides
harmonizing indices and calculation methods, sets and periodically tightens the
emission limits on tyres, cars and international trains.
If the noise indicators were expanded to cover the entire causal chain, they could
serve to monitor potential improvements in terms of noise exposure and asso-
ciated annoyance resulting from the implementation of Directive 2002/49/EC
throughout Europe. Moreover, they could provide countries with appropriate in-
formation for making national or international comparisons and for monitoring
the effectiveness of national policies.
An example of an effective noise abatement policy in the Netherlands is presented
in Box 4.1.
REFERENCES1. Environment in the European Union at the turn of the century. Copenhagen,
European Environmental Agency, 1999 (Environmental Assessment Report
No. 2).
2. Bistrup ML. Prevention of adverse effects of noise on children. Noise Health,
2003, 5(19):59–64.
3. Bronzaft AL. The effect of a noise abatement program on reading ability.
Journal of Environmental Psychology, 1981, 1:215–222.
4. Cohen S et al. Aircraft noise and children: longitudinal and cross-sectional
evidence in adaptation to noise and the effectiveness of noise abatement.
Journal of Personality and Social Psychology, 1981, 40:331–345.
5. Mackenzie DJ, Airey S. Classroom acoustics: a research project. Edinburgh,
Heriot-Watt University, 1999.
6. Maxwell LE, Evans GW. Interior noise exposure and reading readiness
among preschool children. In: Carter N, Job RFS, eds. Noise Effects ’98:
7th International Conference on Noise as a Public Health Problem, Sydney,
Australia. Sydney, Noise Effects ’98 Pty, 1998, 1:373–376.
7. Maxwell LE, Evans GW. The effects of noise on preschool children’s pre-
reading skills. Journal of Environmental Psychology, 2000, 20:91–97.
21
Reference
Actual
60
55
50
45
Motorways Aircraft Railways
Autonomous development (low-noise asphalt, low-noise materials)
Noise abatement policy (barriers, speed limits, quieter vehicles)
Ave
rage
noi
se le
vel (
dB(A
))
1980
1985
1990
1995
2000
1980
1985
1990
1995
2000
1980
1985
1990
1995
2000
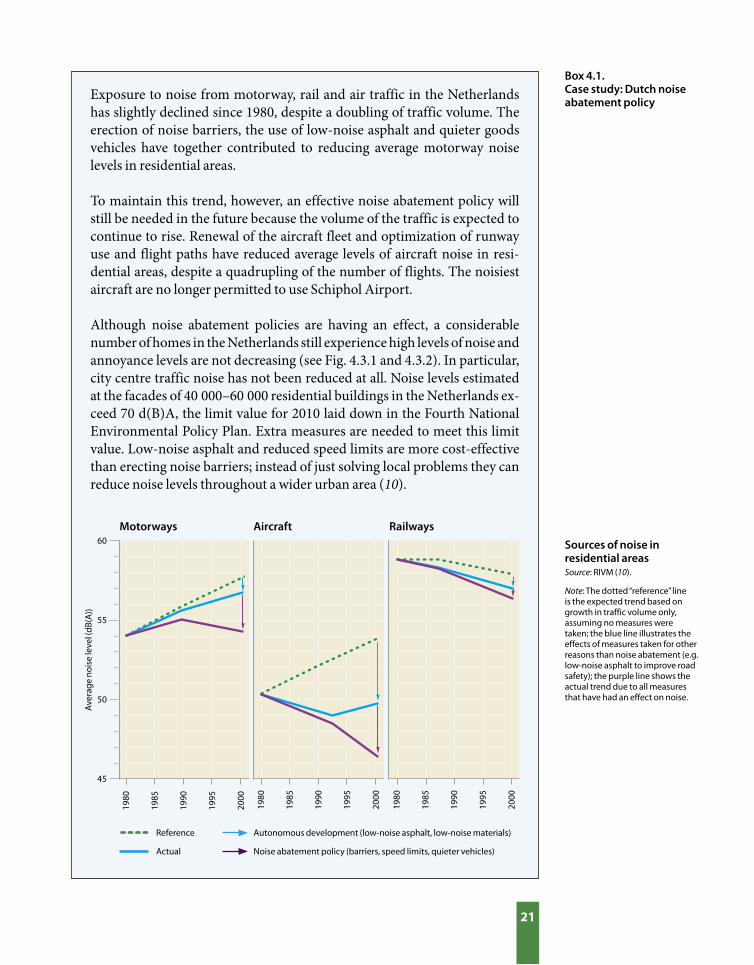
Sources of noise in residential areasSource: RIVM (10).
Note: The dotted “reference” line is the expected trend based on growth in traffic volume only, assuming no measures were taken; the blue line illustrates the effects of measures taken for other reasons than noise abatement (e.g. low-noise asphalt to improve road safety); the purple line shows the actual trend due to all measures that have had an effect on noise.
Box 4.1. Case study: Dutch noise abatement policy
Exposure to noise from motorway, rail and air traffic in the Netherlands
has slightly declined since 1980, despite a doubling of traffic volume. The
erection of noise barriers, the use of low-noise asphalt and quieter goods
vehicles have together contributed to reducing average motorway noise
levels in residential areas.
To maintain this trend, however, an effective noise abatement policy will
still be needed in the future because the volume of the traffic is expected to
continue to rise. Renewal of the aircraft fleet and optimization of runway
use and flight paths have reduced average levels of aircraft noise in resi-
dential areas, despite a quadrupling of the number of flights. The noisiest
aircraft are no longer permitted to use Schiphol Airport.
Although noise abatement policies are having an effect, a considerable
number of homes in the Netherlands still experience high levels of noise and
annoyance levels are not decreasing (see Fig. 4.3.1 and 4.3.2). In particular,
city centre traffic noise has not been reduced at all. Noise levels estimated
at the facades of 40 000–60 000 residential buildings in the Netherlands ex-
ceed 70 d(B)A, the limit value for 2010 laid down in the Fourth National
Environmental Policy Plan. Extra measures are needed to meet this limit
value. Low-noise asphalt and reduced speed limits are more cost-effective
than erecting noise barriers; instead of just solving local problems they can
reduce noise levels throughout a wider urban area (10).
22
8. Roovers C, van Blokland G, Psychas K. Road traffic noise mapping on
a European scale, In: Inter-Noise 2000: 29th International Congress and
Exhibition on Noise Control Engineering, Nice, France, 27–30 August 2000.
Paris, Société Française d’Acoustique, 2000, 6:3587–3590.
9. Milieubalans 2001 [Environmental balance 2001]. Bilthoven, RIVM, 2001.
10. Milieubalans 2002 [Environmental balance 2002]. Bilthoven, RIVM, 2002.

ROAD SAFETY • ENGINEER
ING
IM
PR
OV
EMENTS • LEGISLATION
� GDP
� Mortality� Injuries
� Number of cars
PP
S
EE
ACTIONSCTIONS
D
23
11 Armenia, Bulgaria,
Czech Republic,
Denmark, Germany,
Finland, Hungary,
Ireland, Italy, Lithuania,
Netherlands, Portugal,
Romania, Slovakia, Spain,
Switzerland, United
Kingdom.
5.1 CAUSAL CHAIN AND INDICATORSInjuries caused by road traffic accidents in Europe continue to be a major pub-
lic health problem. Road traffic accidents are the most important cause of death
among young people, especially males, and are a major cause of physical disability,
especially among the youngest. The total cost to society is enormous in terms of
economic loss as well as of quality of life. Two indicators of health effects, the mor-
tality and injury rates for road traffic accidents, were proposed as core indicators
5. TRANSPORT ACCIDENTS
because of the limited feasibility of other indicators. To better
describe the links within the DPSEEA causal chain model, two
“driving forces” related to economic growth are also considered
in this chapter. The respective indicators are the number of cars
per unit population and the gross domestic product (GDP).
This chapter covers more countries11 than those involved in the
EH indicator pilot study and gives a better overview of the situ-
ation in Europe.
5.2 POTENTIAL FOR HEALTH BENEFITS FROM IMPROVED ROAD SAFETYTraffic accidents cause about 36 000 deaths and 1.5 million in-
juries per year. It has been estimated that the total cost to society
is higher than €160 billion per year or approximately 2% of the
GNP of the EU (1). The most vulnerable groups are young peo-
ple between 15 and 24 years of age, pedestrians, motorcyclists,
cyclists and moped riders.
Reducing the number of traffic accidents and resulting injuries
and deaths is a priority throughout Europe. It is particularly
urgent in the countries of central and eastern Europe (CCEE),
where improvements in traffic infrastructure and driver behaviour are not in line
with the rapidly growing traffic density.
There is sufficient evidence of the effectiveness of interventions aimed at reduc-
ing traffic accidents. Moreover, the shift to more environment-friendly modes of
transport (e.g. public transport) is accompanied by positive effects on road traffic
safety. A recent review (2) of the effectiveness of interventions aimed at reducing
road traffic accidents describes the most effective actions as:
• health promotion campaigns for the prevention of childhood injury
• efforts to increase helmet use by cyclists and motorcyclists
• promotion of the use of children’s car seats and seat belts

24
Inju
red
per
100
000
inha
bita
nts
1996
1997
1998
1999
2000
1996
1997
1998
1999
2000
600
500
400
300
200
100
0
CEE Western Europe Total
Mor
talit
y p
er 1
00 0
00 in
hab
itant
s
Year
14
13
12
11
10
9
8
CEE Western Europe Total
Year
• traffic calming measures
• specific legislation against drink-driving.
5.3 TRENDS AND INTERNATIONAL COMPARISONSHealth effects Despite a downward trend, mortality from road traffic accidents is still high in the
European Region with 9.8 deaths per 100 000 inhabitants in 2000, a reduction of
6% since 1996. The overall reduction in mortality rates in recent years can be at-
tributed principally to the western European countries, while the CCEE are still
experience increasing trends (Fig. 5.3.1).
The changes in injury rates over time show a different pattern (Fig. 5.3.2). The
overall injury rate of 431 per 100 000 inhabitants has been rather stable since 1996
Fig. 5.3.1 Age-standardized road accident mortality rates in the CCEE and western Europe, 1996–2000Source: Health for all database, WHO Regional Office for Europe.
Despite an overall reduction, road accident mortality is still high with markedly different trends in eastern and western Europe.
with a slight (2%) increase over the period 1996–2000. This can be explained partly
by an effective reduction in mortality (resulting in more injured persons) and part-
ly by improvements in the quality of information. The lower injury rates reported
in the CCEE than in western European countries may be due to underreporting.
The CCEE, with the exception of Armenia and Bulgaria, have a higher than aver-
age mortality rate, whereas the western European countries, with the exception of
Fig. 5.3.2. Road accident injury rates in the CCEE and western Europe, 1996–2000Source: EuroIndy and national statistics for Denmark, Ireland, Italy, Portugal and the United Kingdom.
25
2000 1996
LithuaniaSpain
SlovakiaRomania
Czech RepublicPortugalHungary
ItalyAverageBulgaria
IrelandDenmarkGermany
FinlandSwitzerland
NetherlandsArmenia
United Kingdom
GermanyPortugal
United KingdomItaly
AverageSwitzerland
SpainIreland
Czech RepublicNetherlands
HungaryLithuania
SlovakiaDenmark
FinlandBulgariaArmeniaRomania
0 5 10 15 20 25
0 100 200 300 400 500 600 700
2000 1996
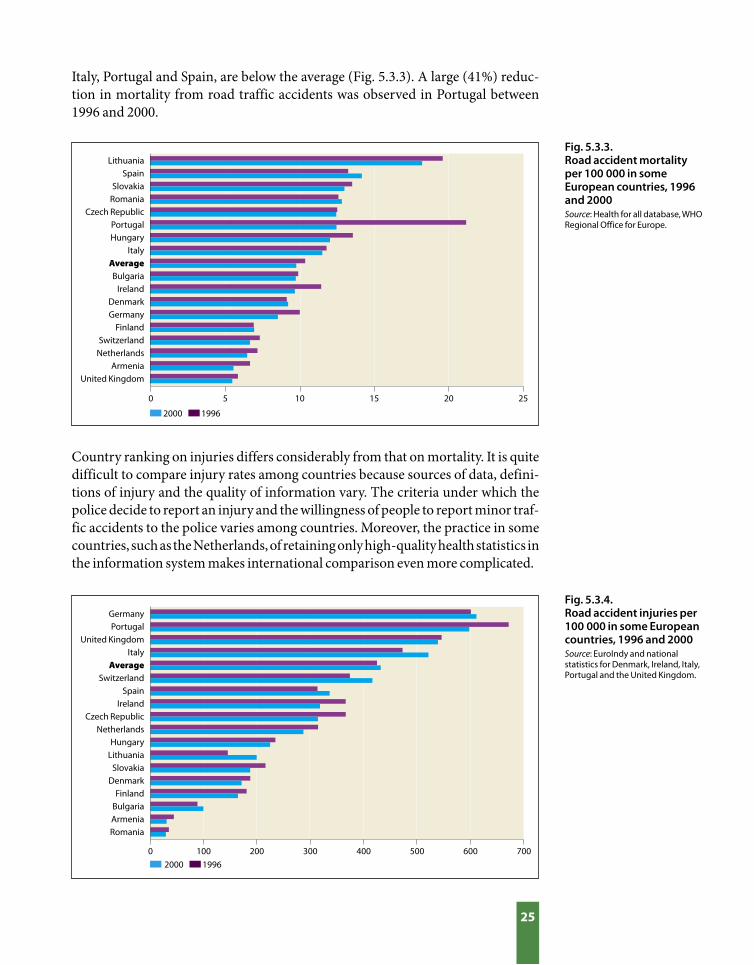
Fig. 5.3.3. Road accident mortality per 100 000 in some European countries, 1996 and 2000Source: Health for all database, WHO Regional Office for Europe.
Fig. 5.3.4. Road accident injuries per 100 000 in some European countries, 1996 and 2000Source: EuroIndy and national statistics for Denmark, Ireland, Italy, Portugal and the United Kingdom.
Italy, Portugal and Spain, are below the average (Fig. 5.3.3). A large (41%) reduc-
tion in mortality from road traffic accidents was observed in Portugal between
1996 and 2000.
Country ranking on injuries differs considerably from that on mortality. It is quite
difficult to compare injury rates among countries because sources of data, defini-
tions of injury and the quality of information vary. The criteria under which the
police decide to report an injury and the willingness of people to report minor traf-
fic accidents to the police varies among countries. Moreover, the practice in some
countries, such as the Netherlands, of retaining only high-quality health statistics in
the information system makes international comparison even more complicated.
26
Trends in injury rates between the countries were compared, assuming that the
national reporting system did not change over time (Fig 5.3.4). From 1996 to
2000, a marked reduction in injury rates was observed in the Czech Republic and
Slovakia (–14%), Ireland (–13%), Portugal (–11%), and Denmark and Finland
(–9%). The opposite trend was observed in Italy (+10%), Switzerland (+11%) and
Lithuania (+37%).
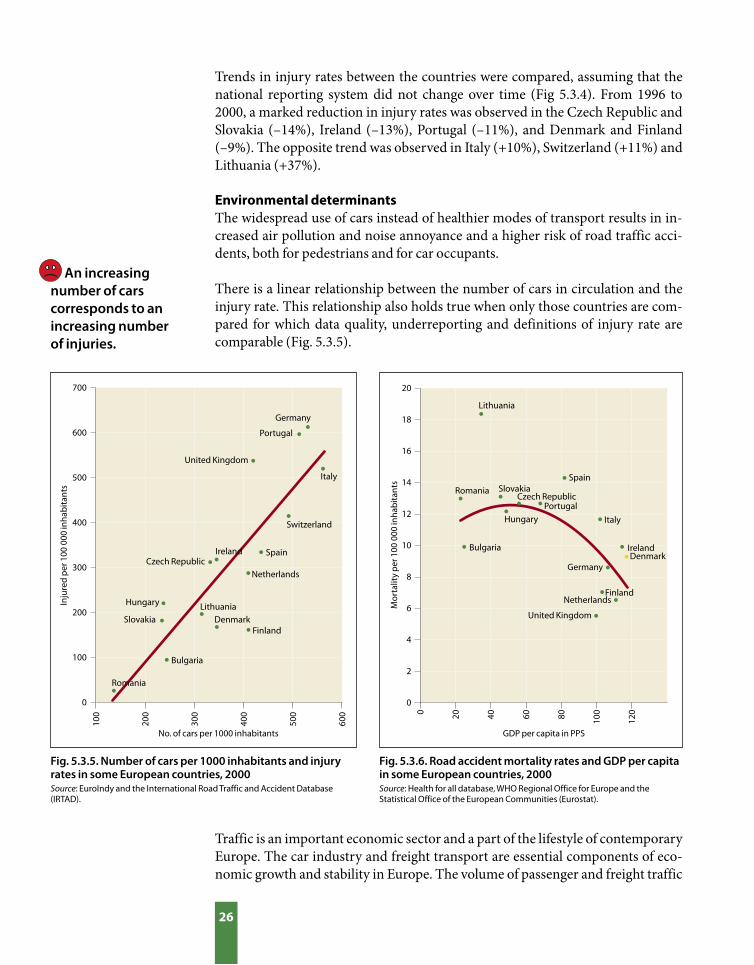
Environmental determinantsThe widespread use of cars instead of healthier modes of transport results in in-
creased air pollution and noise annoyance and a higher risk of road traffic acci-
dents, both for pedestrians and for car occupants.
There is a linear relationship between the number of cars in circulation and the
injury rate. This relationship also holds true when only those countries are com-
pared for which data quality, underreporting and definitions of injury rate are
comparable (Fig. 5.3.5).
An increasing number of cars corresponds to an increasing number of injuries.
Fig. 5.3.5. Number of cars per 1000 inhabitants and injury rates in some European countries, 2000Source: EuroIndy and the International Road Traffic and Accident Database (IRTAD).
Fig. 5.3.6. Road accident mortality rates and GDP per capita in some European countries, 2000Source: Health for all database, WHO Regional Office for Europe and the Statistical Office of the European Communities (Eurostat).
Traffic is an important economic sector and a part of the lifestyle of contemporary
Europe. The car industry and freight transport are essential components of eco-
nomic growth and stability in Europe. The volume of passenger and freight traffic
No. of cars per 1000 inhabitants
Inju
red
per
100
000
inha
bita
nts
Lithuania
Spain
Slovakia
Romania
Czech Republic
Portugal
Hungary
Italy
Bulgaria
Ireland
Denmark
Germany
Finland
Switzerland
Netherlands
United Kingdom
Mor
talit
y p
er 1
00 0
00 in
hab
itant
s
GDP per capita in PPS
Lithuania
SpainSlovakiaRomania
Czech RepublicPortugal
Hungary Italy
Bulgaria IrelandDenmark
FinlandNetherlands
United Kingdom
100
200
300
400
500
600
700
600
500
400
300
200
100
0
0 20 40 60 80 100
120
20
18
16
14
12
10
8
6
4
2
0
Germany
27
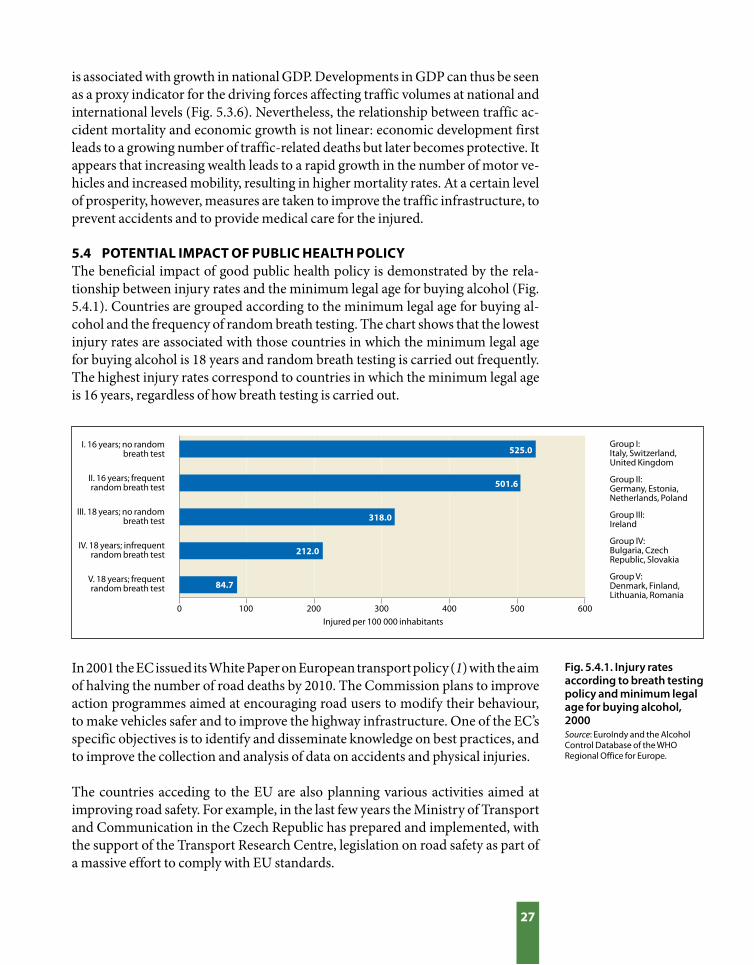
Fig. 5.4.1. Injury rates according to breath testing policy and minimum legal age for buying alcohol, 2000Source: EuroIndy and the Alcohol Control Database of the WHO Regional Office for Europe.
is associated with growth in national GDP. Developments in GDP can thus be seen
as a proxy indicator for the driving forces affecting traffic volumes at national and
international levels (Fig. 5.3.6). Nevertheless, the relationship between traffic ac-
cident mortality and economic growth is not linear: economic development first
leads to a growing number of traffic-related deaths but later becomes protective. It
appears that increasing wealth leads to a rapid growth in the number of motor ve-
hicles and increased mobility, resulting in higher mortality rates. At a certain level
of prosperity, however, measures are taken to improve the traffic infrastructure, to
prevent accidents and to provide medical care for the injured.
5.4 POTENTIAL IMPACT OF PUBLIC HEALTH POLICYThe beneficial impact of good public health policy is demonstrated by the rela-
tionship between injury rates and the minimum legal age for buying alcohol (Fig.
5.4.1). Countries are grouped according to the minimum legal age for buying al-
cohol and the frequency of random breath testing. The chart shows that the lowest
injury rates are associated with those countries in which the minimum legal age
for buying alcohol is 18 years and random breath testing is carried out frequently.
The highest injury rates correspond to countries in which the minimum legal age
is 16 years, regardless of how breath testing is carried out.
In 2001 the EC issued its White Paper on European transport policy (1) with the aim
of halving the number of road deaths by 2010. The Commission plans to improve
action programmes aimed at encouraging road users to modify their behaviour,
to make vehicles safer and to improve the highway infrastructure. One of the EC’s
specific objectives is to identify and disseminate knowledge on best practices, and
to improve the collection and analysis of data on accidents and physical injuries.
The countries acceding to the EU are also planning various activities aimed at
improving road safety. For example, in the last few years the Ministry of Transport
and Communication in the Czech Republic has prepared and implemented, with
the support of the Transport Research Centre, legislation on road safety as part of
a massive effort to comply with EU standards.
I. 16 years; no random breath test
II. 16 years; frequent random breath test
III. 18 years; no random breath test
IV. 18 years; infrequent random breath test
V. 18 years; frequent random breath test
Injured per 100 000 inhabitants 0 100 200 300 400 500 600
Group I: Italy, Switzerland, United Kingdom
Group II: Germany, Estonia, Netherlands, Poland
Group III: Ireland
Group IV: Bulgaria, Czech Republic, Slovakia
Group V: Denmark, Finland, Lithuania, Romania
525.0
501.6
318.0
212.0
84.7

28
The urban safety project carried out in five towns in England (3) is an ex-
ample of effective intervention. It was designed to evaluate the impact of
traffic calming or area-wide engineering measures on traffic-associated in-
juries. It included a wide range of measures to redistribute traffic, improve
the safety of individual sections of road or reduce speed. The study design
was a controlled trial without randomization, and five pairs of localities
(one area of intervention and one control area) were selected in each of the
five towns involved (Bradford, Bristol, Nelson, Reading and Sheffield). The
outcome of the study was measured, using police statistics, five years before
and two years after implementation. An evaluation was also made of the
costs of each of the traffic schemes in the different towns.
Overall, road traffic accidents were reduced by 13% but there were great
variations between schemes. Slight accidents declined proportionately
more than fatal and serious ones. Injuries to pedestrians were particular-
ly reduced in one centre (Sheffield) and there was a general reduction in
casualties among child cyclists. Measures that protected two-wheel vehi-
cles were particularly successful. A longer-term assessment showed that
child pedestrians and cyclists particularly benefited. Each scheme cost
£250 000, and first-year rates of return indicated considerable cost savings.
This shows that if the core indicators of transport accidents are reported at
national and local levels, one could demonstrate the effectiveness of road
safety policies on reducing road accident mortality and injuries.
As an example of good practice, the benefits of a comprehensive road safety policy
in the United Kingdom are presented in Box 5.1.
Box 5.1. Case study: improving road safety saves the lives of child pedestrians and cyclists in the United Kingdom
REFERENCES1. White paper – European transport policy for 2010: time to decide. Brussels,
European Commission, 2001 (http://europa.eu.int/comm/energy_transport/
library/lb_texte_complet_en.pdf).
2. Morrison DS, Petticrew M, Thomson H. What are the most effective ways of
improving population health through transport interventions? Evidence from
systematic reviews. Journal of Epidemiology and Community Health, 2003,
57(5):327–333.
3. Towner E. et al. What works in preventing unintentional injuries in children
and young adolescents? An updated systematic review. London, Health
Development Agency, 2001 (http://www.hda-online.org.uk/documents/
prevent_injuries.pdf).
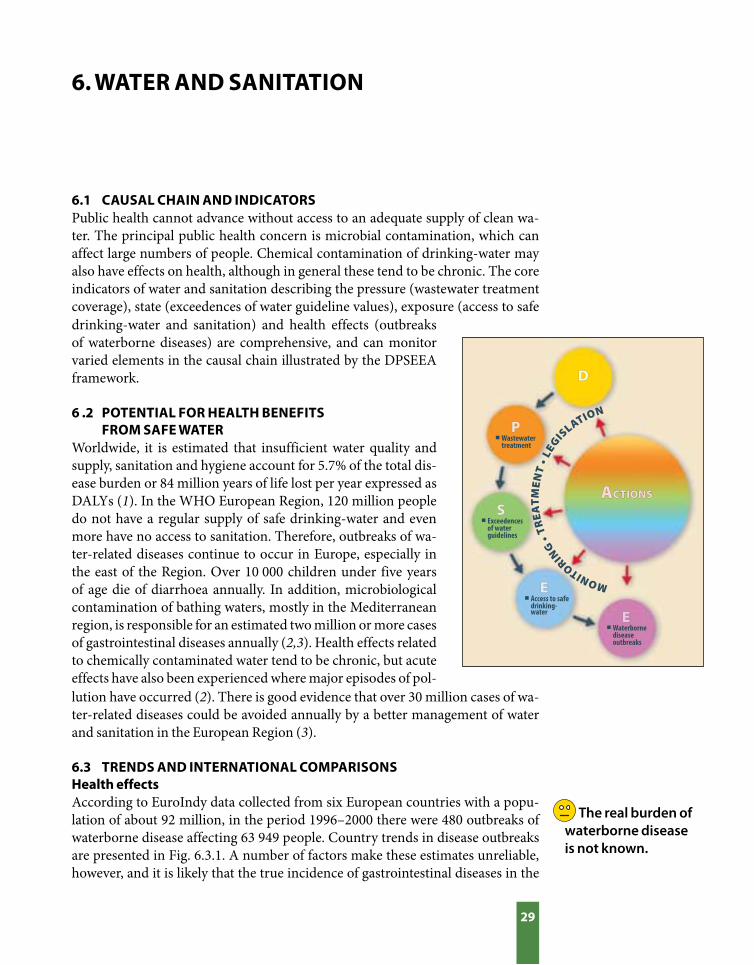
MONITORING
• TR
EAT
ME
NT
• LE
GIS
LATION
� Wastewater treatment
� Waterborne disease outbreaks
� Exceedences of water
guidelines
� Access to safe drinking-
water
PP
S
E
E
ACTIONSCTIONS
D
29
6. WATER AND SANITATION
The real burden of waterborne disease is not known.
6.1 CAUSAL CHAIN AND INDICATORSPublic health cannot advance without access to an adequate supply of clean wa-
ter. The principal public health concern is microbial contamination, which can
affect large numbers of people. Chemical contamination of drinking-water may
also have effects on health, although in general these tend to be chronic. The core
indicators of water and sanitation describing the pressure (wastewater treatment
coverage), state (exceedences of water guideline values), exposure (access to safe
drinking-water and sanitation) and health effects (outbreaks
of waterborne diseases) are comprehensive, and can monitor
varied elements in the causal chain illustrated by the DPSEEA
framework.
6 .2 POTENTIAL FOR HEALTH BENEFITS FROM SAFE WATERWorldwide, it is estimated that insufficient water quality and
supply, sanitation and hygiene account for 5.7% of the total dis-
ease burden or 84 million years of life lost per year expressed as
DALYs (1). In the WHO European Region, 120 million people
do not have a regular supply of safe drinking-water and even
more have no access to sanitation. Therefore, outbreaks of wa-
ter-related diseases continue to occur in Europe, especially in
the east of the Region. Over 10 000 children under five years
of age die of diarrhoea annually. In addition, microbiological
contamination of bathing waters, mostly in the Mediterranean
region, is responsible for an estimated two million or more cases
of gastrointestinal diseases annually (2,3). Health effects related
to chemically contaminated water tend to be chronic, but acute
effects have also been experienced where major episodes of pol-
lution have occurred (2). There is good evidence that over 30 million cases of wa-
ter-related diseases could be avoided annually by a better management of water
and sanitation in the European Region (3).
6.3 TRENDS AND INTERNATIONAL COMPARISONSHealth effects According to EuroIndy data collected from six European countries with a popu-
lation of about 92 million, in the period 1996–2000 there were 480 outbreaks of
waterborne disease affecting 63 949 people. Country trends in disease outbreaks
are presented in Fig. 6.3.1. A number of factors make these estimates unreliable,
however, and it is likely that the true incidence of gastrointestinal diseases in the
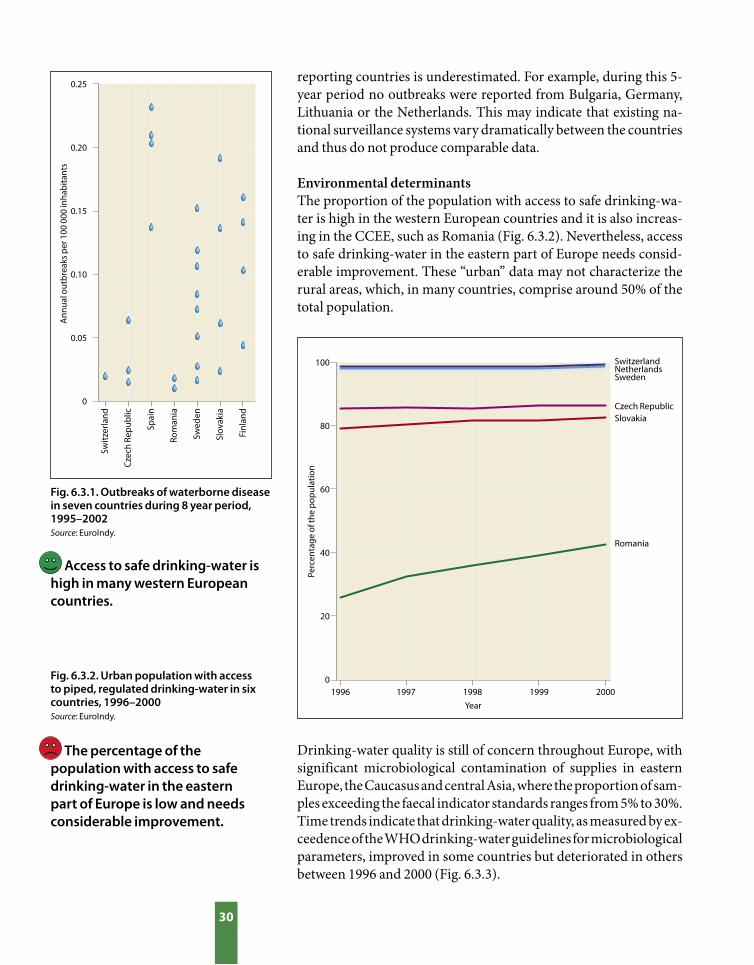
30
Swit
zerla
nd
Cze
ch R
epub
lic
Spai
n
Rom
ania
Swed
en
Slov
akia
Finl
and
0.25
0.20
0.15
0.10
0.05
0
Ann
ual o
utb
reak
s p
er 1
00 0
00 in
hab
itant
s
Year
1996 1997 1998 1999 2000
Perc
enta
ge o
f the
pop
ulat
ion
100
80
60
40
20
0
SlovakiaCzech Republic
SwitzerlandNetherlandsSweden
Romania
Fig. 6.3.1. Outbreaks of waterborne disease in seven countries during 8 year period, 1995–2002Source: EuroIndy.
Fig. 6.3.2. Urban population with access to piped, regulated drinking-water in six countries, 1996–2000Source: EuroIndy.
Access to safe drinking-water is high in many western European countries.
The percentage of the population with access to safe drinking-water in the eastern part of Europe is low and needs considerable improvement.
reporting countries is underestimated. For example, during this 5-
year period no outbreaks were reported from Bulgaria, Germany,
Lithuania or the Netherlands. This may indicate that existing na-
tional surveillance systems vary dramatically between the countries
and thus do not produce comparable data.
Environmental determinants
The proportion of the population with access to safe drinking-wa-
ter is high in the western European countries and it is also increas-
ing in the CCEE, such as Romania (Fig. 6.3.2). Nevertheless, access
to safe drinking-water in the eastern part of Europe needs consid-
erable improvement. These “urban” data may not characterize the
rural areas, which, in many countries, comprise around 50% of the
total population.
Drinking-water quality is still of concern throughout Europe, with
significant microbiological contamination of supplies in eastern
Europe, the Caucasus and central Asia, where the proportion of sam-
ples exceeding the faecal indicator standards ranges from 5% to 30%.
Time trends indicate that drinking-water quality, as measured by ex-
ceedence of the WHO drinking-water guidelines for microbiological
parameters, improved in some countries but deteriorated in others
between 1996 and 2000 (Fig. 6.3.3).
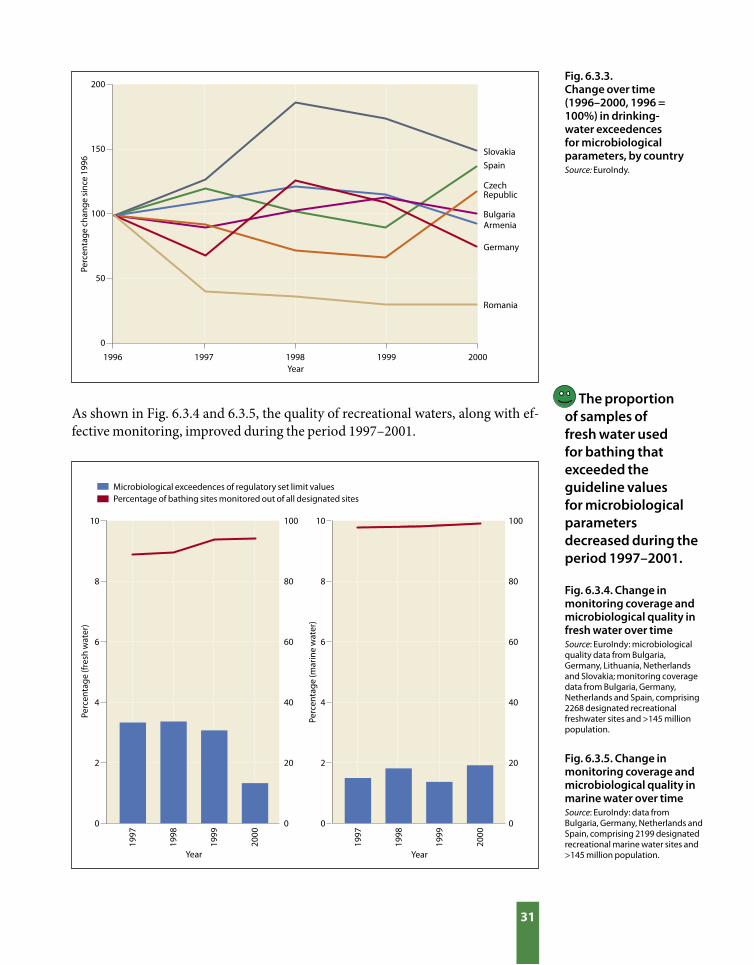
31
1997
1998
1999
2000
1997
1998
1999
2000
1996 1997 1998 1999 2000
200
150
100
50
0
10
8
6
4
2
0
10
8
6
4
2
0
Year
Year
Perc
enta
ge c
hang
e si
nce
1996 Spain
Slovakia
Romania
Czech Republic
Bulgaria
Germany
Armenia
Fig. 6.3.3. Change over time (1996–2000, 1996 = 100%) in drinking-water exceedences for microbiological parameters, by countrySource: EuroIndy.
Fig. 6.3.4. Change in monitoring coverage and microbiological quality in fresh water over timeSource: EuroIndy: microbiological quality data from Bulgaria, Germany, Lithuania, Netherlands and Slovakia; monitoring coverage data from Bulgaria, Germany, Netherlands and Spain, comprising 2268 designated recreational freshwater sites and >145 million population.
Fig. 6.3.5. Change in monitoring coverage and microbiological quality in marine water over timeSource: EuroIndy: data from Bulgaria, Germany, Netherlands and Spain, comprising 2199 designated recreational marine water sites and >145 million population.
Perc
enta
ge (f
resh
wat
er)
100
80
60
40
20
0
Year
Perc
enta
ge (m
arin
e w
ater
)
Microbiological exceedences of regulatory set limit valuesPercentage of bathing sites monitored out of all designated sites
100
80
60
40
20
0
As shown in Fig. 6.3.4 and 6.3.5, the quality of recreational waters, along with ef-
fective monitoring, improved during the period 1997–2001.
The proportion of samples of fresh water used for bathing that exceeded the guideline values for microbiological parameters decreased during the period 1997–2001.

32
Perc
enta
ge o
f the
pop
ulat
ion
100
80
60
40
20
0
1996 1997 1998 1999 2000 Year
Fig. 6.3.6. Population covered by advanced secondary wastewater treatment in seven countries, 1996–2000Source: EuroIndy.
Coverage by advanced wastewater treatment in the eastern part of the European Region is low and requires significant improvement.
Slovakia
Czech Republic
Switzerland
NetherlandsSweden
Bulgaria
Finland
The coverage and quality of wastewater treatment in western, central and eastern
Europe has significantly improved since the 1970s. Nevertheless, the percentage
of the population provided with wastewater treatment, although increasing, is
still relatively low in the CCEE as well as in the Caucasus region and central Asia.
Moreover, there are still many large
cities, such as Bucharest, where dis-
charged wastewater is largely untreat-
ed (4). Data from EuroIndy also show
that there are considerable differences
between countries in the proportion
of the population served by wastewa-
ter treatment (Fig. 6.3.6).
In summary, the set of core indicators
for water and sanitation that has been
selected for pilot implementation has
proven to be a powerful instrument
for monitoring the status of water and
sanitation across Europe. Moreover,
it could provide countries with ap-
propriate information for comparing
their performance with that of other
countries and for facilitating the plan-
ning of national policies.
6.4 POTENTIAL IMPACT OF PUBLIC HEALTH POLICYAlthough improvements have been
made over the past decade, coordinat-
ed efforts are still needed to ensure that
Europe’s population is supplied with
wholesome and clean drinking-wa-
ter and has access to safe recreational
water. Specific examples of successful
policy actions and interventions re-
sulting in improvements in both water
quality and public health are shown in
Boxes 6.1 and 6.2.
In recognition of the significance for health of water and sanitation, a number of
initiatives within the WHO European Region (e.g. EC Directives, WHO guide-
lines and national laws and regulations) exist that aim to promote the protection of
human health by improving water management. Two very important milestones
in this process are the Protocol on Water and Health and potentially the Water
Framework Directive (Box 6.3).

33
Nitrates in drinking-water are of concern because high nitrate concentra-
tions are associated with methaemoglobinaemia (blue baby syndrome)
which, in some cases, can be fatal. The syndrome has historically been
endemic in Hungary. Effective interventions, however, including extend-
ing the public water supply to improve drinking-water quality and health
service management measures, have resulted in a significant reduction in
methaemoglobinaemia in Hungary.
A network of district nurses devoted to the
prevention of methaemoglobinaemia was es-
tablished by the Ministry of Health in 1967.
The nurses make home visits to all pregnant
women and the source of drinking-water is
investigated. If the water is found to be unsuit-
able for feeding babies (i.e. the nitrate con-
centration is >40 mg/l), bottled water is pro-
vided for the preparation of infant feed until
the child is 2 years old. Advice is also given to
the mother on how to avoid the use of any un-
known water for baby feeding.
Connection to the public water supply has
been expanded from under 25% of the pop-
ulation in 1960 to 85% in 2000. As from the
beginning of the 1990s, more than 97% of the
population in Hungary is supplied with water
complying with the limit value for nitrate (<50
mg/l).
No.
of c
ases
Perc
enta
ge
Year
No. of methaemoglobinaemia cases per yearPercentage of population with access to public water supply
350
300
250
200
150
100
50
0
1976
1978
1980
1982
1984
1986
1988
1990
1992
1994
1996
1998
2000
2002
Box 6.1. Improvement of bathing water as a result of effective interventions
Box 6.2. Case study: impact of interventions on exposure to nitrates in Hungary
Within the EU several directives covering bathing water, drinking-water,
nitrates, dangerous substances and urban wastewater have resulted in sig-
nificant improvements on water quality. The table below shows how effec-
tive interventions under the Bathing Water Directive produced significant
improvements in recreational waters between 1992 and 2002.
Percentages of bathing areas that do not comply with mandatory values in the EU
Year
1992
1997
2002
Coastal zones
9.9
5.4
1.9
Freshwater zones
23.2
11.7
4.4
Source: European Commission (5).
Source: National Institute of Environmental Health, Budapest.
100
80
60
40
20
0

34
The Protocol on Water and Health to the 1992 Convention on the Protection
and Use of Transboundary Watercourses and International Lakes (3) is
the first major international legal approach to the prevention, control and
reduction of water-related diseases in Europe. The Protocol was adopted
on 17 June 1999 at the Third Ministerial Conference on Environment
and Health and was signed by 36 countries. By adopting the Protocol, the
signatories agreed to take all appropriate measures towards achieving:
• adequate supplies of wholesome drinking-water;
• adequate sanitation of a standard that sufficiently protects human
health and the environment;
• effective protection of water resources used as sources of drinking-
water, and their related water ecosystems, from pollution from other
causes;
• adequate safeguards for human health against water-related diseases;
and
• effective systems for monitoring and responding to outbreaks or
incidents of water-related diseases.
The Protocol also places great emphasis on the international aspects. In
fact, implementation of the provisions of the Protocol and progress made
in the control of water-related diseases can only be assessed and evaluated
through standardized international databases and harmonized data
collection structures.
The Water Framework Directive (6) offers the potential for integrating
daughter Directives with public health significance, such as the Bathing
Water Directive of October 2002. It expands the scope of water protection
to all waters and sets clear objectives, based on the requirement that a “good
status” must be achieved for all European waters by 2015 and that water
use should be sustainable throughout Europe. The Directive represents an
ambitious and innovative approach to water management. Key elements of
the legislation include:
• the protection of all waters – rivers, lakes, coastal waters and
groundwater;
• the setting of ambitious objectives to ensure that all waters meet “good
status” by 2015;
• the requirement of cross-border cooperation between countries and all
involved parties;
• ensuring the active participation of all stakeholders, including
nongovernmental organizations and local communities, in water
management activities;
• the requirement of water pricing policies and ensuring that the polluter
pays; and
• balancing the interests of the environment with those who depend on it.
Box 6.3 Highlights of the Protocol on Water and Health and the Water Framework Directive

35
REFERENCES1. Water, sanitation and health electronic library: a compendium of WHO
information on water, sanitation and health [electronic resource]. Geneva,
World Health Organization, 2003.
2. Water and health in Europe: a joint report from the European Environment
Agency and the WHO Regional Office from Europe. Copenhagen, WHO
Regional Office for Europe, 2002 (WHO Regional Publications, European
Series, No. 93).
3. The Protocol on Water and Health: what it is, why it matters. Copenhagen,
WHO Regional Office for Europe, 2002 (http://www.euro.who.int/document/
wsn/watprot/index.html).
4. Europe’s environment: the third assessment. Copenhagen, European
Environment Agency, 2003 (Environmental Assessment Report No. 10).
5. Bathing water quality. Annual report, 2002 bathing season, Europe. Brussels,
European Commission, 2002 (http://europa.eu.int/water/water-bathing/
report.html).
6. Directive 2000/60/EC of the European Parliament and of the Council of 23
October 2000 establishing a framework for Community action in the field of
water policy. Official Journal of the European Communities, 2000, L 327:0001–
0073 (http://europa.eu.int/comm/environment/water/water-framework/
index_en.html).
36
Indicators are one central element of EHIS. To be policy-relevant, indicators must
be based on evidence that links environmental quality and human health. There
is also a need to analyse and assess the impact of environment and health policies
by monitoring changes in population exposure and related effects associated with
these actions.
Indicators are powerful communication tools for policy-makers, experts and the
general public. When integrated with the policy-making process, they can dem-
onstrate the effectiveness of environment and health policies, thus facilitating the
setting of priorities among competing policies. They provide a strand of evidence
to be used alongside epidemiological information to inform policy development
at national and international levels in Europe.
This report is based on a pilot study to explore the usefulness and added value of
tracking environmental public health by applying a core set of indicators. A spe-
cial focus was the potential of EHIS as a tool for EH decision-making throughout
Europe. The participating Member States collected and reported data on the core
indicators covering ten thematic areas. Of these areas, four (air pollution, noise,
transport accidents, and water and sanitation) were selected for the report. The
lessons learnt from the pilot study on applying indicators in policy-oriented re-
porting are as follows.
7.1 FEASIBILITY The core set of indicators was chosen to minimize the additional burden of col-
lecting and reporting data within the Member States. The experience in this pi-
lot study suggests that regular indicator-based reporting of the proposed core set
will not entail additional costs, because the suggested indicators will utilize the
existing data sources. Nevertheless, a certain level of commitment by national
policy-makers, administrators and experts will be essential in refocusing exist-
ing resources on the implementation of this system. Continued technical support
from international agencies such as the Regional Office and EEA will be needed to
enhance coordination and harmonization of the data collecting systems.
7.2 USEFULNESS AND ADDED VALUE • Indicators provide evidence for the potential benefits of policies
By generating information on various points in the causal chain framework, such
as on environmental risk factors and health effects, their determinants and the
actions taken, the indicators shed light on the potential impact of environment
and health policy on the health of the population. Analysis of the indicators across
7. CONCLUSION
37
time (years) and space (countries) facilitates assessment of the potential health
and environmental benefits of policies in Member States.
Example 1. German ecological taxation, introduced in 1999 as an addition to the
price of petrol and other energy sources, resulted in a noticeable reduction in
passenger-kilometres travelled by car and population exposure to airborne
particles. Reduction in PM10 exposure may have reduced associated mortality
and morbidity, indicating the policy’s potential benefit to health.
Example 2. In countries where the minimum legal age for buying alcohol is
higher and random breath testing more frequent, there was a markedly lower
injury rate from traffic accidents. Increasing the legal age for purchasing
alcohol from 16 to 18 years could reduce injuries to one sixth of present values
(from 501.6 to 84.7 per 100 000 population). Introducing frequent breath
testing could reduce injuries to approximately a quarter (from 318.0 to 84.7
per 100 000 population) if the minimum age for buying alcohol was 16 years.
The combination of both measures achieves the most beneficial impact.
• Indicators support priority-setting for policy-makers
Policy-makers need to set priorities in the area of environment and health to max-
imize the benefits of limited resources. Thus, by providing comparative informa-
tion, feasible policy interventions can be prioritized based on the best evidence.
Example 1. In the CCEE, the policy-makers may place higher priority on
preventing deaths due to transport accidents.
Example 2. In the period 1996–2000 there were 480 outbreaks of waterborne
disease affecting 63 949 people in 6 European countries with a total population
of about 92 million. According to epidemiological studies, the true incidence
of gastrointestinal diseases could be much greater than these figures. The
magnitude of the problem presented here demonstrates that public supplies
of safe drinking-water should remain a high priority among environment and
health policies in Europe.
• Indicators identify examples of good practice
This pilot study uncovered several examples of good practice among participat-
ing countries in terms of the effectiveness and efficacy of environment and health
policies. If the suggested indicator system is implemented in all European Member
States, success stories will be documented and examples of good practice shared
among the countries. Several examples of good practice were identified.
– Banning coal sales in Dublin led to clear reductions in air pollution and
mortality.
– Ecological taxation in Germany reduced exposure to PM10.
– Noise reduction policy in the Netherlands reduced exposure to road noise
despite a doubling of traffic volume.
38
– The Bathing Water Directive resulted in significant improvements in
recreational water quality in the EU over the period 1992–2002.
• Indicators help monitor general progress
The indicators provide a uniform approach to tracking progress in environment
and health status by monitoring time trends in individual countries or in a group
of countries. If EHIS is implemented in all Member States of the European Region,
the indicators will monitor general progress in the environment and health in
Europe. This is a very important added value if the countries and international
agencies are to introduce collaborative policies on environment and health in the
near future.
Example 1. Although particulate emissions from energy and industry are
generally decreasing, those from transport are generally increasing. A serious
effort to reduce transport-related air pollution is needed in Europe.
Example 2. The proportion of the population with access to piped drinking-
water is high in the western European countries. However, access to piped
regulated drinking-water in the eastern part of the Region needs considerable
improvement.
• Indicators facilitate international comparisons
One of the most straightforward uses of the indicators for both policy-makers
and the public is intercountry comparisons. For instance, according to the fig-
ures Armenia, the Netherlands and the United Kingdom are among the countries
with the lowest age-standardized mortality from traffic accidents. Comparative
analyses should take account of country differences in respect of data collection
methods and surveillance systems.
• Indicators are flexible for use in the national context
Countries will be able to select indicators based on policy needs, feasibility and
scientific rationale. Even in the absence of a relevant policy, indicators may be
combined with other evidence to describe the potential for interventions and im-
provements in public health practices, including surveillance programmes.
Example 1. Several countries, i.e. Belgium, Finland, Hungary, the Netherlands,
Poland, Sweden and Switzerland, reported experience in EH assessment in the
context of the NEHAPs process. Most of them viewed the indicators as useful
for the evaluation and monitoring of NEHAPs.
Example 2. The process of implementing indicators for the first time was useful
in highlighting required environment and health data issues, particularly in
countries with limited resources.

39
7.3 FUTURE DEVELOPMENTSEnvironmental information derived from obligations to report contained within
existing legislation has mostly concerned compliance rather than policy-making.
For instance, the reported number of days during which air quality targets are
violated is of limited use for health-relevant assessments. When available infor-
mation on the state of the environment is related to causes and effects through the
appropriate methodology, environment and health indicators can evaluate poten-
tial health benefits from policies to reduce environmental pollution. Establishing,
maintaining and facilitating access to such databases should therefore be further
advanced through EHIS.
The value of EHIS would be optimized if data collection and processing were har-
monized to improve comparability among countries. The preparation of periodi-
cal “indicator-based” reports could add to the harmonization of data collection by
highlighting any lack of comparability in indicators. Nevertheless, because of the
variety of political, economic, social, historical and cultural conditions among the
Member States, it would be impractical to demand full comparability among all
countries. When the indicators are used for monitoring, the consistency of data
systems within an individual country might be more important than compara-
bility between countries. The best solution for Member States and international
agencies is collaboration and joint efforts to find pragmatic ways for the step-by-
step implementation of EHIS throughout Europe.

40
Air
pol
lutio
n
Che
mic
al a
ccid
ents
Food
saf
ety
Hou
sing
Noi
se
Radi
atio
n
Traf
fic a
ccid
ents
Was
te/c
onta
min
ated
land
Wat
er-r
elat
ed h
ealt
h ris
ks
Wor
k/oc
cup
atio
nal h
ealt
h
FAC
T SH
EET
REPO
RT A
ND
AC
TIO
N P
LAN
COMMENTCOUNTRY DATA AVAILABILITY AND INTERPRETABILITY
Albania
Armenia
Bulgaria
Czech Republic
Estonia
Finland
Germany
Hungary
Lithuania
Netherlands
Romania
Slovakia
Spain
Sweden
Switzerland
Good Partly Impossible
ANNEX 1. OVERALL FEASIBILITY RATING OF CORE INDICATORS*
No resources; strengthening advocacy on political level
No resources; data do not correspond to definitions
Resources: nine months per year; one state public health staff member
No resources
Project-based funding (until December 2003); improve coordination between WHO, EEA and EC
Resources: nine months per year; one state public health centre staff member
Only project-based funding
* Prepared at the WHO Working Groups Meeting in Bonn, 16-17 October 2003
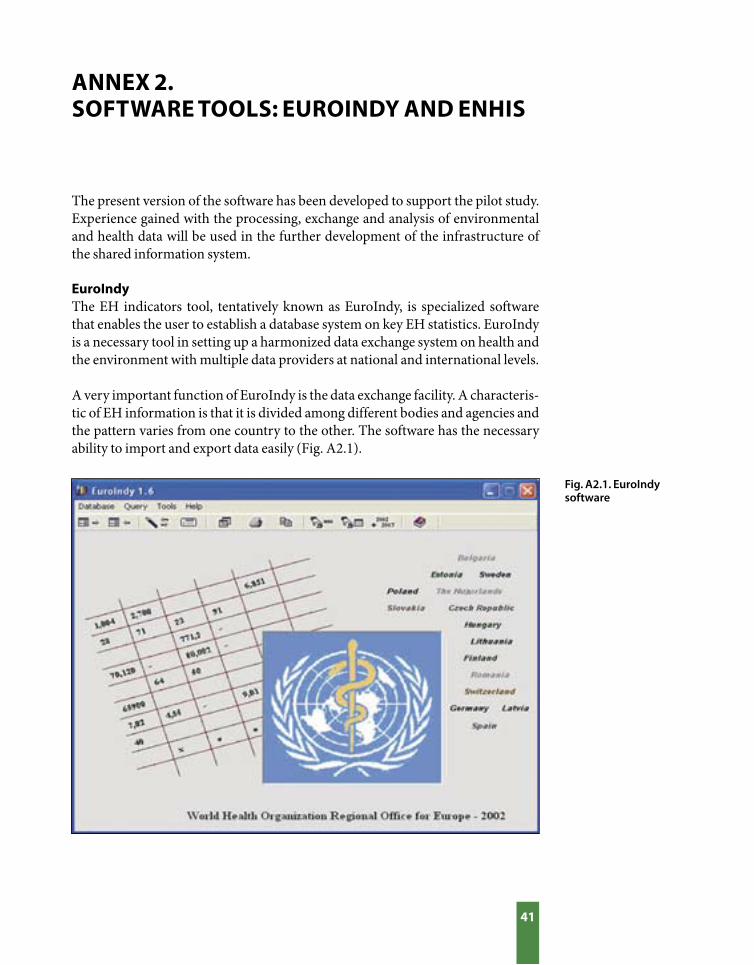
41
The present version of the software has been developed to support the pilot study.
Experience gained with the processing, exchange and analysis of environmental
and health data will be used in the further development of the infrastructure of
the shared information system.
EuroIndyThe EH indicators tool, tentatively known as EuroIndy, is specialized software
that enables the user to establish a database system on key EH statistics. EuroIndy
is a necessary tool in setting up a harmonized data exchange system on health and
the environment with multiple data providers at national and international levels.
A very important function of EuroIndy is the data exchange facility. A characteris-
tic of EH information is that it is divided among different bodies and agencies and
the pattern varies from one country to the other. The software has the necessary
ability to import and export data easily (Fig. A2.1).
ANNEX 2. SOFTWARE TOOLS: EUROINDY AND ENHIS
Fig. A2.1. EuroIndy software
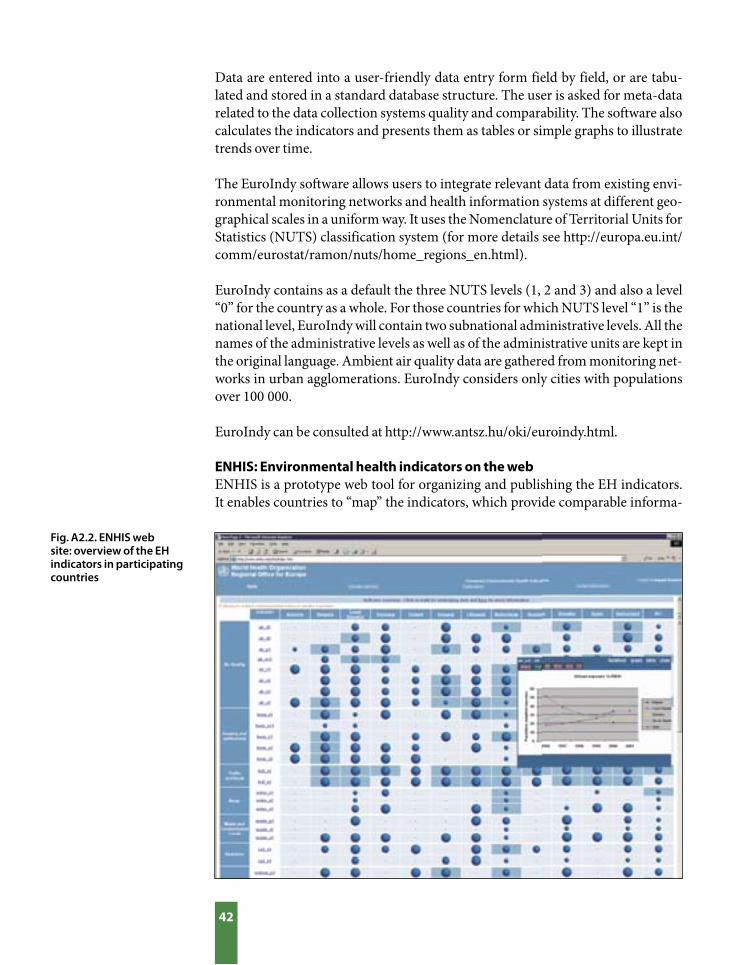
42
Data are entered into a user-friendly data entry form field by field, or are tabu-
lated and stored in a standard database structure. The user is asked for meta-data
related to the data collection systems quality and comparability. The software also
calculates the indicators and presents them as tables or simple graphs to illustrate
trends over time.
The EuroIndy software allows users to integrate relevant data from existing envi-
ronmental monitoring networks and health information systems at different geo-
graphical scales in a uniform way. It uses the Nomenclature of Territorial Units for
Statistics (NUTS) classification system (for more details see http://europa.eu.int/
comm/eurostat/ramon/nuts/home_regions_en.html).
EuroIndy contains as a default the three NUTS levels (1, 2 and 3) and also a level
“0” for the country as a whole. For those countries for which NUTS level “1” is the
national level, EuroIndy will contain two subnational administrative levels. All the
names of the administrative levels as well as of the administrative units are kept in
the original language. Ambient air quality data are gathered from monitoring net-
works in urban agglomerations. EuroIndy considers only cities with populations
over 100 000.
EuroIndy can be consulted at http://www.antsz.hu/oki/euroindy.html.
ENHIS: Environmental health indicators on the webENHIS is a prototype web tool for organizing and publishing the EH indicators.
It enables countries to “map” the indicators, which provide comparable informa-
Fig. A2.2. ENHIS web site: overview of the EH indicators in participating countries

43
tion over the ten EH issues, as well as helping the preparation and optimization of
national reporting. The web application provides an up-to-date representation of
the core EH indicator set available in the pilot countries. With further develop-
ment it can serve as an important vehicle for information exchange, dissemina-
tion of results and communication to the public.
The indicators are published for each individual country or across all countries.
The information is structured in several “levels of detail”. These include indicator
trends over the last 5–8 years by country or across all countries, as well as the indi-
cator fact sheet, i.e. the associated assessment and policy information. The nation-
al and international fact sheets use the same format (see Annex 3 for an example)
and constitute the main reporting tool of EHIS. Each indicator is assigned a code
and a summary of the methodology, i.e. underlying definitions and computation
are available on-line. In addition, countries provide “remarks” on differences in
national data systems from the WHO proposed methodology.
The indicator overview web page is shown in Fig. A2.2. The size of the circles
indicates the availability of data for every indicator for a given country and for
all countries together. The blue rectangles indicate the availability of fact sheets.
When clicking on one of these circles, the underlying data is presented in graphs
and tables, and links are provided to the relevant fact sheets. This provides a gen-
eral overview of data availability, while in-depth information is only one click
away! The ENHIS web is at http://www.enhis.net.
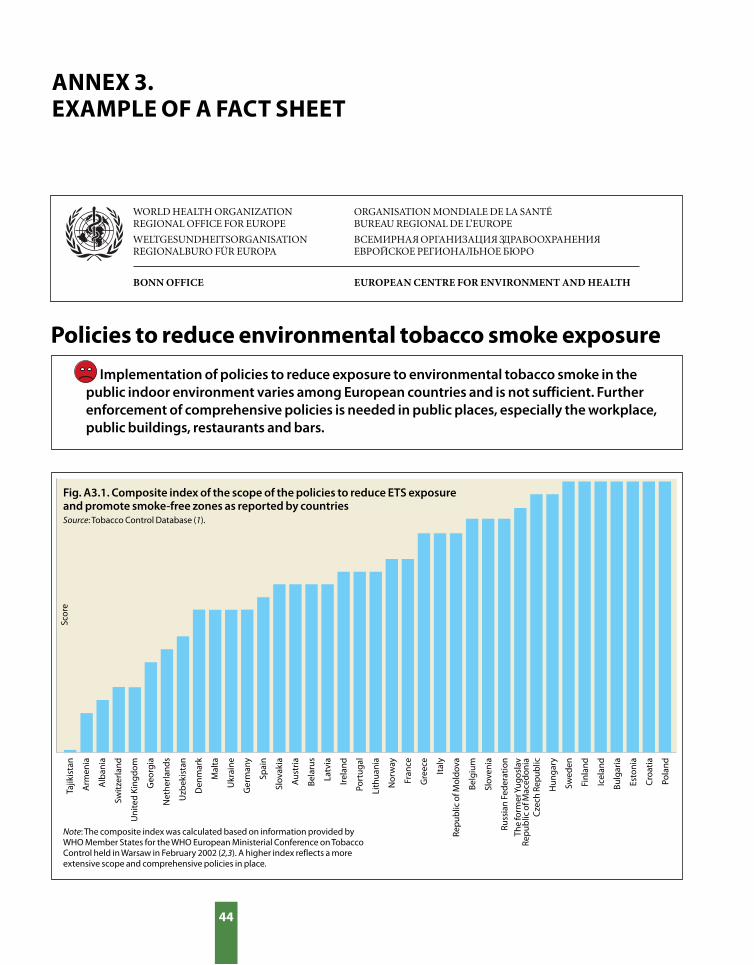
44
WORLD HEALTH ORGANIZATIONREGIONAL OFFICE FOR EUROPE
WELTGESUNDHEITSORGANISATIONREGIONALBURO FÜR EUROPA
ORGANISATION MONDIALE DE LA SANTÉBUREAU REGIONAL DE L’EUROPE
ВСЕМИРНАЯ ОРГАНИЗАЦИЯ ЗДРАВООХРАНЕНИЯ ЕBРОЙСКОЕ PEГИОНАЛЬНОЕ БЮРО
EUROPEAN CENTRE FOR ENVIRONMENT AND HEALTHBONN OFFICE
ANNEX 3. EXAMPLE OF A FACT SHEET
Policies to reduce environmental tobacco smoke exposure
Implementation of policies to reduce exposure to environmental tobacco smoke in the public indoor environment varies among European countries and is not sufficient. Further enforcement of comprehensive policies is needed in public places, especially the workplace, public buildings, restaurants and bars.
Scor
eTa
jikis
tan
Arm
enia
Alb
ania
Swit
zerla
nd
Uni
ted
King
dom
Geo
rgia
Net
herla
nds
Uzb
ekis
tan
Den
mar
k
Mal
ta
Ukr
aine
Ger
man
y
Spai
n
Slov
akia
Aus
tria
Bela
rus
Latv
ia
Irel
and
Port
ugal
Lith
uani
a
Nor
way
Fran
ce
Gre
ece
Ital
y
Rep
ublic
of M
oldo
va
Belg
ium
Slov
enia
Russ
ian
Fede
ratio
n
Cze
ch R
epub
lic
Hun
gary
Swed
en
Finl
and
Icel
and
Bulg
aria
Esto
nia
Cro
atia
Pola
nd
The
form
er Y
ugos
lav
Rep
ublic
of M
aced
onia
Note: The composite index was calculated based on information provided by WHO Member States for the WHO European Ministerial Conference on Tobacco Control held in Warsaw in February 2002 (2,3). A higher index reflects a more extensive scope and comprehensive policies in place.
Fig. A3.1. Composite index of the scope of the policies to reduce ETS exposure and promote smoke-free zones as reported by countriesSource: Tobacco Control Database (1).
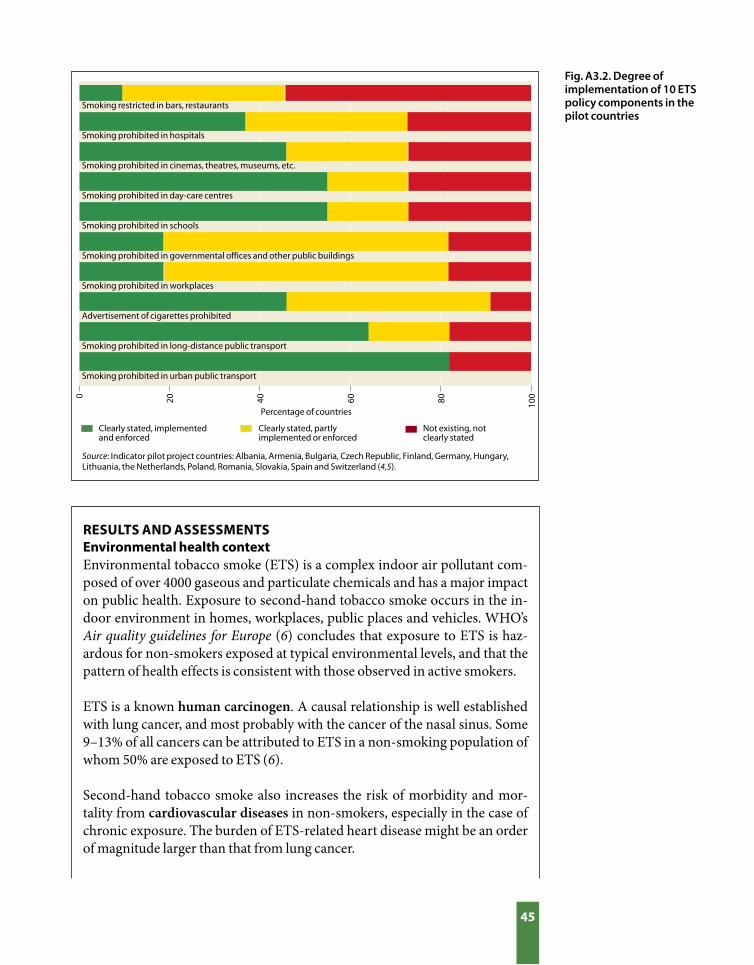
45
0 20 40 60 80 100
Smoking restricted in bars, restaurants
Smoking prohibited in hospitals
Smoking prohibited in cinemas, theatres, museums, etc.
Smoking prohibited in day-care centres
Smoking prohibited in schools
Smoking prohibited in governmental offices and other public buildings
Smoking prohibited in workplaces
Advertisement of cigarettes prohibited
Smoking prohibited in long-distance public transport
Smoking prohibited in urban public transport
Percentage of countries
Source: Indicator pilot project countries: Albania, Armenia, Bulgaria, Czech Republic, Finland, Germany, Hungary, Lithuania, the Netherlands, Poland, Romania, Slovakia, Spain and Switzerland (4,5).
RESULTS AND ASSESSMENTSEnvironmental health contextEnvironmental tobacco smoke (ETS) is a complex indoor air pollutant com-
posed of over 4000 gaseous and particulate chemicals and has a major impact
on public health. Exposure to second-hand tobacco smoke occurs in the in-
door environment in homes, workplaces, public places and vehicles. WHO’s
Air quality guidelines for Europe (6) concludes that exposure to ETS is haz-
ardous for non-smokers exposed at typical environmental levels, and that the
pattern of health effects is consistent with those observed in active smokers.
ETS is a known human carcinogen. A causal relationship is well established
with lung cancer, and most probably with the cancer of the nasal sinus. Some
9–13% of all cancers can be attributed to ETS in a non-smoking population of
whom 50% are exposed to ETS (6).
Second-hand tobacco smoke also increases the risk of morbidity and mor-
tality from cardiovascular diseases in non-smokers, especially in the case of
chronic exposure. The burden of ETS-related heart disease might be an order
of magnitude larger than that from lung cancer.
Fig. A3.2. Degree of implementation of 10 ETS policy components in the pilot countries
Not existing, not clearly stated
Clearly stated, partly implemented or enforced
Clearly stated, implemented and enforced
46
ETS also causes irritation of the eyes, nose, throat and lungs, leading to cough-
ing, excess phlegm, chest discomfort and reduced lung function. For the ma-
jority of non-smokers, ETS is a source of annoyance and discomfort.
Exposure to ETS at home continues to be a public health concern, especially
for vulnerable groups such as infants, young children and the elderly.
Children whose parents smoke are among the most seriously affected by ex-
posure to second-hand smoke, being at increased risk of lower respiratory
tract infections such as pneumonia, bronchitis and middle-ear infection.
Some 15–26% of lower respiratory illness in infants is estimated to be attribut-
able to ETS exposure, assuming that 35% of mothers smoke at home. In asth-
matic children, ETS increases the severity and frequency of asthma attacks
(6). Smoking by parents exposes children as early as the prenatal and neonatal
period. Both active smoking by mothers and ETS increase the risk of low birth
weight. ETS is also associated with the sudden infant death syndrome.
Policy relevanceThis indicator provides a general measure of the capacity to implement pol-
icies to reduce exposure to ETS and to promote smoke-free areas in WHO
European Member States. The framework for national tobacco control poli-
cies aiming at a reduction of ETS exposure is set by legislative measures to
prohibit or restrict smoking in indoor public places, as well as by normative
acts regulating the advertising of tobacco products.
On the European scale, Member States have adopted a European Strategy
for Tobacco Control, based on the recommendations of the Ministerial
Conference for a Tobacco-free Europe (2,7). The Strategy provides the frame-
work and guidance for national action and for international cooperation aim-
ing to promote and facilitate the adoption of comprehensive, evidence-based
tobacco control policies reflected in national action plans and legislation (7).
The structure and content of the Strategy are consistent with the recently en-
dorsed WHO Framework Convention on Tobacco Control, whose objective it
is to protect present and future generations from the devastating consequenc-
es of tobacco consumption and exposure to tobacco smoke (8). In signing the
Convention, countries express their political support and good faith to abide
by its principles.
The environmental tobacco smoke component of the European Strategy on
Tobacco Control will be reviewed at the Fourth Ministerial Conference on
Environment and Health, in Budapest in June 2004, where the specific strat-
egy targets to be achieved in the WHO European Region by 2007 will be set.
47
Policy contextPolicies to restrict smoking in the public indoor environment and prohibit
tobacco advertisement are implemented in Member States within national to-
bacco control action plans, public health programmes and national environ-
ment and health action plans (NEHAPs) (4).
Regulatory approaches towards ETS policies in specific public indoor envi-
ronments vary among European countries. Most of the policy instruments
are based on national legislation, while some are based on executive orders
or other regulations at subnational level, especially in countries with a federal
structure. In Germany, workplace smoking regulations are set out in federal
law, while many other aspects are the competence of the federal states or even
the local authorities (4). In Switzerland, smoking restrictions in educational
and health care facilities, government offices and other public buildings are
based mainly on voluntary agreements at cantonal level (4).
Protection of non-smokers in the workplace is subject to national laws in all
Member States. Current laws in principle guarantee the right to a smoke-free
workplace for most employees while failing to protect others, including some
office workers and employees in bars and restaurants (2,7).
As recognized in the WHO Framework Convention, there are no effective re-
porting mechanisms for assessing the implementation and effectiveness of
policies on ETS. The quality and methodology of existing surveys are not suffi-
ciently reliable to interpret and monitor the dynamics of tobacco use. European
countries lack suitable reporting mechanisms and surveillance systems. A har-
monized and reliable monitoring system is needed to allow the evaluation of
ETS-related policies within and across countries and to facilitate exchange of
comprehensive information. At present, in the EU countries, the implementa-
tion of legislation and other effective measures to limit exposure to ETS is not
subject to mandatory reporting (8).
Under the WHO Framework Convention, countries will work with WHO
and other international and intergovernmental organizations towards estab-
lishing national surveillance systems, and cooperate with WHO in the devel-
opment of guidelines for defining the collection, analysis and dissemination
of tobacco-related surveillance data (9).
AssessmentAs assessed for the WHO European Ministerial Conference on Tobacco free
Europe (2,7,10) almost 80% of the Member States have bans or restrictions
on smoking in public places and workplaces, although the degree of imple-
mentation varies widely. Tobacco control policies lack sustainability and
comprehensiveness and are not high on the policy agenda in many European
48
countries. In addition, insufficient coordination and inadequate funding and
monitoring reduce the effectiveness of national action.
A lack of harmonized tools to assess policy effectiveness affects the compara-
bility of information on the implementation of ETS policies in different coun-
tries. Data collection and reporting methods are not consistent among coun-
tries, and harmonized assessment instruments are needed.
Most consistently, European countries report satisfactory implementation of
ETS-related policies in public transport, especially in urban settings.
Much effort is still needed to strengthen policies to protect employees and
customers from ETS in bars and restaurants; the lowest policy coverage is re-
ported for this indoor environment. More than half of the reporting countries
have no regulations in this respect. Simple measures, such as designation of
non-smoking areas, or even separating smokers and non-smokers within the
same space, may reduce (though not eliminate) involuntary exposure. Efforts
to improve policy implementation pertain to the need to protecting both cus-
tomers, including minors, and employees, who are excluded from ETS work-
place regulations in many countries. As levels of exposure in bars and restau-
rants are much higher than in other occupational settings, the development
of effective policy instruments to ensure a smoke-free workplace should be
further promoted (4). A recent survey of the owners and employees of bars
and restaurants in five European countries indicate that most of them (78%)
are aware of the health risks of ETS exposure. A similar number agree that
smoke-free areas protect the health of customers and workers, while at the
same time responding to public demand (11).
All but 2 of the 14 Member States considered have legal instruments to pro-
tect non-smokers from ETS in the workplace. These policies can reduce
ETS exposure of workers provided they are effectively implemented. As for
now, ETS remains common in the workplace in many European countries,
and is strongly influenced by the type of smoking policy and the level of en-
forcement. An unsatisfactory level of policy implementation is consistent
with the reported high proportion of annoyance and exposure to ETS in the
workplace. According to a recent survey in Lithuania (4), 17% of adults are
exposed to ETS for more than five hours daily, and only one third have never
been exposed to ETS at work. In Switzerland, almost one quarter of work-
ing respondents reported being annoyed by ETS at the workplace, although
this had decreased from 35% in 1990. In 1996, 50% of participants in a Swiss
study claimed to be confronted with conflicts at work owing to ETS (4). In
Germany, exposure to ETS is widespread at the workplace, in restaurants and
during social occasions. About three million employees are regularly exposed
to ETS at their place of work, the extent of exposure depending on the type of
workplace. Half of the non-smoking employees and trainees in Germany are
49
exposed to ETS in occupational settings (4). A review of the major European
studies shows that the proportion of adults exposed regularly to ETS at the
workplace exceeds 10% in most Member States, and may be as high as 50%
(12).
Efforts must be continued to strengthen the enforcement of existing policy in-
struments aiming at completely smoke-free workplaces. Restrictive measures,
such as the designation of specific areas or improved ventilation, are not suf-
ficient to ensure smoke-free air. Policies to prevent exposure to second-hand
smoke at work should ultimately apply to all indoor places of employment.
Less than 40% of the reporting countries claim full implementation of a smok-
ing ban in hospitals. The legal measures to prohibit smoking in theatres and
museums are assessed as fully implemented in less than half of participating
Member States. Almost one third of them have no policies for these indoor
settings.
It is worth noting that, even though most of the countries have regulations on
smoking restrictions in governmental offices and public buildings, only 20%
report full policy implementation. Such levels of implementation can reflect
insufficient coordination and enforcement in many countries. In Switzerland,
37% of participants in a survey reported to be at least sometimes annoyed by
ETS in public buildings and places such as cinema foyers (4).
More than half of the 14 countries declare full implementation of ETS policies
in day care centres and schools; in almost 30% there are no policies for public
settings where children stay.
Regulatory measures, such as eliminating smoking in schools, day cares and
public places, do not address the main source of child exposure to ETS – the
home. As legislation to ban smoking at home is unlikely, other initiatives must
be put in place. Specific interventions to reduce the exposure of children and
young people to ETS should be the well defined objectives of national and in-
ternational initiatives focusing on children’s health and the environment.
Efforts are needed to educate and raise awareness on the particular vulner-
ability of children to ETS, including during the prenatal period. Targeted
interventions should address the age-related differences in ETS exposure
conditions: for infants and young children parental smoking at home is the
main source of exposure, while for older children and adolescents other set-
tings, including schools and certain public places (clubs, shops, discos, etc.)
may significantly contribute to their exposure to ETS. In Switzerland, in 2000,
two thirds of study participants with children in the household reported re-
stricting smoking to certain parts of the home, and 18% stated that they only
smoked outside. On the other hand, the study revealed that around 50% of
50
schoolchildren in 2000 were still exposed to ETS at home, a figure that had
not changed significantly over the previous 10 years. In 1999, 15% of pregnant
women were smoking (4).
Policy efforts are needed to target the gender, age and socioeconomically re-
lated risk groups for exposure to ETS. For example, in Germany, the propor-
tion of smokers among female single parents is twice as high (45.8%) as in a
reference group (23.6%) and exposure of children to ETS is related to socio-
economic status of the household. In over 36% of families of low socioeco-
nomic status with small children there is more that one smoker, compared
with 16% in higher socioeconomic groups (4).
Regulations on the advertisement of tobacco products exist in all but one of
the 14 countries. Nevertheless, in almost 55% of the countries they are not
sufficiently enforced. In some countries advertising is prohibited, while in
others, such as Germany and Switzerland, it is restricted. In Switzerland, two
referenda on a complete ban on tobacco advertising (in 1979 and 1993) have
already been rejected (4).
With policies to promote a smoke-free public indoor environment in place,
the level of enforcement of existing legislation is still incomplete and exposure
to ETS in European countries remains unacceptably high. As shown by the
recent survey in Germany, a total of 55% of all non-smokers state that they
are exposed to ETS (4). With an adult smoking prevalence of 30–50% in de-
veloped societies, an estimated 50% or more of homes are occupied by at least
one smoker, leading to a high prevalence of ETS exposure among children
and other non-smokers. As shown in the review of the European studies, the
average proportion of children exposed to second-hand smoke at home ex-
ceeds 40% (4,10,12).
51
REFERENCES1. WHO Tobacco Control Database (http://data.euro.who.int/tobacco,
accessed 22 March 2004).
2. The European report on tobacco control policy. Review of implementation of
the Third Action Plan for a Tobacco-free Europe 1997–2001. Copenhagen,
WHO Regional Office for Europe, 2002 (document EUR/01/5020906/8)
(http://www.euro.who.int/Document/E74573.pdf, accessed 29 March
2004).
3. Warsaw Declaration for a Tobacco-free Europe, 2002 (http://www.euro.
who.int/eprise/main/WHO/AboutWHO/Policy/20020422_1, accessed 26
March 2004).
4. National fact sheets from Albania, Armenia, Bulgaria, Germany,
Lithuania, Netherlands, Poland, Romania, Slovakia, Spain and
Switzerland.
5. Environmental health indicators for the WHO European Region: update of
methodology May 2002. Copenhagen, WHO Regional Office for Europe,
2002 (document EUR/02/5039762) (http://www.who.dk/document/
E76979.pdf, accessed 22 March 2004).
6. Air quality guidelines for Europe. Copenhagen, WHO Regional Office for
Europe, 2000 (WHO Regional Publications, European Series, No. 91)
(http://www.euro.who.int/air, accessed 23 March 2004).
7. European Strategy for Tobacco Control. Copenhagen, WHO Regional
Office for Europe, 2002 (document EUR/02/5041354 (http://www.euro.
who.int/document/e77976.pdf, accessed 23 March 2004).
8. Council Recommendation of 2 December 2002 on the prevention of
smoking and on initiatives to improve tobacco control (2003/54/EC).
Official Journal of the European Communities, 2002, L 22/31.
9. WHO Framework Convention on Tobacco Control (http://www.who.int/
tobacco/fctc/text/en/fctc_en.pdf, accessed 23 March 2004).
10. Policies to reduce exposure to environmental tobacco smoke. Copenhagen,
WHO Regional Office for Europe, 2002 (document EUR/00/5020495)
(http://www.euro.who.int/document/e70610.pdf, accessed 23 March
2004).
11. Watson R. Smoke free areas do not harm profits, survey shows. British
Medical Journal, 2003, 326:1232.
12. Exposure to environmental tobacco smoke in Europe: a review. Technical
Report, WHO European Centre for Environment and Health, Bonn
(unpublished).
52
METADATA
Data sourceEnvironmental Health Indicators project – pilot data collection (data avail-
able in the project database - EuroIndy).
Pilot national indicator fact sheets.
WHO Tobacco Control Database: http://cisid.who.dk/tobacco.
Description of data Temporal coverage and frequency of data collection/update: most recent data
provided – current regulations.
Quality of informationQualitative assessment of the extent of application and enforcement of regula-
tions to reduce ETS exposure. Evaluation made by common observations and
expert judgement. No harmonized evaluation methods; possible subjective
judgement.
Data strengths and weaknessesLegal regulations to implement policies; possible subjective judgement.
EN
VI
RO
NM
EN
TA
L
HE
AL
TH
I
ND
IC
AT
OR
S
FO
R
EU
RO
PE
•
A
P
IL
OT
I
ND
IC
AT
OR
-B
AS
ED
R
EP
OR
T
World Health OrganizationRegional Office for Europe
Scherfigsvej 8, DK-2100 Copenhagen Ø, Denmark
Tel.: +45 39 17 17 17Fax: +45 39 17 18 18
E-mail: [email protected] site: www.euro.who.int
The Environment and Health Information System (EHIS) is a valuable tool for monitoring and evaluating the implementation and modification of policies. The crucial element of a harmonized EHIS is a set of indicators that allows for the monitoring of public health and its determinants. This report is the product of a pilot study completed within the WHO process of developing a methodology for a pan-European EHIS. It illustrates the application of indicators for integrated public health assessment and reporting in four topic areas: air pollution, noise, transport accidents, and water and sanitation. The report provides an insight into effective methods for integrating information from environmental monitoring and health surveillance, using the scientific knowledge of exposure–response associations. These methods can both help in answering key questions on the effect of policies on health and the environment, and provide guidance on future policies and actions. The report also demonstrates the limitations of routinely collected data and outlines the need for strengthening cooperation between international agencies and the Member States.
E82938
PilotCover.indd 1PilotCover.indd 1 27-05-2004 10:41:5027-05-2004 10:41:50


