16
The Environment, Green Growth & Agriculture Horsens, Denmark, 5 June 2012 Simon Upton Director OECD Environment Directorate For more information, see
| Date post: | 02-Jan-2016 |
| Category: |
Documents |
| Upload: | halla-gordon |
| View: | 31 times |
| Download: | 0 times |
The Environment, Green Growth & Agriculture Horsens, Denmark, 5 June 2012
Simon Upton
DirectorOECD Environment Directorate
For more information, see www.oecd.org/greengrowth
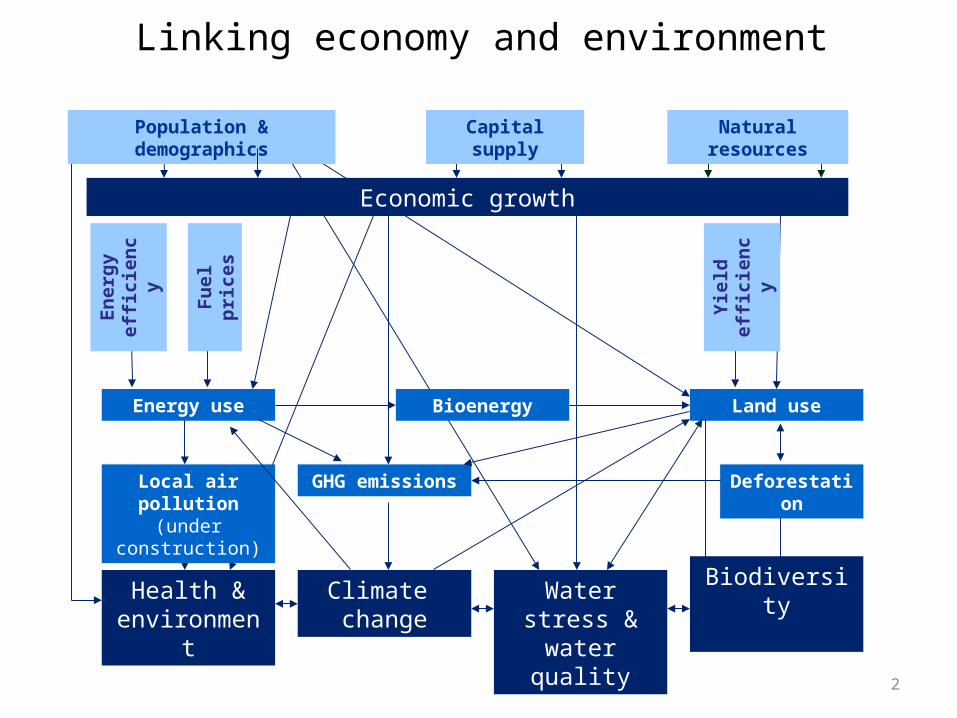
Linking economy and environment
Health & environment
Local air pollution
(under construction)
Land use
Yie
ld
effi
cien
cy
Biodiversity
Energy use
Fu
el p
rice
s
En
erg
y ef
fici
ency
2
DeforestationGHG emissions
Climate change
Water stress & water quality
Economic growth
Population & demographics Capital supply Natural resources
Bioenergy
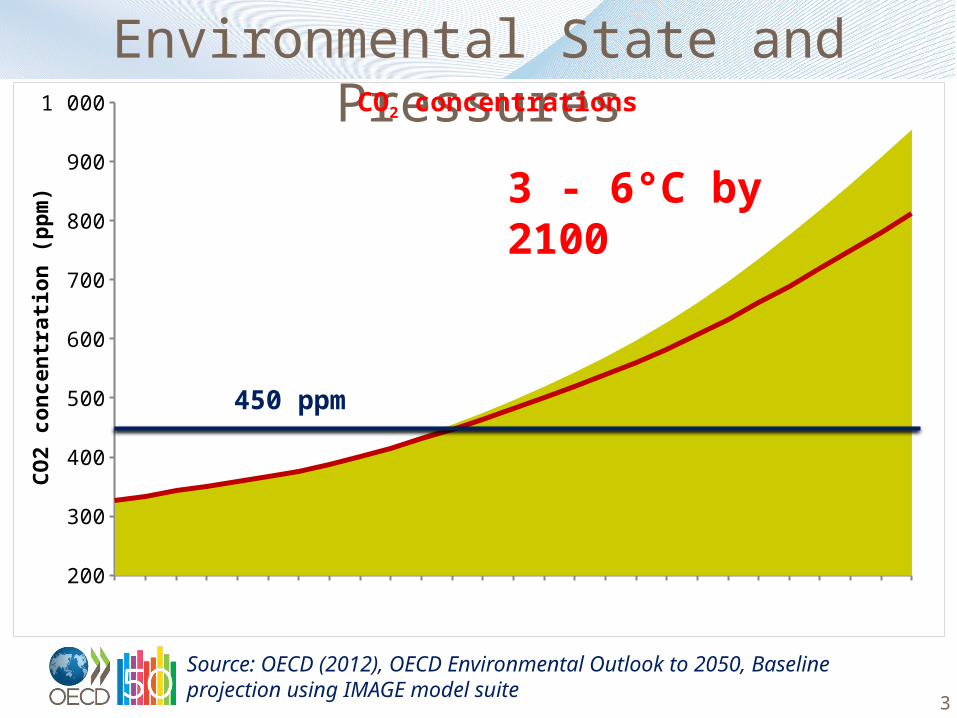
Environmental State and Pressures
Source: OECD (2012), OECD Environmental Outlook to 2050, Baseline projection using IMAGE model suite
3
CO2 concentrations
3 - 6°C by 2100
200
300
400
500
600
700
800
900
1 000
CO
2 c
on
ce
ntr
ati
on
(p
pm
)
450 ppm
-
1,000
2,000
3,000
4,000
5,000
6,000
7,000
8,000
9,000
10,000
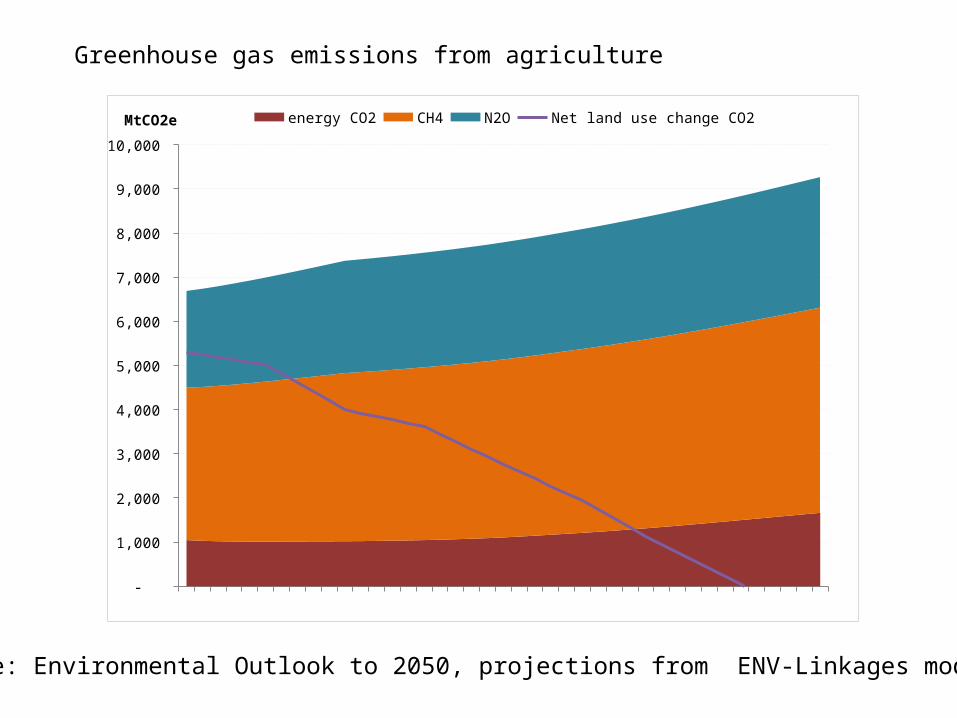
energy CO2 CH4 N2O Net land use change CO2MtCO2e
Greenhouse gas emissions from agriculture
Source: Environmental Outlook to 2050, projections from ENV-Linkages model
Source: OECD Environmental Outlook Baseline; output from IMAGE5
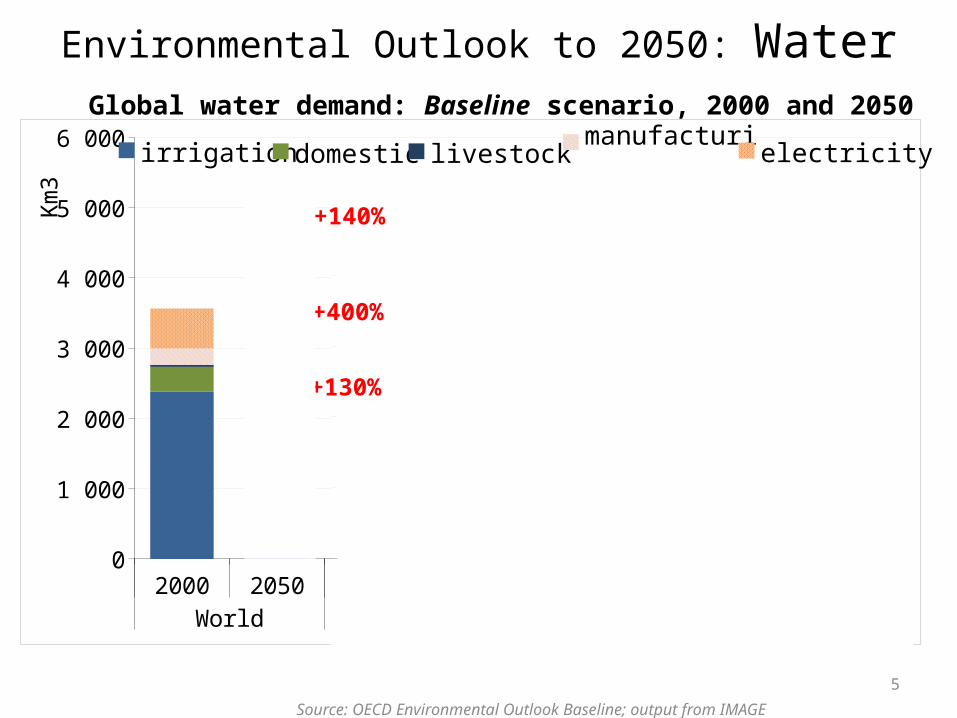
Environmental Outlook to 2050: WaterGlobal water demand: Baseline scenario, 2000 and 2050
2000 2050 2000 2050 2000 2050 2000 2050World OECD BRIICS RoW
0
1 000
2 000
3 000
4 000
5 000
6 000 irrigation domestic livestock manufacturing electricity
Km
3
+400%
+130%
+140%
Source: OECD Environmental Outlook Baseline; output from IMAGE
6
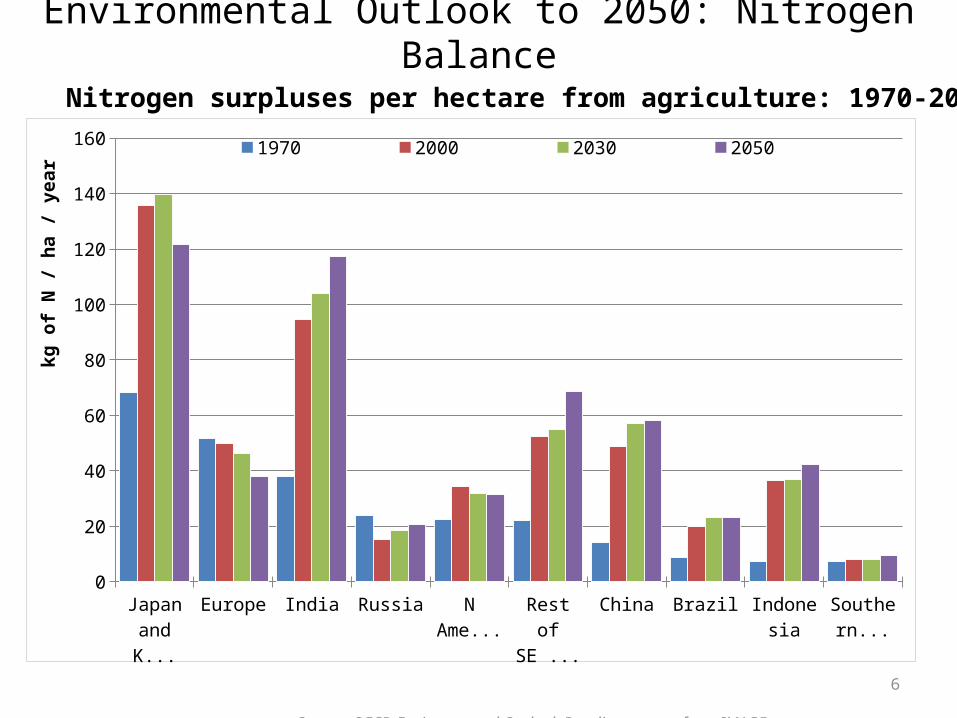
Environmental Outlook to 2050: Nitrogen Balance
Nitrogen surpluses per hectare from agriculture: 1970-2050
Japan and
Korea
Europe India Russia N Amer-ica
Rest of SE Asia
China Brazil Indonesia Southern Africa *
0
20
40
60
80
100
120
140
160 1970 2000 2030 2050
kg o
f N /
ha
/ ye
ar

Source: OECD Environmental Outlook Baseline; output from IMAGE7
Environmental Outlook to 2050: Water
Source: OECD Environmental Outlook Baseline; output from IMAGE8
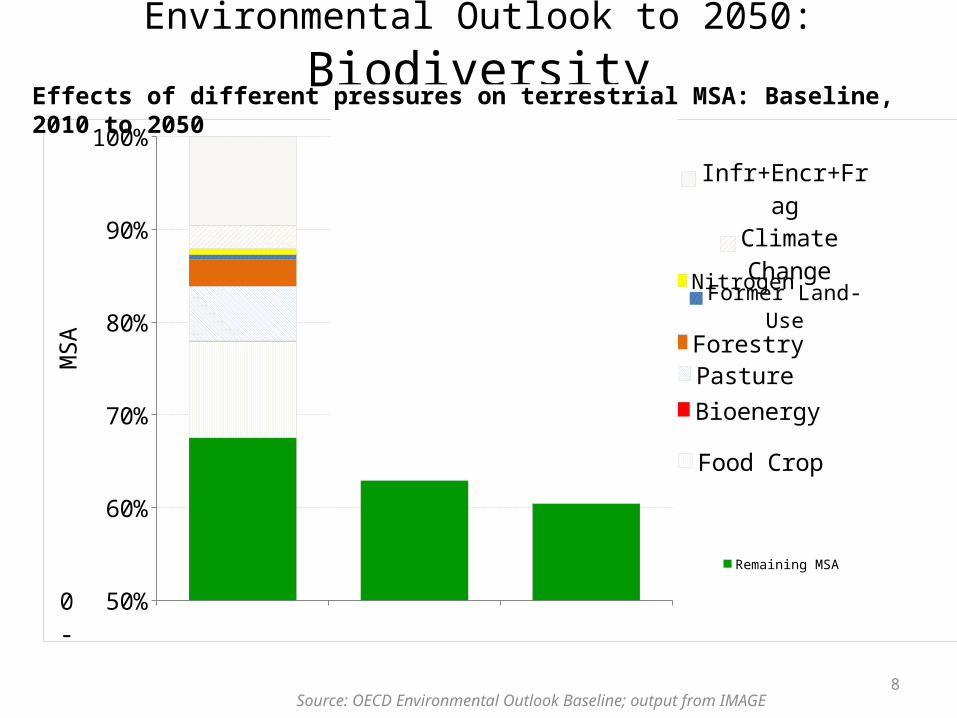
Environmental Outlook to 2050: Biodiversity
2010 2030 205050%
60%
70%
80%
90%
100%
Remaining MSA
Food Crop
Bioenergy
PastureForestry
Former Land-UseNitrogenClimate Change
Infr+Encr+Frag
MS
A
0-
Effects of different pressures on terrestrial MSA: Baseline, 2010 to 2050

Challenges are so big that we can’t afford expensive solutions
Source: OECD Environmental Outlook Baseline; output from IMAGE10
Environmental Outlook to 2050: What policies do we need?
• Make pollution more costly
• Value and price the natural assets and ecosystem services
• Remove environmentally harmful subsidies
• Devise effective regulations and standards
• Encourage green innovation

Israeli freshwater use (2009)a
a) Or latest available yearSource: OECD, Environment Directorate. 11
220
390
560
640
710
1 630
0 400 800 1200 1600 2000 2400
Israel
Germany
Turkey
Australia
Spain
United States
m3/ capita
Abstraction per capita
a) Or latest available year. Source: OECD, Environment Directorate.
86.4
27.6
17.8
3.6
29.2
19.6
0 20 40 60 80 100
Israel
Germany
Turkey
Australia
Spain
United States
abstraction as %of internal resources
Intensity of use

Israeli economic efficiency of agricultural water use, 1986-2008
Source: OECD (2010), OECD Review of Agricultural Policies: Israel, 2010 .12
0
20
40
60
80
100
120
140
Index 1986=100
Agricultural output value per m3 of water used for irrigation
Real agricultural freshwater price (deflated by the consumer price index)
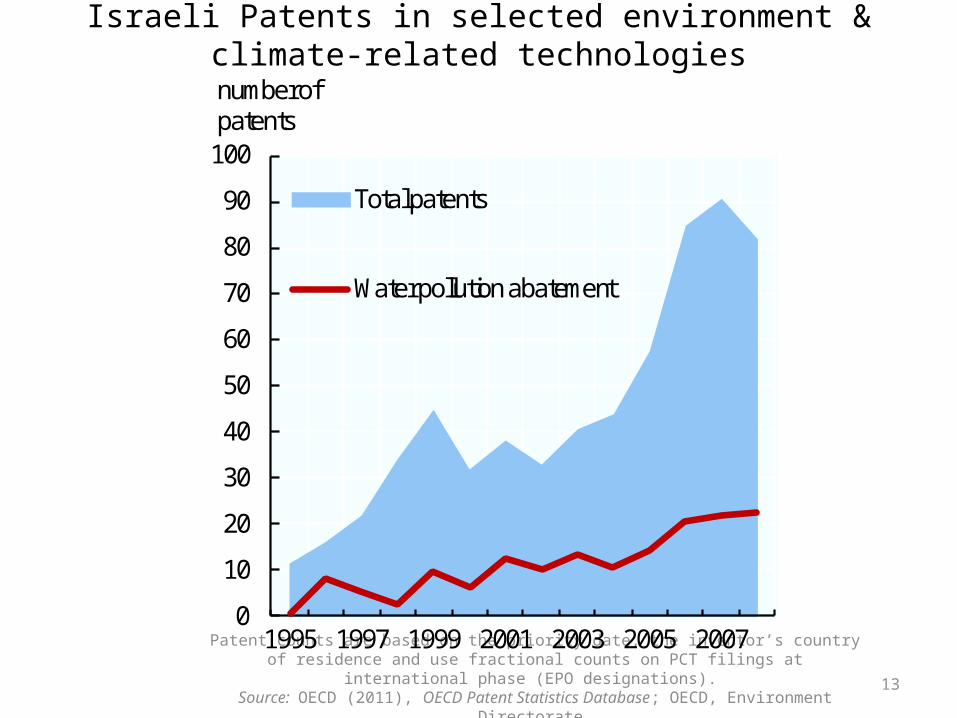
Israeli Patents in selected environment & climate-related technologies
Patent counts are based on the priority date, the inventor’s country of residence and use fractional counts on PCT filings at international phase (EPO designations).
Source: OECD (2011), OECD Patent Statistics Database; OECD, Environment Directorate.13
0
10
20
30
40
50
60
70
80
90
100
1995 1997 1999 2001 2003 2005 2007
General environmental management technologies, 1995-2008
Total patents
Water pollution abatement
number of patents

Inventive Activity in Solid Waste Management in Germany
14
19781980
19821984
19861988
19901992
19941996
19982000
20022004
20062008
0
5
10
15
20
25
30
35
40
45
0
2000
4000
6000
8000
10000
12000
14000
16000
18000
20000
All tech. fields (right axis) Solid waste collection
Material recycling Fertilizers from waste
Incineration and energy recovery Waste management - not elsewhere classified
Nu
mb
er
of p
ate
nts
Nu
mb
er
of p
ate
nts
(a
ll se
cto
rs)
Mandatory Waste Recovery
Packaging Waste Recycling Law
Note: The Figure shows the number of patent applications filed under the Patent Co-operation Treaty. Source: OECD Patent Statistics Database; OECD Indicator of Environmental Technologies.
EPR Law
Landfilling Law
What you don’t know can hurt you
www.oecd.org/environment/outlookto2050

Thank you
For more information, see www.oecd.org/greengrowth


