Page 1
The Environmental Impact Assessment of Cal Poly's Manufacturing
Laboratory
Yoonho Mark Kim
Advisor: Dr. Trevor Harding
California Polytechnic State University, San Luis Obispo
Materials Engineering Department
June 9, 2014
Page 2
Acknowledgements
I would like to thank my advisor, Dr. Trevor Harding for assigning tasks and
previewing the presentation for the technical conference. I also want to thank Ladd Caine and
Professor Rod Hoadley for providing advices and allowing me to work on the IME 144
laboratory.
Page 3
Table of Contents
List of Figures............................................................................................................................................................... i
Abstract ......................................................................................................................................................................... ii
1 Introduction .............................................................................................................................................................. 1
1.1 Environmental Impact Assessment ......................................................................................................... 1
2.1 Screening ...................................................................................................................................................... 2
2.2 Scoping ......................................................................................................................................................... 3
2.3 Environmental Impact Evaluation .......................................................................................................... 5
2.3.1 Traditional Approach .................................................................................................................... 5
2.3.2 Modern Approach .......................................................................................................................... 7
2.4 Alternatives ............................................................................................................................................... 11
3 Conclusion ............................................................................................................................................................. 12
4. References ............................................................................................................................................................. 14
5. Appendices ........................................................................................................................................................... 15
5.1 Appendix A - amounts of solid waste streams from the IME 144................................................ 15
5.2 Appendix B - List of IF-THEN Rule in the fuzzy inference system ............................................ 15
5.3 Appendix C - Graph of amounts of waste streams and the level of sustainability ................... 16
Page 4
i
List of Figures
Figure 1. A Leblond manual lathe. Note that it has a chip pan on the bottom. .......................... 3
Figure 2. A Kent knee mill. Note that it does not have a chip pan or waste container. ............ 4
Figure 3. An example of a Leopold matrix. The row represents environmental effects while
the column represents environmental activity of each component. Each cell is filled
with magnitude and importance. .................................................................................................. 6
Figure 4. Example of (A) a crisp set and (B) a fuzzy set that describe steepness of a slope.
The red line represents a slope whose steepness is 19% while the blue line represents a
slope whose steepness is 21%. ..................................................................................................... 8
Figure 5. Fuzzy logic Simulink model built in MATLAB. The yellow, red, and blue block
each represents the measured amount of aluminum chips in lathes, the estimated
amount of aluminum chips and other waste in trashcans, respectively. ............................. 9
Figure 6. Membership functions of inputs and output of the fuzzy logic inference system. (A)
Each input has three linguistic variables represented by Gaussian membership
functions. (B) Output has two linguistic variables. It shows the level of sustainability in
a scale of 0 to 1. Higher value implies that the system is sustainable. ............................. 10
Figure 7. Surface view of inputs and output of the fuzzy logic inference system. The x and y
axis represents solid waste from the IME 144 laboratory while the z-axis represents the
output, the level of sustainability. ............................................................................................. 11
Page 5
ii
Abstract
The purpose of the study is to obtain basic understanding of the sustainability of Cal
Poly IME 144 laboratory. Since the general condition of the lab prevents precise, efficient
data collection, fuzzy logic is used to provide an overview of the laboratory's sustainability.
Aluminum chips, brass chips, and paper waste are identified as primary waste streams.
Electric usage of the laboratory is approximately calculated based on the machines' running
time. Fuzzy logic system with three inputs and one output is designed in the Matlab software
environment with Simulink to simulate a model for the laboratory's sustainability. Also the
study suggests a few alternatives to improve the sustainability based on the model.
Keywords: Materials, Engineering, Sustainability, Environmental Impact Assessment, Fuzzy
Logic, Fuzzy Simulation
Page 6
1
1 Introduction
Since the industrial revolution in the late 1700s and early 1800s, major industrial,
technological developments have been achieved; transportation and manufacturing fields
have experienced dramatic developments over time. As the efficiency of industrial tools have
increased, concerns for the environment have followed the same trend. The nature's self
purification ability and its resources are limited. Reckless exploitation of finite natural
resources such as woods and ores should be prevented. Sustainability has become a keyword
for engineers whose new responsibility becomes efficient use and preservation of limited
resources. Various methods has been proposed to evaluate and control sustainability of
industrial environments. A relatively modern approach, environmental impact assessment
based on fuzzy logic, has been conducted to obtain baseline understanding and evaluate the
sustainability of the Cal Poly's IME 144 laboratory.
1.1 Environmental Impact Assessment
An Environmental Impact Assessment (EIA) is a process used to predict
environmental consequences of a selected system or project. The assessment begins with
screening process; this is a step to ensure that the proposed project or system has significant
environmental impact. If it is decided that the system has significant impact, scoping process
takes place. Purpose of the step is to identify components or waste streams of the system
while defining assumption and limitation of the whole process. Third step, environmental
impact evaluation, identifies the component with the most significant environmental impact
by analyzing and measuring an environmental impact of each component. Since the step
requires calculation based on various quantified values, it is considered to be the most
difficult and technical step during the process. Scholars proposed numerous methods to
Page 7
2
evaluate the environmental impact. Generally, they can be divided into two categories:
traditional and modern approach. Fourth step of the assessment proposes alternatives to
improve the sustainability of the system. Stakeholders and decision makers can rely on the
impact evaluation and choose alternative ways to improve the sustainability of the system or
project. If the alternatives are considered to be feasible physically, economically, and
systemically, proposed changes can be made to prevent negative environmental consequences
by reducing environmental impact.
2 Assessment Procedure
An EIA with the four basic steps was conducted on the IME 144 laboratory:
screening, scoping, environmental impact evaluation, and alternatives.
2.1 Screening
IME 144, Introduction to Design and Manufacturing, is a course where a student can
have hands-on experience with conventional machining process such as lathes, mills, and
computer numeric control (CNC) as well as computer-aided design (CAD) with the
SolidWorks software. The course is taken by engineering students from various departments
such as Materials, Industrial, Manufacturing, and Aerospace. Every quarter, the course ㅛ
accommodates more than a hundred students; students are to spend six hours per week in the
laboratory to learn the conventional industrial manufacturing process. Since it is a large
course that lets students to work on manufacturing environment, waste and chips from the
laboratory resemble industrial solid waste from a manufacturing line.
The course is taught in the main machining lab (Building 41, room 107). The
laboratory has 10 Leblond manual lathe (Figure 1), 6 Kent knee mills (Figure 2), broach,
Page 8
3
centerless grinder with assorted drill presses, brakes, presses, 1 HASS CNC 4 axis mini mill
(Figure 3), and 1 HASS CNC HL-2 lathe. The laboratory is mainly used by students from
IME 144. There are 10 lab sections of IME 144 while other classes only have two or three
sections per week. Therefore, it is reasonable to assume that the IME 144 course has more
significant environmental impact than any other course does.
Figure 1. A Leblond manual lathe. Note that it has a chip pan on the bottom.
2.2 Scoping
Manual lathes were the most frequently used machines by the IME 144 students.
Instructors calibrated each lathe to a specific setting to work on specific materials such as
aluminum and brass. Each lathe had a chip pan on the bottom (Figure 1). The aluminum chips
from lathes were not contaminated by chips and impurities from other machines. The chips
were collected at the end of the day and sent to the junk yard behind the building. Waste
contractor hired by Cal Poly came at the end of the quarter to collect the recyclable materials
from the yard. The aluminum chips from lathes were identified as the first solid waste stream
from the laboratory and its amount was measured using a portable electronic fish scale
(Appendix A).
Page 9
4
Knee mills were also used by the students to work on aluminum and brass parts.
Unlike the manual lathes, the mill did not have a chip pan on the bottom. When a student
worked on the machine, chips fell to the floor and contaminated by other metal chips and
impurities such as hair, dirt, and dust. At the end of every class section, students were
responsible for cleaning the floor and discarding the waste under the machines to trashcans;
the solid waste generated by the mills were not recycled since it was impractical to manually
sort the materials from the trashcans. The total amount of chips in trashcans were measured
and relative amount of aluminum chip and other wastes were estimated (Appendix A).
Aluminum chips in trashcans were identified as the second waste stream while other waste in
trashcans were identified as the third.
Figure 2. A Kent knee mill. Note that it does not have a chip pan or waste container.
CNCs were rarely used by the IME 144 students. The machines were mostly used by
students from upper classes. Therefore, solid waste generated by the CNCs was assumed to
be less influential in the sustainability of the IME 144; therefore, the waste stream was not
included in the environmental impact evaluation.
Page 10
5
2.3 Environmental Impact Evaluation
Solid waste streams from the IME 144 laboratory were identified during the scoping
process; observation on the solid waste flow were made and the amount of each waste stream
were measured; the three waste streams were aluminum chips in lathes, aluminum chips in
trashcans, and other waste in trashcans. Environmental impacts of each waste stream were
evaluated based on the observation and data.
2.3.1 Traditional Approach
A traditional method to evaluate environmental impacts relies on a Leopold matrix
(Figure 3). The matrix requires precisely measured, quantified values as a magnitude of each
component. Environmental impacts are calculated based on the magnitude and importance,
which is a weighting factor that represents each component's level of significance. Also the
matrix needs a large set of data as inputs to produce reliable results.
Page 11
6
Figure 3. An example of a Leopold matrix. The row represents environmental effects while the
column represents environmental activity of each component. Each cell is filled with magnitude and
importance.
.
Unfortunately, measuring all environmental impacts of solid waste can be impractical.
Spending excessive time and money to precisely measure amount of each waste stream is not
an efficient approach to start the environmental impact evaluation. Due to the complicated
nature of the solid waste flow system, environmental evaluators need to take missing or
insufficient data into account when conducting the environmental impact evaluation. Since
obtaining quantified data on all waste streams is not ideal, evaluators rely on estimation based
on various observation of the system. However, such observation can be subjective. In order
to quantify environmental impacts of subjective nature, fuzzy logic, a mathematical set theory
Page 12
7
that helps evaluators to make decision in uncertain environment, is implemented in the EIA
process.
2.3.2 Modern Approach
A modern approach to evaluate environmental impacts is to implement fuzzy logic to
the traditional method. The use of fuzzy logic eliminates the requirements of the traditional
evaluation process. Since obtaining a large set of quantified data is not necessary, the modern
approach is more practical and efficient than the traditional method. Therefore, the evaluation
with fuzzy logic was conducted to calculate the environmental impacts of waste stream in the
IME 144, where only three sets of data were obtained.
Fuzzy logic is a mathematical set theory that uses membership functions and
linguistic variables to classify and quantify data that are subjective in nature. Fuzzy logic
utilizes fuzzy sets, which is different from crisp sets that is frequently used in engineering
fields. The both types of set interpret information differently. If a decision maker wants to
evaluate steepness of two slopes, he can choose to rely on one of the two types of set
(Figure 4). Based on the crisp sets, the threshold for a steep slope is defined as 20%; any
slope above the threshold is considered as steep. The two slopes are differ by only 2%, but
the crisp sets analyze the blue slope as steep and the red slope as not steep. As the value of
the slope approaches the threshold, the uncertainty of whether the slope is steep or not
increases dramatically. The slope analysis based on the crisp sets does not accurately
describes the reality.
Page 13
8
Figure 4. Example of (A) a crisp set and (B) a fuzzy set that describe steepness of a slope. The red line
represents a slope whose steepness is 19% while the blue line represents a slope whose steepness is
21%.
Fuzzy logic does not rely on a specific arbitrary threshold. It uses linguistic variables
and membership functions to analyze data. Slope steepness can be described by five linguistic
variables (flat, slight, moderate, steep, and extreme) and membership functions. The fuzzy
sets analyze the red slope of 19% as steep to [0.9] and moderate to [0.1]. With the fuzzy sets,
the uncertainty of including and excluding the slope as steep slope spread uniformly across
the entire sets. The sets do not have a discontinuous value where it is impossible to determine
set membership.
Page 14
9
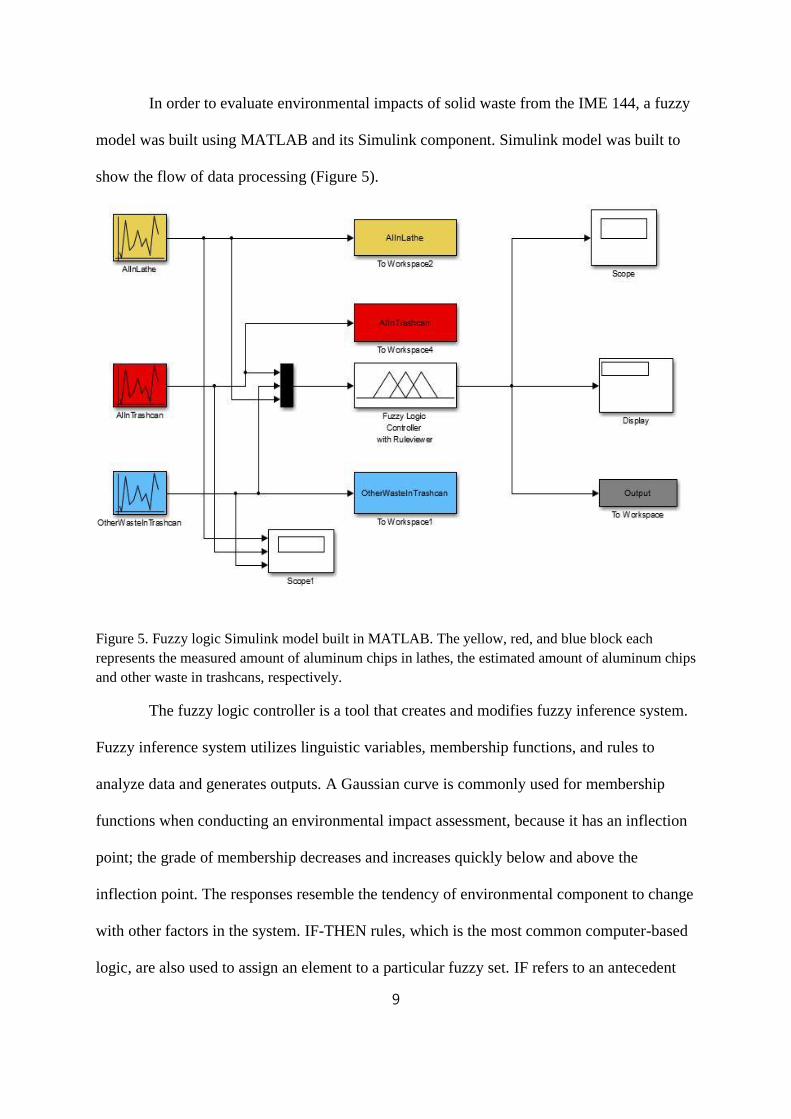
In order to evaluate environmental impacts of solid waste from the IME 144, a fuzzy
model was built using MATLAB and its Simulink component. Simulink model was built to
show the flow of data processing (Figure 5).
Figure 5. Fuzzy logic Simulink model built in MATLAB. The yellow, red, and blue block each
represents the measured amount of aluminum chips in lathes, the estimated amount of aluminum chips
and other waste in trashcans, respectively.
The fuzzy logic controller is a tool that creates and modifies fuzzy inference system.
Fuzzy inference system utilizes linguistic variables, membership functions, and rules to
analyze data and generates outputs. A Gaussian curve is commonly used for membership
functions when conducting an environmental impact assessment, because it has an inflection
point; the grade of membership decreases and increases quickly below and above the
inflection point. The responses resemble the tendency of environmental component to change
with other factors in the system. IF-THEN rules, which is the most common computer-based
logic, are also used to assign an element to a particular fuzzy set. IF refers to an antecedent
Page 15
10
while THEN refers to a consequent. More than one antecedents can be combined with AND
operator for more accurate results. The rules are derived from experience of an environmental
practitioner who is familiar with the selected environment.
Figure 6. Membership functions of inputs and output of the fuzzy logic inference system. (A) Each
input has three linguistic variables represented by Gaussian membership functions. (B) Output has
two linguistic variables. It shows the level of sustainability in a scale of 0 to 1. Higher value implies
that the system is sustainable.
Fuzzy inference system for the IME 144 laboratory was created. The three sets of
data (i.e., amount of aluminum chips from lathes, amounts of aluminum chips and other
waste in trashcans) were considered as inputs (Figure 6). IF-THEN rules were created based
on observations made in the laboratory (Appendix B). The generated outputs were scaled
from 0 to 1; higher number showed higher level of the laboratory's sustainability.
Page 16
11
Figure 7. Surface view of inputs and output of the fuzzy logic inference system. The x and y axis
represents solid waste from the IME 144 laboratory while the z-axis represents the output, the level of
sustainability.
The inputs and outputs were graphed in order to observe any trend among the
amounts of each waste and the laboratory's sustainability (Appendix C). However, it was
difficult to recognize relationship between inputs and output. Therefore, the three-
dimensional surface view was created (Figure 7); certain relationship between the amounts of
waste stream and the level of sustainability could be easily observed through the graphical
representation of the results. One clear observation made from the surface views was that the
amount of aluminum chips had the highest environmental impact; change in the level of the
sustainability appeared to be most sensitive to the change in the amount of aluminum chips in
trashcans.
2.4 Alternatives
Through the environmental impact evaluation process, the aluminum chips thrown
into the trashcans were identified as the waste stream whose environmental impact was the
most significant. Therefore, proposed alternatives were aimed to reduce the particular solid
waste. First, installing partitions between the knee mills were considered to prevent
aluminum chips being contaminated with impurities and other metal chips from neighboring
Page 17
12
machines. However, the mills were closely placed to each other; partitions between mills
would be obstacles for students who need enough space to safely work on machines.
Secondly, installing chip pans under mills were considered. The pans would make it possible
to recycle solid waste from the machines without manual sorting process. Thirdly, an
alternative material that has lower environmental impact can be used instead of aluminum.
Relatively larger amount of energy is required to produce aluminum. Carbon steel can replace
aluminum as an alternative material, since its energy consumption is lower than that of
aluminum and it can be easily recycled. Lastly, professors and instructors can encourage
students participation in recycling. In one of the upper IME classes, students are rewarded
with a barbeque party at the end of each quarter if they all participated in recycling metal
chips generated from the class. Professors and course instructors can facilitate the atmosphere
where students care about the environmental sustainability by providing incentives in terms
of grade or entertainment.
3 Conclusion
A modern EIA was conducted to obtain basic understanding of sustainability of the
IME 144 laboratory.
Aluminum chips from lathes, aluminum chips in trashcans, and other waste
in trashcans were identified as solid waste stream of the laboratory.
By using fuzzy logic, the aluminum chips generated by lathes were identified
as the waste stream with the most significant environmental impact.
Alternatives to improve the sustainability of the IME 144 by reducing the waste
stream with the most significant impact (i.e., aluminum chips from lathes) were
considered.
Page 18
13
Installing chip pans under the knee mills can increase the laboratory's
recycling rate.
Carbon steel, a material that can be easily recycled and whose energy
consumption is lower than that of aluminum, can replace aluminum to
improve the overall sustainability.
Professors can encourage students participation in recycling by providing
awards.
The modern approach, which implemented fuzzy logic to the EIA, is an innovative
approach to identify and evaluate solid waste streams and their environmental
impacts. It does not require precisely measured data; thus, it prevents the necessary
of obtaining such data, which can be costly and time consuming.
Page 19
14
4 References
1. Shepard, R. (2005). Quantifying Environmental Impact Assessments Using Fuzzy
Logic. New York: Springer.
2. Kumar, N. (2010). Multifactorial fuzzy approach for the assessment of groundwater
quality. Journal of Water Resource and Protection, 2(6), 597-608.
3. Silvert, W. (2000). Fuzzy indices of environmental conditions. Ecological
Modelling, 130(1), 111-119.
4. Enea, M. , & Salemi, G. (2001). Fuzzy approach to the environmental impact
evaluation. Ecological Modelling, 136(2), 131-147.
5. Smyth, D. , Fredeen, A. , & Booth, A. (2010). Reducing solid waste in higher
education: The first step towards ‘greening’ a university campus. Resources,
Conservation & Recycling, 54(11), 1007-1016.
6. Stefanescu, L. , Robu, B. , & Ozunu, A. (2013). Integrated approach of
environmental impact and risk assessment of Rosia Montana mining area, Romania.
Environmental Science and Pollution Research International, 20(11), 7719.
Page 20
15
5 Appendices
5.1 Appendix A - amounts of solid waste streams from the IME 144
Al chips in Lathe (lb) Al chips in Trashcan (lb) Other waste in Trashcan (lb)
18.3 6.6 18.3
22.9 20.4 15.7
22.9 28 25.2
19.9 15.6 25.2
16.1 1 29
17.5 15.9 20.1
22.4 0.2 22.8
22 2 27.5
24.4 20.6 15.5
Average 20.7 12.3 22.1
Total 207.1 122.6 221.4
5.2 Appendix B - List of IF-THEN Rule in the fuzzy inference system
Page 21
16
5.3 Appendix C - Graph of amounts of waste streams and the level of sustainability
0
0.1
0.2
0.3
0.4
0.5
0.6
0
5
10
15
20
25
30
35
1 2 3 4 5 6 7 8 9
Gra
de o
f M
em
bers
hip
Weig
ht
of
wast
e
Membership
grade
Al in Lathe
Al in
Trashcan
Other Waste
in Trashcan