212
An Environmental Systems Analysis of the Kraft Pulp Industry in Thailand Warit Jawjit
An Environmental Systems Analysis of the Kraft Pulp Industry in Thailand
Warit Jawjit
Promotor: Prof. Dr. L. Hordijk Hoogleraar Milieusysteemanalyse, Wageningen Universiteit Co-promotoren: Dr. C. Kroeze Universitair Hoofddocent bij de leerstoelgroep Milieusysteemanalyse, Wageningen Universiteit Dr. W. Soontaranun Lecturer in Chemical Engineering, Chulalongkorn University Samenstelling promotiecommissie: Prof. Dr. Ir. W. H. Rulkens, Wageningen Universiteit Prof. Dr. Ir. C. S. A. van Koppen, Wageningen Universiteit en Universiteit Utrecht Prof. Dr. K. Blok, Universiteit Utrecht Prof. Dr. L. Reijnders, Universiteit van Amsterdam Dit onderzoek is uitgevoerd binnen de onderzoekschool SENSE.
Proefschrift ter verkrijging van de graad van doctor
op gezag van de rector magnificus van Wageningen Universiteit,
Prof. Dr. M. J. Kropff, in het openbaar te verdedigen op maandag 4 december 2006
das namiddags te vier uur in de Aula
An Environmental Systems Analysis of the Kraft Pulp Industry in Thailand
Warit Jawjit

Jawjit, W., 2006 An Environmental Systems Analysis of the Kraft Pulp Industry in Thailand PhD thesis Wageningen University, with summaries in English and Dutch ISBN 90-8504-510-X
Acknowledgement In April 1996 I celebrated the Thai New Year with my mother – Assist. Prof. Wimol Jawjit - in a hospital. We talked about my future career – a university lecturer. She said to me that a PhD study is very important for this career, and she would be so happy if I would continue my study. For a naturally lazy man like me, obtaining a PhD was something that I had never thought about. To cheer her up from illness, however, I promised her. July 1996 she passed away. July 2006 I finished my PhD thesis. Ten years may be a long time to make the promise come true, but I finally did it. From a very lazy boy to a PhD candidate, I would never have come this far without my mother’s love, guidance, and encouragement. She always believed in me, and has always been my inspiration. Mom – I am so grateful to you. Everything you did for me has brought me to today. I dedicate this work to you, and I hope you know that I kept my word. I am also deeply grateful to my father – Assist. Prof. Treepol Jawjit – who is my model of hard work, patience, and honesty. At his 62, he often puts me to shame with his never-ending energy for work and creation. Dad – with all the roles that you have taken – teacher, Dean, Rector, Member of Parliament, Senator – I am so proud to be your son. To carry out a multidisciplinary PhD research, I was very fortunate to have a “dream team” of supervisors who had backgrounds in Economics, Natural Science, and Engineering. I would like to express my gratitude to my promotor – Prof. Dr. Leen Hordijk – for his kind contribution to my thesis despite his busy schedule as a director of IIASA (International Institute of Applied Systems Analysis) in Austria. I did not have many chances to discuss with him, but every discussion we had was crucial. His expertise significantly helped me throughout my research. Working with him was a great experience for me. I would also like to thank my co-promotor - Dr.Wit Soontaranun – for his valuable advice especially in the technology of pulp production. He taught me how to think and write systematically, and I really appreciated the long trips he took from Thailand to Holland to help me with my thesis. I would like to dedicate this paragraph to express my appreciation to my daily supervisor, Assoc. Prof. Dr. Carolien Kroeze. I can truthfully say that without her assistance, it would not be possible to finish my dissertation in 3 years and 8 months. From the first day that I arrived at the Environmental Systems Analysis (ESA) group until the day I finished my thesis, she was a very important support not only for working on the thesis, but also for my positive attitude during difficult times. She always cheered me up and continuously added “the fuel” for me to carry on. PhD research was a tough task, but working with her was always a pleasure and a challenge. Carolien- You amazed me by the way you effectively organized your time for research, teaching, supervising, and family. As a university lecturer, you clearly distinguish the difference between “the professional” and “the amateur”. Beside my mother and father, you are also my model of a perfect teacher. However, I would like to tell you that I felt really guilty every time I dropped my papers in the mailbox at you home (especially in the last phase of thesis), because it meant that you had to spend your night time and/ or weekend reading my thesis. I am so glad that my thesis is done, and I do not have to visit your mailbox again. Also, I sincerely thank Marcel and the wonderful twins - Tomas and Robin - for their hospitality every time I visited their home. I really hope to have a chance to welcome you all in Thailand someday.
My thesis was funded by Wageningen Univesity in the project of Agro-Industrial Transformations towards Sustainability: Southeast and East Asia in Global Perspective (AGITS). I would like to thank Prof. Dr. Arthur Mol: a project leader and Dr. Peter Oosterveer: a project secretary, for giving me an opportunity to participate in this challenging project and providing me with kind assistance during my study in the Netherlands. My special thanks go to Dr. Somporn Kamolsiripichaiporn, a deputy director of National Research Center for Environmental and Hazardous Waste Management (NRC-EHWM), Chulalongkorn University and an AGITS project co-ordinator, who introduced me to this project and gave me wonderful chances to present my research at the United Kingdom and Hong Kong. I also thank Assoc. Prof. Sutha Khoadhiar for his encouragement at the beginning stage of my PhD study. For financial administration, I would like to thank Corry Rothuizen (Environmental Policy group, Wageningen University), Nuanjun Thanyachotikarn and Garnda Onubon (NRC-EHWM). I would like to express my thanks to Preecha Cherdkietkul, Narong Meenuan, Dujdao Wongsomboon who kindly helped me during my field survey at eucalyptus plantation sites and pulp mills. I also thank Dr. Pittaya Petmak from the Department of Royal Forestry for his suggestions on eucalyptus plantation. The very pleasant working atmosphere and friendly colleagues in Environmental Systems Analysis (ESA) group significantly encouraged me to work effectively. I really liked the way we had the lunch walking and coffee brakes. My special thanks go to Ria Cuperus for all the kind arrangements she has done for me, and Serge Stalpers for his hospitality and being my paranymph. To be so far away from home is not an easy situation, but my life in Wageningen was full of warmth with a lovely Thai community. Many thanks go to Dr. Laksana K. (for several wonderful Thai meals), Assoc. Prof. Dr. Orathai C. (for joining me on this adventure!!), Prinya W. (for many good discussions), Warangkana S. and Thotsawan J. (for the World cup ticket!!!, late night coffee and all little-but-important helps), Sayam R. (for your kitchen!!, for being my paranymph and sharing experience of father), Thanawit K. (for several delicious dishes), Supawoot (for high quality alcoholic services). Thanks for cheerfulness, laughter and humor from Kanang K., Budsara, Naiyana C., Usa U. and Nipaporn S. My special thanks go to Busaba and Kees Schotten for all of their kind help and hospitality. I also thank my friends at NRC-EHWM, Chulalongkorn University for the good times during the early stage of my PhD study. My special thanks go to Padet Praditphet for his kind helps and suggestions. There are some people who were not directly involved in my PhD thesis, but they were an important part in my success. They are Assoc. Prof. Dr. Sudruedee Prateungwong, Waetin Chartikul, Wittapon and Jeerisuda Jawjit, Wittreeya Jawjit. I really thank Bangon Sirichannon and Junjira Sukontamas for taking care of my daughter during my study in the Netherlands. Finally, I would like to express my sincere thanks to my lovely wife – Siriuma Jawjit (Aom) – for her love, care, and encouragement. I had wonderful four years during my study, but I know it was not easy time for her while I was away. From now on, I hope that I can make up for the missed moments during my away. Aom - thank you for your always understanding and patience. Most of all, thank you for giving me the greatest gift of all – our wonderful daughter Jitrtiwa Jawjit (Tonnam) –.You both make a house a home, and also prove that ‘Success begins at home’ is definitely true.
Table of contents Chapter 1 Introduction
1
Chapter 2 An Analysis of the Environmental Pressure Exerted by the Eucalyptus-based Kraft Pulp Industry in Thailand
25
Chapter 3 Options to Reduce the Environmental Impact by the Eucalyptus-based Kraft Pulp Industry in Thailand: Model description
53
Chapter 4 Analyzing Options to Reduce the Environmental Impact by the Eucalyptus-based Kraft Pulp Industry in Thailand: Model Exploration
113
Chapter 5 Future Trends in the Environmental Impact of the Eucalyptus-based Kraft Pulp Industry in Thailand: A Scenario Analysis
141
Chapter 6 Conclusion and discussion
171
Summary
193
Samenvatting
197
Curriculum Vitae
201


2
3
Chapter 1: Introduction 1.1 Introduction
1.1.1 Pulp and paper industry in Thailand Thailand has long been known in the world as a food producer. One may be
surprised to learn, however, that at present agriculture is contributing by only about 10% to GDP (Gross Domestic Product), while the services and industrial sectors contribute about 50% and 40%, respectively (NZTE, 2005). Industrial activities were booming just after the discovery of natural gas in the Gulf of Thailand more than two decades ago. The pulp and paper industry has nonetheless a much longer history, and supported Thailand’s economy since 1923 when the first paper production was commenced by the Ministry of Defence (DIW, 1999). Since then, the growth of domestic pulp and paper production has been increasing by 5-6% per year (Sharma, 2004).
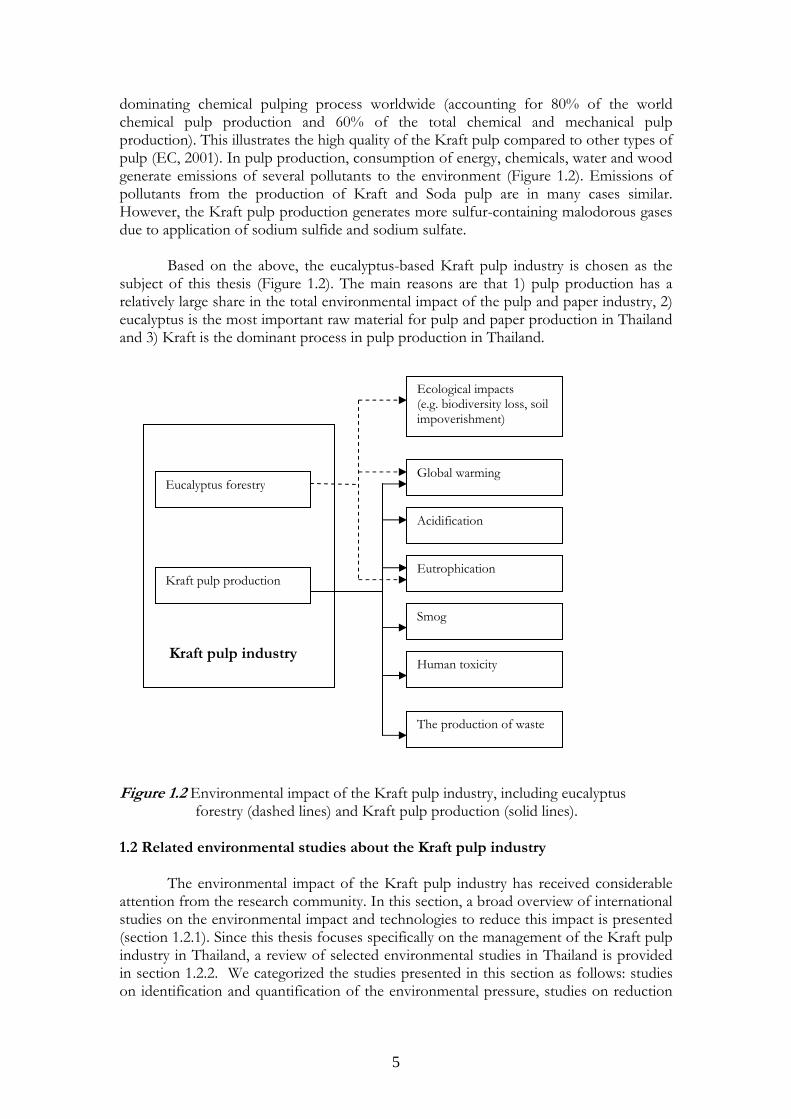
In Thailand, paper is produced from domestic virgin pulp, as well as imported
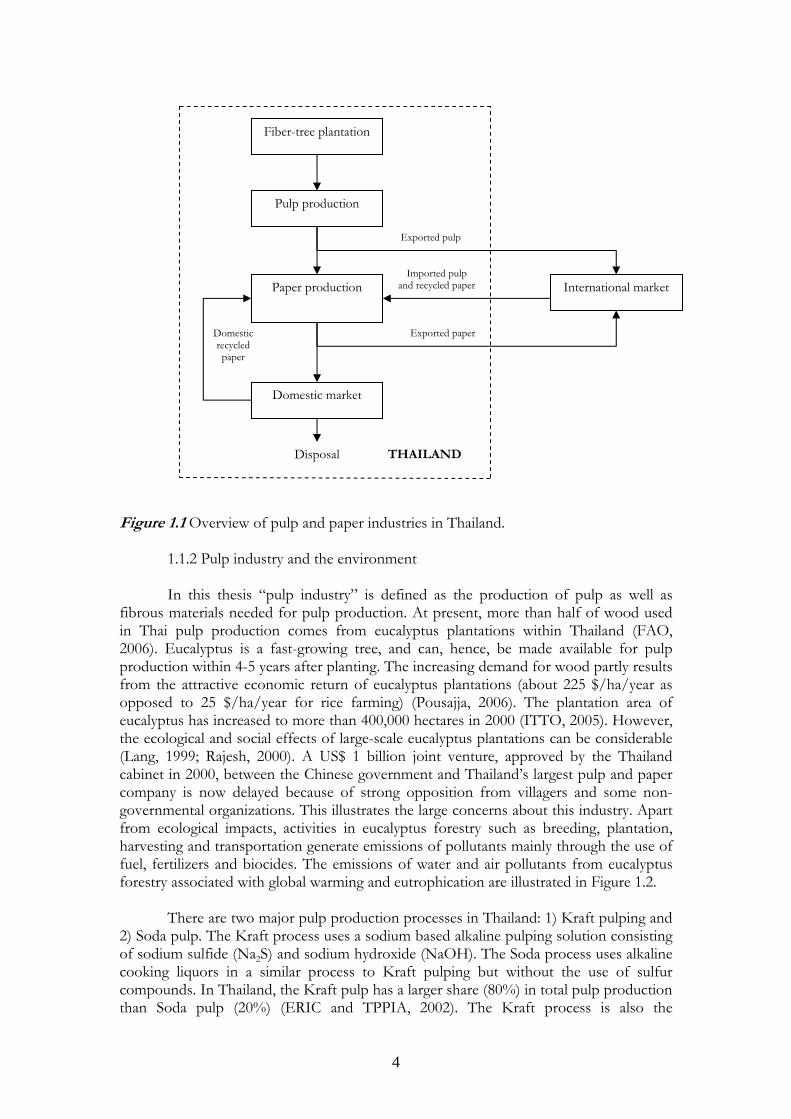
pulp and recycled paper (Figure 1.1). Most of the paper products are industrial and printing paper, for which imported recycled paper is used as raw material. Only 30% of the raw material is supplied by six domestic pulp manufacturers as short fiber (Mongabay, 2006). About 20% of the pulp produced in Thailand is allocated for exporting. To supply pulp mills in Thailand with fibrous raw material, approximately 480,000 hectares are currently used for fiber-tree plantations, mainly Eucalyptus, with more than 100,000 farmers involved.
The growth of the pulp and paper industry drives the economy forward through
revenues from export, and ensures employment for many people. However, the pressure on the environment by this industry has also increased. In the last decade, the concern about the environmental impact associated with pulp and paper production has gone beyond compliance to existing legislation because international markets are more and more demanding environmentally sound products. Proper environmental management is thus an issue in Thailand. Pulp production and forest management have become one of top priority issues on Thailand’s environmental agenda. Recent studies indicate that the environmental impact of pulp production exceeds that of paper production (FAO, 1996; UNEP, 1996; EC, 2001). Likewise, the social problems associated with pulp production are also relatively large (Sonnenfeld, 2002). Improving the environmental performance of pulp production therefore can be considered crucial in the environmental management of the whole pulp and paper industry.
4
Figure 1.1 Overview of pulp and paper industries in Thailand.
1.1.2 Pulp industry and the environment In this thesis “pulp industry” is defined as the production of pulp as well as
fibrous materials needed for pulp production. At present, more than half of wood used in Thai pulp production comes from eucalyptus plantations within Thailand (FAO, 2006). Eucalyptus is a fast-growing tree, and can, hence, be made available for pulp production within 4-5 years after planting. The increasing demand for wood partly results from the attractive economic return of eucalyptus plantations (about 225 $/ha/year as opposed to 25 $/ha/year for rice farming) (Pousajja, 2006). The plantation area of eucalyptus has increased to more than 400,000 hectares in 2000 (ITTO, 2005). However, the ecological and social effects of large-scale eucalyptus plantations can be considerable (Lang, 1999; Rajesh, 2000). A US$ 1 billion joint venture, approved by the Thailand cabinet in 2000, between the Chinese government and Thailand’s largest pulp and paper company is now delayed because of strong opposition from villagers and some non-governmental organizations. This illustrates the large concerns about this industry. Apart from ecological impacts, activities in eucalyptus forestry such as breeding, plantation, harvesting and transportation generate emissions of pollutants mainly through the use of fuel, fertilizers and biocides. The emissions of water and air pollutants from eucalyptus forestry associated with global warming and eutrophication are illustrated in Figure 1.2.
There are two major pulp production processes in Thailand: 1) Kraft pulping and 2) Soda pulp. The Kraft process uses a sodium based alkaline pulping solution consisting of sodium sulfide (Na2S) and sodium hydroxide (NaOH). The Soda process uses alkaline cooking liquors in a similar process to Kraft pulping but without the use of sulfur compounds. In Thailand, the Kraft pulp has a larger share (80%) in total pulp production than Soda pulp (20%) (ERIC and TPPIA, 2002). The Kraft process is also the
THAILAND
Exported paperDomestic recycled paper
Imported pulp and recycled paper
Exported pulp
Fiber-tree plantation
Pulp production
Paper production
Domestic market
International market
Disposal
5
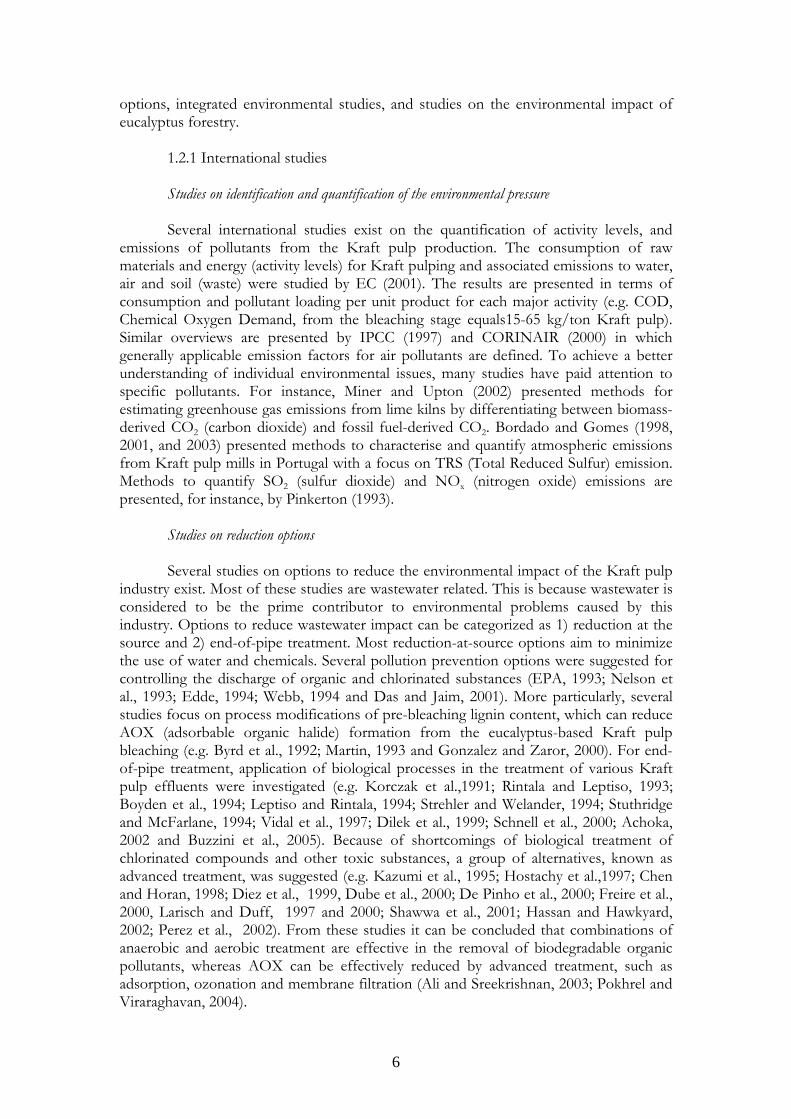
dominating chemical pulping process worldwide (accounting for 80% of the world chemical pulp production and 60% of the total chemical and mechanical pulp production). This illustrates the high quality of the Kraft pulp compared to other types of pulp (EC, 2001). In pulp production, consumption of energy, chemicals, water and wood generate emissions of several pollutants to the environment (Figure 1.2). Emissions of pollutants from the production of Kraft and Soda pulp are in many cases similar. However, the Kraft pulp production generates more sulfur-containing malodorous gases due to application of sodium sulfide and sodium sulfate.
Based on the above, the eucalyptus-based Kraft pulp industry is chosen as the
subject of this thesis (Figure 1.2). The main reasons are that 1) pulp production has a relatively large share in the total environmental impact of the pulp and paper industry, 2) eucalyptus is the most important raw material for pulp and paper production in Thailand and 3) Kraft is the dominant process in pulp production in Thailand.
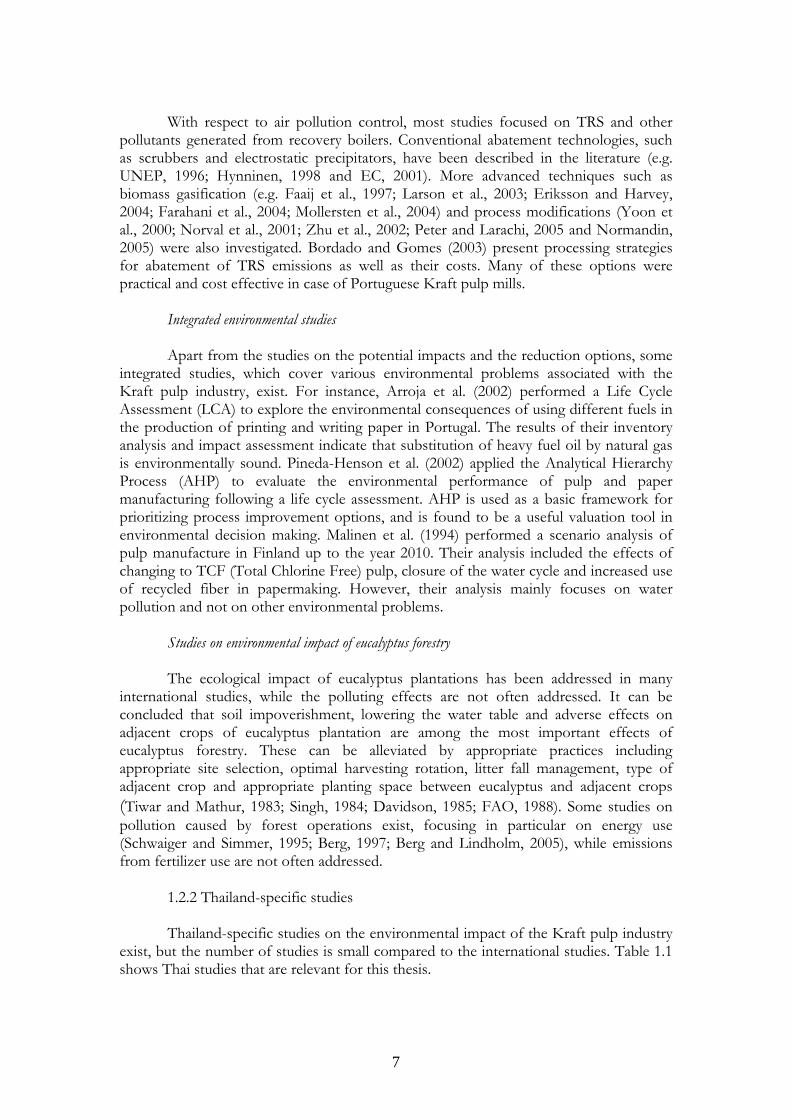
Figure 1.2 Environmental impact of the Kraft pulp industry, including eucalyptus forestry (dashed lines) and Kraft pulp production (solid lines). 1.2 Related environmental studies about the Kraft pulp industry
The environmental impact of the Kraft pulp industry has received considerable
attention from the research community. In this section, a broad overview of international studies on the environmental impact and technologies to reduce this impact is presented (section 1.2.1). Since this thesis focuses specifically on the management of the Kraft pulp industry in Thailand, a review of selected environmental studies in Thailand is provided in section 1.2.2. We categorized the studies presented in this section as follows: studies on identification and quantification of the environmental pressure, studies on reduction
Eucalyptus forestry
Kraft pulp production
Kraft pulp industry
Ecological impacts(e.g. biodiversity loss, soil impoverishment)
Global warming
Acidification
Eutrophication
Smog
Human toxicity
The production of waste
6
options, integrated environmental studies, and studies on the environmental impact of eucalyptus forestry.
1.2.1 International studies Studies on identification and quantification of the environmental pressure Several international studies exist on the quantification of activity levels, and
emissions of pollutants from the Kraft pulp production. The consumption of raw materials and energy (activity levels) for Kraft pulping and associated emissions to water, air and soil (waste) were studied by EC (2001). The results are presented in terms of consumption and pollutant loading per unit product for each major activity (e.g. COD, Chemical Oxygen Demand, from the bleaching stage equals15-65 kg/ton Kraft pulp). Similar overviews are presented by IPCC (1997) and CORINAIR (2000) in which generally applicable emission factors for air pollutants are defined. To achieve a better understanding of individual environmental issues, many studies have paid attention to specific pollutants. For instance, Miner and Upton (2002) presented methods for estimating greenhouse gas emissions from lime kilns by differentiating between biomass-derived CO2 (carbon dioxide) and fossil fuel-derived CO2. Bordado and Gomes (1998, 2001, and 2003) presented methods to characterise and quantify atmospheric emissions from Kraft pulp mills in Portugal with a focus on TRS (Total Reduced Sulfur) emission. Methods to quantify SO2 (sulfur dioxide) and NOx (nitrogen oxide) emissions are presented, for instance, by Pinkerton (1993).
Studies on reduction options
Several studies on options to reduce the environmental impact of the Kraft pulp industry exist. Most of these studies are wastewater related. This is because wastewater is considered to be the prime contributor to environmental problems caused by this industry. Options to reduce wastewater impact can be categorized as 1) reduction at the source and 2) end-of-pipe treatment. Most reduction-at-source options aim to minimize the use of water and chemicals. Several pollution prevention options were suggested for controlling the discharge of organic and chlorinated substances (EPA, 1993; Nelson et al., 1993; Edde, 1994; Webb, 1994 and Das and Jaim, 2001). More particularly, several studies focus on process modifications of pre-bleaching lignin content, which can reduce AOX (adsorbable organic halide) formation from the eucalyptus-based Kraft pulp bleaching (e.g. Byrd et al., 1992; Martin, 1993 and Gonzalez and Zaror, 2000). For end-of-pipe treatment, application of biological processes in the treatment of various Kraft pulp effluents were investigated (e.g. Korczak et al.,1991; Rintala and Leptiso, 1993; Boyden et al., 1994; Leptiso and Rintala, 1994; Strehler and Welander, 1994; Stuthridge and McFarlane, 1994; Vidal et al., 1997; Dilek et al., 1999; Schnell et al., 2000; Achoka, 2002 and Buzzini et al., 2005). Because of shortcomings of biological treatment of chlorinated compounds and other toxic substances, a group of alternatives, known as advanced treatment, was suggested (e.g. Kazumi et al., 1995; Hostachy et al.,1997; Chen and Horan, 1998; Diez et al., 1999, Dube et al., 2000; De Pinho et al., 2000; Freire et al., 2000, Larisch and Duff, 1997 and 2000; Shawwa et al., 2001; Hassan and Hawkyard, 2002; Perez et al., 2002). From these studies it can be concluded that combinations of anaerobic and aerobic treatment are effective in the removal of biodegradable organic pollutants, whereas AOX can be effectively reduced by advanced treatment, such as adsorption, ozonation and membrane filtration (Ali and Sreekrishnan, 2003; Pokhrel and Viraraghavan, 2004).
7
With respect to air pollution control, most studies focused on TRS and other
pollutants generated from recovery boilers. Conventional abatement technologies, such as scrubbers and electrostatic precipitators, have been described in the literature (e.g. UNEP, 1996; Hynninen, 1998 and EC, 2001). More advanced techniques such as biomass gasification (e.g. Faaij et al., 1997; Larson et al., 2003; Eriksson and Harvey, 2004; Farahani et al., 2004; Mollersten et al., 2004) and process modifications (Yoon et al., 2000; Norval et al., 2001; Zhu et al., 2002; Peter and Larachi, 2005 and Normandin, 2005) were also investigated. Bordado and Gomes (2003) present processing strategies for abatement of TRS emissions as well as their costs. Many of these options were practical and cost effective in case of Portuguese Kraft pulp mills. Integrated environmental studies
Apart from the studies on the potential impacts and the reduction options, some integrated studies, which cover various environmental problems associated with the Kraft pulp industry, exist. For instance, Arroja et al. (2002) performed a Life Cycle Assessment (LCA) to explore the environmental consequences of using different fuels in the production of printing and writing paper in Portugal. The results of their inventory analysis and impact assessment indicate that substitution of heavy fuel oil by natural gas is environmentally sound. Pineda-Henson et al. (2002) applied the Analytical Hierarchy Process (AHP) to evaluate the environmental performance of pulp and paper manufacturing following a life cycle assessment. AHP is used as a basic framework for prioritizing process improvement options, and is found to be a useful valuation tool in environmental decision making. Malinen et al. (1994) performed a scenario analysis of pulp manufacture in Finland up to the year 2010. Their analysis included the effects of changing to TCF (Total Chlorine Free) pulp, closure of the water cycle and increased use of recycled fiber in papermaking. However, their analysis mainly focuses on water pollution and not on other environmental problems.
Studies on environmental impact of eucalyptus forestry
The ecological impact of eucalyptus plantations has been addressed in many
international studies, while the polluting effects are not often addressed. It can be concluded that soil impoverishment, lowering the water table and adverse effects on adjacent crops of eucalyptus plantation are among the most important effects of eucalyptus forestry. These can be alleviated by appropriate practices including appropriate site selection, optimal harvesting rotation, litter fall management, type of adjacent crop and appropriate planting space between eucalyptus and adjacent crops (Tiwar and Mathur, 1983; Singh, 1984; Davidson, 1985; FAO, 1988). Some studies on pollution caused by forest operations exist, focusing in particular on energy use (Schwaiger and Simmer, 1995; Berg, 1997; Berg and Lindholm, 2005), while emissions from fertilizer use are not often addressed.
1.2.2 Thailand-specific studies Thailand-specific studies on the environmental impact of the Kraft pulp industry
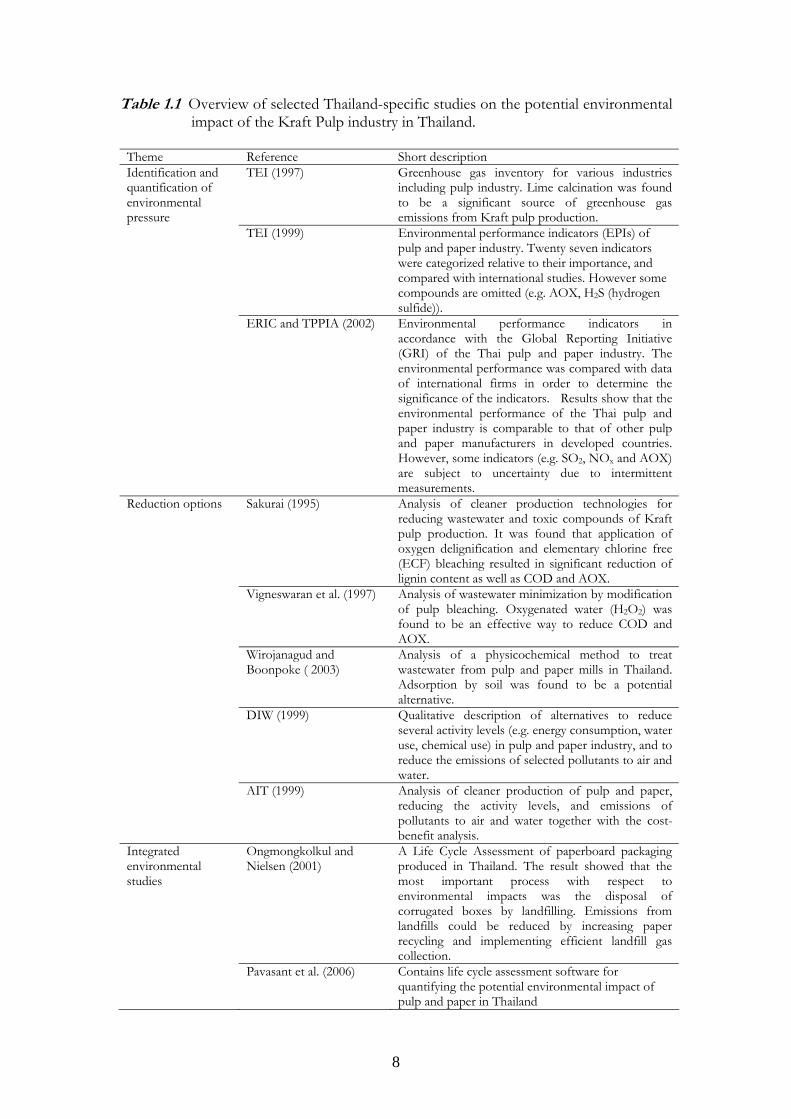
exist, but the number of studies is small compared to the international studies. Table 1.1 shows Thai studies that are relevant for this thesis.
8
Table 1.1 Overview of selected Thailand-specific studies on the potential environmental impact of the Kraft Pulp industry in Thailand.
Theme Reference Short description
TEI (1997) Greenhouse gas inventory for various industries including pulp industry. Lime calcination was found to be a significant source of greenhouse gas emissions from Kraft pulp production.
Identification and quantification of environmental pressure
TEI (1999) Environmental performance indicators (EPIs) of pulp and paper industry. Twenty seven indicators were categorized relative to their importance, and compared with international studies. However some compounds are omitted (e.g. AOX, H2S (hydrogen sulfide)).
ERIC and TPPIA (2002) Environmental performance indicators in accordance with the Global Reporting Initiative (GRI) of the Thai pulp and paper industry. The environmental performance was compared with data of international firms in order to determine the significance of the indicators. Results show that the environmental performance of the Thai pulp and paper industry is comparable to that of other pulp and paper manufacturers in developed countries. However, some indicators (e.g. SO2, NOx and AOX) are subject to uncertainty due to intermittent measurements.
Sakurai (1995) Analysis of cleaner production technologies for reducing wastewater and toxic compounds of Kraft pulp production. It was found that application of oxygen delignification and elementary chlorine free (ECF) bleaching resulted in significant reduction of lignin content as well as COD and AOX.
Vigneswaran et al. (1997) Analysis of wastewater minimization by modification of pulp bleaching. Oxygenated water (H2O2) was found to be an effective way to reduce COD and AOX.
Wirojanagud and Boonpoke ( 2003)
Analysis of a physicochemical method to treat wastewater from pulp and paper mills in Thailand. Adsorption by soil was found to be a potential alternative.
DIW (1999) Qualitative description of alternatives to reduce several activity levels (e.g. energy consumption, water use, chemical use) in pulp and paper industry, and to reduce the emissions of selected pollutants to air and water.
Reduction options
AIT (1999) Analysis of cleaner production of pulp and paper, reducing the activity levels, and emissions of pollutants to air and water together with the cost-benefit analysis.
Integrated environmental studies
Ongmongkolkul and Nielsen (2001)
A Life Cycle Assessment of paperboard packaging produced in Thailand. The result showed that the most important process with respect to environmental impacts was the disposal of corrugated boxes by landfilling. Emissions from landfills could be reduced by increasing paper recycling and implementing efficient landfill gas collection.
Pavasant et al. (2006) Contains life cycle assessment software for quantifying the potential environmental impact of pulp and paper in Thailand
9
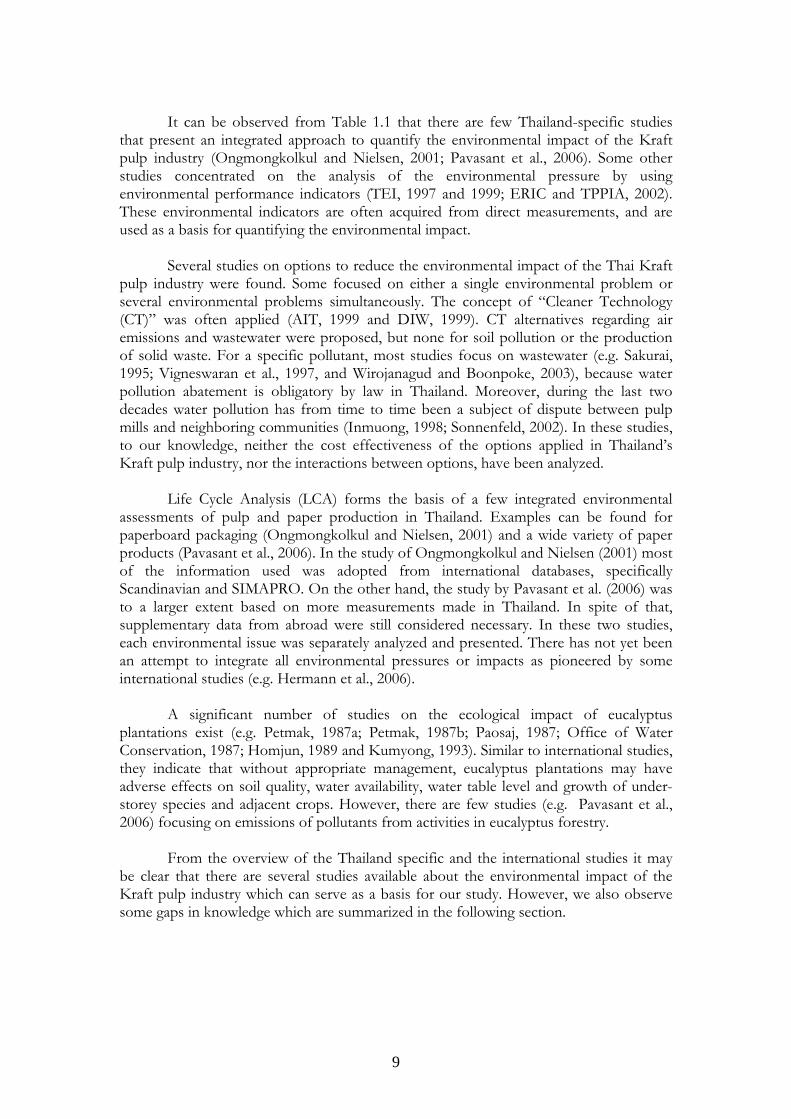
It can be observed from Table 1.1 that there are few Thailand-specific studies
that present an integrated approach to quantify the environmental impact of the Kraft pulp industry (Ongmongkolkul and Nielsen, 2001; Pavasant et al., 2006). Some other studies concentrated on the analysis of the environmental pressure by using environmental performance indicators (TEI, 1997 and 1999; ERIC and TPPIA, 2002). These environmental indicators are often acquired from direct measurements, and are used as a basis for quantifying the environmental impact.
Several studies on options to reduce the environmental impact of the Thai Kraft
pulp industry were found. Some focused on either a single environmental problem or several environmental problems simultaneously. The concept of “Cleaner Technology (CT)” was often applied (AIT, 1999 and DIW, 1999). CT alternatives regarding air emissions and wastewater were proposed, but none for soil pollution or the production of solid waste. For a specific pollutant, most studies focus on wastewater (e.g. Sakurai, 1995; Vigneswaran et al., 1997, and Wirojanagud and Boonpoke, 2003), because water pollution abatement is obligatory by law in Thailand. Moreover, during the last two decades water pollution has from time to time been a subject of dispute between pulp mills and neighboring communities (Inmuong, 1998; Sonnenfeld, 2002). In these studies, to our knowledge, neither the cost effectiveness of the options applied in Thailand’s Kraft pulp industry, nor the interactions between options, have been analyzed.
Life Cycle Analysis (LCA) forms the basis of a few integrated environmental
assessments of pulp and paper production in Thailand. Examples can be found for paperboard packaging (Ongmongkolkul and Nielsen, 2001) and a wide variety of paper products (Pavasant et al., 2006). In the study of Ongmongkolkul and Nielsen (2001) most of the information used was adopted from international databases, specifically Scandinavian and SIMAPRO. On the other hand, the study by Pavasant et al. (2006) was to a larger extent based on more measurements made in Thailand. In spite of that, supplementary data from abroad were still considered necessary. In these two studies, each environmental issue was separately analyzed and presented. There has not yet been an attempt to integrate all environmental pressures or impacts as pioneered by some international studies (e.g. Hermann et al., 2006).
A significant number of studies on the ecological impact of eucalyptus
plantations exist (e.g. Petmak, 1987a; Petmak, 1987b; Paosaj, 1987; Office of Water Conservation, 1987; Homjun, 1989 and Kumyong, 1993). Similar to international studies, they indicate that without appropriate management, eucalyptus plantations may have adverse effects on soil quality, water availability, water table level and growth of under-storey species and adjacent crops. However, there are few studies (e.g. Pavasant et al., 2006) focusing on emissions of pollutants from activities in eucalyptus forestry. From the overview of the Thailand specific and the international studies it may be clear that there are several studies available about the environmental impact of the Kraft pulp industry which can serve as a basis for our study. However, we also observe some gaps in knowledge which are summarized in the following section.
10
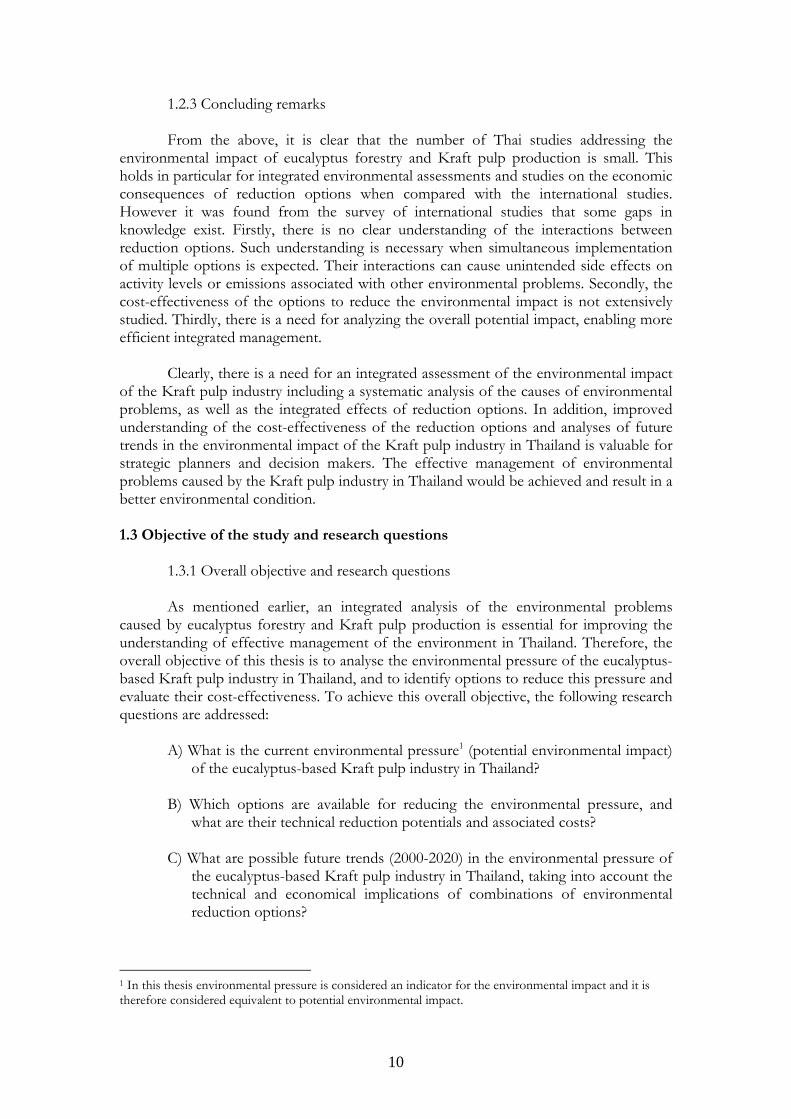
1.2.3 Concluding remarks
From the above, it is clear that the number of Thai studies addressing the environmental impact of eucalyptus forestry and Kraft pulp production is small. This holds in particular for integrated environmental assessments and studies on the economic consequences of reduction options when compared with the international studies. However it was found from the survey of international studies that some gaps in knowledge exist. Firstly, there is no clear understanding of the interactions between reduction options. Such understanding is necessary when simultaneous implementation of multiple options is expected. Their interactions can cause unintended side effects on activity levels or emissions associated with other environmental problems. Secondly, the cost-effectiveness of the options to reduce the environmental impact is not extensively studied. Thirdly, there is a need for analyzing the overall potential impact, enabling more efficient integrated management.
Clearly, there is a need for an integrated assessment of the environmental impact
of the Kraft pulp industry including a systematic analysis of the causes of environmental problems, as well as the integrated effects of reduction options. In addition, improved understanding of the cost-effectiveness of the reduction options and analyses of future trends in the environmental impact of the Kraft pulp industry in Thailand is valuable for strategic planners and decision makers. The effective management of environmental problems caused by the Kraft pulp industry in Thailand would be achieved and result in a better environmental condition. 1.3 Objective of the study and research questions
1.3.1 Overall objective and research questions As mentioned earlier, an integrated analysis of the environmental problems
caused by eucalyptus forestry and Kraft pulp production is essential for improving the understanding of effective management of the environment in Thailand. Therefore, the overall objective of this thesis is to analyse the environmental pressure of the eucalyptus-based Kraft pulp industry in Thailand, and to identify options to reduce this pressure and evaluate their cost-effectiveness. To achieve this overall objective, the following research questions are addressed:
A) What is the current environmental pressure1 (potential environmental impact)
of the eucalyptus-based Kraft pulp industry in Thailand? B) Which options are available for reducing the environmental pressure, and
what are their technical reduction potentials and associated costs? C) What are possible future trends (2000-2020) in the environmental pressure of
the eucalyptus-based Kraft pulp industry in Thailand, taking into account the technical and economical implications of combinations of environmental reduction options?
1 In this thesis environmental pressure is considered an indicator for the environmental impact and it is therefore considered equivalent to potential environmental impact.
11
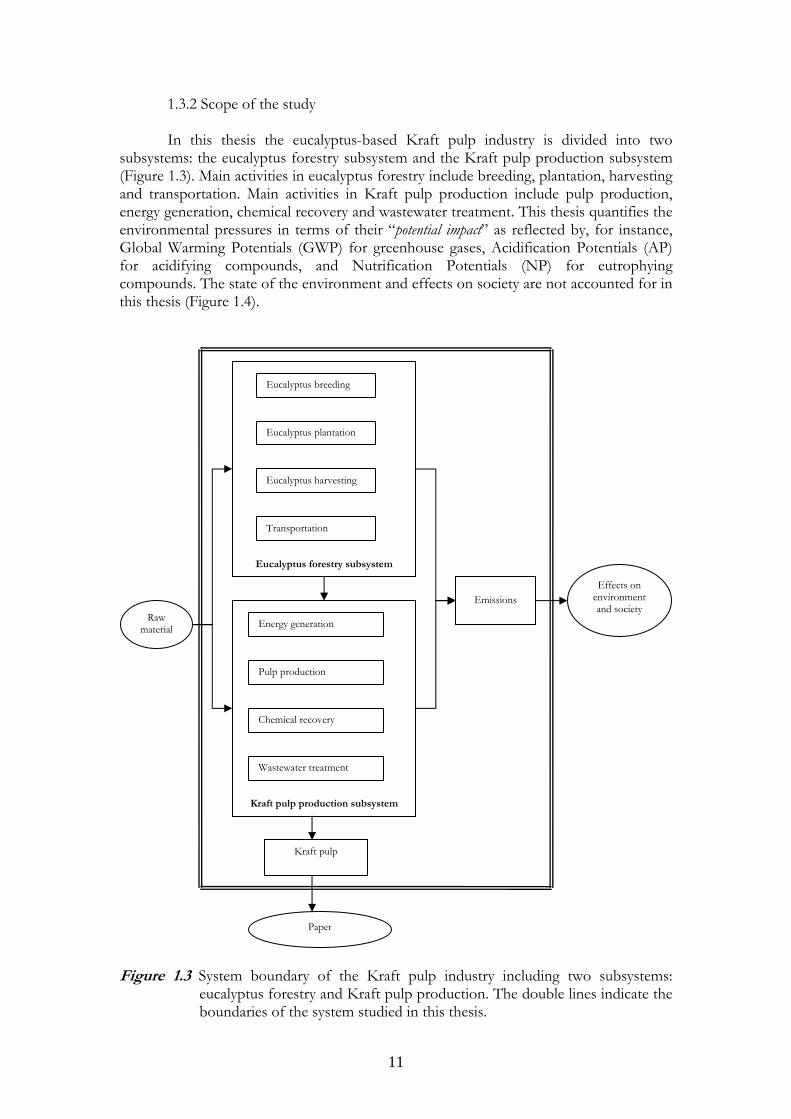
1.3.2 Scope of the study In this thesis the eucalyptus-based Kraft pulp industry is divided into two
subsystems: the eucalyptus forestry subsystem and the Kraft pulp production subsystem (Figure 1.3). Main activities in eucalyptus forestry include breeding, plantation, harvesting and transportation. Main activities in Kraft pulp production include pulp production, energy generation, chemical recovery and wastewater treatment. This thesis quantifies the environmental pressures in terms of their “potential impact” as reflected by, for instance, Global Warming Potentials (GWP) for greenhouse gases, Acidification Potentials (AP) for acidifying compounds, and Nutrification Potentials (NP) for eutrophying compounds. The state of the environment and effects on society are not accounted for in this thesis (Figure 1.4).
Figure 1.3 System boundary of the Kraft pulp industry including two subsystems: eucalyptus forestry and Kraft pulp production. The double lines indicate the boundaries of the system studied in this thesis.
Raw material
Eucalyptus forestry subsystem
Eucalyptus breeding
Eucalyptus plantation
Eucalyptus harvesting
Transportation
Kraft pulp production subsystem
Energy generation
Pulp production
Chemical recovery
Wastewater treatment
Kraft pulp
Paper
Emissions
Effects on environment and society
12
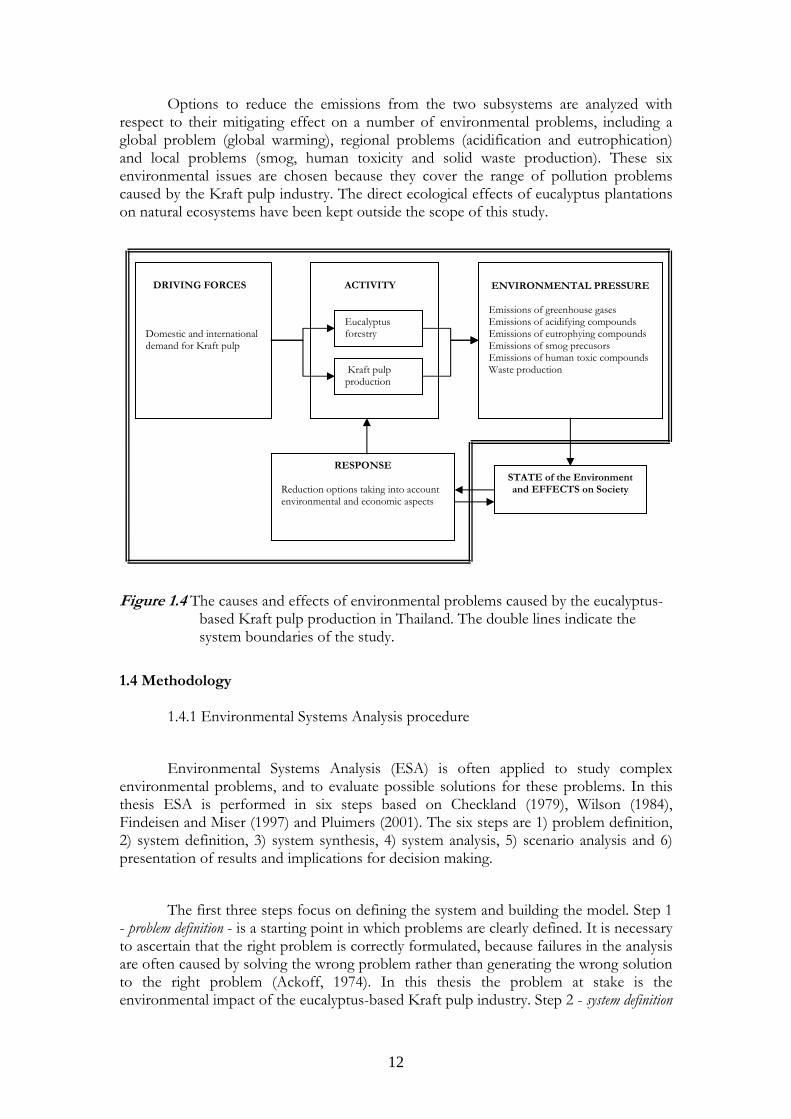
Options to reduce the emissions from the two subsystems are analyzed with respect to their mitigating effect on a number of environmental problems, including a global problem (global warming), regional problems (acidification and eutrophication) and local problems (smog, human toxicity and solid waste production). These six environmental issues are chosen because they cover the range of pollution problems caused by the Kraft pulp industry. The direct ecological effects of eucalyptus plantations on natural ecosystems have been kept outside the scope of this study.
Figure 1.4 The causes and effects of environmental problems caused by the eucalyptus-
based Kraft pulp production in Thailand. The double lines indicate the system boundaries of the study.
1.4 Methodology
1.4.1 Environmental Systems Analysis procedure
Environmental Systems Analysis (ESA) is often applied to study complex environmental problems, and to evaluate possible solutions for these problems. In this thesis ESA is performed in six steps based on Checkland (1979), Wilson (1984), Findeisen and Miser (1997) and Pluimers (2001). The six steps are 1) problem definition, 2) system definition, 3) system synthesis, 4) system analysis, 5) scenario analysis and 6) presentation of results and implications for decision making.
The first three steps focus on defining the system and building the model. Step 1 - problem definition - is a starting point in which problems are clearly defined. It is necessary to ascertain that the right problem is correctly formulated, because failures in the analysis are often caused by solving the wrong problem rather than generating the wrong solution to the right problem (Ackoff, 1974). In this thesis the problem at stake is the environmental impact of the eucalyptus-based Kraft pulp industry. Step 2 - system definition
Domestic and international demand for Kraft pulp
DRIVING FORCES ACTIVITY
Eucalyptus forestry
Kraft pulp production
ENVIRONMENTAL PRESSURE Emissions of greenhouse gases Emissions of acidifying compounds Emissions of eutrophying compounds Emissions of smog precusors Emissions of human toxic compounds Waste production
RESPONSE Reduction options taking into account environmental and economic aspects
STATE of the Environment and EFFECTS on Society
13
- is a step in which the system boundaries are defined and the system inputs, outputs and their relationship are identified and described. Appropriate system definition is essential for the identification of relevant reduction options to the problem studied, as well as for the model requirements (Findeisen and Quade, 1997). In this thesis, the most important sources of greenhouse gases, acidifying compounds, eutrophying compounds, tropospheric ozone precursors, human toxic substances and solid waste associated with the Kraft pulp industry are identified. Step 3 - system synthesis – includes identification of the reduction options to the problems and to build a model for exploring the consequences of applying individual options and their combinations. The reduction options are proposed in accordance with the defined system boundaries and the objectives. The model includes only the selected emissions in step 2.
In step 4, 5 and 6, the model is used, and the results are interpreted. Step 4 -
system analysis – is carried out to explore the model. In this step, first the model results are compared with other studies. Next, a reference case is defined in which no environmental management is assumed. This reference case is used as a basis for an analysis of the technical potential of reduction options. Multi-criteria analysis and cost-effectiveness analysis are used to compare and prioritize the options. Step 5 - scenario analysis – is employed to investigate future possible developments in the Kraft pulp industry in Thailand. In systems analysis, the ultimate task is to predict the consequences of the alternatives considered for some situations (Findeisen and Quade, 1997). This step normally involves answering two questions: 1) what will happen as a result of actions suggested by the alternatives, and 2) what will happen without these actions. The final step - presentation of results and implications for decision making - is necessary for communicating the results of the study. In this thesis conclusions and discussions for particular phases of the study are included in each chapter to ensure that key results and their implication are adequately and properly presented. Finally, the overall conclusion and discussion are given in the last chapter, as well as implications for the Kraft pulp industry in Thailand.
These six steps are carried out in three phases of study, which are described in the next section, to answer the research questions and achieve the overall objective.
1.4.2 Phases of the study
The study is performed in three phases to accommodate the research questions and facilitate the implementation of various ESA tools as illustrated in Table 1.2.
Phase 1: Analysis of current environmental pressure of the eucalyptus-based Kraft pulp industry in Thailand
In this first phase of the study, research question 1 is answered (Table 1.2). To
this end, the first and second step of the ESA procedure - problem definition and system definition - are performed by specifying the system boundaries, as well as the inputs and outputs and their relationships. To do so, an emission inventory is compiled within the process boundaries defined in Figure 1.3. Necessary information is based on secondary data from the scientific literature and, in some cases, from local eucalyptus plantations
14
and factories in Thailand. The relevant inputs (materials, energy) and outputs (products, wastes, emissions and potential environmental impacts) are quantified, together with other relevant process parameters. The quantitative assessment of the emissions and waste stream reflects the current environmental potential impact of the eucalyptus-based Kraft pulp industry.
In phase 1 of the study, two ESA tools are applied: environmental performance
indicators and a partial life cycle analysis (LCA). These two tools are combined to define the system boundary and quantify the environmental pressure of eucalyptus-based Kraft pulp industry. Environmental performance indicators serve as a starting point and then are somewhat extended along LCA system boundaries. A partial LCA, including a cradle-to-gate and gate-to-gate approach, is then performed in order to determine the emissions and their sources that have to be taken into account for environmental improvement, as well as the contribution of activities and sources to different environmental problems. An important issue in phase 1 is the selection of emissions and waste streams to be considered in the model to be built in phase 2. The results in this phase are thus used as a basis for the analyses in subsequent phases. Phase 2: Model building including reduction options for the eucalyptus-based Kraft pulp
industry in Thailand, and model exploration After gaining insight in the system boundaries, the components of the system and the interactions between these, the third and fourth step of the ESA procedure - system synthesis and system analysis - are carried out through model building and model exploration. A model is developed on the basis of the results of the previous phase by adopting an integrated assessment modelling approach. The model is expected to be able to quantify the environmental pressure and analyze the possibilities to reduce this pressure using the reduction options of the eucalyptus-based Kraft pulp industry in Thailand, both separately and in combination. LCA approaches are used to develop the model for quantifying emissions and their potential environmental impact, while a multi-criteria analysis (MCA) was used to aggregate six different environmental impacts into one overall environmental indicator.
To further evaluate the reduction options, a cost-effectiveness analysis is
performed. Costs of the reduction options include investment costs, fixed costs and variable costs on the basis of a technology and cost assessment following Klassen (1991) and Pluimers (2001). The results from this phase will answer the second research question.
Phase 3: Analysis of future trends in environmental management of the eucalyptus-based Kraft pulp industry in Thailand
In the final phase of the study the third research question is addressed. To this end, the fifth step of the ESA procedure - scenario analysis - is carried out. The model developed previously is used to evaluate different scenarios for the future (2000-2020). The results reflect different strategies to reduce the environmental pressure by the Kraft pulp industry to gain insight in possible futures associated with decisions and actions assumed to be taken by decision makers. Scenario analysis is an appropriate tool to analyze the possible consequences of different strategies to reduce the environmental impact.
15
Table 1.2 Summary of ESA tools that are used in each phase of study. Study phase Related research question ESA tools
1. Analysis of current situation
A) What is the current environmental pressure of the eucalyptus-based Kraft pulp industry in Thailand?
- Environmental indicators - Partial Life cycle analysis (LCA)
2. Model building and exploration
B) Which options are available for reducing the environmental pressure, and what are their technical reduction potentials and associated costs?
- Life cycle analysis (LCA) - Multi-Criteria Analysis (MCA) - Cost-effectiveness analysis
3. Analysing the future trends
C) What are possible future trends (2000-2020) in the environmental pressure of the eucalyptus-based Kraft pulp industry in Thailand, taking into account the technical and economical implications of combinations of environmental reduction options?
- Scenario analysis
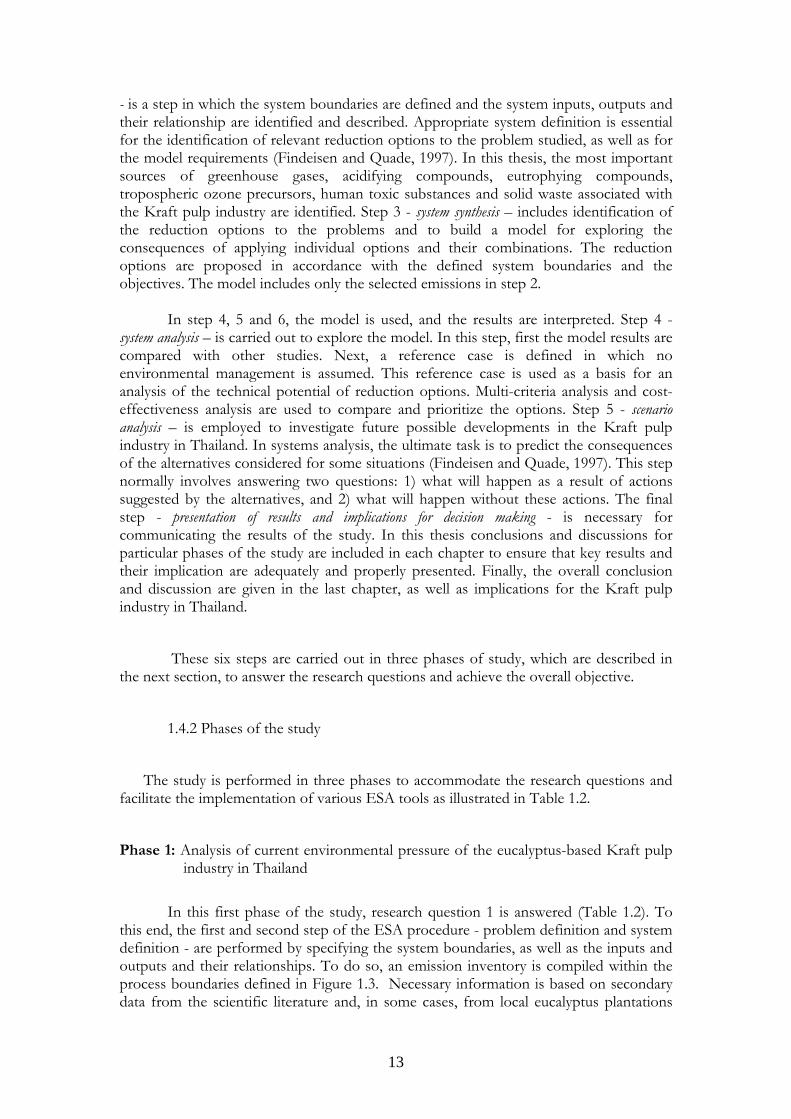
1.5 Thesis outline This thesis consists of six chapters in line with the six steps of the procedure of environmental systems analysis described above (Figure 1.5).
Figure 1.5 Schematic diagram of thesis outline and phase of study with the six steps of
environmental systems analysis (modified from Checkland, 1979; Wilson, 1984; Findeisen and Quade, 1997, and Pluimers, 2001).
1. Problem definition
2. System definition
3. System synthesis: Model building
4. System analysis: Model exploration
5. Scenario analysis
6. Presentation of results and implications for decision making
ESA steps Phase of study Chapter
Chapter 1
Chapter 2
Chapter 3
Chapter 4
Chapter 5
Chapter 6
Phase 1
Phase 2
Phase 3
16
Chapter 1 describes the background of the study and formulates the problem, while Chapter 2 (phase 1 of the study) includes a clear definition of the system by listing the system inputs, outputs and their relations. The analysis in Chapter 2 also determines which inputs, outputs and processes have to be taken into account and which can be omitted. Chapters 1 and 2 are the result of the first and second step of ESA procedure, respectively (Figure 1.5).
Chapters 3 and 4 (reporting on phase 2 of the study) include the results of the analysis. The third step of the ESA procedure - system synthesis - is carried out in Chapter 3. In this step a model is built to quantify the environmental impact and to evaluate the effects of the options, which are identified to reduce the environmental impact, and their associated costs. Chapter 4 reports on the model exploration following the fourth step of the system analysis. In Chapter 4 the results of the model are presented, compared with some other studies, and analyzed.
Chapter 5 (phase 3 of the study) includes a scenario analysis, which serves as a
basis to evaluate different strategies to reduce the pollution. This is the fifth step of ESA procedure. In Chapter 5 the results of future trends in the environmental impact of the eucalyptus-based Kraft pulp industry in Thailand for the period 2000-2020 are presented. A number of scenarios for different strategies to reduce the environmental impact are analyzed; the costs associated with the scenarios are included. To this end, the model developed in Chapter 3 and 4 is used.
Chapter 6 presents the conclusions and discussion. Based on the sixth step of
environmental systems analysis, the results from previous chapters are summarized and the overall conclusions are drawn. The environmental systems analysis procedure and tools are discussed. Finally, implication of study results for the Kraft pulp industry and recommendations for future studies are presented.
Expected novel aspects of this study not only include a better understanding of
the eucalyptus-based Kraft pulp production in Thailand, but also an improved insight in the usefulness of systems analysis tools for evaluating environmental policies in Thailand, as mentioned in section 1.2.3. The application of environmental systems analysis is based on a unique combination of tools applied to a case in Thailand. This will contribute to the further development of environmental systems analysis and increase the understanding to the applicability of environmental systems analysis tools.
17
References Achoka J D. 2002. The efficiency of oxidation ponds at the kraft pulp and paper mill at Webuye in Kenya. Water Research 36: 1203–1212. Ackoff R L. 1974. Redesigning the Future: A Systems Approach to Societal Problems. Wiley. New York. Ali M, Sreekrishnan T R. 2001. Aquatic toxicity from pulp and paper mill effluents: a review. Advances in Environmental Research 5: 175-196. AIT.1999. Cleaner production in the pulp and paper industry: Technology fact sheets. Asian Institute of Technology. Pathumthani. Thailand. Arroja L, Lopes E, Dias A. 2002. Application of life cycle assessment to the Portuguese pulp and paper industry. Journal of Cleaner Production 11: 51-59. Berg S. 1997. Some espects of LCA in the analysis of forestry operations. Journal of Cleaner Production 5 (3): 211-217. Berg S, Lindholm E. 2005. Energy use and environmental impacts of forest operations in Sweden. Journal of Cleaner Production 13 (1): 33-42. Bordado J C M, Gomes J F P. 1988. Characterisation of non-condensable sulphur containing gases from Kraft pulp mills. Chemosphere 37(7): 1235. Bordado J C M, Gomes J F P. 2003. Emissions and Odour control in Kraft pulp mills, Journal of Cleaner Production 11: 797-801. Bordado J C M, Gomes J F P. 2002. Atmospheric emissions of Kraft pulp mills. Journal of Chemical Engineering and Processing 41: 667-671. Boyden B H, Li X Z, Schulz T J, Hijazin O, Peiris P, Bavor J.1994. Treatment of bleachery effluents from Kraft mills pulping mature eucalyptus. Water Science and Technology 29 (5-6): 247-258. Buzzini A P, Pires E C. 2002. Cellulose pulp mill effluent treatment in an upflow anaerobic sludge blanket reactor. Process Biochemistry 38: 707-713. Byrd M V, Gratzl J S, Singh R P. 1992. Deligninfication and bleaching of chemical pulps with ozone: a literature review. TAPPI Journal 75: 207-213. Checkland P B.1979. Techniques in soft systems practice. Building conceptual models. Journal of Applied Systems Analysis 6:41-49. Chen W, Horan N. 1998. Abiotic methods for treatment of pulp and paper mill effluents. Journal of Environmental Technology 19: 173-182. CIFOR.1999. Guidelines for applying multi-criteria analysis to the assessment of criteria and indicators. The criteria and indicators toolbox series 9. Centre for International Forestry Research, Jakarta, Indonesia.
18
CML. 2002. Impact assessment spreadsheet version 2.6. Center of Environmental Science. Lieden University. The Netherlands. CORINAIR. 2000. Atmospheric emission inventory guidebook, second edition, The Core Inventory of Air Emission in Europe, European Environment Agency. Copenhagen, Denmark. Das K T, Jain A K. 2001. Pollution prevention advances in pulp and paper processing. Environmental Progress 20(1):87-92. Davidson J. 1985. Settings off that Eucalyptus are all well bad. FAO (Forest and Agriculture Organization). Bangladesh. De Pinho M N, Minhalma M, Rosa M J, Taborda F. 2000. Integration of flotation/ultrafiltration for treatment of bleached pulp effluent. Pulp and Paper Canada 104 (4): 50–54.
Dias J C T, Rezende R P, Silva C M, Linardi V R. 2005. Biological treatment of kraft pulp mill foul condensates at high temperatures using a membrane bioreactor. Process Biochemistry 40 (3-4):1125-1129.
Diez M C, Mora M L, Videla S. 1999. Adsorption of phenolic compounds and color from bleached Kraft mill effluent allophonic compounds. Water Research 33 (1): 125–130. Dilek F B, Taplamacioglu H M, Tarlan E. 1999. Color and AOX removal from pulping effluents by algae. Applied and Environmental Microbiology 52(4): 585–591. DIW.1999. Technical guideline for environmental management for pulp and paper in Thailand, Department of Industrial Work, Bureau of Environmental Technology, Ministry of Industry, Bangkok, Thailand. Dube, M., McLean, R., MacLatchy, D. and Savage, P., 2000. Reverse osmosis treatment: effects on effluent quality. Pulp and Paper Canada 101 (8): 42–45. EC. 2001. Integrated Pollution Prevention Control (IPPC); Reference Document on Best Available Techniques in the Pulp and Paper Industry. European Commission. Edde H. 1994. Techniques for closing the water circuits in the pulp and paper industry. Water Science and Technology 29(5-6):11-18. EPA. 1993. Handbook on Pollution Prevention opportunities for Bleached Kraft Pulp and Paper Mills. US Environmental Protection Agency. EPA 600/R-93/098. Washington. USA. ERIC and TPPIA. 2002. Application of the production performance indicators in accordance with Global Reporting Initiative (GRI) to Thai pulp and paper industries. Environmental Research Institute of Chulalongkorn University and Thai Pulp and Paper Industries Association, Bangkok, Thailand, (Thai edition) Eriksson H, Harvey S. 2004. Black liquor gasification-consequences for both industry and society. Energy 29 (4): 581-612
19
Faaij A, Van Ree R, Waldheim L, Olsson E, Oudhuis A, Van Wijk A, Daey-Ouwens C, Turkenburg W. 1997. Gasification of biomass wastes and residues for electricity production. Biomass and Bioenergy 12 (6): 387-407. FAO.1988. Eucalyptus. Forest and Agriculture Organization. Rome, Italy. FAO.1996. Environmental impact assessment and environmental auditing in the pulp and paper industry. FAO forestry paper no. 129. Rome, Italy. FAO. 2006. Thailand. FAO Corporate Document Repository: Advisory committee on Paper and Wood products. Access in www.fao.org/show.cdr.asp?url.files/docrep/006/y4829e/y4829e39.htm Farahani S, Worrell E, Bryntse G. 2004. CO2 free paper? Resources, Conservation and Recycling 42: 317-336. Findeisen W, Quade E. 1997. The methodology of systems analysis: An introduction and overview. In: H.J. Miser and E.S. Quade. Handbook of systems analysis. Volume One – Overview of uses, procedures, applications, and practice. John Wiley and Sons, Chichester, UK, pp 117-149. Gonzalez P, Zaror C. 2000. Effect of process modifications on AOX emissions from Kraft pulp bleaching, using Chilean pine and eucalyptus. Journal of Cleaner Production 8:233-241. Hassan M M, Hawkyard C J. 2002. Decolourisation of aqueous dyes by sequential oxidation treatment with ozone and Fenton's reagent. Journal of Chemical Technology and Biotechnology 77: 834–841. Heijungs R, Guine J B, Huppes G,. Lankreijer R M, Udo de Haes H A, Wegener Sleeswijk A, Ansems A M M, Eggels P G, van Duin R, de Goede H P. 1992. Environmental Life cycle assessment of products. Guidelines and backgrounds. Center of Environmental Science (CML) (NOH report 9266 and 9267), Leiden. Hermann B G, Kroeze C, Jawjit W. 2006. Assessing environmental performance by combining life cycle assessment, multi-criteria analysis and environmental performance indicators. Journal of Cleaner Production: in press. Homjun J. 1989. Impact of Eucalyptus Plantation on Soil properties and Subsequent Cropping in Northeast Thailand. Institute of Research and Development, Khonkaen University. (Thai edition) Hostachy J C, Lenon G, Pisicchio J L, Coste S, Lgeay C. 1997. Reduction of pulp and paper mill pollution by ozone treatment. Water Science and Technology 35 (2–3): 261–268. Huggett R J. 1993. Modelling the human impact on nature: systems analysis of environmental problems, Oxford University Press, Oxford, UK. Hynninen P. 1998. Papermaking Science and Technology Environmental Control. The Finnish Paper Engineer’s Association and TAPPI. Finland
20
IPCC. 1997. Greenhouse Gas Inventory Reference Manual, IPCC Guidelines for National Greenhouse Gas Inventories Volume 3. Intergovernmental Panel on Climate Change. Kazumi J, Håggblom M M, Young L Y. 1995. Degradation of monochlorinated and nonchlorinated compounds under iron reducing conditions. Applied Environmental Microbiology 61: 4069–4073. Klasssen G. 1991.Costs of controlling ammonia emissions in Europe. Status report. IIASA. Laxenburg. Austria. Korczak M K, Koziarski S, Komorowska B. 1991. Anaerobic treatment of pulp mill effluents. Water Science and Technology 24 (7): 203–206. Kumyong S. 1993. The Study on Effects of Eucalyptus Plantations on Nitrogen Mineralization and Nitrification in Soils .Department of Soil Science and Conservation .Faculty of Agriculture. Cheing Mai University.Thailand (Thai edition) Lang C. 2000.Thailand: Massive eucalyptus plantations planned. World rainforest movement’s bulletin No.36, July. Lang C.1999. Thailand: eucalyptus and Jiang Zemin’s coming lesson. World rainforest movement’s bulletin No.28, November.
Larisch B C, Duff J B. 1997. Effect of H2O2 and data on the characteristics and treatment of TCF (totally chlorine-free) and ECF (elementally chlorine-free) kraft pulping effluents. Water Science and Technology 35 (2–3): 63–171. Larisch B C, Duff J B. 2000. Effect of DTPA and EDTA on activated sludge reactors treating bleached kraft mill effluent. TAPPI Journal 83 (6): 54. Larson E D, Consonni S, Katofsky R E. 2003. A cost-benefit assessment of biomass gasification in pulp and paper industry. Final report. Princeton University, Politecino di Milano, Navigant Consulting Inc. Leptiso R, Rintala J. 1994. The removal of chlorinated phenolic compounds from chlorine bleaching effluents using thermophilic anaerobic processe. Water Science and Technology 29 (5-6): 373-380. Malinen R, Wartiovaara I, Valttila O, Anttila S. 1994. Scenario analysis of pulp manufacture in Finland to the year 2010. Water Science and Technology 29 (5-6);19-31. Martin J. 1993. Extended delignification: a status report. Appita 46(6): 445-451. Mollersten K, Gao L, Yan J, Oberstiener M. 2004.Efficient energy systems with CO2 capture and storage from renewable biomass in pulp and paper mills. Renewable energy 29: 1583-1598. Miner R, Upton B. 2002. Method for estimating greenhouse gas emissions from lime kilns at kraft pulp mill. Energy 27(8): 729-738.
21
Nelson P, Chin C, Grover S. 1993. Bleaching of Eucalyptus Kraft pulp from an environmental point of view. Appita 46: 354-360. Normandin A. 2005.Comparative annual cost efficiency between thermal and chemical oxidation of TRS in kraft mills. TAPPI Journal 4 (7): 3-8.
Norval G, Burton T, Kanters C. 2001. The removal of pulp mill odors by novel catalytic environmental technology. Pulp and Paper Canada 102 (4): 53-55.
NZTE. 2005. Thailand country brief. New Zealand Trade & Enterprise. Access in http://www.marketnewzealand.com/commom/files/Thailand-cb2005.pdf. Ongmongkolkul A, Nielsen P. 2001. Life cycle Assessment of Paperboard packaging produced in Thailand. School of Environment, Resource and Development, Asian Institute of Technology (AIT). Thailand. Pavasant P, Soontaranun W, Piumsomboon P, Wongsuchoto P, Boonyanoppakun K. 2006. Life cycle assessment of paper, Phase 1: Life cycle inventory of paper production. The Thailand Research Fund, Bangkok, Thailand (Thai edition). Perez M, Torrades F, Domenech X, Peral J. 2002. Treatment of bleaching Kraft mill effluents and polychlorinated phenolic compounds with ozonation. Journal of Chemical Technology and Biotechnology 77: 891–897.
Peter C F, Larachi F. 2005. Bifunctional redox iron/cerium hydroxide process for H2S removal from pulp and paper emissions. Industrial and Engineering Chemistry Research 44 (25): 9391-9397.
Petmak P. 1987a. Some ecological effect of eucalyptus plantation in agricultural area; Technical paper Vol.2. Department of Royal Forestry, Bangkok, Thailand. (Thai edition) Petmak P. 1987b. Ecological effect of Eucalyptus maludensis plantation in Thailand. Department of Royal Forestry, Bangkok, Thailand (Thai edition) Pineda-Henson R, Culaba A B, Mendoza G A. 2002. Evaluating Environmental Performance of Pulp and Paper Manufacturing Using the Analytical Hierarchy Process and Life Cycle Assessment. Journal of Industrial Ecology 6(1): 15-28. Pluimers J C. 2001. An environmental systems analysis of greenhouse horticulture in the Netherlands: the tomato case. PhD. Thesis. Wageningen University, Wageningen, The Netherlands. Pokherl D, Viraraghavan T. 2004. Treatment of pulp and paper mill wastewater-a review. Science of the Total Environment 333 (2004): 37-58. Paousajja R. 1987. Problems and consideration on effects of eucalyptus on soil and water. Department of Royal Forestry, Bangkok, Thailand. Paousajja R. 2006. Eucalyptus plantation in Thailand. FAO Corporate document repository: reports submitted to the regional expert consultation on eucalyptus. Vol II. www.fao.org/documents/show.cdr.asp?url.file=/docrep/005/ac772e/ac772eom.htm
22
Pinkerton J E. 1993. Emission of SO2 and NOx from pulp and paper mill. Air Waste 43: 1404. Rajesh N. 2000. Thailand: Sino-Thai eucalyptus project facing opposition. World rainforest movement’s bulletin No.34, May. Rintala J, Lepisto R. 1993. Thermophilic anaerobic–aerobic and aerobic treatment of Kraft bleaching effluents. Water Science and Technology 28 (2): 11–16. Quade E S, Miser H J. 1997. The context, nature and use of systems analysis. In: H.J. Miser and E.S. Quade. Handbook of systems analysis. Volume One – Overview of uses, procedures, applications, and practice. John Wiley and Sons, Chichester, UK: 1-32. Sakurai K. 1995. Cleaner Production for Green Productivity: Asian Perspective. Asian Productivity Organization. Tokyo. Schwaiger H, Zimmer B. 1995. A comparsion of fuel consumption and greenhouse gas emissions from forest operations in Europe. In “Environmental impacts of forestry and Forest industry” edited by Solberg B. and Roihuvo L., Proceeding of the International Seminar organised by the Finnish-French Society of Science and Techonolgy and the European Forest Institute. Joensuu, Finland. Schnell A., Steel P., Melcer H., Hodson P.V., Carey J.H. 2000. Enhanced biological treatment of bleached Kraft mill effluents: I. Removal of chlorinated organic compounds and toxicity. Water Research 34(2): 493-500. Schwarz B. 1997. Forecasting and Scenario’s. In: H.J. Miser and E.S. Quade. Handbook of systems analysis. Volume Two - Craft Issues and Procedural Choices, John Wiley and Sons, Chichester, UK, pp. 327-367. Sharma R. 2004. Thailand pulp and paper industry: Hoping to ride on a strong economy. Paper Asia 20(6): 14-18. Shawwa A R, Smith D W, Sego D C. 2001. Color and chlorinated organics removal from pulp wastewater using activated petroleum coke. Water Research 35 (3): 745–749. Singh R P. 1984. Nutrient cycle in Eucalyptus tereticornis. Smith plantation. The Indian Forester 110 (1): 76-85. Sonnenfeld D. 2002. Social movements and ecological modernization: The transformation of pulp and paper manufacturing. Development and Change 33 (1): 1-27. Strehler A, Welander T. 1994. A novel method for biological treatment of bleached Kraft mill wastewaters. Water Science and Technology 29 (5–6): 295–301. Stuthridge T R, McFarlane P N. 1994. Adsorbable organic halide removal mechanisms in a pulp and paper mill aerated lagoon treatment system. Water Science and Technology 29 (5–6): 195–208. Office of Water Conservation. 1987. Some ecological effect after eucalyptus plantation. Department of Royal Forestry, Bangkok, Thailand.
23
Paosaj R. 1987. Problems and consideration on effects of eucalyptus on soil and water. Department of Royal Forestry, Bangkok, Thailand. TEI. 1997. Thailand’s National Greenhouse Gas Inventory 1990. Thailand Environment Institute, submitted to Office of Environmental Policy and Planning, Ministry of Science, Technology and Environment, Bangkok, Thailand. TEI. 1999. Industrial Environmental Performance Indicators, the third progress report. submitted to Pollution Control Department, Ministry of Science, Technology and Environment, Bangkok, Thailand. (Thai edition) Tiwar K M, Mathur R S. 1983. Water consumption and Nutrient uptake by Eucalyptus. The Indian Forester 109(12): 851- 860. UNEP.1996. Environmental management in the pulp and paper industry. United Nation Environment Programme: Industry and Environment. Stockholm, Sweden UNEP. 2003. Draft guidelines on Best Available Techniques (BAT) for pulping processes. Expert group on best available techniques and best environmental practices. United Nations Environmental Programme. Villarrica, Chile. Vidal G, Soto M, Field J, Mendez-Pampin R, Lema J M. 1997. Anaerobic biodegradability and toxicity of wastewaters from chlorine and total chlorine-free bleaching of eucalyptus kraft pulps. Water Research 31 (10):2487-2494 Vigneswaran S, Jegatheesan V, Visvanathan C. 1999. Industrial waste minimization initiatives in Thailand: concept, examples and pilot scale trials, Journal of Cleaner Production 7: 43-47. Webb L J. 1994. Integrated pollution control of emissions from the pulp and paper industry. Water Science and Technology 29 (5-6): 123-130. Wilson B. 1984. System: concepts, methodologies and applications. John Wiley&Sons. Chichester, United Kingdom. Wirojanagud W. and Boonpoke A. Treatment of Pulp and Paper Wastewater by Adsorption with Soil. Asian-Pacific Regional Conference on Practical Environmental Technologies. Chia Nan University of Pharmacy and Science Tainan, Taiwan. December 18-21, 2003. Yoon S H, Chai X S, Zhu J Y, Li J, Malcolm E W. 2000. In-digester reduction of organic sulfur compounds in kraft pulping. Advances in Environmental Research 5(1): 91-98.

24
This chapter has been published in Environment, Sustainability and Development 2006; 8(2):289-311.
This chapter was presented at the following international conferences:
- Industry Ecology, organized by The Gordon Research Conference (GRC) at the Queen’s college, Oxford University, United Kingdom. August, 2004.
- Partnership for Sustainable Development, organized by The Greening of Industry Network (GIN) at The University of Hong Kong, Hong Kong. November, 2004.
Warit Jawjit, Carolien Kroeze, Wit Soontaranun and Leen Hordijk

26
27
Chapter 2: An Analysis of the Environmental Pressure Exerted by the Eucalyptus-based Kraft Pulp Industry in Thailand
Abstract
The study reported here focuses on the environmental pressure exerted by large-scale eucalyptus-based Kraft pulp industry in Thailand. This study is to identify the most important sources of greenhouse gases, acidifying and eutrophying compounds and tropospheric ozone precursors, human toxicity compounds and solid waste associated with the Kraft pulp industry. To this end, we performed an environmental systems analysis of the Kraft pulp industry system in which we distinguished between two subsystems: the eucalyptus forestry subsystem and the Kraft pulp production subsystem. The results indicate that the environmental pressure is caused by the Kraft pulp production subsystem rather than by the eucalyptus forestry one. The chemical recovery unit was found to be the most important source of carbon dioxide (CO2) and sulfur dioxide (SO2) and responsible for more than one-half of the emissions of greenhouse gases and acidifying compounds from eucalyptus-based Kraft pulp production in Thailand. Biomass combustion in the energy gene ration unit is an important source of nitrogen oxide (NOx) and carbon monoxide (CO) which in turn are responsible for over 50% of the emissions of tropospheric ozone precursors. About 73% of the eutrophication is caused by biological aerobic wastewater treatment emitting phosphorus (P). With respect to the eucalyptus forestry, only fertilizer use in eucalyptus plantations is a relevant source of pollution through the emission of nitrous oxide (N2O) and phosphate (PO4
3-). 2.1 Introduction
The pulp industry is one of the important fundamental industries in Thailand. With an average annual growth of 5% (DIW, 1999), the production capacity is increasing steadily, and new expansion projects are currently underway. A consequence of this growth is an increasing concern about the environmental impacts. However, to date, there have been no integrated studies that analyze the environmental impact of kraft pulp production in Thailand. One possibility is to carry out an environmental sys tems analysis. Several environmental systems analysis tools exist that could be useful in this respect and which also help to evaluate the reduction options. One of the analytical tools often used in systems analysis is life cycle analysis (LCA). This approach considers the impacts associated with individual products, taking into account the entire life cycle ranging from raw material acquisition, manufacture, transportation and product use and discard. In Thailand, the majority of the pulp is produced in a eucalyptus-based kraft process (ERIC and TPPIA, 2002). Therefore, a study of the environmental performance of pulp production also needs to take the eucalyptus plantation system into account.
To date, only a few studies on the environmental performance of pulp production in Thailand have been carried out. Ongmongkolkul and Nielsen (2001) included a pulp production component in a study of LCA of paperboard packaging in Thailand. Because of the scarcity of information available on the pulp and paper industry in Thailand, these investigators used the System for Integrated Environ mental Assessment of Products (SIMAPRO) as a calculation tool. Their study included a
28
first estimate of the environmental impact of the eucalyptus forestry using data obtained from the Danish wood industry. A recent study by the Thailand Environmental Institute (TEI, 1999) on the industrial environmental index indicated that there were indeed difficulties in obtaining information from the pulp and paper industry for a number of indicators, such as AOX (adsorbable organic halides), TRS (total reduced sulfur) and VOC (volatile organic compounds). Consequently, studies aimed at obtaining more site-specific information are necessary in order to achieve a more accurate and reliable data on the environmental impact of the pulp and paper industry in Thailand. The use of databases from other sources or software, which are not Thailand-based, may not best represent the state of the pulp industry in Thailand. To improve our understanding of the environmental performance of pulp production in Thailand, analyses need to be performed on information obtained locally. In the study reported here, we focused on the pressure exerted by the eucalyptus-based Kraft pulp production on the environment in Thailand. When analyzing the emission of pollutants related to the agricultural and industrial sector, one may aim for a full LCA approach of all products. However, with respect to pulp and paper production in Thailand, this is not feasible because of the complexity of the industry. It would be much too time-consuming because of the large number of final products of paper, each having their own unique production process. Therefore, we decided not to perform a full LCA; instead, we focused on eucalyptus Kraft pulp as a final product.
Another problem is to determine which parts of the production chain have to be described in order to be able to analyze environmental problems related to eucalyptus plantation and Kraft pulp production - without performing full LCA for all the products involved. In the other words: what are the system boundaries and how can we decide which inputs, outputs and processes have to be taken into account and which can be omitted? The aim of this study is to contribute to an answer to these questions, by analyzing the current environmental pressure of the eucalyptus-based Kraft pulp industry in Thailand. This can be done by making an inventory of sources of greenhouse gases, of acidifying and eutrophying compounds as well as of tropospheric ozone precursor, human toxicity substances and solid wastes from the eucalyptus-based Kraft pulp industry in Thailand.
Based on the inventory, our primary aim is to identify the most important sources of the different pollutants. Following the LCA philosophy, we focus not only focus on the pulp production, but also on the eucalyptus forestry producing raw material for Kraft pulp production. A second aim of our analysis is to reveal which emissions need to be taken into account in a system analysis aiming at analyzing possible reduction strategies. The analysis reported here is based, as much as possible, on information obtained locally. 2.2 Methodology
The first and second steps of environmental systems analysis methodology - problem definition and system definition - are used in this study. This includes a clear definition of the system by listing the system inputs, outputs and their relations, and analyzes which inputs, outputs and processes have to be taken into account and which can be omitted (Pluimers, 2001). In this section the system definition is described in detail. The main sources of pollutants, derived from activities in the eucalyptus-based
29
Kraft pulp industry, are identified. The method for calculating the emission and environmental impact are also presented with the source of information.
2.2.1 System definition
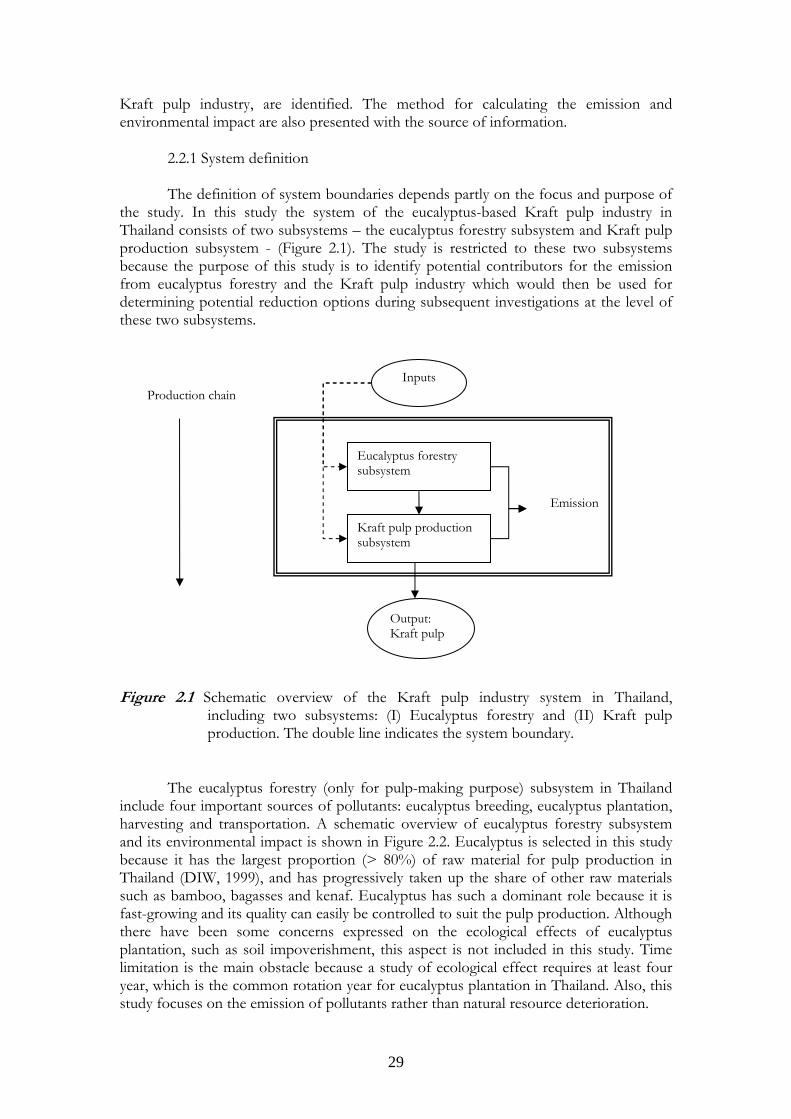
The definition of system boundaries depends partly on the focus and purpose of the study. In this study the system of the eucalyptus-based Kraft pulp industry in Thailand consists of two subsystems – the eucalyptus forestry subsystem and Kraft pulp production subsystem - (Figure 2.1). The study is restricted to these two subsystems because the purpose of this study is to identify potential contributors for the emission from eucalyptus forestry and the Kraft pulp industry which would then be used for determining potential reduction options during subsequent investigations at the level of these two subsystems.
Figure 2.1 Schematic overview of the Kraft pulp industry system in Thailand,
including two subsystems: (I) Eucalyptus forestry and (II) Kraft pulp production. The double line indicates the system boundary.
The eucalyptus forestry (only for pulp-making purpose) subsystem in Thailand include four important sources of pollutants: eucalyptus breeding, eucalyptus plantation, harvesting and transportation. A schematic overview of eucalyptus forestry subsystem and its environmental impact is shown in Figure 2.2. Eucalyptus is selected in this study because it has the largest proportion (> 80%) of raw material for pulp production in Thailand (DIW, 1999), and has progressively taken up the share of other raw materials such as bamboo, bagasses and kenaf. Eucalyptus has such a dominant role because it is fast-growing and its quality can easily be controlled to suit the pulp production. Although there have been some concerns expressed on the ecological effects of eucalyptus plantation, such as soil impoverishment, this aspect is not included in this study. Time limitation is the main obstacle because a study of ecological effect requires at least four year, which is the common rotation year for eucalyptus plantation in Thailand. Also, this study focuses on the emission of pollutants rather than natural resource deterioration.
Inputs
Eucalyptus forestry subsystem
Kraft pulp production subsystem
Output: Kraft pulp
Emission
Production chain
30
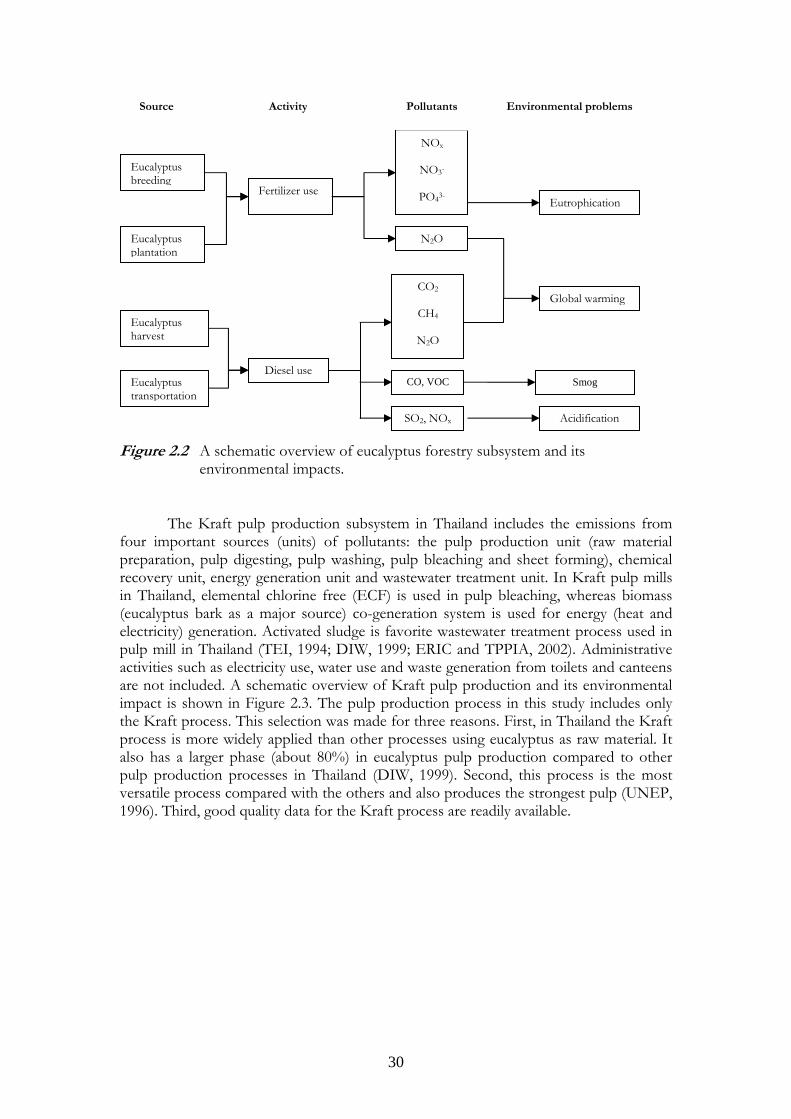
Figure 2.2 A schematic overview of eucalyptus forestry subsystem and its
environmental impacts. The Kraft pulp production subsystem in Thailand includes the emissions from
four important sources (units) of pollutants: the pulp production unit (raw material preparation, pulp digesting, pulp washing, pulp bleaching and sheet forming), chemical recovery unit, energy generation unit and wastewater treatment unit. In Kraft pulp mills in Thailand, elemental chlorine free (ECF) is used in pulp bleaching, whereas biomass (eucalyptus bark as a major source) co-generation system is used for energy (heat and electricity) generation. Activated sludge is favorite wastewater treatment process used in pulp mill in Thailand (TEI, 1994; DIW, 1999; ERIC and TPPIA, 2002). Administrative activities such as electricity use, water use and waste generation from toilets and canteens are not included. A schematic overview of Kraft pulp production and its environmental impact is shown in Figure 2.3. The pulp production process in this study includes only the Kraft process. This selection was made for three reasons. First, in Thailand the Kraft process is more widely applied than other processes using eucalyptus as raw material. It also has a larger phase (about 80%) in eucalyptus pulp production compared to other pulp production processes in Thailand (DIW, 1999). Second, this process is the most versatile process compared with the others and also produces the strongest pulp (UNEP, 1996). Third, good quality data for the Kraft process are readily available.
Eucalyptus breeding
Eucalyptus plantation
Eucalyptus harvest
Eucalyptus transportation
Fertilizer use
Diesel use
NOx
NO3-
PO43-
CO2
CH4
N2O
Eutrophication
Global warming
N2O
Source Activity Pollutants Environmental problems
SO2, NOx Acidification
CO, VOC Smog
31
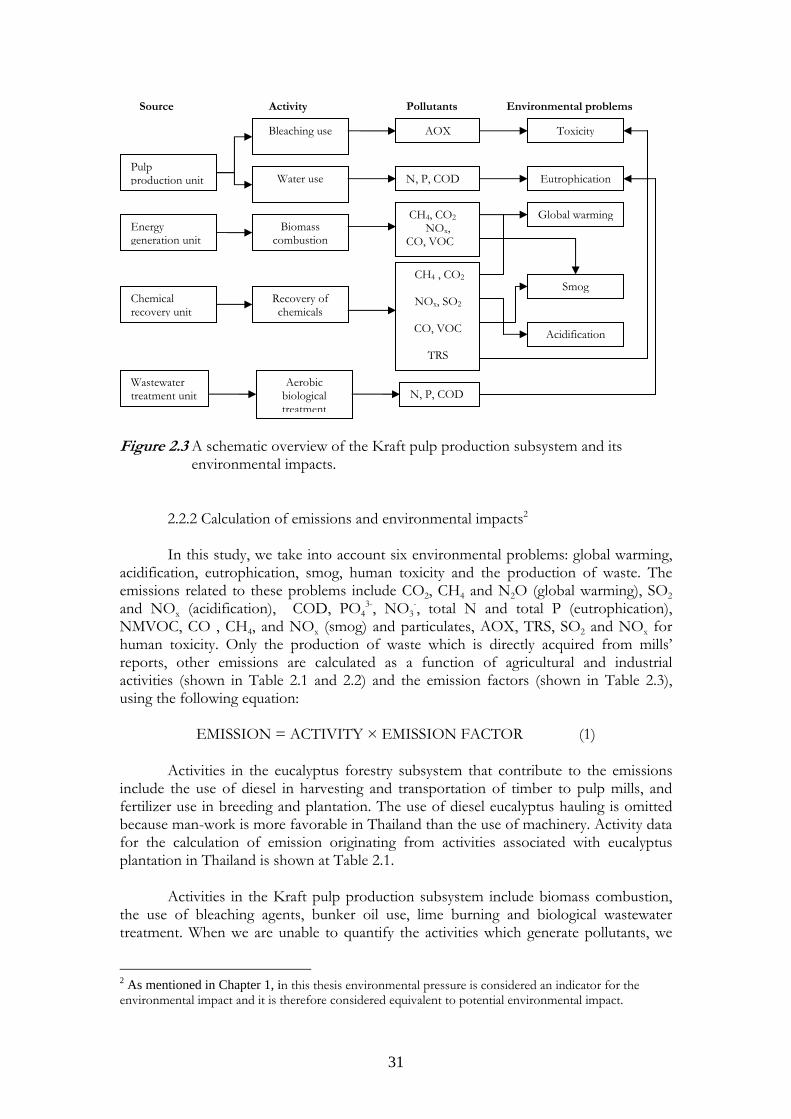
Figure 2.3 A schematic overview of the Kraft pulp production subsystem and its
environmental impacts.
2.2.2 Calculation of emissions and environmental impacts2 In this study, we take into account six environmental problems: global warming, acidification, eutrophication, smog, human toxicity and the production of waste. The emissions related to these problems include CO2, CH4 and N2O (global warming), SO2 and NOx (acidification), COD, PO4
3-, NO3-, total N and total P (eutrophication),
NMVOC, CO , CH4, and NOx (smog) and particulates, AOX, TRS, SO2 and NOx for human toxicity. Only the production of waste which is directly acquired from mills’ reports, other emissions are calculated as a function of agricultural and industrial activities (shown in Table 2.1 and 2.2) and the emission factors (shown in Table 2.3), using the following equation:
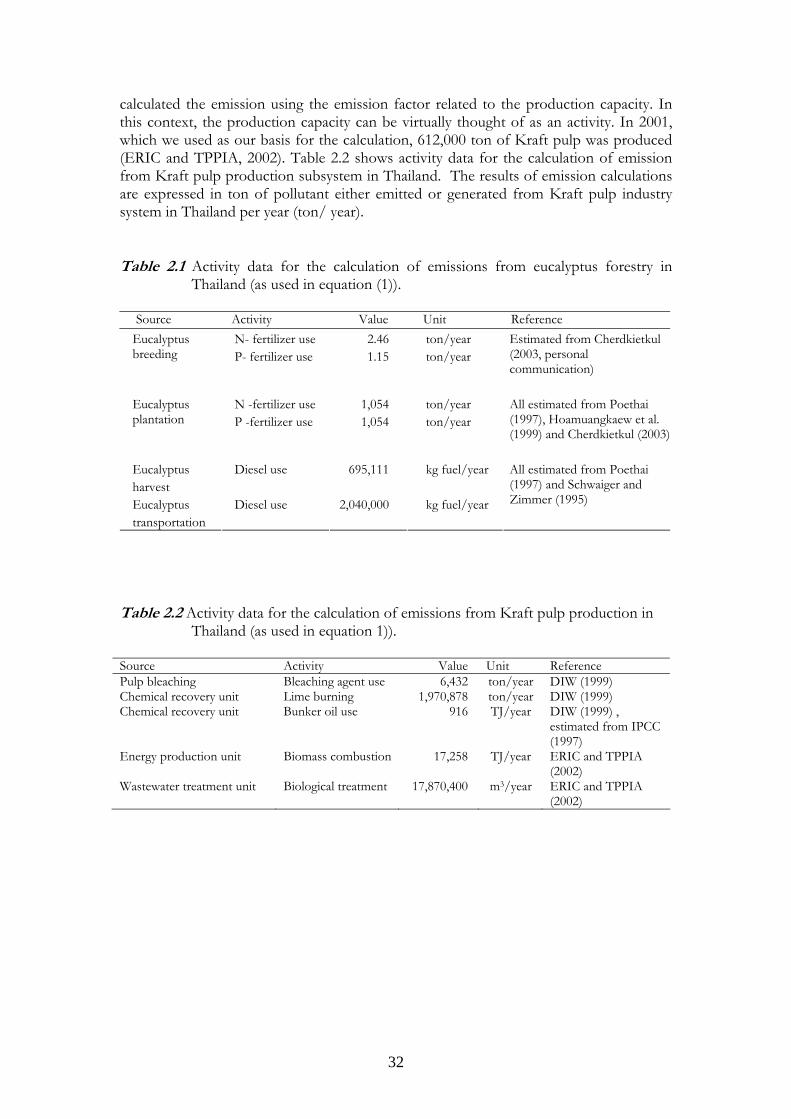
EMISSION = ACTIVITY × EMISSION FACTOR (1)
Activities in the eucalyptus forestry subsystem that contribute to the emissions include the use of diesel in harvesting and transportation of timber to pulp mills, and fertilizer use in breeding and plantation. The use of diesel eucalyptus hauling is omitted because man-work is more favorable in Thailand than the use of machinery. Activity data for the calculation of emission originating from activities associated with eucalyptus plantation in Thailand is shown at Table 2.1.
Activities in the Kraft pulp production subsystem include biomass combustion, the use of bleaching agents, bunker oil use, lime burning and biological wastewater treatment. When we are unable to quantify the activities which generate pollutants, we
2 As mentioned in Chapter 1, in this thesis environmental pressure is considered an indicator for the environmental impact and it is therefore considered equivalent to potential environmental impact.
Pulp production unit
Energy generation unit
Chemical recovery unit
Wastewater treatment unit
Source Activity Pollutants Environmental problems
Bleaching use
Water use
Biomass combustion
Recovery of chemicals
Aerobic biological treatment
AOX
N, P, COD
CH4, CO2 NOx,
CO, VOC
CH4 , CO2
NOx, SO2
CO, VOC
TRS
N, P, COD
Toxicity
Eutrophication
Global warming
Smog
Acidification
32
calculated the emission using the emission factor related to the production capacity. In this context, the production capacity can be virtually thought of as an activity. In 2001, which we used as our basis for the calculation, 612,000 ton of Kraft pulp was produced (ERIC and TPPIA, 2002). Table 2.2 shows activity data for the calculation of emission from Kraft pulp production subsystem in Thailand. The results of emission calculations are expressed in ton of pollutant either emitted or generated from Kraft pulp industry system in Thailand per year (ton/ year).
Table 2.1 Activity data for the calculation of emissions from eucalyptus forestry in Thailand (as used in equation (1)).
Source Activity Value Unit Reference
N- fertilizer use 2.46 ton/year Eucalyptus
breeding P- fertilizer use 1.15 ton/year Estimated from Cherdkietkul (2003, personal communication)
N -fertilizer use 1,054 ton/year Eucalyptus plantation P -fertilizer use 1,054 ton/year
All estimated from Poethai (1997), Hoamuangkaew et al. (1999) and Cherdkietkul (2003)
Eucalyptus harvest
Diesel use 695,111 kg fuel/year
Eucalyptus transportation
Diesel use 2,040,000 kg fuel/year
All estimated from Poethai (1997) and Schwaiger and Zimmer (1995)
Table 2.2 Activity data for the calculation of emissions from Kraft pulp production in
Thailand (as used in equation 1)). Source Activity Value Unit Reference Pulp bleaching Bleaching agent use 6,432 ton/year DIW (1999) Chemical recovery unit Lime burning 1,970,878 ton/year DIW (1999) Chemical recovery unit Bunker oil use 916 TJ/year DIW (1999) ,
estimated from IPCC (1997)
Energy production unit Biomass combustion 17,258 TJ/year ERIC and TPPIA (2002)
Wastewater treatment unit Biological treatment 17,870,400 m3/year ERIC and TPPIA (2002)
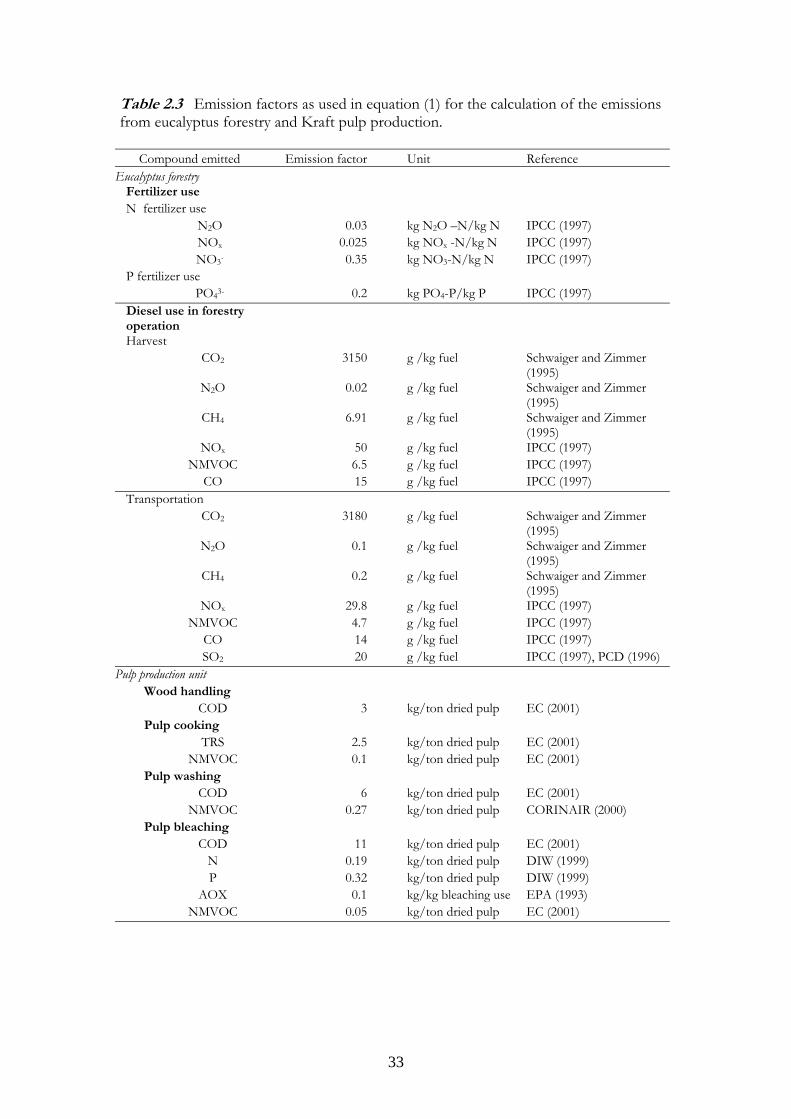
33
Table 2.3 Emission factors as used in equation (1) for the calculation of the emissions from eucalyptus forestry and Kraft pulp production.
Compound emitted Emission factor Unit Reference Eucalyptus forestry
Fertilizer use N fertilizer use
N2O 0.03 kg N2O –N/kg N IPCC (1997) NOx 0.025 kg NOx -N/kg N IPCC (1997) NO3- 0.35 kg NO3-N/kg N IPCC (1997)
P fertilizer use PO43- 0.2 kg PO4-P/kg P IPCC (1997)
Diesel use in forestry operation
Harvest CO2 3150 g /kg fuel Schwaiger and Zimmer
(1995) N2O 0.02 g /kg fuel Schwaiger and Zimmer
(1995) CH4 6.91 g /kg fuel Schwaiger and Zimmer
(1995) NOx 50 g /kg fuel IPCC (1997)
NMVOC 6.5 g /kg fuel IPCC (1997) CO 15 g /kg fuel IPCC (1997)
Transportation CO2 3180 g /kg fuel Schwaiger and Zimmer
(1995) N2O 0.1 g /kg fuel Schwaiger and Zimmer
(1995) CH4 0.2 g /kg fuel Schwaiger and Zimmer
(1995) NOx 29.8 g /kg fuel IPCC (1997)
NMVOC 4.7 g /kg fuel IPCC (1997) CO 14 g /kg fuel IPCC (1997) SO2 20 g /kg fuel IPCC (1997), PCD (1996)
Pulp production unit Wood handling
COD 3 kg/ton dried pulp EC (2001) Pulp cooking
TRS 2.5 kg/ton dried pulp EC (2001) NMVOC 0.1 kg/ton dried pulp EC (2001)
Pulp washing COD 6 kg/ton dried pulp EC (2001)
NMVOC 0.27 kg/ton dried pulp CORINAIR (2000) Pulp bleaching
COD 11 kg/ton dried pulp EC (2001) N 0.19 kg/ton dried pulp DIW (1999) P 0.32 kg/ton dried pulp DIW (1999)
AOX 0.1 kg/kg bleaching use EPA (1993) NMVOC 0.05 kg/ton dried pulp EC (2001)
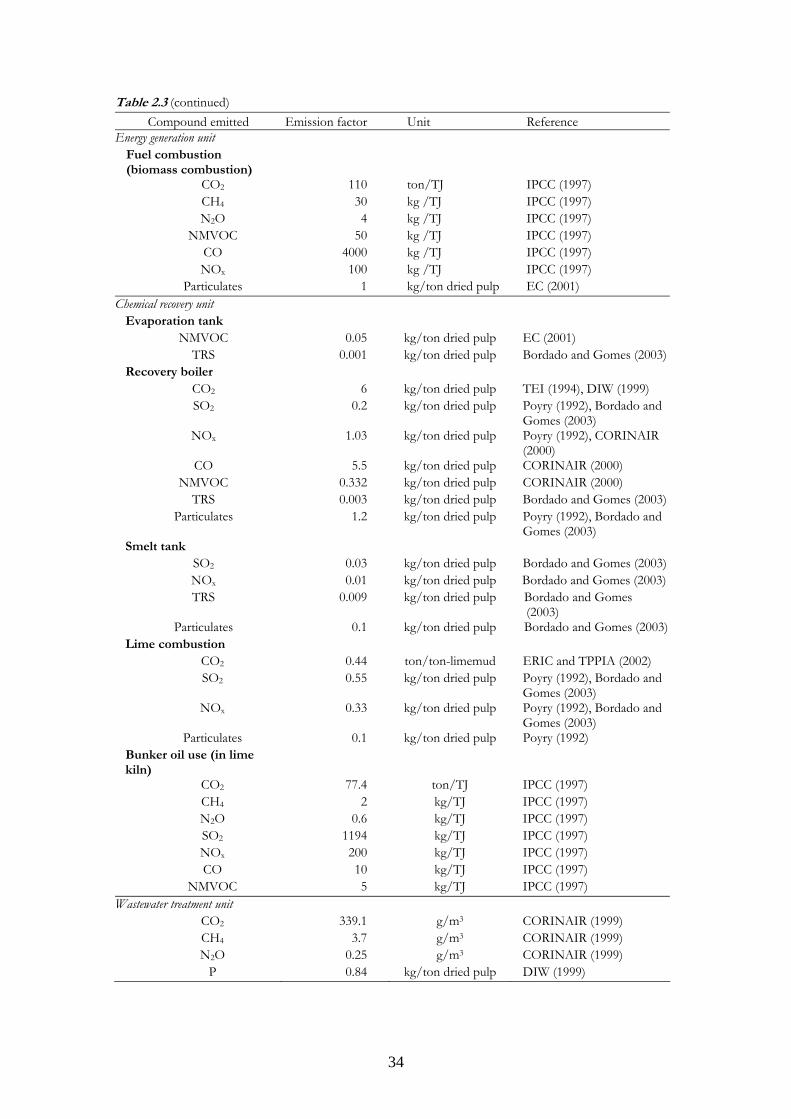
34
Table 2.3 (continued) Compound emitted Emission factor Unit Reference
Energy generation unit Fuel combustion (biomass combustion)
CO2 110 ton/TJ IPCC (1997) CH4 30 kg /TJ IPCC (1997) N2O 4 kg /TJ IPCC (1997)
NMVOC 50 kg /TJ IPCC (1997) CO 4000 kg /TJ IPCC (1997) NOx 100 kg /TJ IPCC (1997)
Particulates 1 kg/ton dried pulp EC (2001) Chemical recovery unit
Evaporation tank NMVOC 0.05 kg/ton dried pulp EC (2001)
TRS 0.001 kg/ton dried pulp Bordado and Gomes (2003)Recovery boiler
CO2 6 kg/ton dried pulp TEI (1994), DIW (1999) SO2 0.2 kg/ton dried pulp Poyry (1992), Bordado and
Gomes (2003) NOx 1.03 kg/ton dried pulp Poyry (1992), CORINAIR
(2000) CO 5.5 kg/ton dried pulp CORINAIR (2000)
NMVOC 0.332 kg/ton dried pulp CORINAIR (2000) TRS 0.003 kg/ton dried pulp Bordado and Gomes (2003)
Particulates 1.2 kg/ton dried pulp Poyry (1992), Bordado and Gomes (2003)
Smelt tank SO2 0.03 kg/ton dried pulp Bordado and Gomes (2003)NOx 0.01 kg/ton dried pulp Bordado and Gomes (2003)TRS 0.009 kg/ton dried pulp Bordado and Gomes
(2003) Particulates 0.1 kg/ton dried pulp Bordado and Gomes (2003)
Lime combustion CO2 0.44 ton/ton-limemud ERIC and TPPIA (2002) SO2 0.55 kg/ton dried pulp Poyry (1992), Bordado and
Gomes (2003) NOx 0.33 kg/ton dried pulp Poyry (1992), Bordado and
Gomes (2003) Particulates 0.1 kg/ton dried pulp Poyry (1992)
Bunker oil use (in lime kiln)
CO2 77.4 ton/TJ IPCC (1997) CH4 2 kg/TJ IPCC (1997) N2O 0.6 kg/TJ IPCC (1997) SO2 1194 kg/TJ IPCC (1997) NOx 200 kg/TJ IPCC (1997) CO 10 kg/TJ IPCC (1997)
NMVOC 5 kg/TJ IPCC (1997) Wastewater treatment unit
CO2 339.1 g/m3 CORINAIR (1999) CH4 3.7 g/m3 CORINAIR (1999) N2O 0.25 g/m3 CORINAIR (1999)
P 0.84 kg/ton dried pulp DIW (1999)
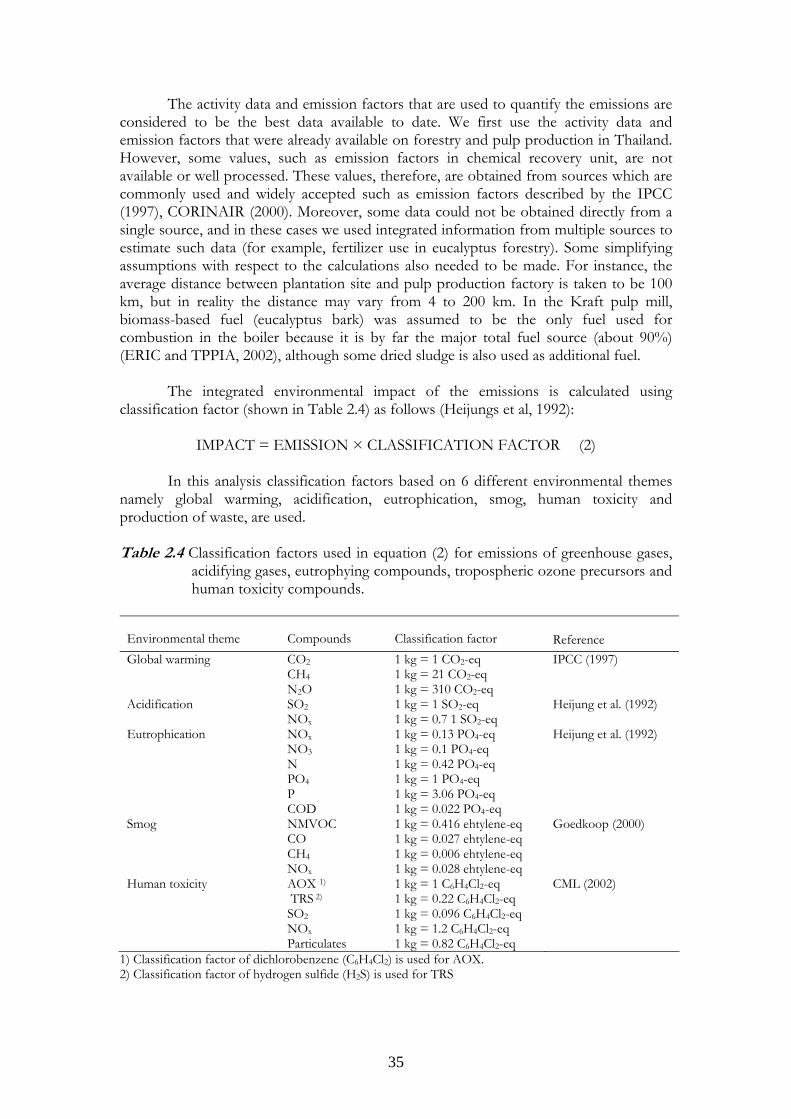
35
The activity data and emission factors that are used to quantify the emissions are considered to be the best data available to date. We first use the activity data and emission factors that were already available on forestry and pulp production in Thailand. However, some values, such as emission factors in chemical recovery unit, are not available or well processed. These values, therefore, are obtained from sources which are commonly used and widely accepted such as emission factors described by the IPCC (1997), CORINAIR (2000). Moreover, some data could not be obtained directly from a single source, and in these cases we used integrated information from multiple sources to estimate such data (for example, fertilizer use in eucalyptus forestry). Some simplifying assumptions with respect to the calculations also needed to be made. For instance, the average distance between plantation site and pulp production factory is taken to be 100 km, but in reality the distance may vary from 4 to 200 km. In the Kraft pulp mill, biomass-based fuel (eucalyptus bark) was assumed to be the only fuel used for combustion in the boiler because it is by far the major total fuel source (about 90%) (ERIC and TPPIA, 2002), although some dried sludge is also used as additional fuel.
The integrated environmental impact of the emissions is calculated using classification factor (shown in Table 2.4) as follows (Heijungs et al, 1992):
IMPACT = EMISSION × CLASSIFICATION FACTOR (2) In this analysis classification factors based on 6 different environmental themes namely global warming, acidification, eutrophication, smog, human toxicity and production of waste, are used. Table 2.4 Classification factors used in equation (2) for emissions of greenhouse gases,
acidifying gases, eutrophying compounds, tropospheric ozone precursors and human toxicity compounds.
Environmental theme
Compounds
Classification factor Reference
Global warming CO2 CH4 N2O
1 kg = 1 CO2-eq 1 kg = 21 CO2-eq 1 kg = 310 CO2-eq
IPCC (1997)
Acidification SO2 NOx
1 kg = 1 SO2-eq 1 kg = 0.7 1 SO2-eq
Heijung et al. (1992)
Eutrophication NOx NO3 N PO4 P COD
1 kg = 0.13 PO4-eq 1 kg = 0.1 PO4-eq 1 kg = 0.42 PO4-eq 1 kg = 1 PO4-eq 1 kg = 3.06 PO4-eq 1 kg = 0.022 PO4-eq
Heijung et al. (1992)
Smog
NMVOC CO CH4 NOx
1 kg = 0.416 ehtylene-eq 1 kg = 0.027 ehtylene-eq 1 kg = 0.006 ehtylene-eq 1 kg = 0.028 ehtylene-eq
Goedkoop (2000)
Human toxicity AOX 1)
TRS 2) SO2 NOx Particulates
1 kg = 1 C6H4Cl2-eq 1 kg = 0.22 C6H4Cl2-eq 1 kg = 0.096 C6H4Cl2-eq 1 kg = 1.2 C6H4Cl2-eq 1 kg = 0.82 C6H4Cl2-eq
CML (2002)
1) Classification factor of dichlorobenzene (C6H4Cl2) is used for AOX. 2) Classification factor of hydrogen sulfide (H2S) is used for TRS
36
Global warming
Greenhouse gases, which are the main pollutants contributing to global warming problem, are expressed as GWP (Global Warming Potentials). The GWP is an index of cumulative radiative forcing between the present and some chosen later time horizon caused by a unit mass of gas emitted, expressed relative to the reference gas CO2 (1 kg CO2) (Houghton,1994). The combustion of fuels in pulp mill is the major source of these gases.
In case of forestry, the growth of eucalyptus acts as CO2 sink through
photosynthesis. The calculation of CO2 sequestration, therefore, can be taken into account by following the IPCC (1997) procedure:
Total annual biomass C uptake by eucalyptus
Cs = AP × GP × CP (3)
Where Cs = Annual biomass C uptake (ton C/year)
AP = Area of plantation (ha) GP = Annual biomass growth rate (ton dry matter/ha/year) CP = C fraction in plantation or plant species (ton C/ton dry matter)
CO2 sequestration by eucalyptus (ton/year) is then CO2 = Cs × (44/12) (4)
However, although both emissions as well as the CO2 capture during eucalyptus growth are quantified, the net effect of the two will not be quantified. The net greenhouse gas flux can not be quantified because CO2 losses after the produced paper is discarded are not considered. Moreover, this study considers the plantation of eucalyptus as “normal forest” system. A normal forest consists of an equal area of annual age-classes, with the oldest age-class equal to the chosen rotation age. When the oldest age-class is felled, it will be immediately replanted. In a normal forest, the removal of forest products from the oldest stand exactly counterbalances the growth of those products in all other stands. Thus, there is no change in biomass from year to year and therefore no change in carbon. The whole site is therefore a carbon reservoir, but not a net sink or a net source because the annual growth equals the annual losses (Maclaren, 1996). It should be noted that the current methodology of LCA is not able to deal with the evaluation of the sink-effects of carbon in timber products. The CO2 uptake should, therefore, not be seen as a credit, but as the implementation of the carbon neutrality of wood when its life cycle is taken into consideration (De Feyter, 1995). In this study, the overall greenhouse gas emission from the eucalyptus-based Kraft pulp industry in Thailand is presented and include CO2 uptake within the eucalyptus based-pulp only for reasons of comparison (Table 2.5).
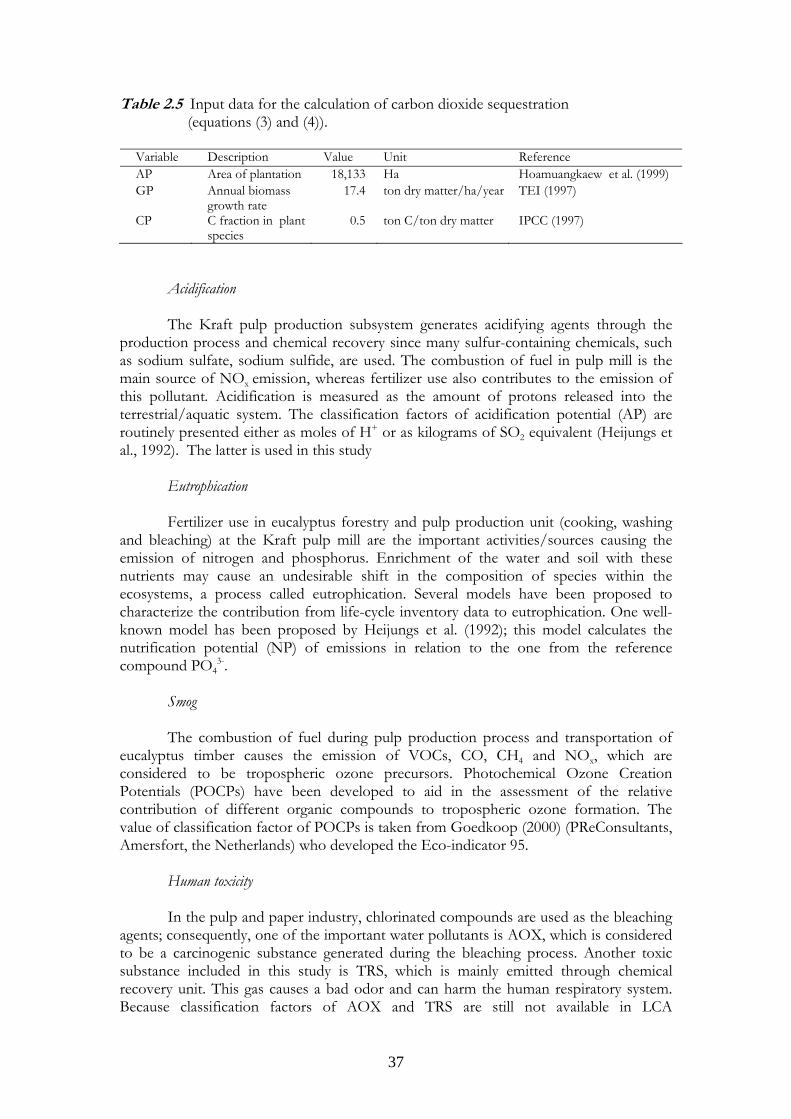
37
Table 2.5 Input data for the calculation of carbon dioxide sequestration (equations (3) and (4)).
Variable Description Value Unit Reference AP Area of plantation 18,133 Ha Hoamuangkaew et al. (1999) GP Annual biomass
growth rate 17.4 ton dry matter/ha/year TEI (1997)
CP C fraction in plant species
0.5 ton C/ton dry matter IPCC (1997)
Acidification The Kraft pulp production subsystem generates acidifying agents through the production process and chemical recovery since many sulfur-containing chemicals, such as sodium sulfate, sodium sulfide, are used. The combustion of fuel in pulp mill is the main source of NOx emission, whereas fertilizer use also contributes to the emission of this pollutant. Acidification is measured as the amount of protons released into the terrestrial/aquatic system. The classification factors of acidification potential (AP) are routinely presented either as moles of H+ or as kilograms of SO2 equivalent (Heijungs et al., 1992). The latter is used in this study Eutrophication Fertilizer use in eucalyptus forestry and pulp production unit (cooking, washing and bleaching) at the Kraft pulp mill are the important activities/sources causing the emission of nitrogen and phosphorus. Enrichment of the water and soil with these nutrients may cause an undesirable shift in the composition of species within the ecosystems, a process called eutrophication. Several models have been proposed to characterize the contribution from life-cycle inventory data to eutrophication. One well-known model has been proposed by Heijungs et al. (1992); this model calculates the nutrification potential (NP) of emissions in relation to the one from the reference compound PO4
3-. Smog The combustion of fuel during pulp production process and transportation of eucalyptus timber causes the emission of VOCs, CO, CH4 and NOx, which are considered to be tropospheric ozone precursors. Photochemical Ozone Creation Potentials (POCPs) have been developed to aid in the assessment of the relative contribution of different organic compounds to tropospheric ozone formation. The value of classification factor of POCPs is taken from Goedkoop (2000) (PReConsultants, Amersfort, the Netherlands) who developed the Eco-indicator 95. Human toxicity In the pulp and paper industry, chlorinated compounds are used as the bleaching agents; consequently, one of the important water pollutants is AOX, which is considered to be a carcinogenic substance generated during the bleaching process. Another toxic substance included in this study is TRS, which is mainly emitted through chemical recovery unit. This gas causes a bad odor and can harm the human respiratory system. Because classification factors of AOX and TRS are still not available in LCA
38
methodology, we use classification factors of dichlorobenzene (C6H4Cl2) for AOX and hydrogen sulfide (H2S) for TRS. Emissions of particulates, SO2, NOx also contribute to human toxicity problem. Classification factors in this environmental theme are taken from CML (2002). Production of waste The Kraft pulp industry generates both organic and inorganic solid wastes. Most of the organic wastes, such as eucalyptus bark, dried sludge, are sent to boiler to generate heat and electricity in co-generation system. These organic wastes are then converted to air pollutants. We focus our study of the production of waste on inorganic wastes, such as lime mud, grit and dregs, which, because they can not be recycled or reused and then are sent to landfill. The results of waste production are expressed in terms of amount of solid waste per year (ton/year) because there is no available classification factor.
Although all data used in this study to quantify the emissions and environmental impact is considered to be the best data available, the calculated emissions are subject to uncertainty. We did not carry out a sensitivity or uncertainty analysis to analyze the sensitivity of the calculated emissions, including uncertainties in the assumptions and method used. The classification factors used, such as global warming potentials (GWPs), acidifying and eutrophying potentials are also subject to uncertainties because these values were not developed in Thailand or on Thailand-based data, although GWPs are commonly used and accepted as classification factor for greenhouse gases (IPCC, 1997). The classification factors we used for calculating the PO4-equivalents of eutrophying emissions are less widely used and are based on several assumptions (Heijungs et al., 1992). PO4-equivalents are generally used in LCA studies to indicate the gross effect of eutrophication irrespective of the location of the emissions. However, eutrophication is an environmental problem with typically local effects, and the eutrophication potentials may change when eutrophication is considered as a local problem. Despite these limitations the estimated emission and environmental impact presented here may be the best available at the present and, therefore, they served the purpose of the study.
2.3 Results and Discussion
2.3.1 Greenhouse gases emission
Approximately 2.9 Mton CO2-equivatents of greenhouse gas is emitted annually as shown in Table 2.6. Among three main components of greenhouse gases - CO2, CH4 and N2O – we found that CO2 accounts for almost all of the emissions in term of both actual and equivalent amounts. When we considered the activities that generate greenhouse gases, biomass combustion in energy production unit ranks the first, with the share of 65%. The second contributor belongs to lime burning, with a relative emission of 30%.
Based on these data, it is clear that if the amount of Greenhouse gas emission is
considered alone, the focal points for this issue would only be limited to the pulp production process – specifically, biomass combustion and lime burning as seen in Figure 2.4 (I). However, if one analyzes further to the source of emission, it is clear that these two activities become much less significant. The reason for this is that the emissions of CO2 from biomass combustion can normally be excluded from greenhouse gas inventories since the carbon is derived from trees, in this case, eucalyptus (EPA,
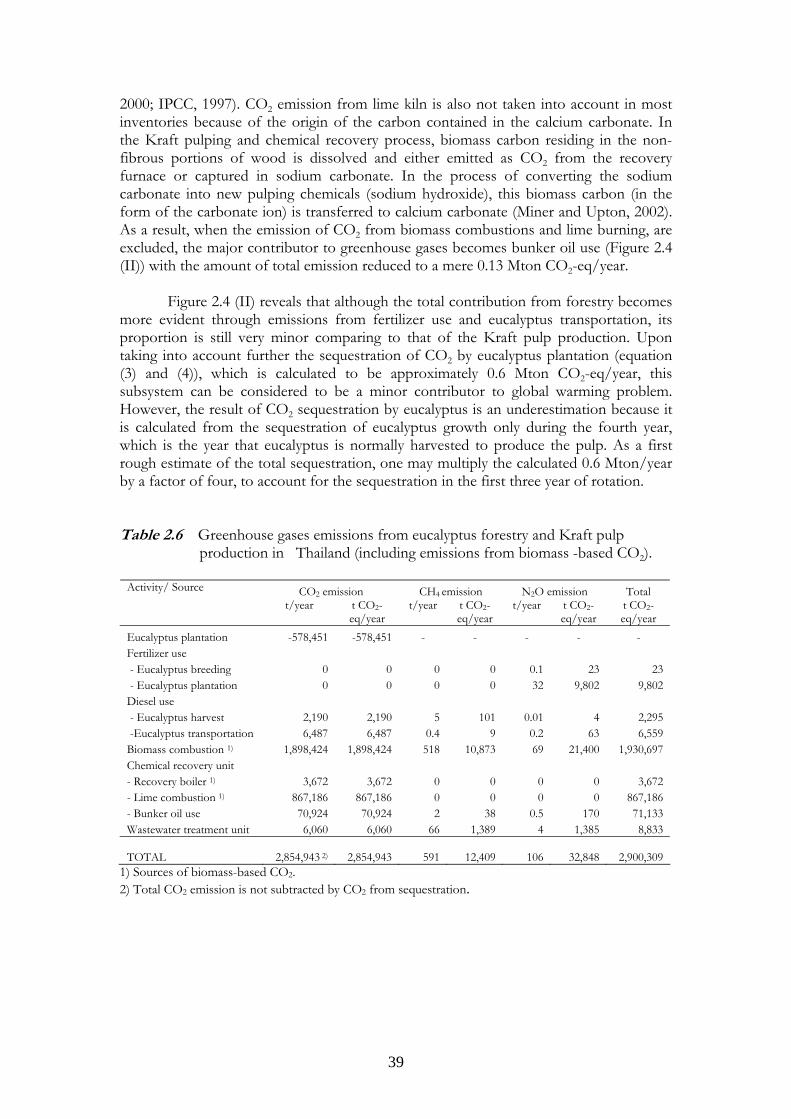
39
2000; IPCC, 1997). CO2 emission from lime kiln is also not taken into account in most inventories because of the origin of the carbon contained in the calcium carbonate. In the Kraft pulping and chemical recovery process, biomass carbon residing in the non-fibrous portions of wood is dissolved and either emitted as CO2 from the recovery furnace or captured in sodium carbonate. In the process of converting the sodium carbonate into new pulping chemicals (sodium hydroxide), this biomass carbon (in the form of the carbonate ion) is transferred to calcium carbonate (Miner and Upton, 2002). As a result, when the emission of CO2 from biomass combustions and lime burning, are excluded, the major contributor to greenhouse gases becomes bunker oil use (Figure 2.4 (II)) with the amount of total emission reduced to a mere 0.13 Mton CO2-eq/year. Figure 2.4 (II) reveals that although the total contribution from forestry becomes more evident through emissions from fertilizer use and eucalyptus transportation, its proportion is still very minor comparing to that of the Kraft pulp production. Upon taking into account further the sequestration of CO2 by eucalyptus plantation (equation (3) and (4)), which is calculated to be approximately 0.6 Mton CO2-eq/year, this subsystem can be considered to be a minor contributor to global warming problem. However, the result of CO2 sequestration by eucalyptus is an underestimation because it is calculated from the sequestration of eucalyptus growth only during the fourth year, which is the year that eucalyptus is normally harvested to produce the pulp. As a first rough estimate of the total sequestration, one may multiply the calculated 0.6 Mton/year by a factor of four, to account for the sequestration in the first three year of rotation. Table 2.6 Greenhouse gases emissions from eucalyptus forestry and Kraft pulp
production in Thailand (including emissions from biomass -based CO2).
CO2 emission CH4 emission N2O emission Total Activity/ Source t/year t CO2-
eq/year t/year t CO2-
eq/year t/year t CO2-
eq/year t CO2-eq/year
Eucalyptus plantation -578,451 -578,451 - - - - - Fertilizer use - Eucalyptus breeding 0 0 0 0 0.1 23 23 - Eucalyptus plantation 0 0 0 0 32 9,802 9,802Diesel use - Eucalyptus harvest 2,190 2,190 5 101 0.01 4 2,295 -Eucalyptus transportation 6,487 6,487 0.4 9 0.2 63 6,559Biomass combustion 1) 1,898,424 1,898,424 518 10,873 69 21,400 1,930,697Chemical recovery unit - Recovery boiler 1) 3,672 3,672 0 0 0 0 3,672- Lime combustion 1) 867,186 867,186 0 0 0 0 867,186- Bunker oil use 70,924 70,924 2 38 0.5 170 71,133Wastewater treatment unit 6,060 6,060 66 1,389 4 1,385 8,833
TOTAL 2,854,943 2)
2,854,943 591 12,409
106 32,848 2,900,3091) Sources of biomass-based CO2. 2) Total CO2 emission is not subtracted by CO2 from sequestration.
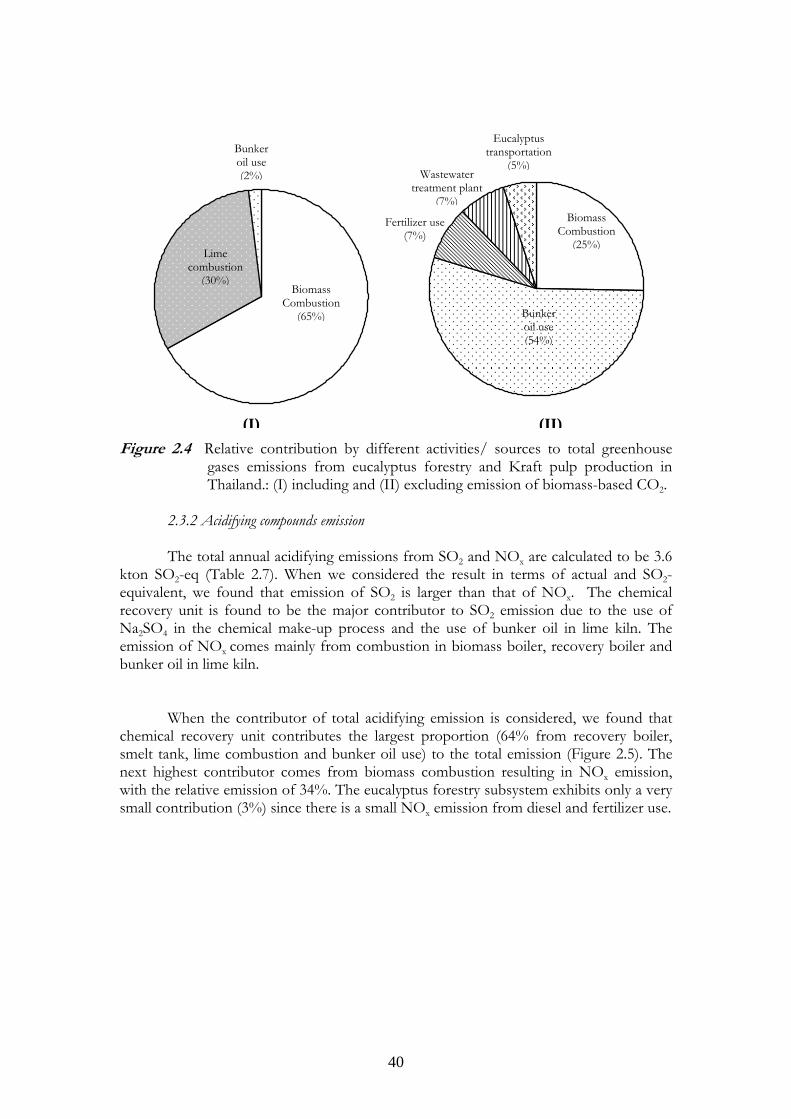
40
Figure 2.4 Relative contribution by different activities/ sources to total greenhouse
gases emissions from eucalyptus forestry and Kraft pulp production in Thailand.: (I) including and (II) excluding emission of biomass-based CO2.
2.3.2 Acidifying compounds emission
The total annual acidifying emissions from SO2 and NOx are calculated to be 3.6
kton SO2-eq (Table 2.7). When we considered the result in terms of actual and SO2-equivalent, we found that emission of SO2 is larger than that of NOx. The chemical recovery unit is found to be the major contributor to SO2 emission due to the use of Na2SO4 in the chemical make-up process and the use of bunker oil in lime kiln. The emission of NOx comes mainly from combustion in biomass boiler, recovery boiler and bunker oil in lime kiln.
When the contributor of total acidifying emission is considered, we found that
chemical recovery unit contributes the largest proportion (64% from recovery boiler, smelt tank, lime combustion and bunker oil use) to the total emission (Figure 2.5). The next highest contributor comes from biomass combustion resulting in NOx emission, with the relative emission of 34%. The eucalyptus forestry subsystem exhibits only a very small contribution (3%) since there is a small NOx emission from diesel and fertilizer use.
Biomass Combustion
(65%)
Bunker oil use (2%)
Lime combustion
(30%)
Bunker oil use (54%)
Biomass Combustion
(25%)
Eucalyptus transportation
(5%)
Fertilizer use (7%)
Wastewater treatment plant
(7%)
(I) (II)
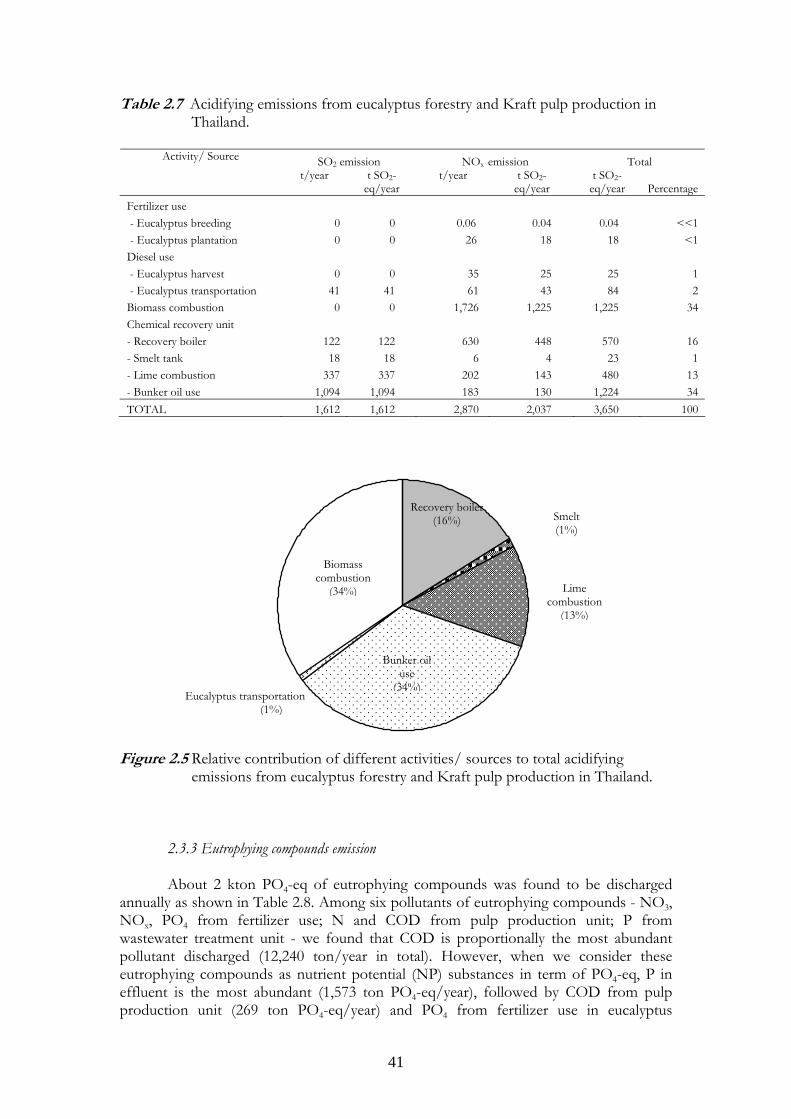
41
Table 2.7 Acidifying emissions from eucalyptus forestry and Kraft pulp production in Thailand.
SO2 emission NOx emission Total Activity/ Source
t/year t SO2-eq/year
t/year t SO2- eq/year
t SO2- eq/year
Percentage
Fertilizer use - Eucalyptus breeding 0 0 0.06 0.04 0.04 <<1 - Eucalyptus plantation 0 0 26 18 18 <1Diesel use - Eucalyptus harvest 0 0 35 25 25 1 - Eucalyptus transportation 41 41 61 43 84 2Biomass combustion 0 0 1,726 1,225 1,225 34Chemical recovery unit - Recovery boiler 122 122 630 448 570 16- Smelt tank 18 18 6 4 23 1- Lime combustion 337 337 202 143 480 13- Bunker oil use 1,094 1,094 183 130 1,224 34TOTAL 1,612 1,612 2,870 2,037 3,650 100
Figure 2.5 Relative contribution of different activities/ sources to total acidifying
emissions from eucalyptus forestry and Kraft pulp production in Thailand. 2.3.3 Eutrophying compounds emission
About 2 kton PO4-eq of eutrophying compounds was found to be discharged annually as shown in Table 2.8. Among six pollutants of eutrophying compounds - NO3, NOx, PO4 from fertilizer use; N and COD from pulp production unit; P from wastewater treatment unit - we found that COD is proportionally the most abundant pollutant discharged (12,240 ton/year in total). However, when we consider these eutrophying compounds as nutrient potential (NP) substances in term of PO4-eq, P in effluent is the most abundant (1,573 ton PO4-eq/year), followed by COD from pulp production unit (269 ton PO4-eq/year) and PO4 from fertilizer use in eucalyptus
Lime combustion
(13%)
Biomass combustion
(34%)
Bunker oil use
(34%)Eucalyptus transportation
(1%)
Recovery boiler (16%) Smelt
(1%)
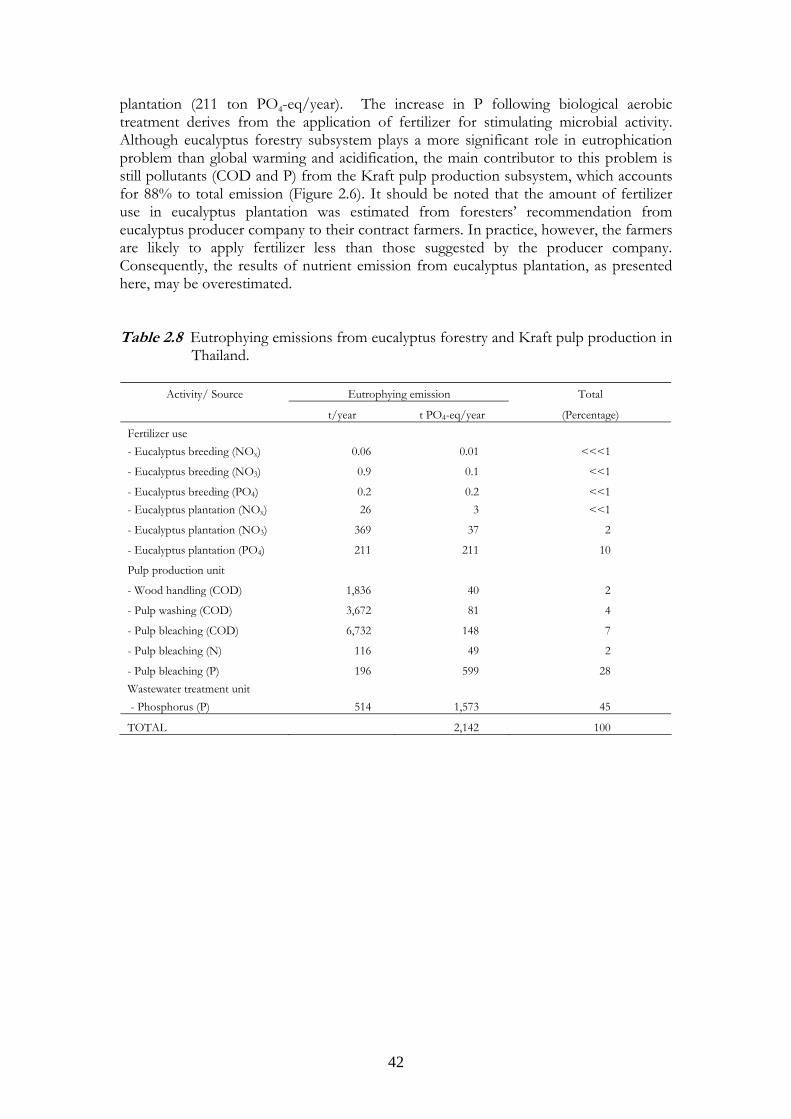
42
plantation (211 ton PO4-eq/year). The increase in P following biological aerobic treatment derives from the application of fertilizer for stimulating microbial activity. Although eucalyptus forestry subsystem plays a more significant role in eutrophication problem than global warming and acidification, the main contributor to this problem is still pollutants (COD and P) from the Kraft pulp production subsystem, which accounts for 88% to total emission (Figure 2.6). It should be noted that the amount of fertilizer use in eucalyptus plantation was estimated from foresters’ recommendation from eucalyptus producer company to their contract farmers. In practice, however, the farmers are likely to apply fertilizer less than those suggested by the producer company. Consequently, the results of nutrient emission from eucalyptus plantation, as presented here, may be overestimated.
Table 2.8 Eutrophying emissions from eucalyptus forestry and Kraft pulp production in
Thailand.
Activity/ Source Eutrophying emission Total
t/year t PO4-eq/year (Percentage) Fertilizer use - Eucalyptus breeding (NOx) 0.06 0.01 <<<1
- Eucalyptus breeding (NO3) 0.9 0.1 <<1
- Eucalyptus breeding (PO4) 0.2 0.2 <<1 - Eucalyptus plantation (NOx) 26 3 <<1
- Eucalyptus plantation (NO3) 369 37 2
- Eucalyptus plantation (PO4) 211 211 10
Pulp production unit
- Wood handling (COD) 1,836 40 2
- Pulp washing (COD) 3,672 81 4
- Pulp bleaching (COD) 6,732 148 7
- Pulp bleaching (N) 116 49 2
- Pulp bleaching (P) 196 599 28 Wastewater treatment unit - Phosphorus (P) 514 1,573 45
TOTAL 2,142 100
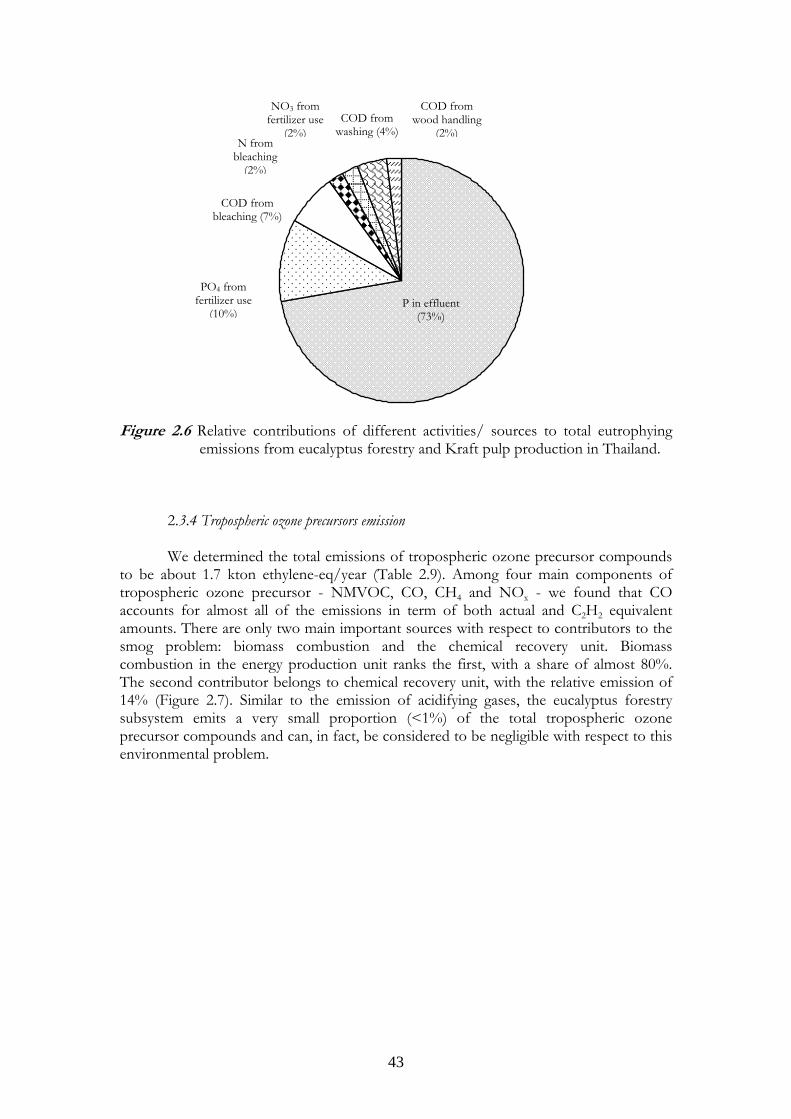
43
Figure 2.6 Relative contributions of different activities/ sources to total eutrophying
emissions from eucalyptus forestry and Kraft pulp production in Thailand. 2.3.4 Tropospheric ozone precursors emission
We determined the total emissions of tropospheric ozone precursor compounds to be about 1.7 kton ethylene-eq/year (Table 2.9). Among four main components of tropospheric ozone precursor - NMVOC, CO, CH4 and NOx - we found that CO accounts for almost all of the emissions in term of both actual and C2H2 equivalent amounts. There are only two main important sources with respect to contributors to the smog problem: biomass combustion and the chemical recovery unit. Biomass combustion in the energy production unit ranks the first, with a share of almost 80%. The second contributor belongs to chemical recovery unit, with the relative emission of 14% (Figure 2.7). Similar to the emission of acidifying gases, the eucalyptus forestry subsystem emits a very small proportion (<1%) of the total tropospheric ozone precursor compounds and can, in fact, be considered to be negligible with respect to this environmental problem.
P in effluent (73%)
PO4 from fertilizer use
(10%)
COD from bleaching (7%)
NO3 from fertilizer use
(2%) N from
bleaching (2%)
COD from washing (4%)
COD from wood handling
(2%)
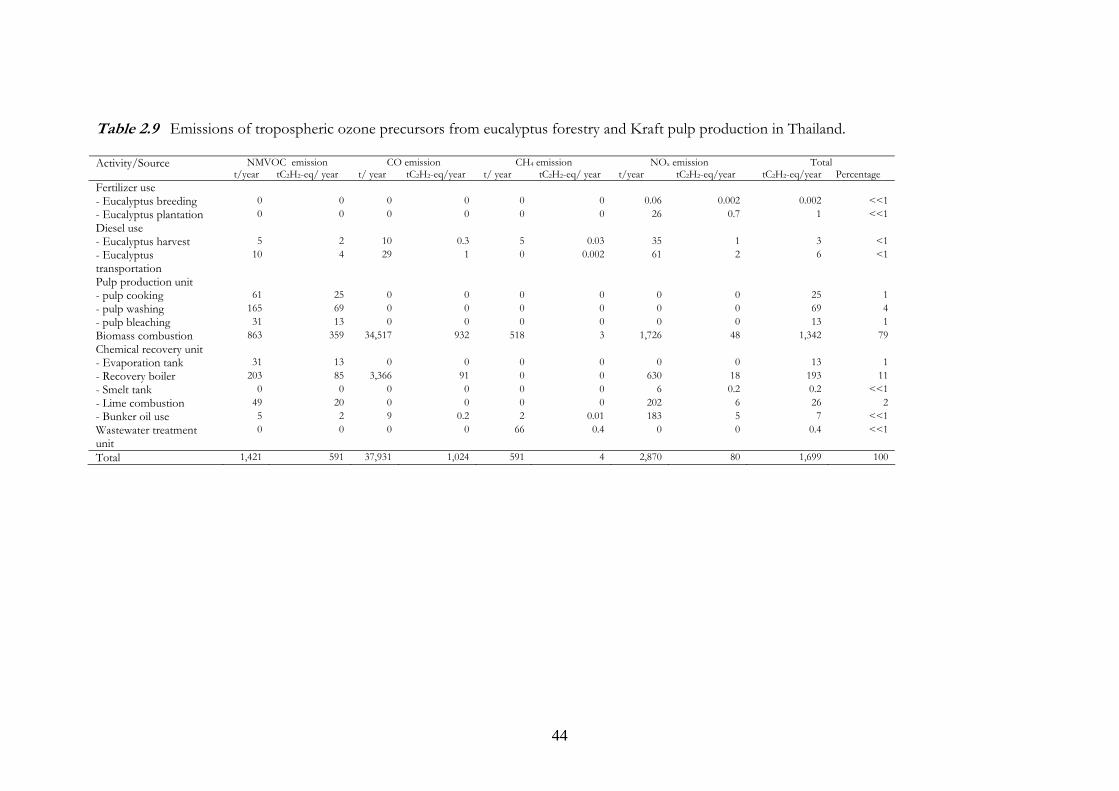
44
Table 2.9 Emissions of tropospheric ozone precursors from eucalyptus forestry and Kraft pulp production in Thailand.
NMVOC emission CO emission CH4 emission NOx emission Total Activity/Source t/year tC2H2-eq/ year t/ year tC2H2-eq/year t/ year tC2H2-eq/ year t/year tC2H2-eq/year tC2H2-eq/year Percentage
Fertilizer use - Eucalyptus breeding 0 0 0 0 0 0 0.06 0.002 0.002 <<1 - Eucalyptus plantation 0 0 0 0 0 0 26 0.7 1 <<1 Diesel use - Eucalyptus harvest 5 2 10 0.3 5 0.03 35 1 3 <1 - Eucalyptus transportation
10 4 29 1 0 0.002 61 2 6 <1
Pulp production unit - pulp cooking 61 25 0 0 0 0 0 0 25 1 - pulp washing 165 69 0 0 0 0 0 0 69 4 - pulp bleaching 31 13 0 0 0 0 0 0 13 1 Biomass combustion 863 359 34,517 932 518 3 1,726 48 1,342 79Chemical recovery unit - Evaporation tank 31 13 0 0 0 0 0 0 13 1 - Recovery boiler 203 85 3,366 91 0 0 630 18 193 11- Smelt tank 0 0 0 0 0 0 6 0.2 0.2 <<1 - Lime combustion 49 20 0 0 0 0 202 6 26 2 - Bunker oil use 5 2 9 0.2 2 0.01 183 5 7 <<1 Wastewater treatment unit
0 0 0 0 66 0.4 0 0 0.4 <<1
Total 1,421 591 37,931 1,024 591 4 2,870 80 1,699 100
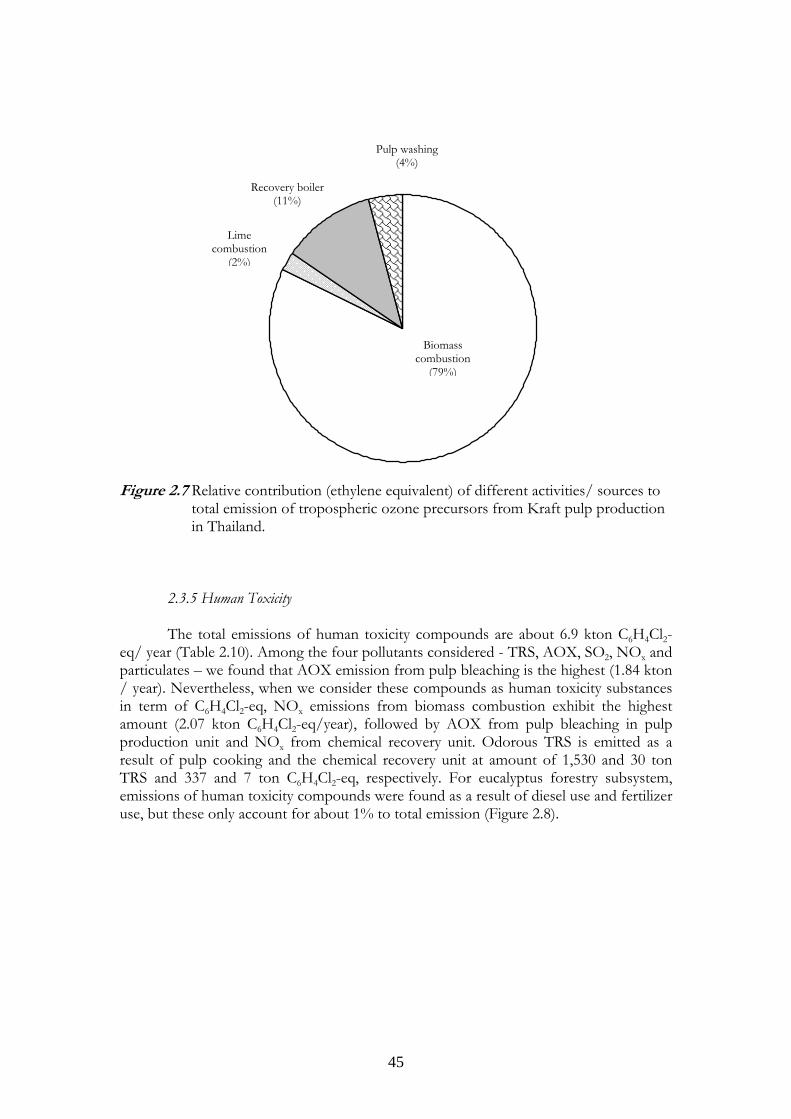
45
Figure 2.7 Relative contribution (ethylene equivalent) of different activities/ sources to
total emission of tropospheric ozone precursors from Kraft pulp production in Thailand.
2.3.5 Human Toxicity The total emissions of human toxicity compounds are about 6.9 kton C6H4Cl2-eq/ year (Table 2.10). Among the four pollutants considered - TRS, AOX, SO2, NOx and particulates – we found that AOX emission from pulp bleaching is the highest (1.84 kton / year). Nevertheless, when we consider these compounds as human toxicity substances in term of C6H4Cl2-eq, NOx emissions from biomass combustion exhibit the highest amount (2.07 kton C6H4Cl2-eq/year), followed by AOX from pulp bleaching in pulp production unit and NOx from chemical recovery unit. Odorous TRS is emitted as a result of pulp cooking and the chemical recovery unit at amount of 1,530 and 30 ton TRS and 337 and 7 ton C6H4Cl2-eq, respectively. For eucalyptus forestry subsystem, emissions of human toxicity compounds were found as a result of diesel use and fertilizer use, but these only account for about 1% to total emission (Figure 2.8).
Biomass combustion
(79%)
Recovery boiler (11%)
Lime combustion
(2%)
Pulp washing (4%)
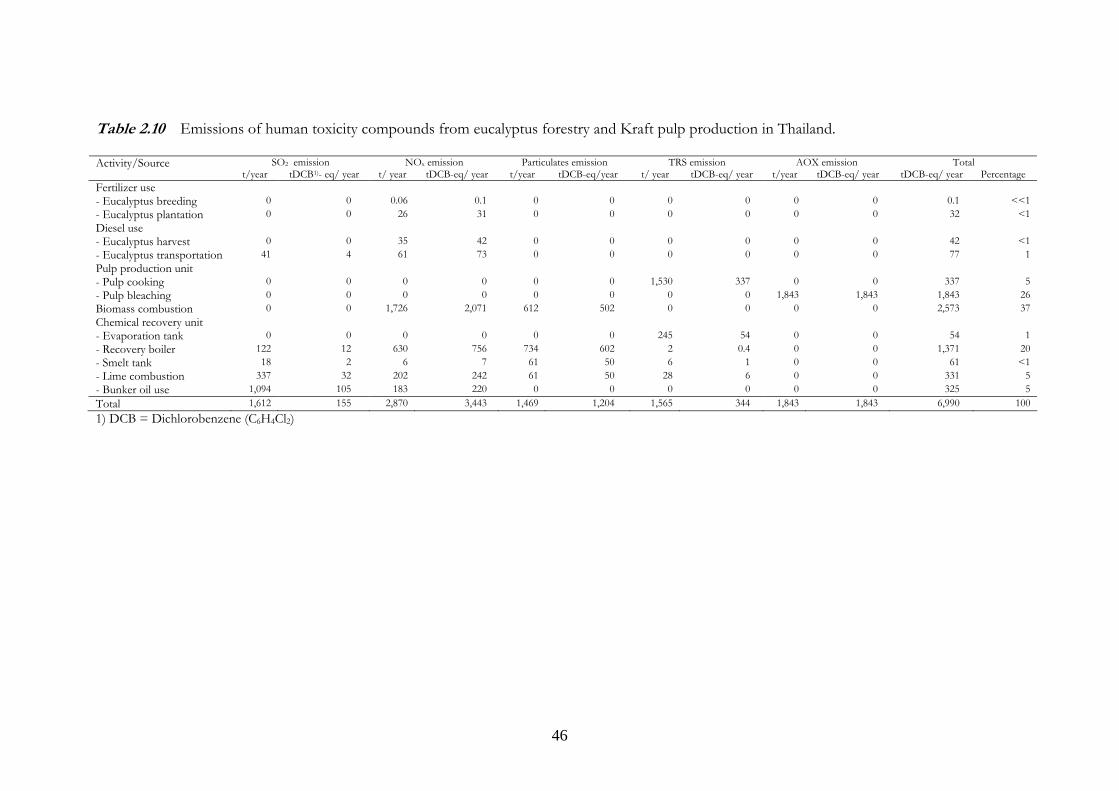
46
Table 2.10 Emissions of human toxicity compounds from eucalyptus forestry and Kraft pulp production in Thailand.
SO2 emission NOx emission Particulates emission TRS emission AOX emission Total Activity/Source t/year tDCB1)- eq/ year t/ year tDCB-eq/ year t/year tDCB-eq/year t/ year tDCB-eq/ year t/year tDCB-eq/ year tDCB-eq/ year Percentage
Fertilizer use - Eucalyptus breeding 0 0 0.06 0.1 0 0 0 0 0 0 0.1 <<1 - Eucalyptus plantation 0 0 26 31 0 0 0 0 0 0 32 <1 Diesel use - Eucalyptus harvest 0 0 35 42 0 0 0 0 0 0 42 <1 - Eucalyptus transportation 41 4 61 73 0 0 0 0 0 0 77 1 Pulp production unit - Pulp cooking 0 0 0 0 0 0 1,530 337 0 0 337 5 - Pulp bleaching 0 0 0 0 0 0 0 0 1,843 1,843 1,843 26 Biomass combustion 0 0 1,726 2,071 612 502 0 0 0 0 2,573 37 Chemical recovery unit - Evaporation tank 0 0 0 0 0 0 245 54 0 0 54 1 - Recovery boiler 122 12 630 756 734 602 2 0.4 0 0 1,371 20 - Smelt tank 18 2 6 7 61 50 6 1 0 0 61 <1 - Lime combustion 337 32 202 242 61 50 28 6 0 0 331 5 - Bunker oil use 1,094 105 183 220 0 0 0 0 0 0 325 5 Total 1,612 155 2,870 3,443 1,469 1,204 1,565 344 1,843 1,843 6,990 100 1) DCB = Dichlorobenzene (C6H4Cl2)
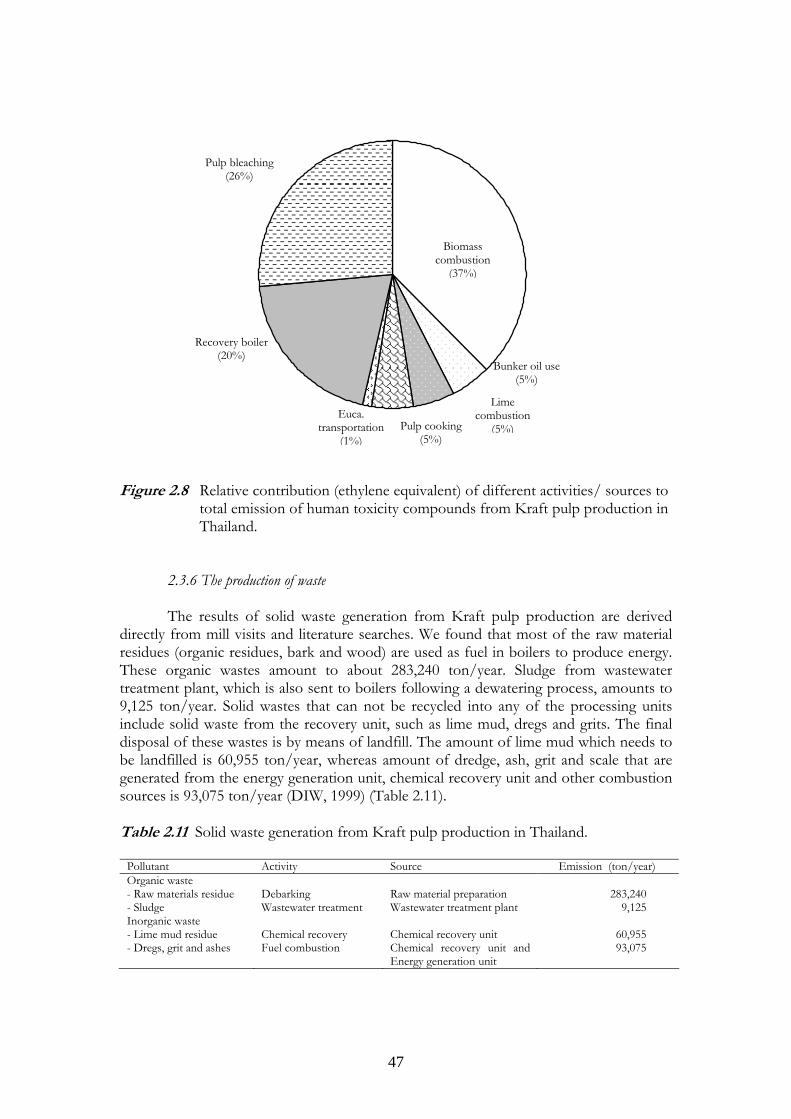
47
Figure 2.8 Relative contribution (ethylene equivalent) of different activities/ sources to
total emission of human toxicity compounds from Kraft pulp production in Thailand.
2.3.6 The production of waste
The results of solid waste generation from Kraft pulp production are derived directly from mill visits and literature searches. We found that most of the raw material residues (organic residues, bark and wood) are used as fuel in boilers to produce energy. These organic wastes amount to about 283,240 ton/year. Sludge from wastewater treatment plant, which is also sent to boilers following a dewatering process, amounts to 9,125 ton/year. Solid wastes that can not be recycled into any of the processing units include solid waste from the recovery unit, such as lime mud, dregs and grits. The final disposal of these wastes is by means of landfill. The amount of lime mud which needs to be landfilled is 60,955 ton/year, whereas amount of dredge, ash, grit and scale that are generated from the energy generation unit, chemical recovery unit and other combustion sources is 93,075 ton/year (DIW, 1999) (Table 2.11). Table 2.11 Solid waste generation from Kraft pulp production in Thailand.
Pollutant Activity Source Emission (ton/year) Organic waste - Raw materials residue - Sludge
Debarking Wastewater treatment
Raw material preparation Wastewater treatment plant
283,240
9,125 Inorganic waste - Lime mud residue - Dregs, grit and ashes
Chemical recovery Fuel combustion
Chemical recovery unit Chemical recovery unit and Energy generation unit
60,955 93,075
Biomass combustion
(37%)
Bunker oil use (5%)
Lime combustion
(5%)Pulp cooking (5%)
Euca. transportation
(1%)
Recovery boiler (20%)
Pulp bleaching (26%)
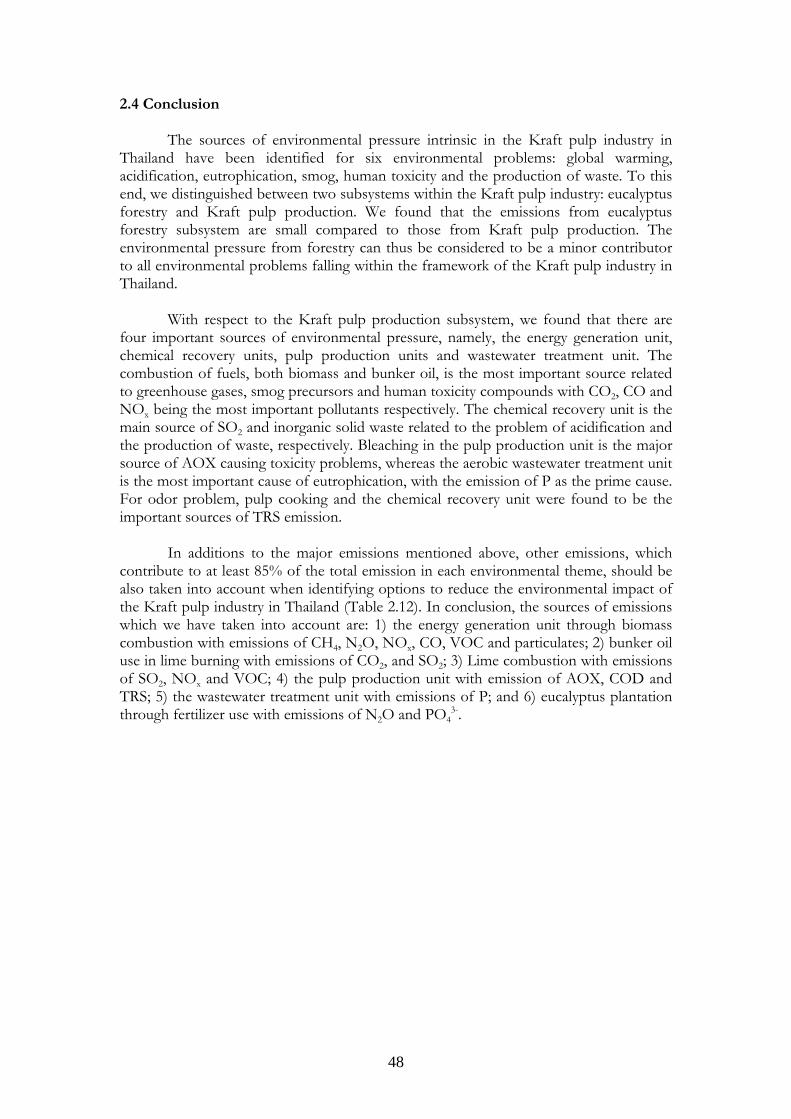
48
2.4 Conclusion
The sources of environmental pressure intrinsic in the Kraft pulp industry in Thailand have been identified for six environmental problems: global warming, acidification, eutrophication, smog, human toxicity and the production of waste. To this end, we distinguished between two subsystems within the Kraft pulp industry: eucalyptus forestry and Kraft pulp production. We found that the emissions from eucalyptus forestry subsystem are small compared to those from Kraft pulp production. The environmental pressure from forestry can thus be considered to be a minor contributor to all environmental problems falling within the framework of the Kraft pulp industry in Thailand.
With respect to the Kraft pulp production subsystem, we found that there are
four important sources of environmental pressure, namely, the energy generation unit, chemical recovery units, pulp production units and wastewater treatment unit. The combustion of fuels, both biomass and bunker oil, is the most important source related to greenhouse gases, smog precursors and human toxicity compounds with CO2, CO and NOx being the most important pollutants respectively. The chemical recovery unit is the main source of SO2 and inorganic solid waste related to the problem of acidification and the production of waste, respectively. Bleaching in the pulp production unit is the major source of AOX causing toxicity problems, whereas the aerobic wastewater treatment unit is the most important cause of eutrophication, with the emission of P as the prime cause. For odor problem, pulp cooking and the chemical recovery unit were found to be the important sources of TRS emission.
In additions to the major emissions mentioned above, other emissions, which
contribute to at least 85% of the total emission in each environmental theme, should be also taken into account when identifying options to reduce the environmental impact of the Kraft pulp industry in Thailand (Table 2.12). In conclusion, the sources of emissions which we have taken into account are: 1) the energy generation unit through biomass combustion with emissions of CH4, N2O, NOx, CO, VOC and particulates; 2) bunker oil use in lime burning with emissions of CO2, and SO2; 3) Lime combustion with emissions of SO2, NOx and VOC; 4) the pulp production unit with emission of AOX, COD and TRS; 5) the wastewater treatment unit with emissions of P; and 6) eucalyptus plantation through fertilizer use with emissions of N2O and PO4
3-.
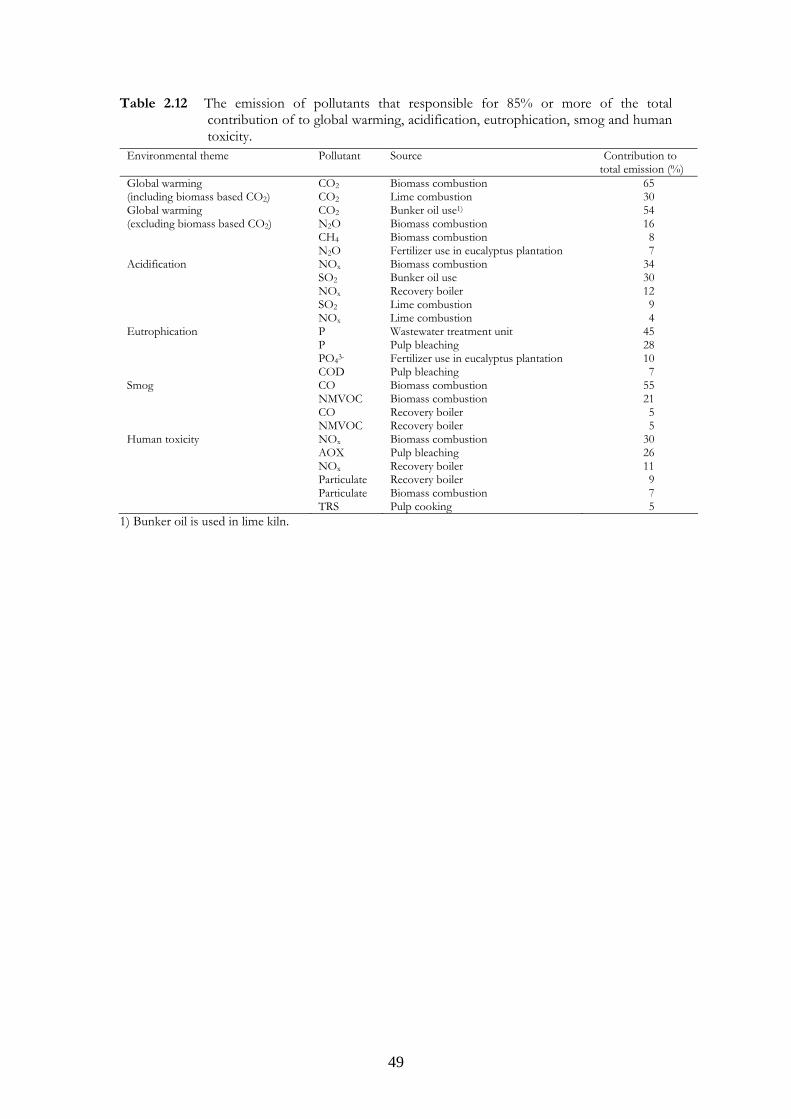
49
Table 2.12 The emission of pollutants that responsible for 85% or more of the total contribution of to global warming, acidification, eutrophication, smog and human toxicity.
Environmental theme Pollutant Source Contribution to total emission (%)
Global warming (including biomass based CO2)
CO2 CO2
Biomass combustion Lime combustion
65 30
Global warming (excluding biomass based CO2)
CO2 N2O CH4 N2O
Bunker oil use1)
Biomass combustion Biomass combustion Fertilizer use in eucalyptus plantation
54 16 8 7
Acidification NOx SO2 NOx SO2 NOx
Biomass combustion Bunker oil use Recovery boiler Lime combustion Lime combustion
34 30 12 9 4
Eutrophication P P PO43- COD
Wastewater treatment unit Pulp bleaching Fertilizer use in eucalyptus plantation Pulp bleaching
45 28 10 7
Smog CO NMVOC CO NMVOC
Biomass combustion Biomass combustion Recovery boiler Recovery boiler
55 21 5 5
Human toxicity NOx AOX NOx Particulate Particulate TRS
Biomass combustion Pulp bleaching Recovery boiler Recovery boiler Biomass combustion Pulp cooking
30 26 11 9 7 5
1) Bunker oil is used in lime kiln.
50
References Bordado J C M, Gomes J F P. 2003. Emission and odor control in Kraft pulp mills. Journal of Cleaner Production 11 (7): 797-801. Checkland P B. 1979. Techniques in soft systems practice-building conceptual models. Journal of Applied Systems Analysis 6: 41-49. CML. 2002. Impact assessment spreadsheet version 2.6. Center of Environmental Science, Lieden University, The Netherlands. CORINAIR. 2000. Atmospheric emission inventory guidebook, second edition. The Core Inventory of Air Emission in Europe, European Environment Agency, Copenhagen, Denmark. De Feyter S. 1995. Handling of the carbon balance of forest in LCA. In Fruhwald A. and Solberg B. (eds.), Life Cycle Analysis-a challenge for forestry and forest industry, Proceedings of the International Workshop. The European Forest Institute and the Federal Reseach Center for Forestry and Forest products, Hamburg, Germany. DIW. 1999. Technical guideline for environmental management for pulp and paper in Thailand. Department of Industrial Work, Bureau of Environmental Technology, Ministry of Industry, Bangkok, Thailand. EC. 2001. Integrated Pollution Prevention and Control (IPPC): Reference document of the Best Available Techniques in the Pulp and Paper industry, European commission, Luxembourg. ERIC and TPPIA. 2002. Application of the production performance indicators in accordance with Global Reporting Initiative (GRI) to Thai pulp and paper industries. Thai Pulp and Paper Industries Association, Bangkok, Thailand. (Thai edition) EPA. 1993. Handbook on Pollution Prevention Opportunities for Bleached Kraft Pulp and Paper Mills. United States Environmental Protection Agency, Washington DC, USA. EPA. 2000. Inventory of U.S. greenhouse gas emissions and sinks: 1990-1998. Report No. EPA 236-R-00-001. United States Environmental Protection Agency, Washington DC, United States. Goedkoop M. 2000. The Eco-indicator 99, final report. Pre-consultants, Amersfoort Hoamuangkaew W, Prasomsit P, Suntornhow P. 1999. Inventory of Private Eucalyptus Plantation in Thailand in 1997. Kasetsart University, Bangkok, Thailand. (Thai edition) Heijungs R, Guine J B, Huppes G,. Lankreijer R M, Udo de Haes H A, Wegener Sleeswijk A, Ansems A M M, Eggels P G, van Duin R, de Goede H P. 1992. Environmental Life cycle assessment of products. Guidelines and backgrounds. Center of Environmental Science (CML) (NOH report 9266 and 9267), Leiden.
51
Houghton J T. 1994. Radiative forcing of climate change and an evaluation of the IPCC emission scenarios. Intergovernmental Panel on Climate Change (IPCC). Cambridge University Press, Cambridge, United Kingdom. IPCC. 1997. Greenhouse Gas Inventory Reference Manual, IPCC Guidelines for National Greenhouse Gas Inventories Volume 3. Intergovernmental Panel on Climate Change. Bracknell. Maclaren J P. 1996. Plantation forestry: its role as a carbon sink. In Brown W J, Dearman G I, Manning M R (eds), Greenhouse: Coping with climate change. CSIRO Publishing, Australia, 417-436. Miner R, Upton B. 2002. Methods for estimating greenhouse gas emissions from lime kilns at kraft pulp mills. Energy 27(8): 729-738. Ongmongkolkul A, Nielsen P. 2001. Life cycle Assessment of Paperboard packaging produced in Thailand. School of Environment, Resource and Development, Asian Institute of Technology (AIT). Thailand. PCD. 1996. Database of Air and Noise Pollution Sources in Thailand year 1994: A final report, Pollution Control Department, Ministry of Science, Technology and Environment, Thailand. (Thai edition) Pluimers J C. 2001. An environmental systems analysis of greenhouse horticulture in the Netherlands: the tomato case. PhD. Thesis, Wageningen University, Wageningen, The Netherlands. Poethai M. 1997. Handbook of Eucalyptus plantation, fourth edition, M.P. Reforestation Group, Bangkok, Thailand. (Thai edition) Poyry J. 1992. Technical and Economical Evaluation of Water Pollution Control in Pulp Mill. Jaakko Poyry Consulting, Helsinki, Finland. UNEP. 1996. Environmental management in the pulp and paper industry, United Nation Environment Programme: industry and environment. Stockholm, Sweden. Schwaiger H, Zimmer B. 1995. A comparsion of fuel consumption and greenhouse gas emissions from forest operations in Europe. In Solberg B. and Roihuvo L. (eds.), Environmental impacts of forestry and forest industry. Proceeding of the International Seminar organised by the Finnish-French Society of Science and Techonolgy and the European Forest Institute, Joensuu, Finland. TEI. 1997. Thailand’s National Greenhouse Gas Inventory 1990. Thailand Environment Institute, submitted to Office of Environmental Policy and Planning, Ministry of Science, Technology and Environment, Bangkok, Thailand. TEI. 1999. Industrial Environmental Performance Indicators. The third progress report, Thailand Environment Institute, submitted to Pollution Control Department, Ministry of Science, Technology and Environment, Bangkok, Thailand. (Thai edition)

52
Chapter 3
This chapter has been submitted to Journal of Cleaner Production.
This chapter was presented at the international conference Environmental Governance in Asia: Regional Perspectives on Institutional and Industrial Transformation: the 2nd Annual INREF-AGITS Conference at Asia Europe Institute, University of Malaya, Sarawak, Malaysia. November, 2004.
Warit Jawjit, Carolien Kroeze, Wit Soontaranun and Leen Hordijk

54
55
Chapter 3: Options to Reduce the Environmental Impact by the Eucalyptus-based Kraft Pulp Industry in Thailand: Model description
Abstract
Kraft pulp industry contributes to several environmental problems, including global warming, acidification, eutrophication, smog, toxicity and the production of solid waste. The objective of this study is to identify available options for reducing the environmental pressure of the Kraft pulp industry in Thailand, and their technical potentials and associated costs. We also describe a model that quantifies the environmental pressure. The model can be used to evaluate the effects of the options on the environmental pressure, and the associated costs. The model includes 14 groups of options to reduce emissions and the production of waste. 3.1 Introduction Kraft pulp industry is an important industry in Thailand, supplying pulp for both domestic and international markets. Along with its continual business expansion, environmentally friendly production is one of the challenges pulp manufacturers are facing now. This is a complicated issue and needs a delicate balance between environmental benefit and economical prospect. Systematic analyses of causes and effects may be needed to analyze the environmental impact of the Kraft pulp industry in Thailand and to explore possible alternatives. Checkland (1979) and Wilson (1984) described a methodology of systems analysis, in which six steps can be distinguished as shown in Figure 3.1. Here we follow their approach.
In an earlier study, we performed the first and second step of a system analysis to analyze the potential impact of the eucalyptus-based Kraft pulp industry in Thailand (Jawjit et al., 2006 (Chapter 2)). More specifically, we identified the most important sources of environmental pressure. The results indicate that important activities in the Kraft pulp industry leading to environmental problems include the use of fuels, water and chemicals in the production process. These activities result in emissions of environmental pollutants that contribute to global warming, acidification, eutrophication, smog, human toxicity and the production of solid waste. The activities and sources of pollutant concerned are summarized in Table 3.1.
In this article, the third step of the systems analysis methodology, a system
synthesis by model building is performed (Figure 3.1). The objective of this study is to identify which options are available for reducing the environmental pressure of the Kraft pulp industry in Thailand, and their technical reduction potential and associated costs. We also describe a model that quantifies the environmental pressure. The model can be used to evaluate the effects of the options on the environmental pressure, and the associated costs. In an accompanying paper (Jawjit et al., submitted (Chapter 4)), we present model results.
In the following, we first define the system to be analyzed by describing the
major activities and emissions that give rise to environmental problems. Next, we present the mathematical formulation of the model, and then review the options to reduce the environmental impact.
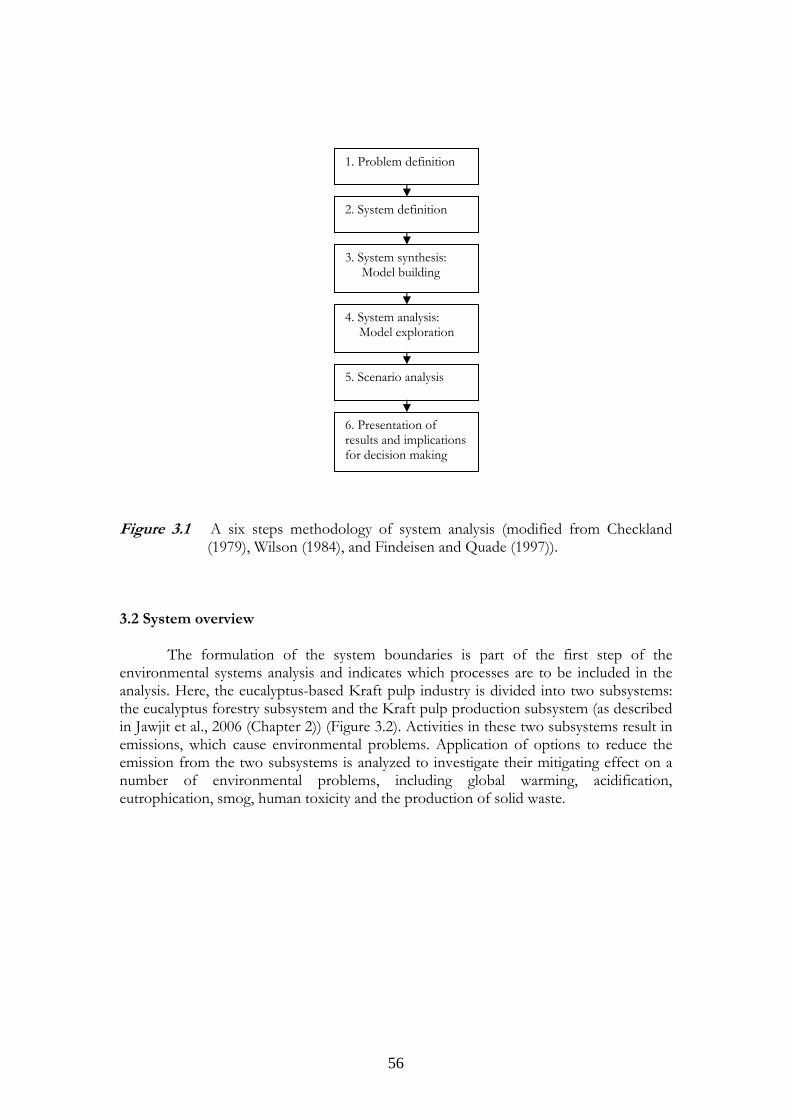
56
Figure 3.1 A six steps methodology of system analysis (modified from Checkland
(1979), Wilson (1984), and Findeisen and Quade (1997)). 3.2 System overview
The formulation of the system boundaries is part of the first step of the environmental systems analysis and indicates which processes are to be included in the analysis. Here, the eucalyptus-based Kraft pulp industry is divided into two subsystems: the eucalyptus forestry subsystem and the Kraft pulp production subsystem (as described in Jawjit et al., 2006 (Chapter 2)) (Figure 3.2). Activities in these two subsystems result in emissions, which cause environmental problems. Application of options to reduce the emission from the two subsystems is analyzed to investigate their mitigating effect on a number of environmental problems, including global warming, acidification, eutrophication, smog, human toxicity and the production of solid waste.
1. Problem definition
2. System definition
3. System synthesis: Model building
4. System analysis:Model exploration
5. Scenario analysis
6. Presentation of results and implications for decision making
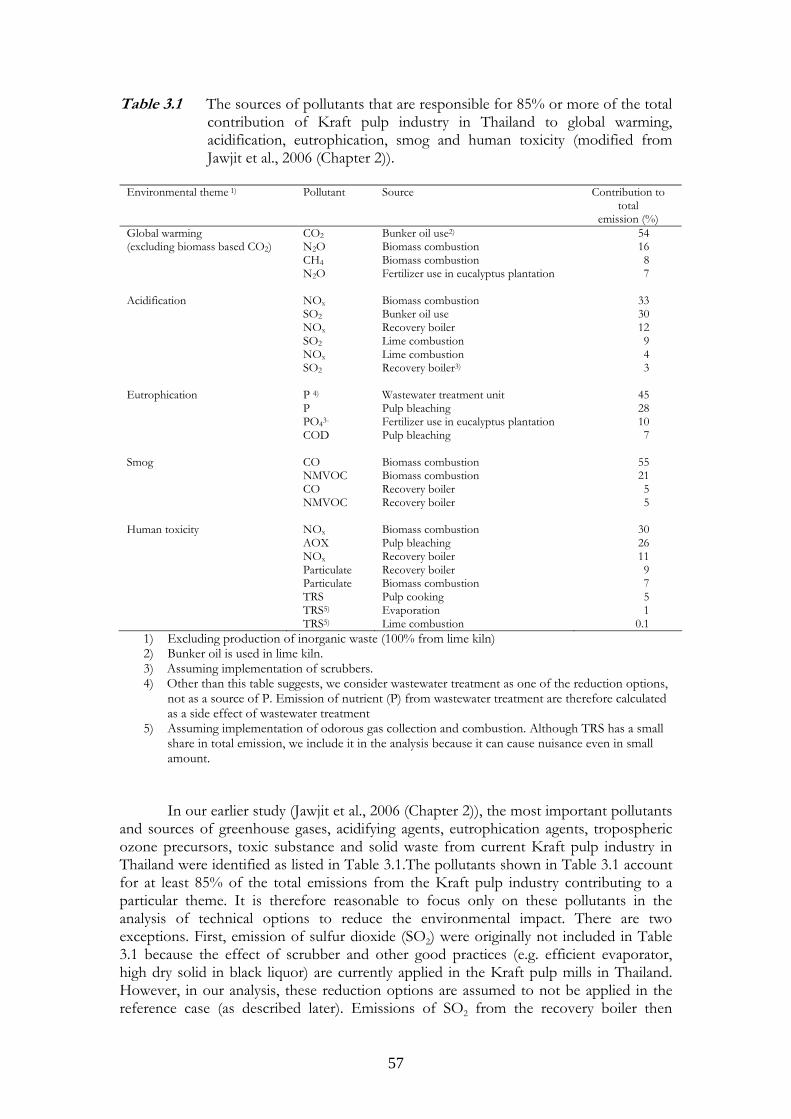
57
Table 3.1 The sources of pollutants that are responsible for 85% or more of the total contribution of Kraft pulp industry in Thailand to global warming, acidification, eutrophication, smog and human toxicity (modified from Jawjit et al., 2006 (Chapter 2)).
Environmental theme 1) Pollutant Source Contribution to
total emission (%)
Global warming (excluding biomass based CO2)
CO2 N2O CH4 N2O
Bunker oil use2)
Biomass combustion Biomass combustion Fertilizer use in eucalyptus plantation
54 16 8 7
Acidification NOx SO2 NOx SO2 NOx SO2
Biomass combustion Bunker oil use Recovery boiler Lime combustion Lime combustion Recovery boiler3)
33 30 12 9 4 3
Eutrophication P 4)
P PO43- COD
Wastewater treatment unit
Pulp bleaching Fertilizer use in eucalyptus plantation Pulp bleaching
45 28 10 7
Smog CO
NMVOC CO NMVOC
Biomass combustion Biomass combustion Recovery boiler Recovery boiler
55 21 5 5
Human toxicity NOx AOX NOx Particulate Particulate TRS TRS5)
TRS5)
Biomass combustion Pulp bleaching Recovery boiler Recovery boiler Biomass combustion Pulp cooking Evaporation Lime combustion
30 26 11 9 7 5 1
0.1 1) Excluding production of inorganic waste (100% from lime kiln) 2) Bunker oil is used in lime kiln. 3) Assuming implementation of scrubbers. 4) Other than this table suggests, we consider wastewater treatment as one of the reduction options,
not as a source of P. Emission of nutrient (P) from wastewater treatment are therefore calculated as a side effect of wastewater treatment
5) Assuming implementation of odorous gas collection and combustion. Although TRS has a small share in total emission, we include it in the analysis because it can cause nuisance even in small amount.
In our earlier study (Jawjit et al., 2006 (Chapter 2)), the most important pollutants
and sources of greenhouse gases, acidifying agents, eutrophication agents, tropospheric ozone precursors, toxic substance and solid waste from current Kraft pulp industry in Thailand were identified as listed in Table 3.1.The pollutants shown in Table 3.1 account for at least 85% of the total emissions from the Kraft pulp industry contributing to a particular theme. It is therefore reasonable to focus only on these pollutants in the analysis of technical options to reduce the environmental impact. There are two exceptions. First, emission of sulfur dioxide (SO2) were originally not included in Table 3.1 because the effect of scrubber and other good practices (e.g. efficient evaporator, high dry solid in black liquor) are currently applied in the Kraft pulp mills in Thailand. However, in our analysis, these reduction options are assumed to not be applied in the reference case (as described later). Emissions of SO2 from the recovery boiler then
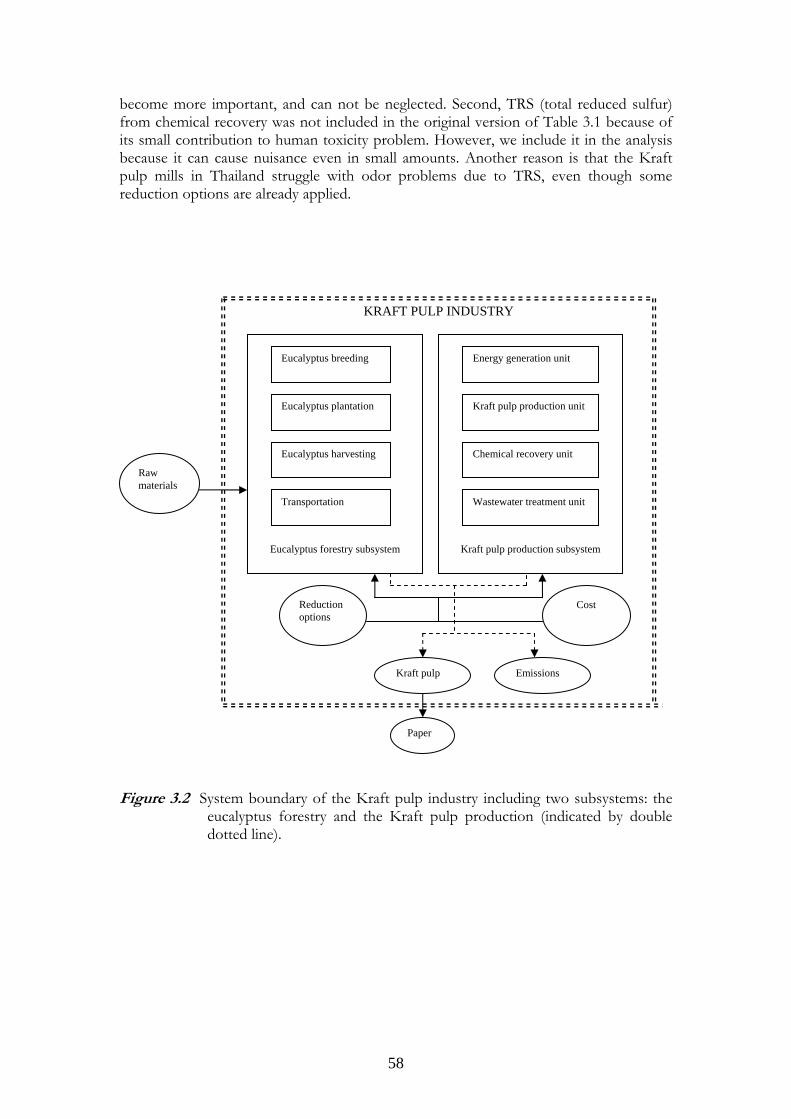
58
become more important, and can not be neglected. Second, TRS (total reduced sulfur) from chemical recovery was not included in the original version of Table 3.1 because of its small contribution to human toxicity problem. However, we include it in the analysis because it can cause nuisance even in small amounts. Another reason is that the Kraft pulp mills in Thailand struggle with odor problems due to TRS, even though some reduction options are already applied.
Figure 3.2 System boundary of the Kraft pulp industry including two subsystems: the
eucalyptus forestry and the Kraft pulp production (indicated by double dotted line).
Eucalyptus breeding
Eucalyptus plantation
Eucalyptus harvesting
Transportation
Eucalyptus forestry subsystem
Energy generation unit
Kraft pulp production unit
Chemical recovery unit
Wastewater treatment unit
Kraft pulp production subsystem
Reduction options
Emissions
KRAFT PULP INDUSTRY
Raw materials
Kraft pulp
Paper
Cost
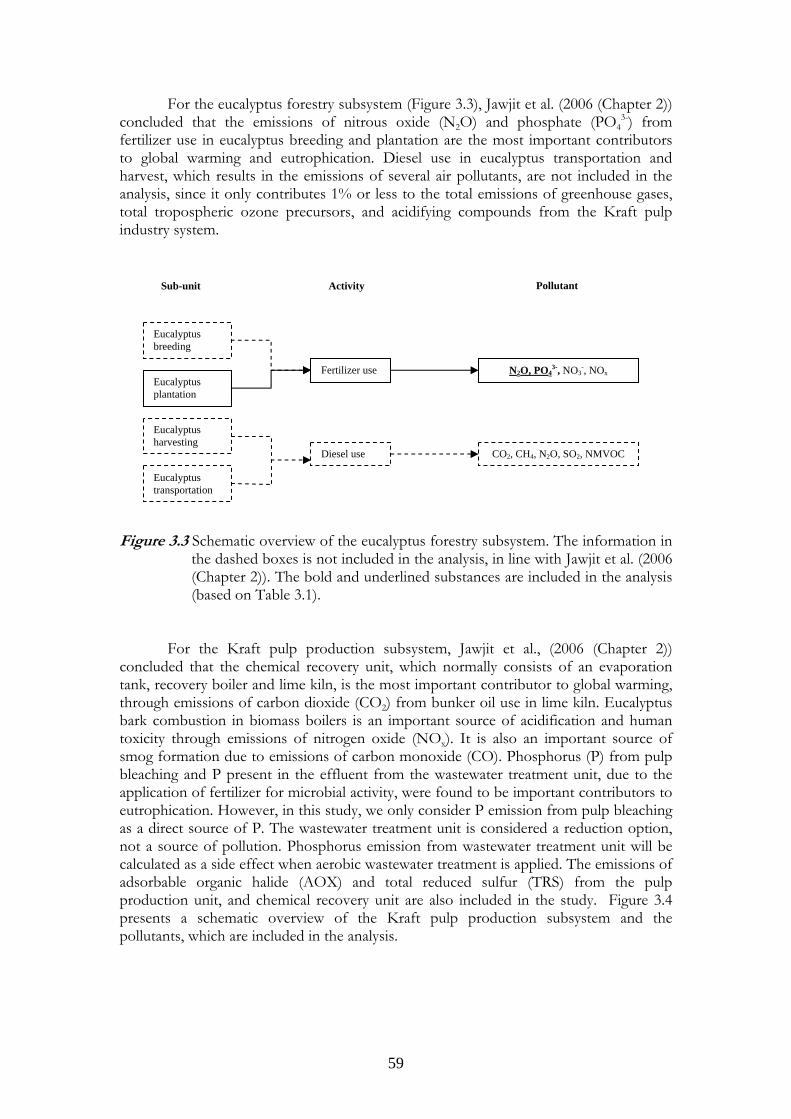
59
For the eucalyptus forestry subsystem (Figure 3.3), Jawjit et al. (2006 (Chapter 2)) concluded that the emissions of nitrous oxide (N2O) and phosphate (PO4
3-) from fertilizer use in eucalyptus breeding and plantation are the most important contributors to global warming and eutrophication. Diesel use in eucalyptus transportation and harvest, which results in the emissions of several air pollutants, are not included in the analysis, since it only contributes 1% or less to the total emissions of greenhouse gases, total tropospheric ozone precursors, and acidifying compounds from the Kraft pulp industry system.
Figure 3.3 Schematic overview of the eucalyptus forestry subsystem. The information in
the dashed boxes is not included in the analysis, in line with Jawjit et al. (2006 (Chapter 2)). The bold and underlined substances are included in the analysis (based on Table 3.1).
For the Kraft pulp production subsystem, Jawjit et al., (2006 (Chapter 2)) concluded that the chemical recovery unit, which normally consists of an evaporation tank, recovery boiler and lime kiln, is the most important contributor to global warming, through emissions of carbon dioxide (CO2) from bunker oil use in lime kiln. Eucalyptus bark combustion in biomass boilers is an important source of acidification and human toxicity through emissions of nitrogen oxide (NOx). It is also an important source of smog formation due to emissions of carbon monoxide (CO). Phosphorus (P) from pulp bleaching and P present in the effluent from the wastewater treatment unit, due to the application of fertilizer for microbial activity, were found to be important contributors to eutrophication. However, in this study, we only consider P emission from pulp bleaching as a direct source of P. The wastewater treatment unit is considered a reduction option, not a source of pollution. Phosphorus emission from wastewater treatment unit will be calculated as a side effect when aerobic wastewater treatment is applied. The emissions of adsorbable organic halide (AOX) and total reduced sulfur (TRS) from the pulp production unit, and chemical recovery unit are also included in the study. Figure 3.4 presents a schematic overview of the Kraft pulp production subsystem and the pollutants, which are included in the analysis.
Eucalyptus breeding
Sub-unit
Eucalyptus plantation
Eucalyptus harvesting
Eucalyptus transportation
Activity
Fertilizer use
Diesel use
Pollutant
N2O, PO43-, NO3
-, NOx
CO2, CH4, N2O, SO2, NMVOC
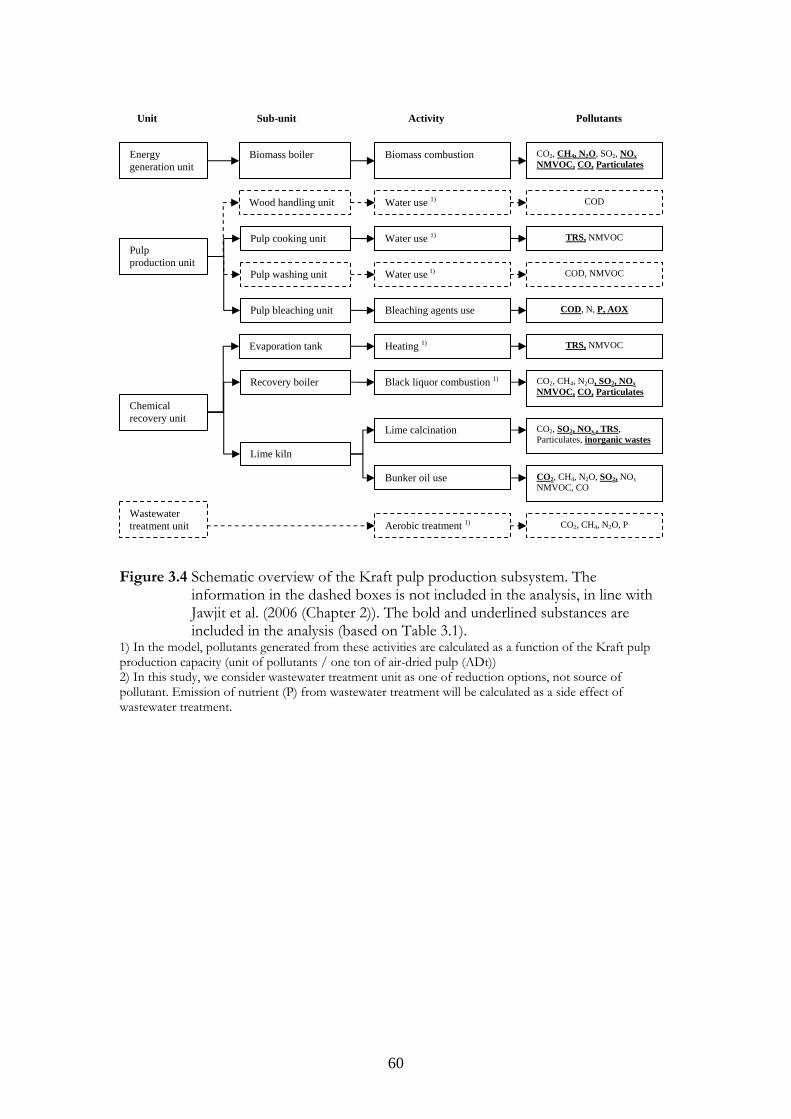
60
Figure 3.4 Schematic overview of the Kraft pulp production subsystem. The
information in the dashed boxes is not included in the analysis, in line with Jawjit et al. (2006 (Chapter 2)). The bold and underlined substances are included in the analysis (based on Table 3.1).
1) In the model, pollutants generated from these activities are calculated as a function of the Kraft pulp production capacity (unit of pollutants / one ton of air-dried pulp (ADt)) 2) In this study, we consider wastewater treatment unit as one of reduction options, not source of pollutant. Emission of nutrient (P) from wastewater treatment will be calculated as a side effect of wastewater treatment.
Biomass boiler
Sub-unit
Biomass combustion
Activity
Pulp cooking unit Water use 1)
Pulp washing unit Water use 1)
Pulp bleaching unit Bleaching agents use
Recovery boiler Black liquor combustion 1)
Lime kiln
Lime calcination
Bunker oil use
Wood handling unit Water use 1)
Evaporation tank Heating 1)
Unit
Energy generation unit
Pulp production unit
Chemical recovery unit
Wastewater treatment unit
Pollutants
CO2, CH4, N2O, SO2, NOx NMVOC, CO, Particulates
COD
TRS, NMVOC
COD, NMVOC
COD, N, P, AOX
TRS, NMVOC
CO2, CH4, N2O, SO2, NOx NMVOC, CO, Particulates
CO2, SO2, NOx,, TRS, Particulates, inorganic wastes
CO2, CH4, N2O, SO2, NOx NMVOC, CO
CO2, CH4, N2O, P Aerobic treatment 1)
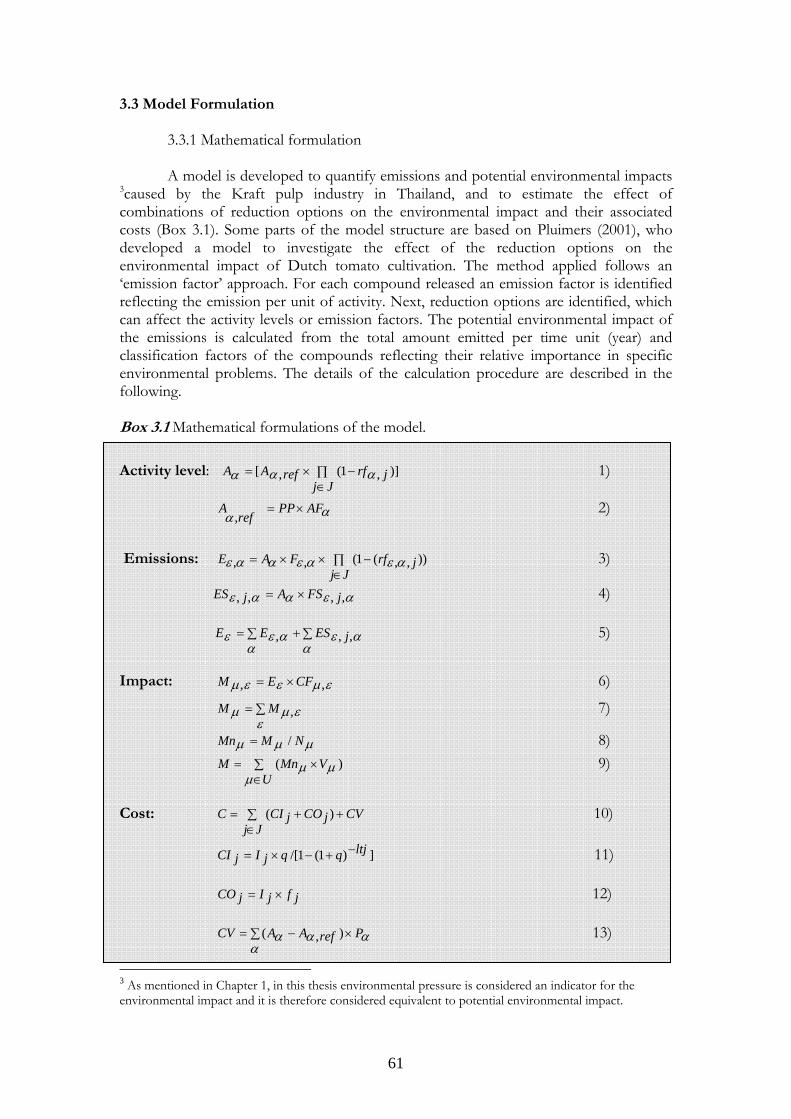
61
3.3 Model Formulation
3.3.1 Mathematical formulation A model is developed to quantify emissions and potential environmental impacts 3caused by the Kraft pulp industry in Thailand, and to estimate the effect of combinations of reduction options on the environmental impact and their associated costs (Box 3.1). Some parts of the model structure are based on Pluimers (2001), who developed a model to investigate the effect of the reduction options on the environmental impact of Dutch tomato cultivation. The method applied follows an ‘emission factor’ approach. For each compound released an emission factor is identified reflecting the emission per unit of activity. Next, reduction options are identified, which can affect the activity levels or emission factors. The potential environmental impact of the emissions is calculated from the total amount emitted per time unit (year) and classification factors of the compounds reflecting their relative importance in specific environmental problems. The details of the calculation procedure are described in the following. Box 3.1 Mathematical formulations of the model. Activity level: )],1(,[ ∏
∈−×=
JjjrfrefAA ααα 1)
ααAFPP
refA ×=
, 2)
Emissions: )),,(1(,, ∏
∈−××=
JjjrfFAE αεαεααε 3)
αεααε ,,,, jFSAjES ×= 4)
∑+∑=α
αεα
αεε ,,, jESEE 5)
Impact: εµεεµ ,, CFEM ×= 6) ∑=
εεµµ ,MM 7)
µµµ NMMn /= 8) )( µ
µµ V
UMnM ×∑
∈= 9)
Cost: CVjCO
JjjCIC ++∑
∈= )( 10)
])1(1/[ ltjqqjIjCI −+−×= 11)
jfjIjCO ×= 12)
ααα
α PrefAACV ×−∑= ),( 13)
3 As mentioned in Chapter 1, in this thesis environmental pressure is considered an indicator for the environmental impact and it is therefore considered equivalent to potential environmental impact.
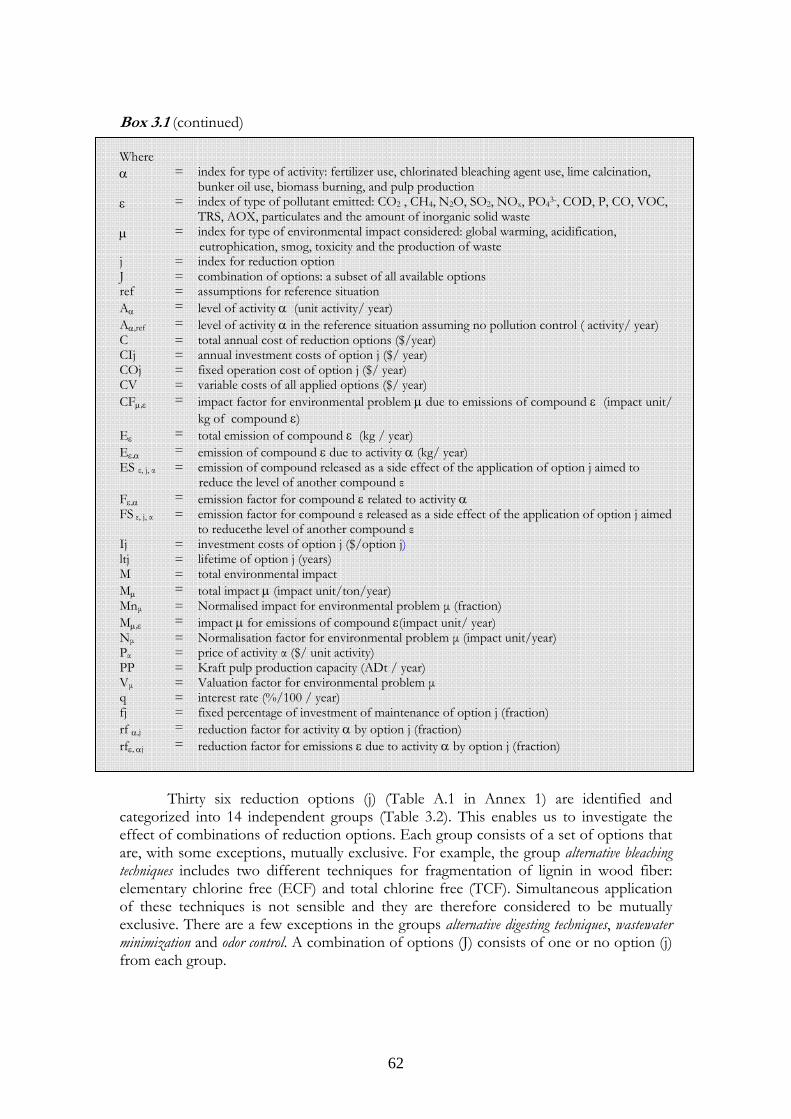
62
Box 3.1 (continued) Where α = index for type of activity: fertilizer use, chlorinated bleaching agent use, lime calcination,
bunker oil use, biomass burning, and pulp production ε = index of type of pollutant emitted: CO2 , CH4, N2O, SO2, NOx, PO43-, COD, P, CO, VOC,
TRS, AOX, particulates and the amount of inorganic solid waste µ = index for type of environmental impact considered: global warming, acidification,
eutrophication, smog, toxicity and the production of waste j = index for reduction option J = combination of options: a subset of all available options ref = assumptions for reference situation Aα = level of activity α (unit activity/ year) Aα,ref = level of activity α in the reference situation assuming no pollution control ( activity/ year) C = total annual cost of reduction options ($/year) CIj = annual investment costs of option j ($/ year) COj = fixed operation cost of option j ($/ year) CV = variable costs of all applied options ($/ year) CFµ,ε = impact factor for environmental problem µ due to emissions of compound ε (impact unit/
kg of compound ε) Eε = total emission of compound ε (kg / year) Eε,α = emission of compound ε due to activity α (kg/ year) ES ε, j, α = emission of compound released as a side effect of the application of option j aimed to
reduce the level of another compound ε Fε,α = emission factor for compound ε related to activity α FS ε, j, α = emission factor for compound ε released as a side effect of the application of option j aimed
to reducethe level of another compound ε Ij = investment costs of option j ($/option j) ltj = lifetime of option j (years) M = total environmental impact Mµ = total impact µ (impact unit/ton/year) Mnµ = Normalised impact for environmental problem µ (fraction) Mµ,ε = impact µ for emissions of compound ε(impact unit/ year) Nµ = Normalisation factor for environmental problem µ (impact unit/year) Pα = price of activity α ($/ unit activity) PP = Kraft pulp production capacity (ADt / year) Vµ = Valuation factor for environmental problem µ q = interest rate (%/100 / year) fj = fixed percentage of investment of maintenance of option j (fraction) rf α,j = reduction factor for activity α by option j (fraction) rfε, αj = reduction factor for emissions ε due to activity α by option j (fraction)
Thirty six reduction options (j) (Table A.1 in Annex 1) are identified and
categorized into 14 independent groups (Table 3.2). This enables us to investigate the effect of combinations of reduction options. Each group consists of a set of options that are, with some exceptions, mutually exclusive. For example, the group alternative bleaching techniques includes two different techniques for fragmentation of lignin in wood fiber: elementary chlorine free (ECF) and total chlorine free (TCF). Simultaneous application of these techniques is not sensible and they are therefore considered to be mutually exclusive. There are a few exceptions in the groups alternative digesting techniques, wastewater minimization and odor control. A combination of options (J) consists of one or no option (j) from each group.
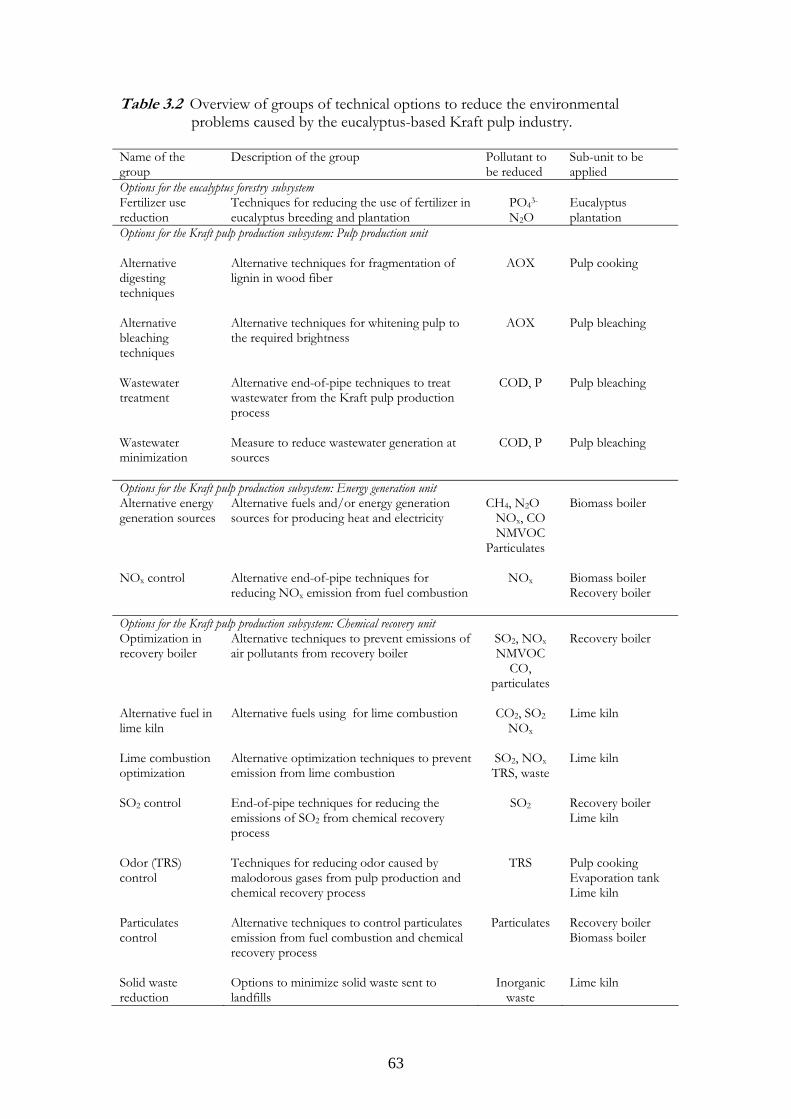
63
Table 3.2 Overview of groups of technical options to reduce the environmental problems caused by the eucalyptus-based Kraft pulp industry.
Name of the group
Description of the group Pollutant to be reduced
Sub-unit to be applied
Options for the eucalyptus forestry subsystem Fertilizer use reduction
Techniques for reducing the use of fertilizer in eucalyptus breeding and plantation
PO43- N2O
Eucalyptus plantation
Options for the Kraft pulp production subsystem: Pulp production unit Alternative digesting techniques
Alternative techniques for fragmentation of lignin in wood fiber
AOX Pulp cooking
Alternative bleaching techniques
Alternative techniques for whitening pulp to the required brightness
AOX Pulp bleaching
Wastewater treatment
Alternative end-of-pipe techniques to treat wastewater from the Kraft pulp production process
COD, P Pulp bleaching
Wastewater minimization
Measure to reduce wastewater generation at sources
COD, P Pulp bleaching
Options for the Kraft pulp production subsystem: Energy generation unit Alternative energy generation sources
Alternative fuels and/or energy generation sources for producing heat and electricity
CH4, N2O NOx, CO NMVOC
Particulates
Biomass boiler
NOx control Alternative end-of-pipe techniques for reducing NOx emission from fuel combustion
NOx Biomass boiler Recovery boiler
Options for the Kraft pulp production subsystem: Chemical recovery unit Optimization in recovery boiler
Alternative techniques to prevent emissions of air pollutants from recovery boiler
SO2, NOx NMVOC
CO, particulates
Recovery boiler
Alternative fuel in lime kiln
Alternative fuels using for lime combustion CO2, SO2 NOx
Lime kiln
Lime combustion optimization
Alternative optimization techniques to prevent emission from lime combustion
SO2, NOx TRS, waste
Lime kiln
SO2 control End-of-pipe techniques for reducing the emissions of SO2 from chemical recovery process
SO2 Recovery boiler Lime kiln
Odor (TRS) control
Techniques for reducing odor caused by malodorous gases from pulp production and chemical recovery process
TRS Pulp cooking Evaporation tank Lime kiln
Particulates control
Alternative techniques to control particulates emission from fuel combustion and chemical recovery process
Particulates Recovery boiler Biomass boiler
Solid waste reduction
Options to minimize solid waste sent to landfills
Inorganic waste
Lime kiln
64
For each reduction option, the technical potential to reduce polluting activities and/or emissions is quantified. These reduction potentials are determined with reference to the situation in which none of the options are applied (reference situation). The effect of a reduction option is quantified as a fraction of the activity levels or emission factors, and therefore independent of the absolute level of the activities or emissions (Pluimers, 2001). The reduction factor (rf) of an option is defined as the fraction by which the level of activity or emissions is reduced (Equation 1 and 3 in Box 3.1). A multiplicative approach is chosen when more than one reduction option is simultaneously applied (Pluimers, 2001). Their combined effect is calculated as the product of their respective reduction factors.
Activity levels (Aα) are calculated for seven different activities (α), which are fertilizer use, chlorine use, chlorine dioxide use, lime calcinations, bunker oil use, biomass combustion and Kraft pulp production capacity, from the combination of options applied (J) and the activity level in the reference situation (Aref) (Equation 1, Box 3.1). Aref is the activity level in the reference situation, in which no pollution abatements is applied. It is calculated as a function of Kraft pulp production capacity (PP) and an activity factor (AFα) (Equation 2 in Box 3.1). The values of activity factors (AF) are presented in Annex 2 (Table A.2). The emissions (E) are calculated for different pollutants (ε) as a function of the activity (Aα), emission factor (Fε, α, j) and the options applied (Equation 3, Box 3.1). The emissions can be reduced by individual reduction option or combinations of reduction option, as described above for the reduction of activity levels. The reduction factors (rfε, α ) indicate the reduction of compound ε emitted from activity Aα . The emission factor Fε, α presents emission per unit activity Aα for a certain compound ε. The values of reduction factor of options on activity level (rfα, j), on emission (rfε, α, j) and emission factors (Fε, α) are presented in Annex 2 (Table A.3, A.4 and A.5, respectively).
Some of the options considered that are meant to decrease the activity level and/or the emission of one pollutant, increase as a side-effect other activity level and/or the emissions of other pollutants. For instance, application of selective catalytic reduction (SCR) is aimed to reduce the emission of NOx, but in the meantime increase N2O emission (Oonk and Kroeze, 1998). This effect can be considered as a negative side effect of the reduction option applied. However, a positive side effect is also possible, when the options considered are meant to decrease the activity level and/or the emission of one pollutant, but as a side-effect also reduce other activity levels and/or the emissions of other pollutants. For instance, application of options in alternative pulp digesting and bleaching are aimed to reduce the emissions of AOX, but in the meantime COD (chemical oxygen demand) emissions are also reduced. The negative and positive side effects of options are presented in Annex 2 (Table A.3 and A.4). It should be noted that we only take into account side effect of pollutants which are included in our system (Table 3.1, Figure 3.3 and 3.4). There are two exceptions to this: CO2 emissions from natural gas replacing biomass, and CH4 emission from application of UASB (upflow anaerobic sludge blanket). We can not omit these side effects because their contributions are larger than 7% of the total greenhouse gas emission (presented in Table 3.1). The emissions from side effects of these two reduction options (ES ε, α, j) (Equation 4, Box 3.1) are calculated as a function of the activity (Aα) and an emission factor (FS ε, α, j), indicating the amount of a component ε emitted from application of option j. The total emission of compound ε is thus the sum of emissions from the relevant activities and the emissions released as side effect of reduction options applied (Equation 5, Box 3.1). The side effect emission factors (ES ε, α, j) are presented in Annex 2 (Table A.6).
65
The annual costs of the reduction options include investment costs (CIj),
operating costs (COj) and variable costs (CV) (Equation 10, Box 3.1). The methodology of cost calculation is based on Klaassen (1991), Cofala and Syri (1998) and Pluimers (2001).The annual investment costs taken into account interest rate (q) and the lifetime of the reduction option (ltj). Operating costs may include maintenance and administrative costs. Variable costs depend on the increase or reduction of costs of activities due to the application of reduction options. The value of cost parameters used for calculating the annual costs are shown in Annex 2 (Table A.8 and A.9). Methods to calculate cost at the sector level are presented in Annex 3.
The emissions of compounds ε have their impact (M) on the environment (Equation 6 and 7, Box 3.1). The integrated environmental impact of different emissions on one environmental problem is quantified by using classification factors (CFµ, ε) (Heijungs et al., 1992). The classification factor for environmental problem µ reflects the relative contribution of a compound ε to the environmental problem µ related to a reference compound. The emissions of different greenhouse gases, acidifying gases, eutrophying compounds, tropospheric ozone precursors and compounds that are toxic for humans can be expressed in terms of carbon dioxide equivalents (CO2-eq), sulfur dioxide equivalent (SO2-eq), phosphate equivalents (PO4-eq), acetylene equivalents (C2H4-eq) and chlorodibenzene equivalent (C6H4Cl2-eq), respectively. The production of solid waste is simply quantified as ton per year, since other classification factors are not available. The values of classification factors (CF) are presented Jawjit et al. (2006 (Chapter 2)).
The emissions of compounds emitted from Kraft pulp industry contribute to different environmental problems. We evaluate the overall environmental impact by use of multi-criteria analysis, in which an overall evaluation is performed on the basis of different criteria (CIFOR, 1999). First, a normalized impact (Mnµ) is calculated by dividing the effect impact (Mµ) by the normalization factor (Nµ) for environmental problem µ (Equation 8, Box 3.1). Since normalization factors have not been developed in Thailand, we use values based on the world for the year 1995 developed by CML (2004) (Table A.7, Annex 2). Next, one overall value expressed as the overall environmental impact (M) is calculated as a function of normalized environmental impact (Mnµ) and valuation factor for environmental problem µ (Vµ) (Equation 9, Box 3.1).The ‘Analytical Hierarchy Process (AHP)’ is used to generate valuation factors for each environmental problem. AHP is a multi-criteria decision making tool that enables the user to establish weights for selected criteria by means of a series of pair wise comparisons (See Annex 4 for detail). The values of valuation factors (Vµ) are presented in Annex 4 (Table A.14).
3.3.2 Description of reference situation The reference situation is analyzed to explore the model behavior and to examine the potential effect of the reduction options. We define a reference situation in which virtually none of the options to reduce the environmental impact described in this paper are assumed to be implemented. This is close to the current practice of pulp production in Thailand. It should, however, be noticed that in reality some of the options described here are already current practice in part of the Kraft pulp industry in Thailand. Nevertheless, we define our reference case as a case without pollution abatement, for purpose of comparison. Table 3.3 presents the differences between the reference case and the current operation in Kraft pulp mills in Thailand, whereas Figure 3.5 presents a
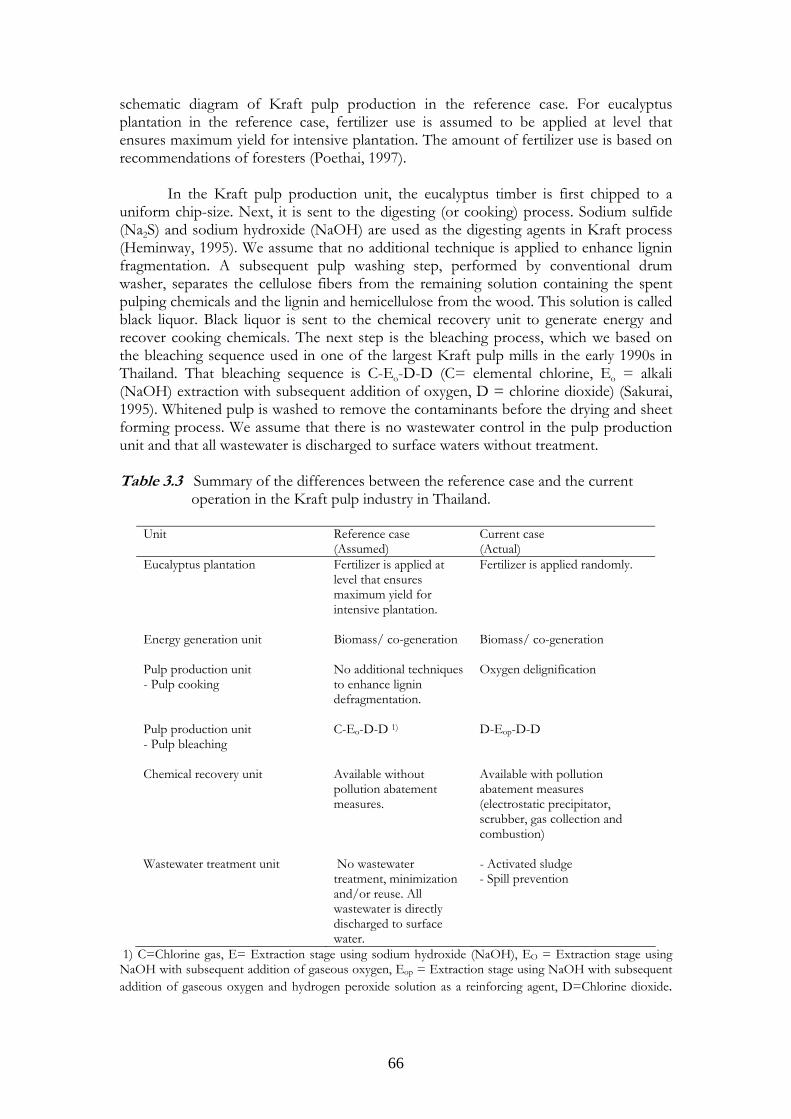
66
schematic diagram of Kraft pulp production in the reference case. For eucalyptus plantation in the reference case, fertilizer use is assumed to be applied at level that ensures maximum yield for intensive plantation. The amount of fertilizer use is based on recommendations of foresters (Poethai, 1997).
In the Kraft pulp production unit, the eucalyptus timber is first chipped to a uniform chip-size. Next, it is sent to the digesting (or cooking) process. Sodium sulfide (Na2S) and sodium hydroxide (NaOH) are used as the digesting agents in Kraft process (Heminway, 1995). We assume that no additional technique is applied to enhance lignin fragmentation. A subsequent pulp washing step, performed by conventional drum washer, separates the cellulose fibers from the remaining solution containing the spent pulping chemicals and the lignin and hemicellulose from the wood. This solution is called black liquor. Black liquor is sent to the chemical recovery unit to generate energy and recover cooking chemicals. The next step is the bleaching process, which we based on the bleaching sequence used in one of the largest Kraft pulp mills in the early 1990s in Thailand. That bleaching sequence is C-Eo-D-D (C= elemental chlorine, Eo = alkali (NaOH) extraction with subsequent addition of oxygen, D = chlorine dioxide) (Sakurai, 1995). Whitened pulp is washed to remove the contaminants before the drying and sheet forming process. We assume that there is no wastewater control in the pulp production unit and that all wastewater is discharged to surface waters without treatment. Table 3.3 Summary of the differences between the reference case and the current
operation in the Kraft pulp industry in Thailand.
Unit Reference case (Assumed)
Current case (Actual)
Eucalyptus plantation Fertilizer is applied at level that ensures maximum yield for intensive plantation.
Fertilizer is applied randomly.
Energy generation unit Biomass/ co-generation Biomass/ co-generation
Pulp production unit - Pulp cooking
No additional techniques to enhance lignin defragmentation.
Oxygen delignification
Pulp production unit - Pulp bleaching
C-Eo-D-D 1) D-Eop-D-D
Chemical recovery unit Available without pollution abatement measures.
Available with pollution abatement measures (electrostatic precipitator, scrubber, gas collection and combustion)
Wastewater treatment unit No wastewater treatment, minimization and/or reuse. All wastewater is directly discharged to surface water.
- Activated sludge - Spill prevention
1) C=Chlorine gas, E= Extraction stage using sodium hydroxide (NaOH), EO = Extraction stage using NaOH with subsequent addition of gaseous oxygen, Eop = Extraction stage using NaOH with subsequent addition of gaseous oxygen and hydrogen peroxide solution as a reinforcing agent, D=Chlorine dioxide.
67
In the chemical recovery unit, we also assume that no pollution abatement options are applied for the reference case. A recovery process normally start by concentrating black liquor in an evaporator, and then burning in a conventional Tomlinson recovery boiler to recover the chemicals and to generate energy. The inorganic fraction of the black liquor leaves the Tomlinson reactor as a molten smelt containing largely Na2S and sodium carbonate (Na2CO3). The smelt is dissolved in water to form green liquor that is later sent to a causticizer, where lime (CaO) is applied to convert the Na2CO3, in turn, in the green liquor back to the desired caustic pulping chemical, NaOH. The lime is converted to calcium carbonate (CaCO3) in the causticizer and can be recovered by calcination in a lime kiln. In the reference case, bunker oil is used as a fuel for lime calcination. Although lime kilns were not installed in all mills in the early stage of Kraft pulp industry in Thailand, we do include this unit in the reference case for two reasons. First, the main objective of lime kiln installation is cost saving purpose, not pollution abatement (though, in one sense, it can be considered as an option for reducing solid waste (lime mud) to landfill). Secondly, lime kilns are currently important sources of air pollutants (Bordado and Gomes, 2002; Jawjit et al., 2006 (Chapter 2)). The efficiency of lime recovery varies from mill to mill (60%-90% for Kraft pulp mills in Thailand (DIW, 1999; ERIC and TPPIA, 2002)). In our reference case, we assume a 60% efficiency of lime recovery. Kraft pulp production is energy-intensive installations that consume high amounts of energy but at the same time produce steam and electrical power on site by use of regenerative fuels. Kraft pulp mill is thus energy self-sufficient mainly because of efficient energy recovery by burning 50% of the incoming wood in the recovery boiler (black liquor) and the use of bark in biomass boiler (EC, 2001). In the energy generation unit, eucalyptus bark plus wood dust from wood preparation stage are sent to the biomass boiler (bark-fired boiler) to generate energy. As mention above, energy (electricity and heat) demand in the Kraft pulp mills in Thailand has been also covered by co-generation systems from the start of Kraft pulp production. ERIC and TPPIA (2002) reported that almost 90% of total energy consumption is from self generated energy. Nevertheless, there is only one Kraft pulp mill importing additional electricity from power plants. In this study we do not consider the environmental impact of electricity from external power plants, because of its small share in electricity requirement for Kraft pulp production (ERIC and TPPIA, 2002). Additionally, it is beyond system boundary in which only eucalyptus forestry and Kraft pulp production are considered. Import of electricity from power plants (normally fossil fuel based) is also not considered an option to improve the environmental performance of pulp production, since it will result in increased emissions of CO2 and SO2. In our reference case, therefore, we assume that all electricity needed is produced in the mill itself by the co-generation system. In the reference case, we also assume that no pollution abatement measures are applied in the energy generation unit.
For the production of solid waste, in our reference case, we focus on inorganic waste, such as residual lime mud, dredges and grit. We assume that there is no organic wastes can be used as fuel. Dredges, grit and ashes are often mixed with the lime mud. It is difficult to explicitly quantify each of these three (EC, 2001). In this study, we therefore lump these in one type of inorganic solid waste. These inorganic waste streams which are mainly generated from chemical recovery unit, are all assumed to be landfilled.
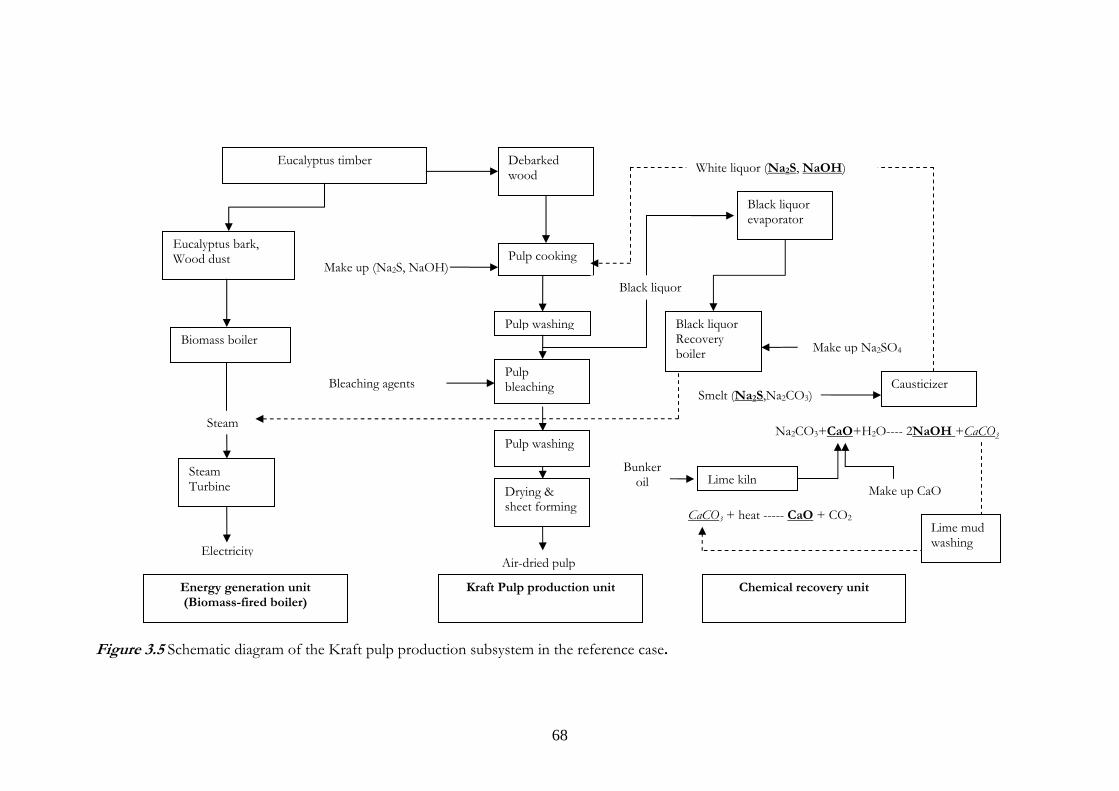
68
Pulp cooking
Pulp bleaching
Pulp washing
Energy generation unit (Biomass-fired boiler)
Pulp washing
Drying & sheet forming
Eucalyptus timber Debarked wood
Eucalyptus bark, Wood dust
Biomass boiler
Steam Turbine
Black liquor evaporator
Black liquor Recovery boiler
Causticizer
Lime kiln
CaCO3 + heat ----- CaO + CO2
Na2CO3+CaO+H2O---- 2NaOH +CaCO3
Smelt (Na2S,Na2CO3)
Steam
Chemical recovery unit
Electricity
Make up CaO
Make up (Na2S, NaOH)
Bleaching agents
Bunker oil
Make up Na2SO4
Lime mud washing
Air-dried pulp
Black liquor
White liquor (Na2S, NaOH)
Kraft Pulp production unit
Figure 3.5 Schematic diagram of the Kraft pulp production subsystem in the reference case.
69
3.4 Model parameters related to reduction options
In this section, the parameters associated with reduction option are described in detail. The options are described for two subsystems within the Kraft pulp industry in Thailand: 1) reduction options for eucalyptus forestry and 2) reduction options for Kraft pulp production. For each reduction option, reduction fractions for activities (rfα in Box 3.1, Equation 1) and/or emissions (rfε , α in Box 3.1, Equation 3) are quantified, as well as alternative emission factors in case of side effects (FS ε, j, α in Box 3.1 Equation 4). All values refer to the reference situation described above, in which no options are assumed to be applied. Because the model is used for scenario analysis in subsequent study, the options described here include both presently available and possible future options. An overview of reduction options is presented in Annex 1 (Table A.1) with reduction factors for activity levels (Annex 2, Table A.3) and emissions of individual pollutants (Annex 2, Table A.4). Some options, as mentioned before, can have unintended side effects. In case an option is increasing a certain emission, this is described by a negative reduction fraction, whereas a decreasing effect is indicated by a positive reduction fraction. The parameters related to costs are shown in Annex 2 Table A.8 and A.9.
3.4.1 Reduction options for eucalyptus forestry Fertilizer use reduction There are four important sub-units in the eucalyptus forestry subsystem (Figure
2), which produce eucalyptus timber for pulp-making purpose. These are eucalyptus breeding, eucalyptus plantation, eucalyptus harvest and eucalyptus transportation. Fertilizers are used in eucalyptus breeding and plantation. Although eucalyptus is a fast-growing tree requiring less fertilizer than many other trees, fertilizer is still required in the intensive plantations, such as those for the pulp-making purpose. Fertilizer use results in emissions of N2O, NOx, NO3
- and PO43-. However, only N2O and PO4
3- are included in the analysis as described above (Table 3.1). More efficient fertilizer use is one way to reduce N-inputs into agricultural soil. As a result, it is also an effective way to reduce N2O emissions (Kroeze and Moiser, 2000) as well as NO3
-, PO43- and NOx. Several
strategies to improve fertilizer efficiency without adverse side effects on the environment and agricultural production can be considered. According to Kroeze and Mosier (2000), matching fertilizer supply with crop demand can save about 20% (rfα = 0.2) of N-fertilizer application in agriculture in temperate zones, whereas applying slow-release fertilizers could reduce the use of fertilizer by about 10% (rfα = 0.1). For tropical regions, such estimates do not exist. Here, we assume that these reductions also hold for eucalyptus plantations in tropical regions. Prices of fertilizers of these two options are based on Ministry of Commerce Thailand (2005) and Satirakosolwong (2005) (Table A.10). We assume that an investment cost and operating cost (COj) are negligible.
3.4.2 Reduction options for Kraft pulp production The production of bleached Kraft pulp has four units, which include pulp
production unit, energy generation unit, chemical recovery unit and wastewater treatment unit. It is however noted that the wastewater treatment unit is considered an option for reducing pollutants, not source of pollutants in this study. Emissions of nutrients due to application of wastewater treatment techniques are thus considered as the side-effect emissions. In the sub-unit level, we include biomass boiler, pulp cooking unit, pulp
70
bleaching unit, evaporation tank, recovery boiler and lime kiln (in line with Figure 3.4). In the following, possible reduction options are described. For each option, the technical potential to reduce activity level (rfα) and/or emission (rfε,α) are given, as well as other parameters used in the model (See also Annex 2, Table A.1, A.3, A.4, A.8 and A.9).
3.4.2.1 Options for the pulp production unit
Pulp production starts with the preparation of raw material to get the debarked
eucalyptus timber in optimal size. Next, eucalyptus timber is digested to dissolve lignin from the wood tissue. The digested pulp is then washed to remove the dissolved lignin and other residues before the pulp is bleached to obtain the required brightness. The last step includes drying and sheet forming. During these different steps, pollutants are generated as wastewater, especially AOX from the bleaching process and COD from pulp washing. The options to reduce emissions AOX are focused on the digesting and bleaching process, whereas the options to reduce the emission of COD include both source reduction as well as end-of-pipe treatment.
Alternative digesting techniques The purpose of pulp digestion is to segregate fibres by solubilizing lignin using
chemicals. Increasing the efficiency of the digesting step can result in a reduction of chemicals used in bleaching step. The following options considered in our analysis aim to enhance the reduction of the lignin in wood tissue. This directly results in a reduction of subsequent bleaching agent use.
As mentioned in the reference case description, in the conventional pulp
digesting process sodium sulphide (Na2S) and sodium hydroxide (NaOH) are used as digesting chemicals to dissolve lignin (ERIC and TPPIA, 2002). Extended delignification or extended cooking is an alternative process, in which the cooking phase is extended by adding cooking liquor to the pulp in stages rather than a single ‘dose’ as is done in conventional practice. The lignin removal is as high as 97% (compared to about 60% for conventional digesting in the reference case) as a result of which the volume of bleaching chemicals is reduced by up to 35% (rfα = 0.35) relative to the reference case (EPA, 1993; UNEP, 1996; Ali and Sreekrishnan, 2001). Oxygen delignification refers to the removal of lignin by treating the cooked pulp with oxygen at alkaline pH (Hynninen, 1998). It needs the installation of an oxygen reaction tower between the pulping and bleaching stages. This technique results in the reduction of bleaching agents by about 40% (rfα = 0.4). Investment costs (Ij) and operating costs (COj), are calculated from the fraction of the investment (fj), and lifetime (ltj) of extended and oxygen delignification are based on EC (2001).
Future alternatives in pulp digestion, which are still in the laboratory phase, are
ozone and enzyme delignification. Ozone delignification is comparable to oxygen delignification by using ozone (O3) and sulphuric acid (H2SO4) with the pulp in a pressurized reactor prior to pulp washing (Haskoning, 1992). This technique can result in a 50% (rfα = 0.5) reduction in the volume of bleaching chemicals. An ozone reactor is installed between the pulping and bleaching stages, and normally followed by an oxygen stage. Enzyme delignification or biopulping is the use of various microorganisms, particularly lignin-degrading fungi (e.g. white-rot fungi) and enzymes (ligninases and xylanases) for the treatment of wood chips prior to pulping. Ligninases attack lignin and
71
degrade it, while xylanses degrade hemicelluloses and make the pulp more permeable for the removal of residual lignin (Ali and Sreekrishnan, 2001). In mill trial, reductions in active chlorine requirement of between 15 and 50% are reported (Senior and Hamilton, 1992). A default value of 30% (rfα = 0.3) is used in this study. However, this technique is still in its infancy and no full-scale biopulping plants are in operation at the moment in Thailand. The values of cost parameters (Ij, fj and ltj) of these two options are based on EPA (1993).
Besides the reduction of chlorinated bleaching agents use, alternative digesting
techniques, which result in a lower kappa number (less lignin content), have the positive side effect of reducing COD emissions, because of reduced organic compound in the effluent discharged from the bleach plant (Hynninen, 1998). In case of oxygen and ozone delignification, effluent from oxygen and ozone stage can be recycled to the mill’s recovery system (EPA, 1993). Application of extended delignification, oxygen delignification, ozone delignification and enzyme delignification can reduce COD emissions relative to the reference situation by about 35% (rfε,α = +0.35) (EC, 2001), 40% (rfε,α= +0.4), 50% (rfε,α= +0.5), and 40% (rfε,α=+0.4) (EPA, 1993), respectively.
Alternative bleaching techniques Pulp bleaching is the following process which is meant to whiten the pulp.
Chlorine-based chemicals such as chlorine gas, chlorine dioxide and hypochlorite are used as bleaching agents. The reduction options considered here mainly focus on the minimization of the discharge of polychlorinated compounds to the environment, since these compounds tend to persist for long times in nature and have high toxicity. We express these emissions in terms of adsorbable organic halides (AOX) (EC, 1995). The percentage of the emission reduction is relative to the assumed C-E-D-D bleaching sequence in the reference (unabated) case.
Elemental Chlorine Free (ECF) bleaching involves the complete replacement of
chlorine (Cl2) with chlorine dioxide (ClO2) (rfα= 1) (D-Eop-D-D bleaching sequence). We assume that an incremental amount of chlorine dioxide can replace chlorine at the first stage bleaching by 25% (rfα= -0.25) (estimated from Gonzalez and Zaror, 2000). As a side effect of ECF application, COD also decreases by about 30% (rfε,α=+0.3) (UNEP, 1996). Though chlorine dioxide application significantly reduces AOX emissions compared with elemental chlorine, there are still chlorinated compounds in the wastewater. Ozone can be applied in conjunction with chlorine dioxide for the production of ECF-pulp. This process is called ‘ECF light’ (Z-Eop-D-D bleaching sequence; where Z = ozone bleaching using gaseous O3). About 4 kg ClO2 can be replaced per kg ozone applied in the first chlorine dioxide stage (normally referred to D0) (Air liquide, 2005; Domtar, 2005). We assume in our analysis that the volume of chlorine dioxide is the same with the reference case, whereas the chlorine is completely substituted by ozone (rfα= 1). Since 1990, totally chlorine-free bleaching (TCF) has been used, largely in response to market demands for non-chlorine bleached pulp, although there is no full-scale operation at the moment in Thailand (DIW, 1999). TCF bleaching is possible after a pre-delignification step with pressurized oxygen, which leads to a pulp with a considerably lower kappa number (a measure of lignin in pulp). This can be followed by the combination bleaching with oxygen, ozone, hydrogen peroxide or even enzymes, thus completely eliminating chlorine and chlorine dioxide (rfα= 1) (Byrd et al., 1992). There are various possible TCF sequences resulting in good quality pulp. In this study, we present peroxide bleaching with combination of ozone (Q-Eop-Z-Q-PO bleaching
72
sequence; where Q =acid stage where chelating agent has been used for removal of metals, PO = pressurised peroxide bleaching).These bleaching sequences result in complete removal of AOX in the effluent, and, as a positive side effect, also reduce COD emission by approximately 60% (rfε,α=+0.6) (UNEP, 1996). COD is reduced because chlorine bleaching stages are all replaced. This enables the effluent can be recirculated to the recovery system without corrosion problem. The value of investment cost (Ij), fraction of the investment cost (fj) and lifetime (ltj) of ECF and TCF bleaching by retrofitting from conventional bleaching are based on EC (2001).
Wastewater treatment Large amounts of water are used in Kraft pulp production, especially in the pulp
washing process, resulting in polluted water which needs to be treated. Activated sludge (AS) is the biological wastewater treatment process applied in Kraft pulp mills in Thailand. In full operation, AS can potentially reduce the emissions of COD and P by about 80% (rfε,α= 0.8) and 70% (rfε,α= 0.7), respectively (based on DIW (1999) and Schnell et al. (2000)). If the mill has no limitation on available area, aerated lagoon (AL) is also a possible alternative for biological treatment. Although operating and maintenance cost of AL is lower than AS, its COD-treatment efficiency is lower. Typical removal efficiencies are about 50% (rfε,α= 0.5) for COD and10% (rfε,α= 0.1) for P (Poyry, 1997). As a positive side effect, AS and AL can also reduce AOX emission by about 40% (rfε,α= +0.4) and 50% (rfε,α= +0.5), respectively (Schnell et al., 2000). It should be noted that these three wastewater treatment processes are combined with a coagulation unit, which aims to reduce residual nutrients in the effluent. The value of investment cost (Ij), as well as lifetime (ltj) and fraction of the investment cost (fj), of AS and AL including the necessary primary treatment and sludge handlings are based on EC (2001). Anaerobic treatment is another possible treatment, since the COD content of influent form Kraft pulp production in Thailand normally exceeds 1,000 mg/l, and this is a suitable condition for anaerobic bacteria (DIW, 1999; ERIC and TPPIA, 2002). The process is carried out in the absence of oxygen by different group of bacteria. The major part of organic matter removed in the process is converted to methane gas. Methane production is about 0.30 m3 CH4 per kg COD removed (Udomsinroj, 2000). One of potential anaerobic processes is called UASB (the up-flow anaerobic sludge bed process). Buzzini et al. (2005) concluded that the application of UASB reactor on Kraft pulp synthetic wastewater, with the presence of chlorinated organic, presented a good stability and high COD removal (79-82%) efficiency. An 80% COD removal (rfε,α= 0.8) is therefore used in this study. AOX is partly reduced by the application of UASB by about 50% (rfε,α= +0.5) (Leptiso, Rintala, 1994).
Wastewater minimization Besides the end-of-pipe techniques, wastewater can be minimized by source
reduction such as spillage collection and improvement of pulp washing. Spillage collection is a measure to limit losses of pulping liquor from seals on pulp washing tanks, pumps and valves in liquor service, and other unintentional liquor diversions during maintenance, start-ups and shut down procedure. With good process management and proper design, a 30% COD reduction (rfε,α= 0.3) can be reached in comparison to mills with no or inefficient spill recovery (the reference case). Additionally, the risk of upsets in an external treatment plant is reduced, when accidental discharges with high organic and sometimes toxic load or continuously high or low pH of the incoming stream can be avoided. The value of cost parameters (Ij, ltj and fj) of spillage collection are based on
73
TAPPI (1996). Pulp washing improvement is aimed to improve the separation of pulp fiber from dissolved organic (lignin) and inorganic chemicals. This will reduce the use of bleaching agents, because lignin tends to compete with pulp fibers for bleaching agent in the bleaching stages. Improved pulp washing will also reduce the COD in the effluent, because of less organic content in the effluent discharge from the subsequent bleaching stage (Poyry, 1997). The pulp washing efficiency can be improved by switching a conventional drum washing system to a modern washer system comprising a press washer. If there is an efficient washing system prior to the first bleaching stage, the carry-over of organics to bleaching will drop, resulting in the reduction of bleaching chemical by about 20% (rfα= 0.2) and the reduction of COD emission by about 40% (rfε,α= 0.4). The investment cost (Ij) and lifetime (ltj) of a modern washer system is taken from EC (2001), which also assumed that operating costs are negligible.
3.4.2.2 Options for the energy generation unit Alternative energy generation source
Major energy supply in Kraft pulp mill derives from recovery boiler which is in
the chemical recovery system. Additional electricity and heat can be obtained from on-site cogeneration systems. For eucalyptus-based pulp mill in Thailand, eucalyptus bark is most widely used fuel for combustion to produce heat and electricity (DIW, 1999; ERIC and TPPIA, 2002). Kroeze et al. (2004) indicated that two types of options to reduce emission from energy generation can be distinguished: 1) fuel switches and 2) efficiency improvement.
In our study, we consider the following fuel switches: replacement of biomass by
natural gas, and solar energy. Replacement of biomass by natural gas results in lower emissions of N2O, NMVOC, CO by about 90% (rfε,α= 0.9),and CH4, particulates by about 80% (rfε,α= 0.8), respectively, but increases the emission of NOx by about 50% (rfε,α= -0.5), respectively (estimated from IPCC, 1997). CO2 emission is significantly increased, since CO2 from biomass combustion is considered zero (see Table A.6 for calculations of CO2 emission from application of natural gas). In this study, eucalyptus bark is considered to be sold as fuel for other industries.
Heat and electricity generation from solar thermal systems is a possible future
alternative for biomass-based cogeneration. This option includes a high temperature solar thermal system using mirrors and other reflective surfaces to concentrates solar radiation to a single point to produce temperature in excess of 1000 oC. The resulting high temperature can be used to create steam to drive electric turbine generators. However, this technology requires large land area, and still needs further research and development to become competitive. In this study, we distinguish two types of solar thermal systems: 1) solar heating and 2) solar thermal electricity. In case of heat production by solar thermal systems, we assume a reduction in biomass combustion of about 10% (rfα= 0.1). Alternatively, we assume that all electricity produced from biomass boiler is produced by solar thermal systems (rfα= 1). The side effect of solar thermal systems on other emissions is considered zero. Eucalyptus bark, which is no longer used as fuel, is considered to be sold as fuel for other industries. The value of investment cost (Ij) and lifetime (ltj) are based on UNEP (2005). The price of eucalyptus bark is based on FAO (1987) (Table A.10).
74
The energy efficiency of the pulp production process can be improved. For instance, the biomass gasification combined cycle (BIGCC) is not only a more environmentally friendly, but also a more efficient way of electricity generation. Biomass, in this study bark, is first sized and screened, and then sent to the gasifier unit. After gasification, the resulting fuel gas is cracked in a tar cracker, and then cooled. Particulates in the gas are removed by a bag filter to meet the requirement for the subsequent gas turbine, whereas remaining contaminants, mainly ammonia, are removed in a scrubber. The flue gas is then compressed and combusted to drive the gas turbine (Faaij et al., 1997). We assume that particulates can be removed by about 90% (rfε,α = 0.9) relative to the reference case (combustion in biomass boiler). We also assume that CO concentrations are very low (rfε,α = 0.9) because of efficient combustion in the gasifier and reducing conditions before combustion in the turbine. CO thus is not released (Faaij et al., 1997). NOx formation can be lower than in conventional systems because gasification systems usually have lower burning temperatures (Faaij et al., 1997). We thus assume that NOx can be removed by about 50% (rfε,α = 0.5) relative to the reference biomass boiler. On the other hand, N2O emissions may be decreased compared with conventional biomass boilers. However, we do not have quantitative information to make an assumption, and therefore assume that there is no change in N2O emission. Likewise, CH4 and NMVOC emissions remain unchanged. The investment costs of BIGCC include not only gasification system, but also the gas cleaning unit, compressor and combined cycle unit. The value of cost parameters (Ij, ltj and fj) of biomass gasification are based on Faaj et al. (1997), Audus and Freund (2004). NOx control
Emissions of NOx from the energy generation unit can be reduced by installing after burner or using selective catalytic and non-catalytic reduction. The selective catalytic reduction (SCR) process uses ammonia to convert nitrogen oxides into molecular nitrogen (N2) and water (H2O) in presence of a catalyst such as titanium oxide, vanadium, nickel (Cofala and Syri, 1998). Selective non-catalytic reduction (SNCR) is another add-on technique which depends on injection of ammonia or other reducing agents into flue gas without use of catalyst. In contrast to SCR technologies, no catalysts are required, which result in lower investments and maintenance costs. However, SNCR process is temperature-sensitive, the effectiveness of NOx removal depends on successful temperature control. Under optimal condition, NOx removal efficiency can be achieved by about 75% (rfε,α= 0.75) and 60% (rfε,α = 0.6) by SCR and SNCR, respectively (Cofala and Syri, 1998; Hynninen, 1998). However, application of SCR and SNCR can be accompanied by an increase in N2O emissions of about 30% (rfε,α = -0.3) and 20% (rfε,α = -0.2), respectively (Oonk and Kroeze, 1998).
Other methods for reducing nitrogen oxides from flue gas from biomass boiler
include low-NOx burners that produce two-stage combustion by modifying the way of injecting air and fuel to delay the mixing. The purpose of the multi-phase air feed is to burn the fuel without excess air and actually even under reducing conditions, meaning that there is not enough oxygen to promote strong NOx formation (EC, 2001). This reduces the availability of oxygen and reduces the peak flame temperature. Therefore, the conversion of fuel-bound nitrogen to NOx and the formation of thermal NOx can be minimized while maintaining high combustion efficiency. This option reduces NOx by about 40% (rfε,α = 0.4). The value of cost parameter (Ij, fj, ltj) of SCR, SNCR and low NOx burner are based on Cofala and Syri (1998) and EC (2001).
75
3.4.2.3 Options for the chemical recovery unit The chemical recovery unit is an important unit in Kraft pulp mills, since it limits
the amount of new chemicals added to the process. However, this unit generates several air pollutants such as CO2, SO2 and TRS. Lime mud, grit and dregs are also generated from this unit. We focus on the reduction options for two most important sub-units in chemical recovery unit, which are the recovery boiler and lime kiln.
Optimization of the recovery boiler Optimization measures to reduce air pollutants emissions, especially SO2, from
the recovery boiler include process control by increasing the dry solid content of black liquor. Through enhanced evaporation, as high content of dry solid (DS) as possible in the strong black liquor is aimed for. After a conventional evaporation (refer to the reference case) the DS content in the strong black liquor is about 65%. By installing a superconcentrator, a DS content of up to 80% can be achieved. More sodium will vaporize and react with sulfur in the evaporation process results in emissions of SO2 and TRS that are reduced by about 80% (rfε,α = 0.8) and 60% (rfε,α = 0.6) in the subsequent recovery boiler, respectively (Poyry, 1992). Nevertheless, increase DS content from 65-75% may increase NOx by about 20% (rfε,α = -0.2) if no counter-measure, e.g. over fired air technique, is taken EC (2001). Investment cost (Ij) and lifetime (ltj) of this option are based on Poyry (1992). Another potential technique to control NOx and TRS emissions from the recovery boiler is to control the condition of combustion in the furnace. Modifications to the air feed system have proved successful with respect to NOx reduction. Thermal NOx by fixation of nitrogen in the combustion air can be reduced by limiting the amount of air in the combustion zone. Over fired air (OFA) is a technique that modifies the air feed system such as introducing a fourth air inlet in the upper part of the boiler. The reduction of NOx emission is in the range of 10-25% (SEPA, 1997). A value of 20% (rfε,α = 0.20) is used in this study. The investment costs (Ij), which include new air inlets to the recovery boiler, instrumentation, pipes and fans, is obtained from EC (2001). We assume that operating cost (COj) of increasing dry solid content of black liquor and OFA are negligible following EC (2001).
Besides optimization measures in the recovery boiler, energy efficiency can be
improved by substituting the conventional Tomlinson recovery boiler by a Black liquor gasification combined cycle (BLGCC) to improve the electrical efficiency and reduce the environmental impact (Larson et al., 2003; Farahani et al., 2004; Mollersten et al., 2005). In this study, assumptions on the BLGCC technology are assuming low temperature oxygen-blown gasification at high pressure. Gasification of black liquor produces a fuel gas (syngas) consisting largely of hydrogen (H2) and carbon monoxide (CO) that can be cleanly converted into electricity in a gas turbine combined cycle. The use of partial combustion or gasification instead of combustion (recovery boiler) gives a fundamentally different opportunity to manage the environmental impact of black liquor conversion. Aside from efficiency benefits, a distinctive and intrinsic feature of the BLGCC technology is the expected low relative emissions of pollutants, especially air pollutants, compared to a Tomlinson recovery system employing sophisticated pollution controls (Larson et al., 2003). Emission of SO2 can be expected to be very low since the fuel gas is scrubbed of nearly all H2S to return the sulphur to the pulping process. CO and particulate matter are also generally low from gas turbine operation due to efficient combustion. Scrubbers can be expected to control particulate matters to low levels. However, application of BLGCC increases the load of causticizer and lime kiln, which
76
leads to more bunker oil use. Additional biomass is also needed to produce sufficient process steam for the mill. These two side effects need to be taken into account when estimating the overall effect of BLGCC on emissions. We estimate that SO2, NOx, CO and particulate emission can be reduced by about 40% (rfε,α = 0.4), 25% (rfε,α = 0.25), 8% (rfε,α = 0.08) and 60% (rfε,α = 0.6), respectively, relative to a conventional Tomlinson boiler as assumed in the reference case (Larson et al., 2003). These estimates reflect the net effect of direct effect and also reflect side effect. The value of cost parameters (Ij, ltj and fj) of the black liquor gasification combined cycle are based on Larson et al. (2003).
Alternative fuel in lime kiln
In lime kiln, bunker oil is used as a fuel for lime combustion in chemical recovery unit in our reference case. Jawjit et al. (2006 (Chapter 2)) indicated that bunker oil is the most important source of CO2 emissions in Kraft pulp mills in Thailand, when excluding biomass-based CO2. It is also a source of SO2. Substitution bunker oil by natural gas results in a reduction of CO2 and SO2 emissions by about 20% (rfε,α = 0.2) and 100% (rfε,α = 1) , respectively, (estimated from IPCC (1997)). The price of bunker oil and natural gas are based on DOEB (2005) (Table A.10).
Lime combustion optimization
Lime combustion (calcination) is the important activity to generate SO2, NOx and TRS (Jawjit et al., 2006 (Chapter 2)). Besides the end-of-pipe treatment of these air pollutants, the emissions can be reduced by optimizing lime combustion. Installation of improved washing of lime mud in recausticizing is one of the measures. The objective of lime washing is to remove residual sodium hydroxide, sodium sulfide and other sodium salt from lime mud (CaCO3) before it is sent to lime kiln to recover to lime (CaO). More efficient washing reduces the concentration of sulfide in the lime mud, thus reducing the formation of H2S in the lime kiln during the reburning process. Its efficiency to reduce H2S emission is 60% (rfε,α = 0.6) approximately. Investment cost (Ij) of a modern single –stage mud washing in a unit-type clarifier, which replaces a conventional two-stage mud washer, is based on EC (2001). In case of poor lime mud washing, the addition of molecular oxygen to the combustion air of a lime kiln to eliminate H2S generation and increase lime burning capacity is also possible option. In O2 enrichment kiln, O2 is added to the air supply of the kiln to reduce the amount of inert nitrogen. This increases the flame temperature and accentuates heat transfer by radiation of the flame to the lime. Fuel consumption is reduced by about 20% (rf,α = 0.2) and kiln production is also increased resulting in the reduction of residual lime mud by about 20% (rfε,α = 0.2). This also results in the reduction of TRS emission by about 70% (rfε,α = 0.7) (Air liquide, 2005). We assume that operating cost (COj) of improvement of lime mud washing and O2 enrichment kiln are negligible.
SO2 control
In chemical recovery process, the main sources of SO2 are recovery boilers, lime kilns and the smelt tanks (Bordado and Gomes, 2002). However, recovery boilers burning high dry solid black liquor normally give rise to low sulfur emission. In case that no such practice is performed, scrubber is commonly operated in many industrial mills. SO2 in the flue gases is absorbed into the scrubbing solution. Its efficiency to remove SO2 is about 90 % (rfε,α = 0.9) relative to the unabated situation. Scrubber can also reduce the emissions of NOx and TRS by about 50% (rfε,α = 0.5) and 80% (rfε,α = 0.8),
77
respectively (UNEP, 1996; Hynninen, 1998). Scrubber can be installed both in recovery boiler stack and lime kiln stack. The value of cost parameters (Ij, fj and ltj) of scrubber is based on Cofala and Syri (1998) and EC (2001).
Odor (TRS) control Kraft pulping gives rise to malodorous gases containing hydrogen sulfide, which
normally refer to total reduced organic sulfur compounds (TRS). These volatile compounds can be present at high concentrations in certain off-gases and condensate from digesters and evaporators. Effective odor suppression requires that all malodorous gases are collection of odorous gas for incineration in lime kiln. The collection is carried out with gas pipeline and blowers for gas transfer. In lime kiln, about 60% (rfε,α = 0.6) of reduced sulfur compounds are removed through combustion process. An average 10% (rfα = 0.1) of the bunker oil used in a lime kiln can be replaced by the heat value of the concentrated malodorous gases Nevertheless, SO2 is generated after combustion of TRS, though it is partly absorbed by sodium carbonate in the lime mud (EC, 2001). We assume that SO2 is increased by about 40% (rfε,α = -0.4). However, it was found that capacity of lime kiln is not sufficient for all TRS containing air (Hynninen, 1998), and combustion of TRS might upset the operation of the lime kiln. Some mill thus installs a separate furnace equipped with scrubber to handle this problem. In a separate furnace, TRS can be reduced by about 80% (rfε,α = 0.8) respectively. The cost parameters (Ij, fj and ltj) of these options are based on EC (2001).
Another TRS emission abatement is a stripping process, which separate sulfur
compounds present in contaminated air and liquid effluents. The stripping column can be a separate equipment or it can be integrated part of the evaporation plant. TRS can be reduced by stripping about 90% (rfε,α = 0.9) (Hynninen, 1998; Bordado and Gomes, 2002).
Particulates control The important sources of particulates emission are biomass boiler and recovery
boiler. The particles consist of ash and a residue of unburned material. Application of bag filters, cyclones and electrostatic precipitators result in the reduction of particulates matter by about 65% (rfε,α = 0.65), 80% (rfε,α = 0.8) and 95% (rfε,α = 0.95), respectively (SEPA, 1992; UNEP, 1996; Poyry, 1997). The value of cost parameters (Ij, fj and ltj) of cyclones and bag filter are based on Faaij et al. (1997), whereas costs of electrostatic precipitators are based on EC (2001).
Inorganic waste management In Kraft pulp mill in Thailand, most of the organic residues (bark and wood dust)
are used to be fuel in boilers to produce energy. Sludge from wastewater treatment plant is also sent to boilers after a dewatering process. Solid wastes which can not be recycled into the process include solid waste from the recovery unit such as lime mud, dregs and grits. Conventionally, the final disposal of these wastes is through landfill, which regarded as the least desirable waste disposal option, and always considered as the last resort. We, therefore, do not include landfill in the reduction option. Installation of the additional lime kiln increases the capacity of lime kiln, which results in more lime recovered and less residual lime mud to be landfilled. We assume that this option can reduce the generation of inorganic solid waste by about 40% (rfε,α = 0.4). This option, however, results in the
78
increase of bunker oil use by about 30% (rfα = -0.3). Another alternative to reduce the quantity of waste to be landfilled, involves lime mud and ashes from the lime kiln and recovery boiler. These inorganic wastes can be made available to farmers as soil conditioner. However, farmers’ acceptance can be a barrier due to the applicability and contamination of components in inorganic waste. We thus assume that the reduction of amount of waste to be landfilled is about 10% (rfε,α = 0.1). Investment cost (Ij) and operating cost (COj) are assumed negligible.
3.5 Discussion This chapter presents a model that can be used to analyze options to reduce the potential environmental impact of Kraft pulp industry in Thailand. In the following, some advantages and disadvantages of our model approach are discussed. An important feature of the model is that it can be used to quantify emissions of pollutants from the Kraft pulp industry in Thailand that contribute to global warming, acidification, eutrophication, smog, human toxicity and the production of waste. The emissions are quantified following an emission factor approach. In this approach emissions are calculated as a function of a certain activity rate, and accompanying emission factors. Application of reduction options may affect the activity levels or the emission factors. The costs of the reduction options are calculated as annual costs. A major advantage of our model approach is the integrated analysis of all relevant environmental problems related to the Kraft pulp industry in Thailand, as well as the possibility to analyze the impact of technical options on these problems and the cost-effectiveness of combinations of options. To our knowledge, no such model exists for Kraft pulp industry in Thailand, although several studies have been carried out to analyze possibilities for reducing the environmental impact from this industry. For example, Thailand’s Department of Industrial Works (DIW) of the Ministry of Industry, published ‘A Handbook of Environmental Management on Pulp and Paper Industry’ (DIW, 1999), whereas the Asian Institute of Technology (AIT) described options for cleaner production in the pulp and paper industry (AIT, 1999). These studies present details on the application of options to minimize the emissions of pollutants, but do not present an integrated method or model to quantify the effects of the applied options. Likewise, cost-effectiveness of the application of options, which we include in our model, is roughly presented in of the study by AIT. Another new element in our study is that we account for side effects of reduction options on other pollutants. In addition, our model takes into account reduction options for eucalyptus forestry, which is commonly not included in other studies when studying environmental problems from pulp and paper industry. Nevertheless, the model has its uncertainties. In particular many of the parameter values are surrounded with uncertainties. The uncertainties in activity levels are typically relatively low, since in general well organized and reliable statistics exists that are based on local information, acquired by mill visits, interviewing experts and the literature. On the other hand, the values of the emission factors are surrounded with more uncertainty, since most of the emission factors used here are not specific for Thailand. We first considered all Thailand-based emission factors. However, in most cases country-specific factors were not available for Thailand, so that emission factors were taken from other sources like IPCC or EMEP/CORINAIR. Similarly, all classification factors related to global warming, acidification, eutrophication and smog are generic factors from Heijung et al. (1992), IPCC (1997), Goedkoop (2000) and CML (2004), because no site dependent
79
classification factors have been developed for Thailand. Despite these limitations, we are convinced that our model include the best set of parameter values currently available. The reduction factors of the reduction options are also to some extent uncertain. For currently available reduction options, the reduction factors have been directly obtained from Thai technicians. If this was not possible, the reduction factors were taken from the literature. However, not all reduction factors were available in the form that we needed. In some cases, additional assumptions therefore needed to be made. Furthermore, the reduction factors of future options such as enzyme bleaching are uncertain. Information of options that are not yet available on the market, is mainly based on experiments at the laboratory scale. Finally, in our model, we assume that all reduction options are applied at maximum efficiency. In reality, however, this may not be the case. The model results may therefore be too optimistic. Despite these uncertainties, we consider our model adequate for analyses of the Thai eucalyptus-based Kraft pulp production. The model uncertainties largely stem from missing information. Our model results may therefore be considered a state-of-the art integrated analysis of the effects of reduction strategies on the environment, and their associated costs. Acknowledgements We would like to thank Dr. Pittaya Petmak (Department of Royal Forestry) and Dujdao Wongsomboon for their kind assistance and for providing useful information on eucalyptus plantations and current pollution abatement in Kraft pulp mills in Thailand.
80
References Ali M and Sreekrishnan T R. 2001. Aquatic toxicity from pulp and paper mill effluents: a review. Advances in Environmental Research 5: 75-196. Air Liquide .2005. www.us.airliquide.com access in March. AIT. 1999. Cleaner production in the pulp and paper industry: Technology fact sheets. Asian Institute of Technology. Pathumthani. Thailand. Audus H, Freund P. 2004. Climate change mitigation by biomass gasification combined with CO2 capture and storage. 7th International conference on greenhouse gas control technologies. Vancouver location center. Bank of Thailand. 2005. www.bot.or.th. access in September. Bordado J C M, Gomes J F P. 2002. Atmospheric emissions of Kraft pulp mills, Journal of Chemical Engineering and Processing 41:667-671. Buzzini A P, Gianotti E P, Pires E C. 2005. UASB performance for bleached and unbleached kraft pulp synthetic wastewater treatment. Chemosphere 59(1):55-61. Byrd M V, Gratzl J S, Singh R P. 1992. Delignification and bleaching of chemical pulps with ozone: a literature review. TAPPI Journal 75:207-213. Checkland P B. 1979. Techniques in soft systems practice: Building conceptual models, Journal of Applied Systems Analysis 6:41-49. CIFOR. 1999. Guidelines for applying multi-criteria analysis to the assessment of criteria and indicators; The criteria and indicators toolbox series 9. Centre for International Forestry Research. Jakarta. CML. 2004. Impact assessment spreadsheet version 2.7. Center of Environmental Science, Lieden University. The Netherlands. Cofala F, Syri S. 1998. Nitrogen oxides emissions, abatement technologies and related costs for europe in the RAINS model database. IR-98-88. International Institue for Applied Systems Analysis (IIASA). Laxenburg, Austria. CORINAIR. 2000. Atmoshpheric emission inventory guidebook, second edition. The Core Inventory of Air Emission in Europe. European Environment Agency. Copenhagen, Denmark. DIW. 1999. Technical guideline for environmental management for pulp and paper in Thailand. Department of Industrial Work, Bureau of Environmental Technology, Ministry of Industry, Bangkok, Thailand. Domtar. 2005. www.domtar.com access in March 2005. EC. 1995. Implementaion of the best available techniques (BAT) in the pulp industry. European Commission. Luxembourg.
81
EC. 2001. Integrated Pollution Prevention Control (IPPC); Reference Document on Best Available Techniques in the Pulp and Paper Industry. European Commission, Luxembourg. EPA. 1993. Handbook on Pollution Prevention opportunities for Bleached Kraft Pulp and Paper Mills. US Environmental Protection Agency. EPA 600/R-93/098. Washington. USA. ERIC and TPPIA. 2002. Application of the production performance indicators in accordance with Global Reporting Initiative (GRI) to Thai pulp and paper industries. Environmental Research DOEB. 2005. www.doeb.go.th. Department of Energy Business, Ministry of Energy. access in November. Faaij A, Van Ree R, Waldheim L, Olsson E, Oudhuis A, Van Wijk A, Daey-Ouwens C, Turkenburg W. 1997. Gasification of biomass wastes and residues for electricity production. Biomass and Bioenergy 12(6):387-407. Faaij A. personal communication, October 2005. Farahani S, Worrell E, Bryntse G. 2004. CO2 free paper? Resources, Conservation and Recycling 42:317-336. FAO. 1987. Technical and Economic Aspects of Using Wood Fuels in Rural Industries. FAO document repository. edited by TARGET Tecnologia e Servizi S.r.l. Rome. Institute of Chulalongkorn University and Thai Pulp and Paper Industries Association, Bangkok, Thailand. (Thai edition) IPCC. 1997. Greenhouse Gas Inventory Reference Manual, IPCC Guidelines for National Greenhouse Gas Inventories Volume 3. Intergovernmental Panel on Climate Change. Goedkoop M. 2000. The Eco-indicator 99, final report, Pre-consultants, Amersfoort. Gonzalez P, Zaror C. 2000. Effect of process modifications on AOX emissions from Kraft pulp bleaching, using Chilean pine and eucalyptus. Journal of Cleaner Production 8:233-241. Haskoning. 1992. Technical and economic study on the reduction, based on Best Available Technology, of industry emission, from ‘the pulp industry selection of most suitable parameter to determine limit values for emissions to air and water’, Final Report, The Netherlands. Heijungs R, Guine J B, Huppes G,. Lankreijer R M, Udo de Haes H A, Wegener Sleeswijk A, Ansems A M M, Eggels P G, van Duin R, de Goede H P. 1992. Environmental Life cycle assessment of products. Guidelines and backgrounds. Center of Environmental Science (CML) (NOH report 9266 and 9267), Leiden. Heminway S. 1995. The sector notebook project: Pulp and Paper Industry. US. Environmental Protection Agency (EPA). Washington DC, USA.
82
Hermann B G, Kroeze C, Jawjit W. 2006. Assessing environmental performance by combining life cycle assessment, multi-criteria analysis and environmental performance indicators. Journal of Cleaner Production: in press. Hynninen P O. 1998. Papermaking Science and Technology Environmental Control. The Finnish Paper Engineer’s Association and TAPPI. Finland. Jawjit W, Kroeze C, Soontaranun W, Hordijk L. 2006. An analysis of the environmental pressure exerted by the eucalyptus-based Kraft pulp industry in Thailand. Journal of Environment, Sustainability and Development 8(2):289-311. (Chapter 2 of this thesis) Jawjit W, Kroeze C, Soontaranun W and Hordijk L. 2006. Analyzing Option to Reduce the Environmental Impact by Eucalyptus-based Kraft Pulp Industry in Thailand: Model Exploration. Journal of Cleaner Production (submitted). (Chapter 4 of this thesis) Klasssen G. 1991. Costs of controlling ammonia emissions in Europe, Status report. IIASA. Laxenburg. Austria. Kroeze C, Mosier A. 2000. New estimates for emissions of nitrous oxide. In: Non-CO2 Greenhouse Gases: Scientific Understanding, Control and Implementation. Kluwer Academic Publishers. The Netherlands: 45-46. Kroeze C, Vlasblom J, Gupta J, Boudri C, Blok K. 2004. The power sector in China and India: greenhouse gas emissions reduction potential and scenarios for 1990–2020. Energy Policy 32(1):55-76. Larson E D, Consonni S, Katofsky R E. 2003. A cost-benefit assessment of biomass gasification in pulp and paper industry. Final report. Princeton University, Politecino di Milano, Navigant Consulting Inc. Leptiso R., Rintala J. 1994. The removal of chlorinated phenolic compounds from chlorine bleaching effluents using thermophilic anaerobic processe. Water Science and Technology 29(5-6):373-380. Lehman B, Worrell E. 2001. Electricity Production from Natural Gas Pressure Recovery Using Expansion Turbines. Proceeding 2001 ACEEE Summer Study on Energy Efficiency in Industry-Volume 2. Tarrytown, New York: 43-54. Ministry of Commerce Thailand. 2005. www.moc.go.th. Access in Novermber. Mollersten K, Gao L, Yan J, Oberstiener M. 2004. Efficient energy systems with CO2 capture and storage from renewable biomass in pulp and paper mills. Renewable energy 29:583-1598. Oonk H, Kroeze C. 1998. Nitrous oxide emissions and control. John Wiley & Son Inc. Pluimers J C. 2001. An environmental systems analysis of greenhouse horticulture in the Netherlands: the tomato case. PhD. Thesis. Wageningen University, Wageningen, The Netherlands. Poethai M. 1997. Handbook of Eucalyptus plantation. fourth edition. M.P. Reforestation Group, Bangkok, Thailand. (Thai edition)
83
Poyry J. 1992. Technical and Economical Evaluation of Water Pollution Control in Pulp Mill. Jaakko Poyry Consulting. Helsingki. Poyry, J. 1997. A compilation of BAT techniques in pulp and paper industry, Jaakko Poyry consulting. Helsingki. PRB. 2005. www.prb.org/pdf05/05WorldDataSheet_Eng.pdf. Population Reference Bureau. Access in November. Sakurai K. 1995. Cleaner Production for Green Productivity: Asian Perspective. Asian Productivity Organization. Tokyo. Satirakosolwong P. 2005. personal communication. Contact group. Bangkok. Thailand Schnell A, Steel P, Melcer H, Hodson P V, Carey J H. 2000. Enhanced biological treatment of bleached Kraft mill effluents: I. Removal of chlorinated organic compounds and toxicity. Water Research 34(2):493-500. Senior and Hamilton. 1992. Biobleaching with xylanases brings biotechnology to reality. Pulp and Paper Journal September: 112. SEPA. 1992. Reduction of Atmospheric Emissions from Pulp Industry. Report 4008. Swedish Environmental Protection Agency. Jaakko Poyry Consulting. SEPA. 1997. Aspect on Energy and Environment Costs in Connection with Production of Kraft Pulp, Recycled Fiber and TMP. Report 4713-2. Swedish Environmental Protection Agency. Jaakko Poyry Consulting. TAPPI. 1996. Desgin consideration for cost-effective Kraft and sulfite pulping liquor spill control system. TAPPI proceeding “Minimum effluent mill symposium”. Tare V, Gupta S, Bose P. 2003. Case studies on Biological Treatment of Tannery effluents in India. Journal of Air & Waste Management Association 53:976-982. Udomsinroj K. 2000. Wastewater Engineering Vol.VI. Bangkok. Thailand. (Thai edition). UNEP. 1996. Environmental management in the pulp and paper industry. United Nation Environment Programme: Industry and Environment. Stockholm, Sweden. UNEP. 2005. www.uneptie.org/energy. access in September. USAID. 2001. Report on Pulp and Paper Industry: Survey of Industrial Environment. In www.cleantechindia.com/eicnew/bhup.htm. Vargas L G. 1990. An overview of the Analytical Hierarchy Process and its application. European Journal of Operational Research 48:2-8. Wilson B. 1984. System: concepts, methodologies and applications. John Wiley&Sons, Chichester, United Kingdom.

84

85

86
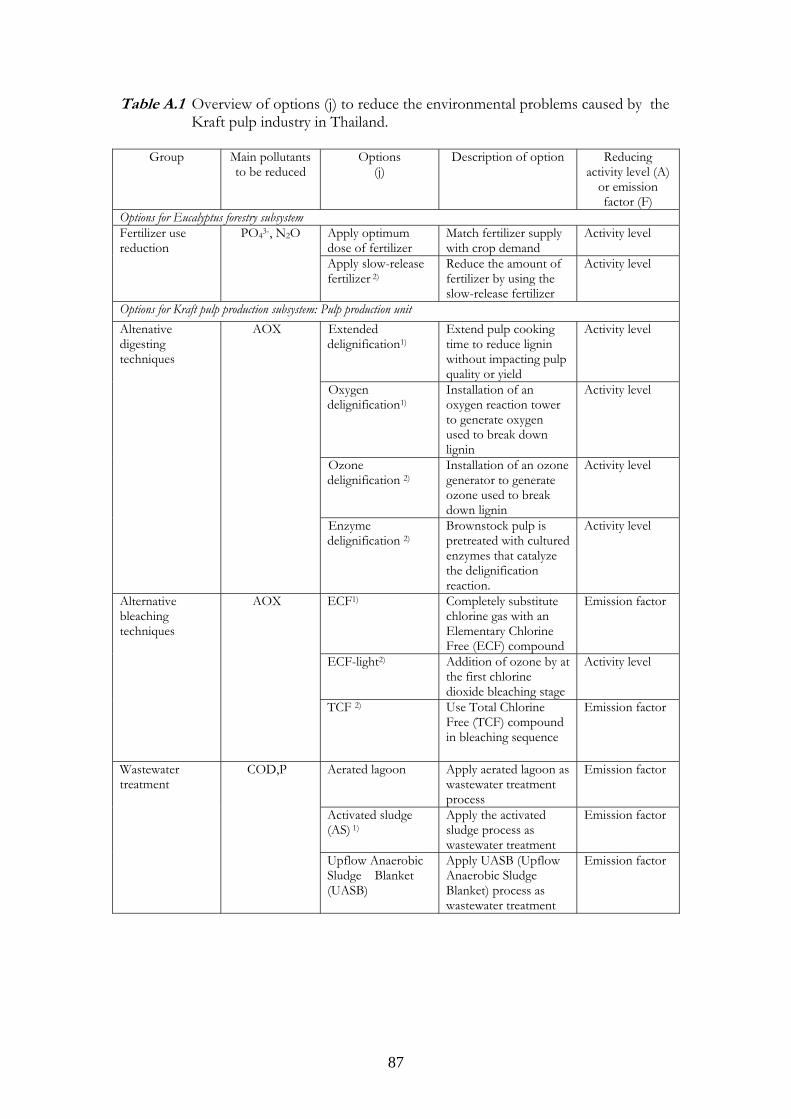
87
Table A.1 Overview of options (j) to reduce the environmental problems caused by the Kraft pulp industry in Thailand.
Group Main pollutants
to be reduced Options
(j) Description of option Reducing
activity level (A) or emission factor (F)
Options for Eucalyptus forestry subsystem Apply optimum dose of fertilizer
Match fertilizer supply with crop demand
Activity level Fertilizer use reduction
PO43-, N2O
Apply slow-release fertilizer 2)
Reduce the amount of fertilizer by using the slow-release fertilizer
Activity level
Options for Kraft pulp production subsystem: Pulp production unit Extended delignification1)
Extend pulp cooking time to reduce lignin without impacting pulp quality or yield
Activity level
Oxygen delignification1)
Installation of an oxygen reaction tower to generate oxygen used to break down lignin
Activity level
Ozone delignification 2)
Installation of an ozone generator to generate ozone used to break down lignin
Activity level
Altenative digesting techniques
AOX
Enzyme delignification 2)
Brownstock pulp is pretreated with cultured enzymes that catalyze the delignification reaction.
Activity level
ECF1) Completely substitute chlorine gas with an Elementary Chlorine Free (ECF) compound
Emission factor
ECF-light2) Addition of ozone by at the first chlorine dioxide bleaching stage
Activity level
Alternative bleaching techniques
AOX
TCF 2) Use Total Chlorine Free (TCF) compound in bleaching sequence
Emission factor
Aerated lagoon Apply aerated lagoon as wastewater treatment process
Emission factor
Activated sludge (AS) 1)
Apply the activated sludge process as wastewater treatment
Emission factor
Wastewater treatment
COD,P
Upflow Anaerobic Sludge Blanket (UASB)
Apply UASB (Upflow Anaerobic Sludge Blanket) process as wastewater treatment
Emission factor
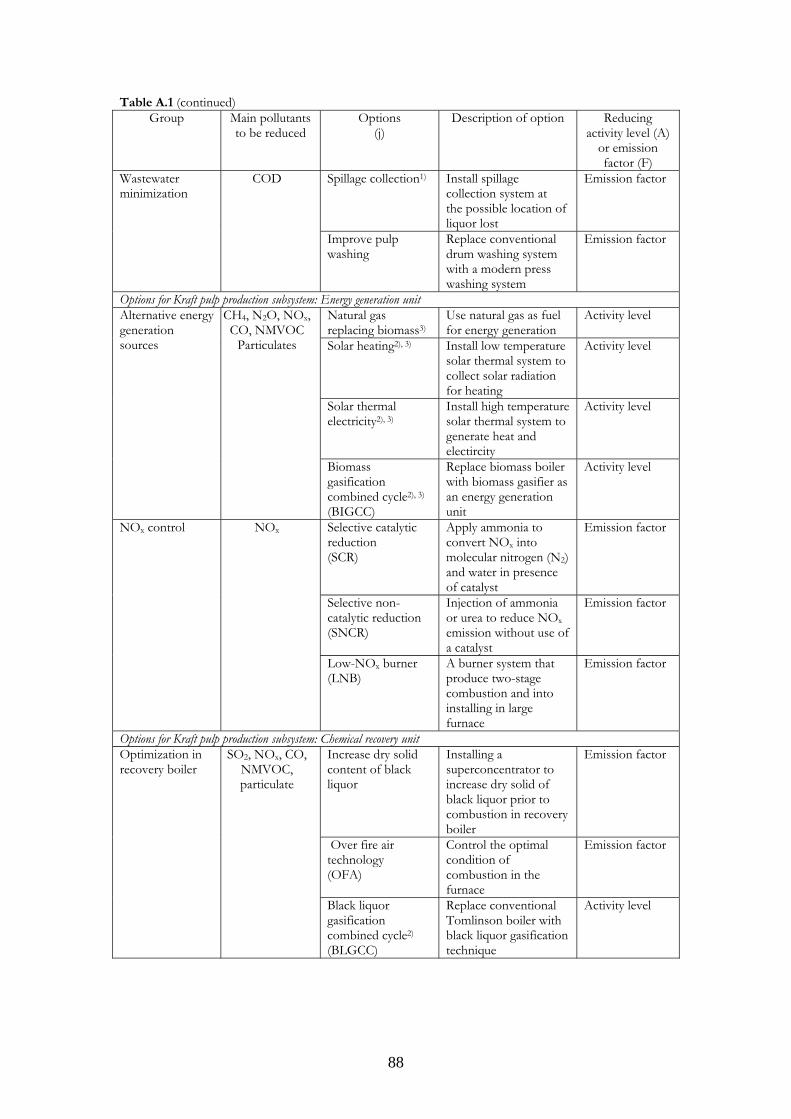
88
Table A.1 (continued) Group Main pollutants
to be reduced Options
(j) Description of option Reducing
activity level (A) or emission factor (F)
Spillage collection1) Install spillage collection system at the possible location of liquor lost
Emission factor Wastewater minimization
COD
Improve pulp washing
Replace conventional drum washing system with a modern press washing system
Emission factor
Options for Kraft pulp production subsystem: Energy generation unit Natural gas replacing biomass3)
Use natural gas as fuel for energy generation
Activity level
Solar heating2), 3) Install low temperature solar thermal system to collect solar radiation for heating
Activity level
Solar thermal electricity2), 3)
Install high temperature solar thermal system to generate heat and electircity
Activity level
Alternative energy generation sources
CH4, N2O, NOx, CO, NMVOC
Particulates
Biomass gasification combined cycle2), 3) (BIGCC)
Replace biomass boiler with biomass gasifier as an energy generation unit
Activity level
Selective catalytic reduction (SCR)
Apply ammonia to convert NOx into molecular nitrogen (N2) and water in presence of catalyst
Emission factor
Selective non-catalytic reduction (SNCR)
Injection of ammonia or urea to reduce NOx emission without use of a catalyst
Emission factor
NOx control NOx
Low-NOx burner (LNB)
A burner system that produce two-stage combustion and into installing in large furnace
Emission factor
Options for Kraft pulp production subsystem: Chemical recovery unit Increase dry solid content of black liquor
Installing a superconcentrator to increase dry solid of black liquor prior to combustion in recovery boiler
Emission factor
Over fire air technology (OFA)
Control the optimal condition of combustion in the furnace
Emission factor
Optimization in recovery boiler
SO2, NOx, CO, NMVOC, particulate
Black liquor gasification combined cycle2) (BLGCC)
Replace conventional Tomlinson boiler with black liquor gasification technique
Activity level
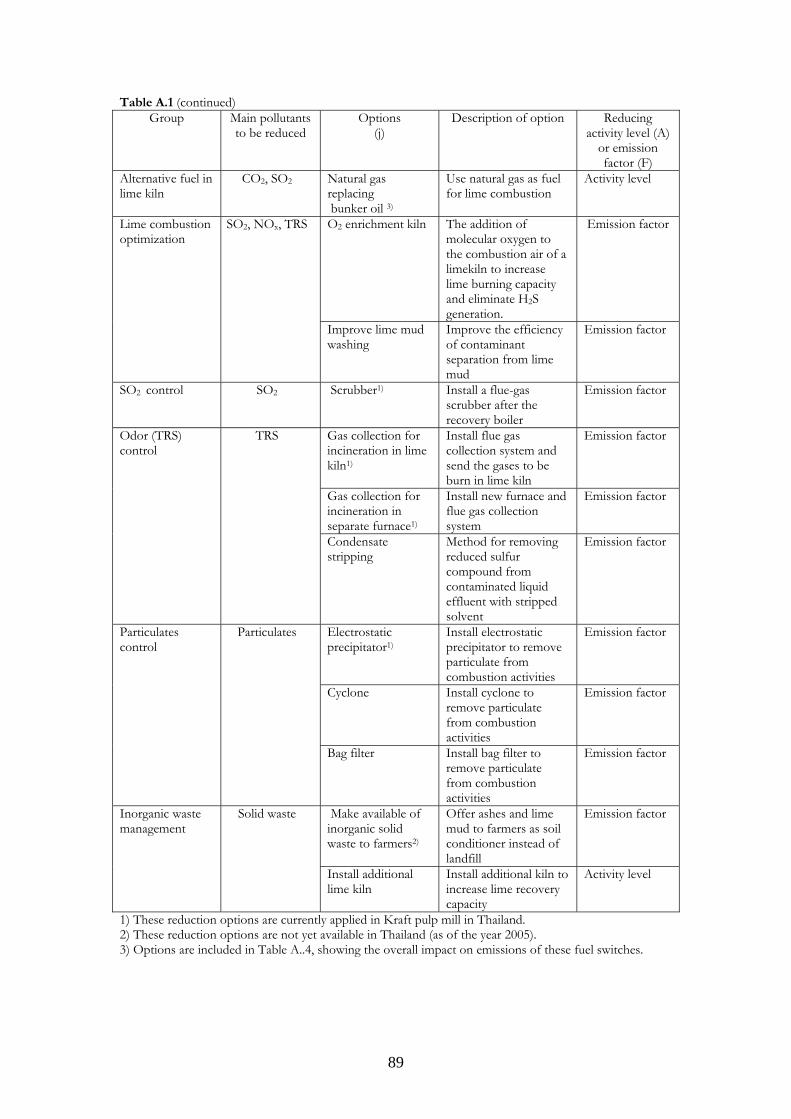
89
Table A.1 (continued) Group Main pollutants
to be reduced Options
(j) Description of option Reducing
activity level (A) or emission factor (F)
Alternative fuel in lime kiln
CO2, SO2 Natural gas replacing bunker oil 3)
Use natural gas as fuel for lime combustion
Activity level
O2 enrichment kiln The addition of molecular oxygen to the combustion air of a limekiln to increase lime burning capacity and eliminate H2S generation.
Emission factor Lime combustion optimization
SO2, NOx, TRS
Improve lime mud washing
Improve the efficiency of contaminant separation from lime mud
Emission factor
SO2 control
SO2 Scrubber1) Install a flue-gas scrubber after the recovery boiler
Emission factor
Gas collection for incineration in lime kiln1)
Install flue gas collection system and send the gases to be burn in lime kiln
Emission factor
Gas collection for incineration in separate furnace1)
Install new furnace and flue gas collection system
Emission factor
Odor (TRS) control
TRS
Condensate stripping
Method for removing reduced sulfur compound from contaminated liquid effluent with stripped solvent
Emission factor
Electrostatic precipitator1)
Install electrostatic precipitator to remove particulate from combustion activities
Emission factor
Cyclone Install cyclone to remove particulate from combustion activities
Emission factor
Particulates control
Particulates
Bag filter Install bag filter to remove particulate from combustion activities
Emission factor
Make available of inorganic solid waste to farmers2)
Offer ashes and lime mud to farmers as soil conditioner instead of landfill
Emission factor Inorganic waste management
Solid waste
Install additional lime kiln
Install additional kiln to increase lime recovery capacity
Activity level
1) These reduction options are currently applied in Kraft pulp mill in Thailand. 2) These reduction options are not yet available in Thailand (as of the year 2005). 3) Options are included in Table A..4, showing the overall impact on emissions of these fuel switches.

90

91

92
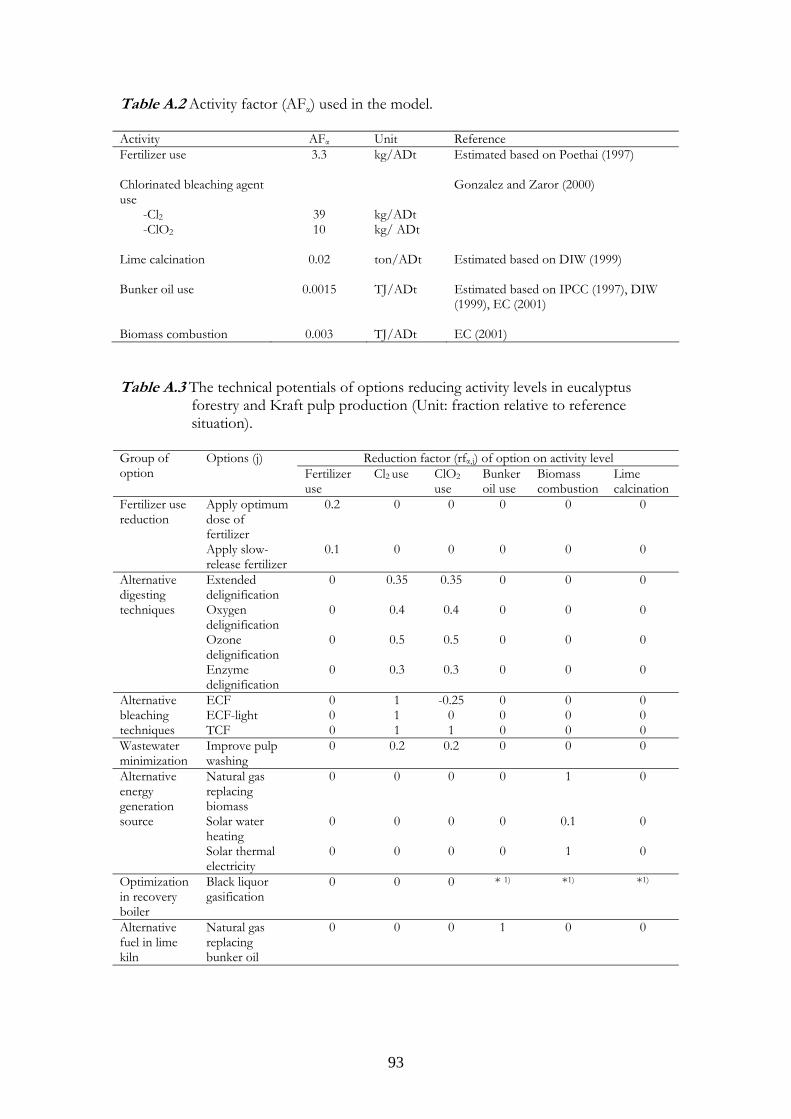
93
Table A.2 Activity factor (AFα) used in the model. Activity AFα Unit Reference Fertilizer use 3.3 kg/ADt Estimated based on Poethai (1997)
Chlorinated bleaching agent use -Cl2 39 kg/ADt -ClO2
10 kg/ ADt
Gonzalez and Zaror (2000)
Lime calcination 0.02 ton/ADt Estimated based on DIW (1999)
Bunker oil use 0.0015 TJ/ADt Estimated based on IPCC (1997), DIW (1999), EC (2001)
Biomass combustion 0.003 TJ/ADt EC (2001) Table A.3 The technical potentials of options reducing activity levels in eucalyptus
forestry and Kraft pulp production (Unit: fraction relative to reference situation).
Reduction factor (rfα,j) of option on activity level Group of
option Options (j)
Fertilizer use
Cl2 use ClO2 use
Bunker oil use
Biomass combustion
Lime calcination
Apply optimum dose of fertilizer
0.2 0 0 0 0 0 Fertilizer use reduction
Apply slow-release fertilizer
0.1 0 0 0 0 0
Extended delignification
0 0.35 0.35 0 0 0
Oxygen delignification
0 0.4 0.4 0 0 0
Ozone delignification
0 0.5 0.5 0 0 0
Alternative digesting techniques
Enzyme delignification
0 0.3 0.3 0 0 0
ECF 0 1 -0.25 0 0 0 ECF-light 0 1 0 0 0 0
Alternative bleaching techniques TCF 0 1 1 0 0 0 Wastewater minimization
Improve pulp washing
0 0.2 0.2 0 0 0
Natural gas replacing biomass
0 0 0 0 1 0
Solar water heating
0 0 0 0 0.1 0
Alternative energy generation source
Solar thermal electricity
0 0 0 0 1 0
Optimization in recovery boiler
Black liquor gasification
0 0 0 * 1) *1) *1)
Alternative fuel in lime kiln
Natural gas replacing bunker oil
0 0 0 1 0 0
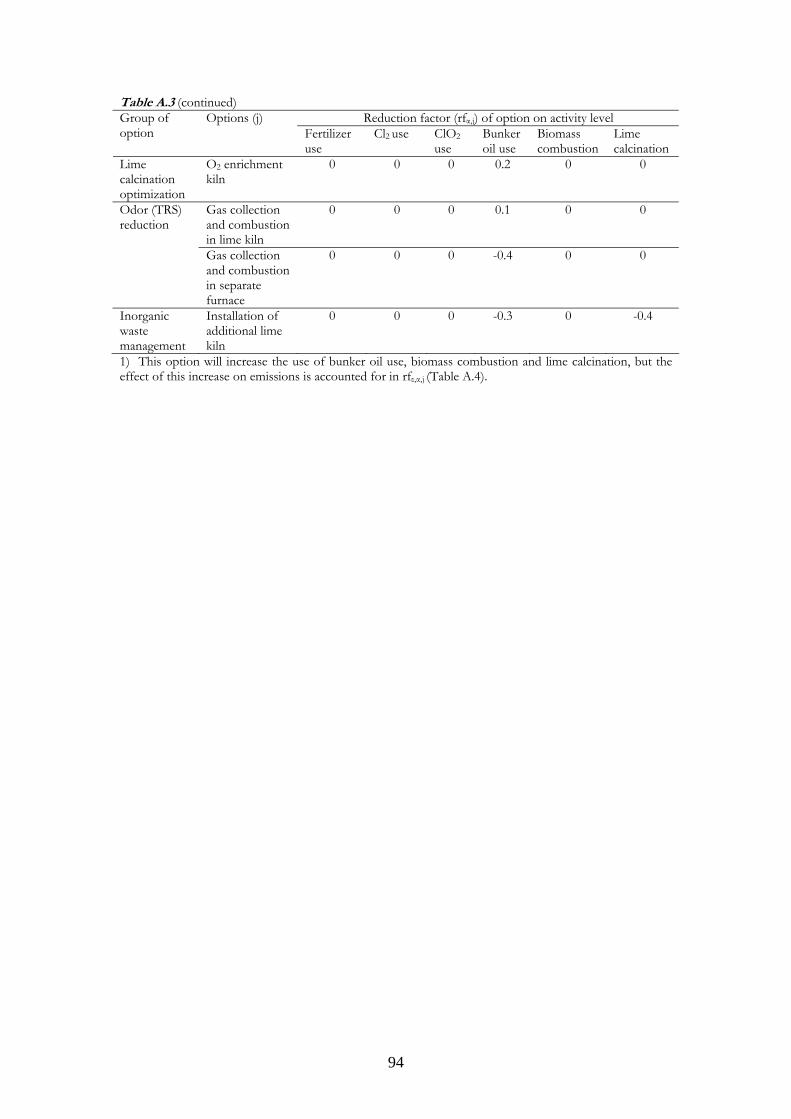
94
Table A.3 (continued) Reduction factor (rfα,j) of option on activity level Group of
option Options (j)
Fertilizer use
Cl2 use ClO2 use
Bunker oil use
Biomass combustion
Lime calcination
O2 enrichment kiln
0 0 0 0.2 0 0 Lime calcination optimization Odor (TRS) reduction
Gas collection and combustion in lime kiln
0 0 0 0.1 0 0
Gas collection and combustion in separate furnace
0 0 0 -0.4 0 0
Inorganic waste management
Installation of additional lime kiln
0 0 0 -0.3 0 -0.4
1) This option will increase the use of bunker oil use, biomass combustion and lime calcination, but the effect of this increase on emissions is accounted for in rfε,α,j (Table A.4).
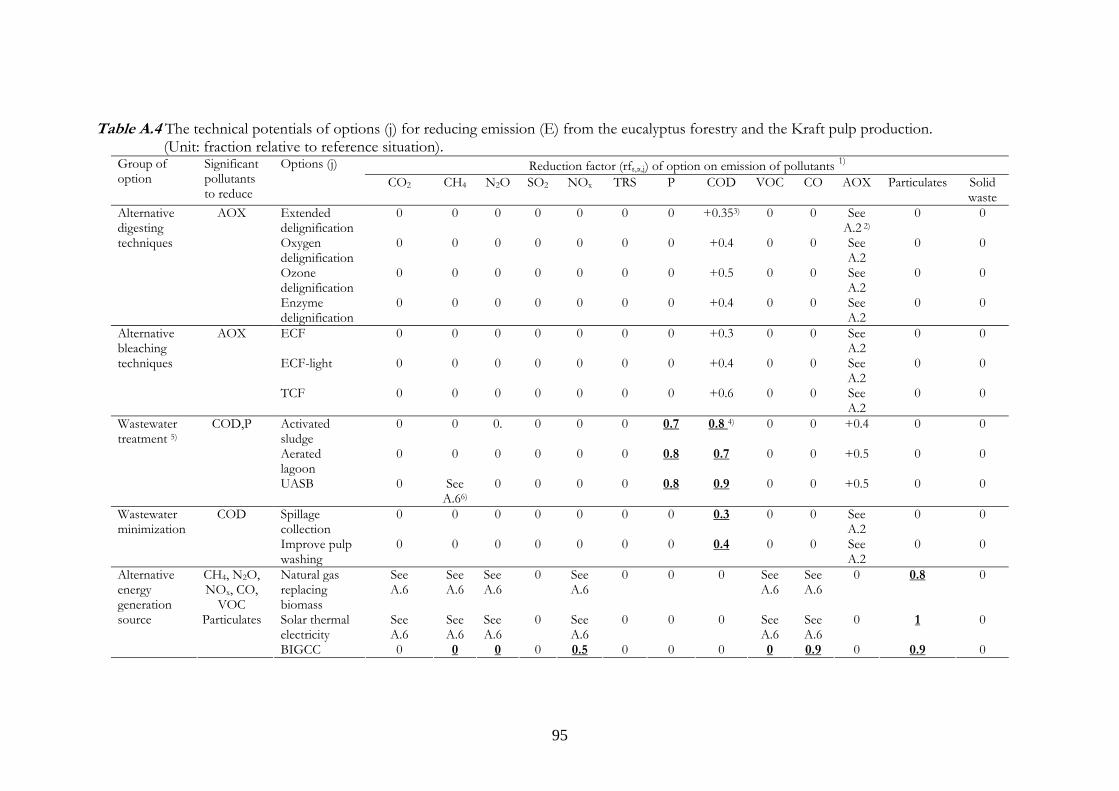
95
Table A.4 The technical potentials of options (j) for reducing emission (E) from the eucalyptus forestry and the Kraft pulp production. (Unit: fraction relative to reference situation).
Reduction factor (rfε,α,j) of option on emission of pollutants 1) Group of option
Significant pollutants to reduce
Options (j) CO2 CH4 N2O SO2 NOx TRS P COD VOC CO AOX Particulates Solid
waste Extended delignification
0 0 0 0 0 0 0 +0.353) 0 0 See A.2 2)
0 0
Oxygen delignification
0 0 0 0 0 0 0 +0.4 0 0 See A.2
0 0
Ozone delignification
0 0 0 0 0 0 0 +0.5 0 0 See A.2
0 0
Alternative digesting techniques
AOX
Enzyme delignification
0 0 0 0 0 0 0 +0.4 0 0 See A.2
0 0
ECF 0 0 0 0 0 0 0 +0.3 0 0 See A.2
0 0
ECF-light 0 0 0 0 0 0 0 +0.4 0 0 See A.2
0 0
Alternative bleaching techniques
AOX
TCF 0 0 0 0 0 0 0 +0.6 0 0 See A.2
0 0
Activated sludge
0 0 0. 0 0 0 0.7 0.8 4) 0 0 +0.4 0 0
Aerated lagoon
0 0 0 0 0 0 0.8 0.7 0 0 +0.5 0 0
Wastewater treatment 5)
COD,P
UASB 0 See A.66)
0 0 0 0 0.8 0.9 0 0 +0.5 0 0
Spillage collection
0 0 0 0 0 0 0 0.3 0 0 See A.2
0 0 Wastewater minimization
COD
Improve pulp washing
0 0 0 0 0 0 0 0.4 0 0 See A.2
0 0
Natural gas replacing biomass
See A.6
See A.6
See A.6
0 See A.6
0 0 0 See A.6
See A.6
0 0.8 0
Solar thermal electricity
See A.6
See A.6
See A.6
0 See A.6
0 0 0 See A.6
See A.6
0 1 0
Alternative energy generation source
CH4, N2O, NOx, CO,
VOC Particulates
BIGCC 0 0 0 0 0.5 0 0 0 0 0.9 0 0.9 0
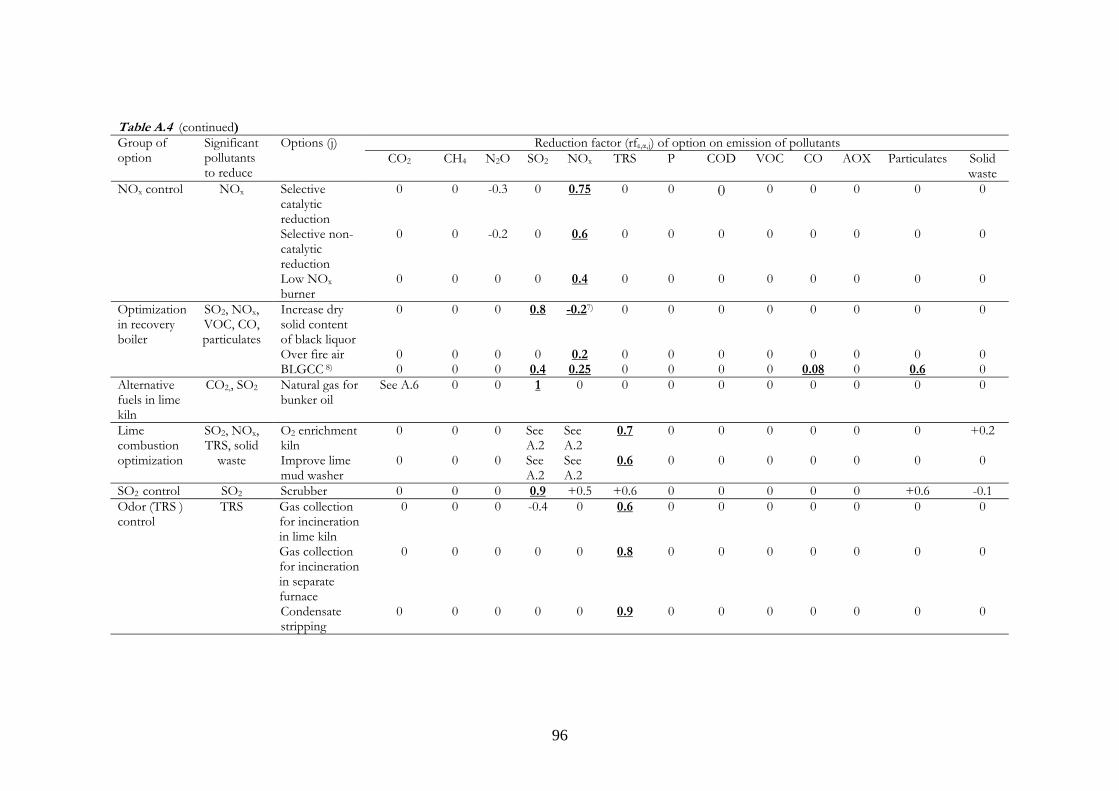
96
Table A.4 (continued) Reduction factor (rfε,α,j) of option on emission of pollutants Group of
option Significant pollutants to reduce
Options (j) CO2 CH4 N2O SO2 NOx TRS P COD VOC CO AOX Particulates Solid
waste Selective catalytic reduction
0 0 -0.3 0 0.75 0 0 0 0 0 0 0 0
Selective non-catalytic reduction
0 0 -0.2 0 0.6 0 0 0 0 0 0 0 0
NOx control NOx
Low NOx burner
0 0 0 0 0.4 0 0 0 0 0 0 0 0
Increase dry solid content of black liquor
0 0 0 0.8 -0.27) 0 0 0 0 0 0 0 0
Over fire air 0 0 0 0 0.2 0 0 0 0 0 0 0 0
Optimization in recovery boiler
SO2, NOx, VOC, CO, particulates
BLGCC 8) 0 0 0 0.4 0.25 0 0 0 0 0.08 0 0.6 0 Alternative fuels in lime kiln
CO2,, SO2
Natural gas for bunker oil
See A.6 0
0 1 0 0 0 0 0 0 0 0 0
O2 enrichment kiln
0 0 0 See A.2
See A.2
0.7 0 0 0 0 0 0 +0.2 Lime combustion optimization
SO2, NOx, TRS, solid
waste Improve lime mud washer
0 0 0 See A.2
See A.2
0.6 0 0 0 0 0 0 0
SO2 control SO2 Scrubber 0 0 0 0.9 +0.5 +0.6 0 0 0 0 0 +0.6 -0.1 Gas collection for incineration in lime kiln
0 0 0 -0.4 0 0.6 0 0 0 0 0 0 0
Gas collection for incineration in separate furnace
0 0 0 0 0 0.8 0 0 0 0 0 0 0
Odor (TRS ) control
TRS
Condensate stripping
0 0 0 0 0 0.9 0 0 0 0 0 0 0
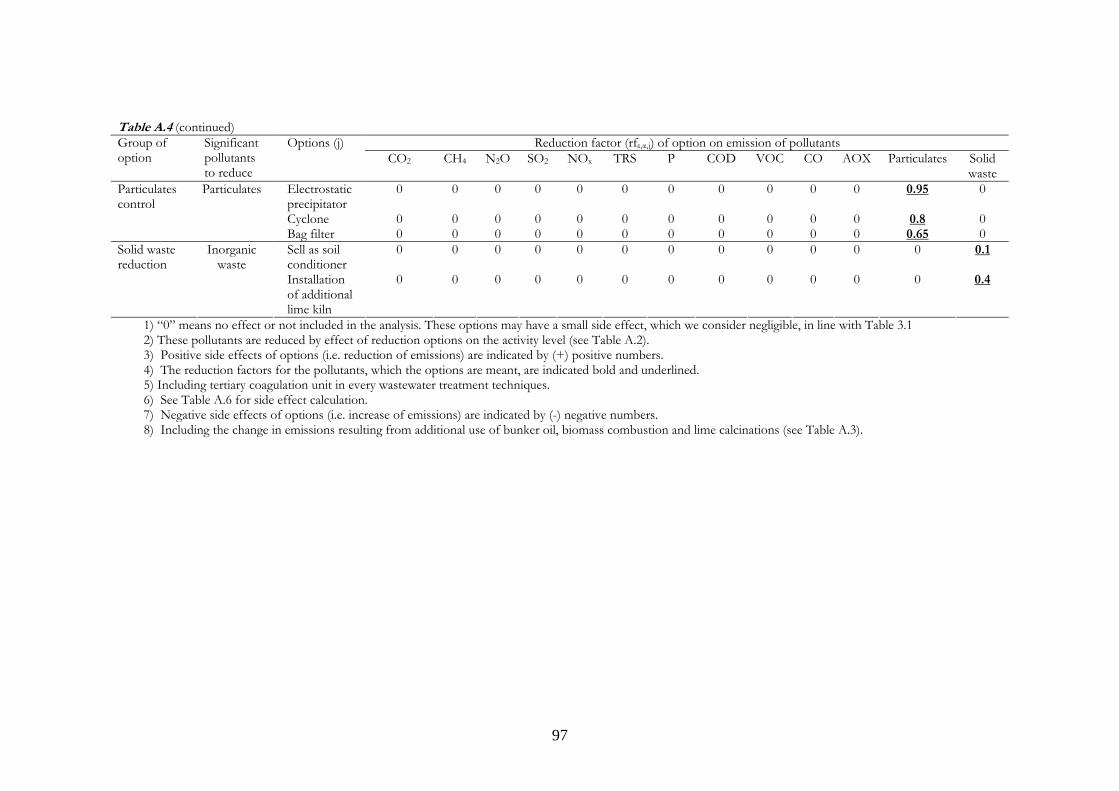
97
Table A.4 (continued) Reduction factor (rfε,α,j) of option on emission of pollutants Group of
option Significant pollutants to reduce
Options (j) CO2 CH4 N2O SO2 NOx TRS P COD VOC CO AOX Particulates Solid
waste Electrostatic precipitator
0 0 0 0 0 0 0 0 0 0 0 0.95 0
Cyclone 0 0 0 0 0 0 0 0 0 0 0 0.8 0
Particulates control
Particulates
Bag filter 0 0 0 0 0 0 0 0 0 0 0 0.65 0 Sell as soil conditioner
0 0 0 0 0 0 0 0 0 0 0 0 0.1 Solid waste reduction
Inorganic waste
Installation of additional lime kiln
0 0 0 0 0 0 0 0 0 0 0 0 0.4
1) “0” means no effect or not included in the analysis. These options may have a small side effect, which we consider negligible, in line with Table 3.1 2) These pollutants are reduced by effect of reduction options on the activity level (see Table A.2).
3) Positive side effects of options (i.e. reduction of emissions) are indicated by (+) positive numbers. 4) The reduction factors for the pollutants, which the options are meant, are indicated bold and underlined. 5) Including tertiary coagulation unit in every wastewater treatment techniques.
6) See Table A.6 for side effect calculation. 7) Negative side effects of options (i.e. increase of emissions) are indicated by (-) negative numbers. 8) Including the change in emissions resulting from additional use of bunker oil, biomass combustion and lime calcinations (see Table A.3).
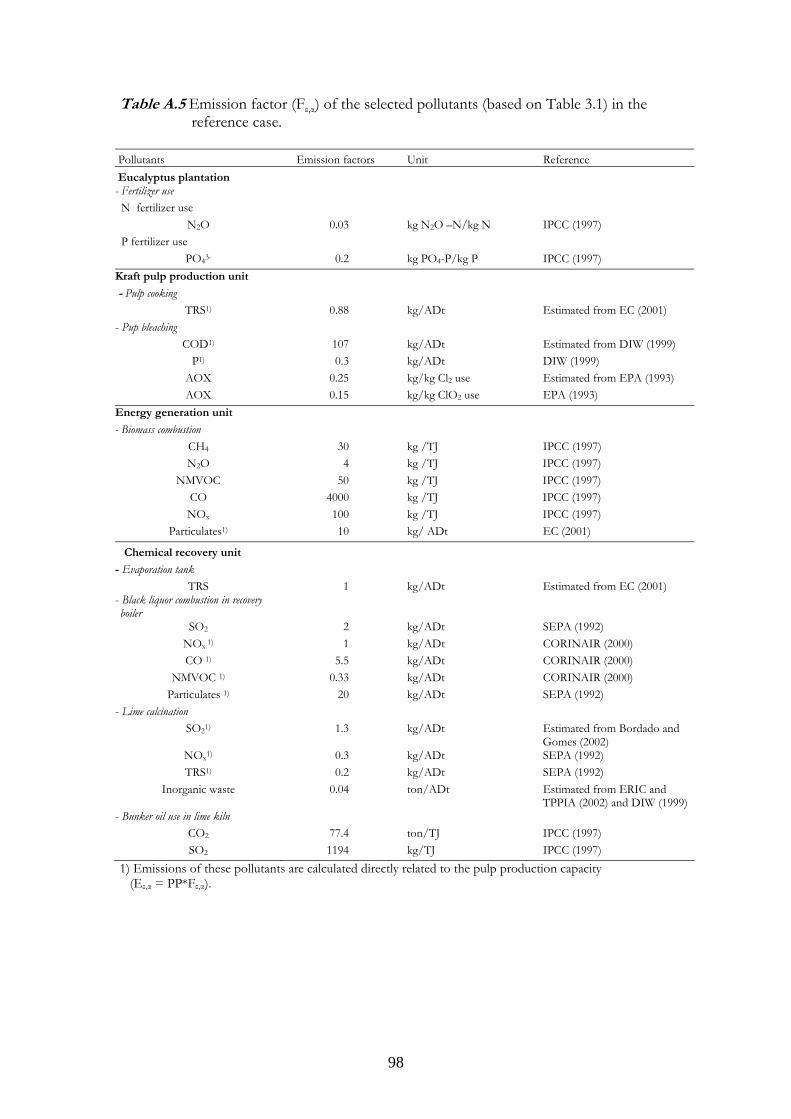
98
Table A.5 Emission factor (Fε,α) of the selected pollutants (based on Table 3.1) in the reference case.
Pollutants Emission factors Unit Reference Eucalyptus plantation - Fertilizer use N fertilizer use
N2O 0.03 kg N2O –N/kg N IPCC (1997) P fertilizer use
PO43- 0.2 kg PO4-P/kg P IPCC (1997) Kraft pulp production unit - Pulp cooking
TRS1) 0.88 kg/ADt Estimated from EC (2001) - Pup bleaching
COD1) 107 kg/ADt Estimated from DIW (1999) P1) 0.3 kg/ADt DIW (1999)
AOX 0.25 kg/kg Cl2 use Estimated from EPA (1993) AOX 0.15 kg/kg ClO2 use EPA (1993)
Energy generation unit - Biomass combustion
CH4 30 kg /TJ IPCC (1997) N2O 4 kg /TJ IPCC (1997)
NMVOC 50 kg /TJ IPCC (1997) CO 4000 kg /TJ IPCC (1997) NOx 100 kg /TJ IPCC (1997)
Particulates1) 10 kg/ ADt EC (2001)
Chemical recovery unit - Evaporation tank
TRS 1 kg/ADt Estimated from EC (2001) - Black liquor combustion in recovery boiler
SO2 2 kg/ADt SEPA (1992) NOx 1) 1 kg/ADt CORINAIR (2000) CO 1) 5.5 kg/ADt CORINAIR (2000)
NMVOC 1) 0.33 kg/ADt CORINAIR (2000) Particulates 1) 20 kg/ADt SEPA (1992)
- Lime calcination SO21) 1.3 kg/ADt Estimated from Bordado and
Gomes (2002) NOx1) 0.3 kg/ADt SEPA (1992) TRS1) 0.2 kg/ADt SEPA (1992)
Inorganic waste 0.04 ton/ADt Estimated from ERIC and TPPIA (2002) and DIW (1999)
- Bunker oil use in lime kiln CO2 77.4 ton/TJ IPCC (1997) SO2 1194 kg/TJ IPCC (1997)
1) Emissions of these pollutants are calculated directly related to the pulp production capacity (Eε,α = PP*Fε,α).
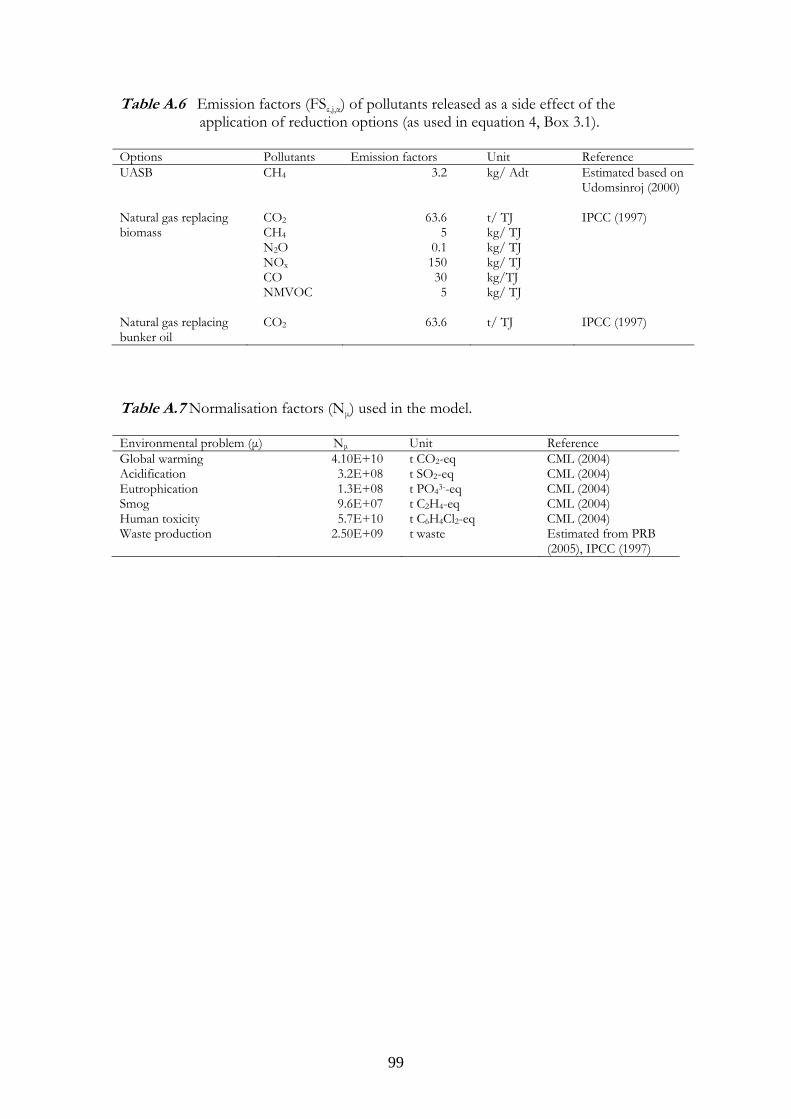
99
Table A.6 Emission factors (FSε,j,α) of pollutants released as a side effect of the application of reduction options (as used in equation 4, Box 3.1).
Options Pollutants Emission factors Unit Reference UASB CH4 3.2 kg/ Adt Estimated based on
Udomsinroj (2000)
CO2 63.6 t/ TJ CH4 5 kg/ TJ N2O 0.1 kg/ TJ NOx 150 kg/ TJ CO 30 kg/TJ
Natural gas replacing biomass
NMVOC
5 kg/ TJ
IPCC (1997)
Natural gas replacing bunker oil
CO2 63.6 t/ TJ IPCC (1997)
Table A.7 Normalisation factors (Nµ) used in the model. Environmental problem (µ) Nµ Unit Reference Global warming 4.10E+10 t CO2-eq CML (2004) Acidification 3.2E+08 t SO2-eq CML (2004) Eutrophication 1.3E+08 t PO43--eq CML (2004) Smog 9.6E+07 t C2H4-eq CML (2004) Human toxicity 5.7E+10 t C6H4Cl2-eq CML (2004) Waste production 2.50E+09 t waste Estimated from PRB
(2005), IPCC (1997)
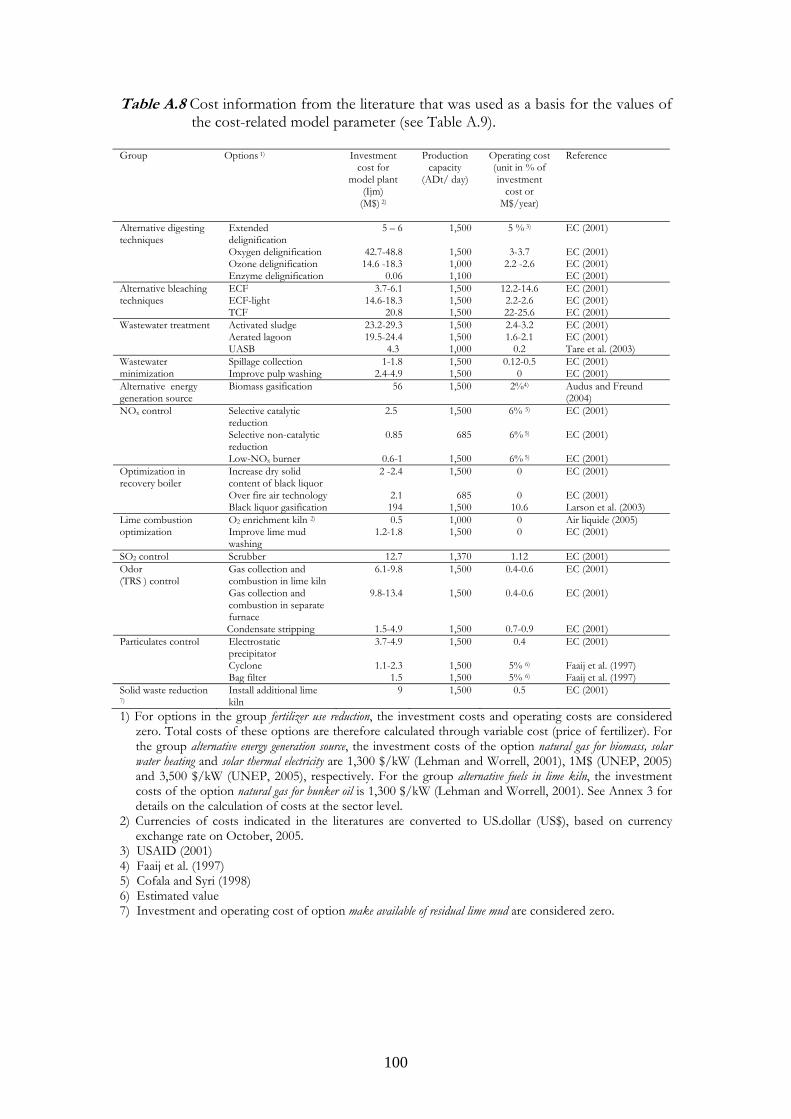
100
Table A.8 Cost information from the literature that was used as a basis for the values of the cost-related model parameter (see Table A.9).
Group Options 1) Investment
cost for model plant
(Ijm) (M$) 2)
Production capacity
(ADt/ day)
Operating cost (unit in % of investment
cost or M$/year)
Reference
Extended delignification
5 – 6 1,500 5 % 3) EC (2001)
Oxygen delignification 42.7-48.8 1,500 3-3.7 EC (2001) Ozone delignification 14.6 -18.3 1,000 2.2 -2.6 EC (2001)
Alternative digesting techniques
Enzyme delignification 0.06 1,100 EC (2001) ECF 3.7-6.1 1,500 12.2-14.6 EC (2001) ECF-light 14.6-18.3 1,500 2.2-2.6 EC (2001)
Alternative bleaching techniques
TCF 20.8 1,500 22-25.6 EC (2001) Activated sludge 23.2-29.3 1,500 2.4-3.2 EC (2001) Aerated lagoon 19.5-24.4 1,500 1.6-2.1 EC (2001)
Wastewater treatment
UASB 4.3 1,000 0.2 Tare et al. (2003) Spillage collection 1-1.8 1,500 0.12-0.5 EC (2001) Wastewater
minimization Improve pulp washing 2.4-4.9 1,500 0 EC (2001) Alternative energy generation source
Biomass gasification 56 1,500 2%4) Audus and Freund (2004)
Selective catalytic reduction
2.5 1,500 6% 5) EC (2001) Selective non-catalytic reduction
0.85 685 6% 5) EC (2001) NOx control
Low-NOx burner 0.6-1 1,500 6% 5) EC (2001) Increase dry solid content of black liquor
2 -2.4 1,500 0 EC (2001) Over fire air technology 2.1 685 0 EC (2001)
Optimization in recovery boiler
Black liquor gasification 194 1,500 10.6 Larson et al. (2003) O2 enrichment kiln 2) 0.5 1,000 0 Air liquide (2005) Lime combustion
optimization Improve lime mud washing
1.2-1.8 1,500 0 EC (2001) SO2 control Scrubber 12.7 1,370 1.12 EC (2001)
Gas collection and combustion in lime kiln
6.1-9.8 1,500 0.4-0.6 EC (2001) Gas collection and combustion in separate furnace
9.8-13.4 1,500 0.4-0.6 EC (2001) Odor (TRS ) control
Condensate stripping 1.5-4.9 1,500 0.7-0.9 EC (2001) Electrostatic precipitator
3.7-4.9 1,500 0.4 EC (2001) Cyclone 1.1-2.3 1,500 5% 6) Faaij et al. (1997)
Particulates control
Bag filter 1.5 1,500 5% 6) Faaij et al. (1997) Solid waste reduction 7)
Install additional lime kiln
9 1,500 0.5 EC (2001)
1) For options in the group fertilizer use reduction, the investment costs and operating costs are considered zero. Total costs of these options are therefore calculated through variable cost (price of fertilizer). For the group alternative energy generation source, the investment costs of the option natural gas for biomass, solar water heating and solar thermal electricity are 1,300 $/kW (Lehman and Worrell, 2001), 1M$ (UNEP, 2005) and 3,500 $/kW (UNEP, 2005), respectively. For the group alternative fuels in lime kiln, the investment costs of the option natural gas for bunker oil is 1,300 $/kW (Lehman and Worrell, 2001). See Annex 3 for details on the calculation of costs at the sector level.
2) Currencies of costs indicated in the literatures are converted to US.dollar (US$), based on currency exchange rate on October, 2005.
3) USAID (2001) 4) Faaij et al. (1997) 5) Cofala and Syri (1998) 6) Estimated value 7) Investment and operating cost of option make available of residual lime mud are considered zero.
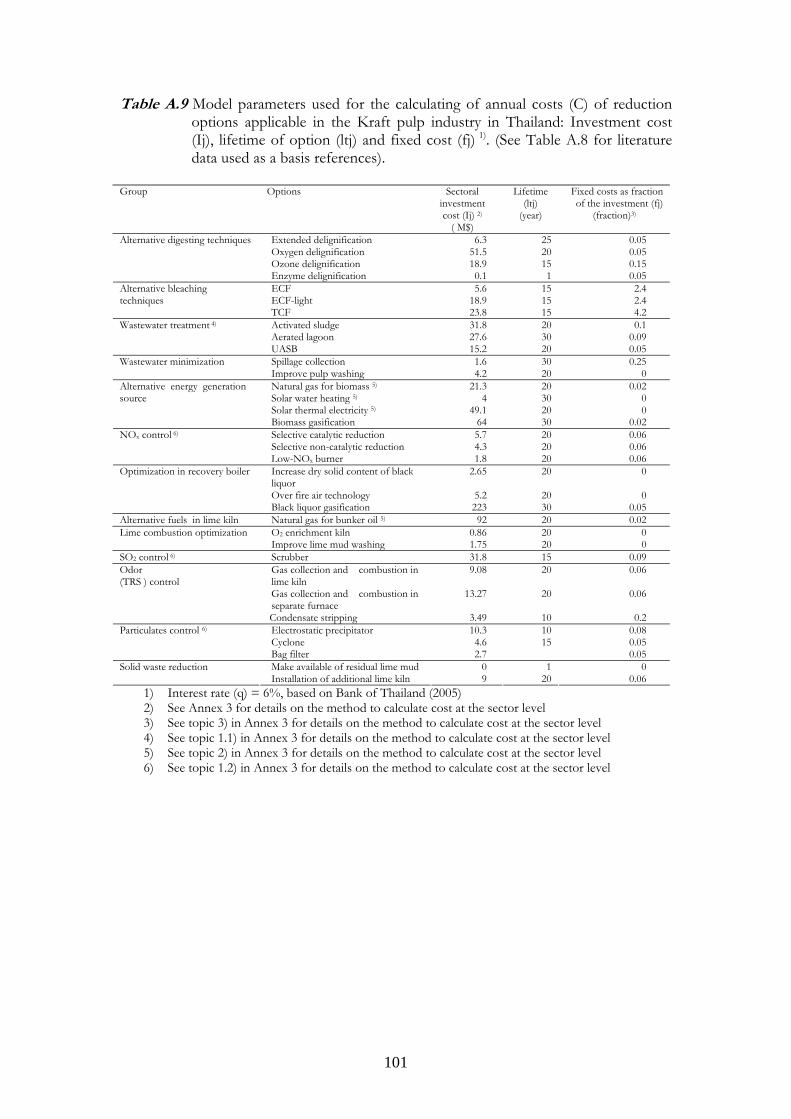
101
Table A.9 Model parameters used for the calculating of annual costs (C) of reduction options applicable in the Kraft pulp industry in Thailand: Investment cost (Ij), lifetime of option (ltj) and fixed cost (fj) 1). (See Table A.8 for literature data used as a basis references).
Group Options Sectoral
investment cost (Ij) 2)
( M$)
Lifetime (ltj)
(year)
Fixed costs as fraction of the investment (fj)
(fraction)3)
Extended delignification 6.3 25 0.05 Oxygen delignification 51.5 20 0.05 Ozone delignification 18.9 15 0.15
Alternative digesting techniques
Enzyme delignification 0.1 1 0.05 ECF 5.6 15 2.4 ECF-light 18.9 15 2.4
Alternative bleaching techniques
TCF 23.8 15 4.2 Activated sludge 31.8 20 0.1 Aerated lagoon 27.6 30 0.09
Wastewater treatment 4)
UASB 15.2 20 0.05 Spillage collection 1.6 30 0.25 Wastewater minimization Improve pulp washing 4.2 20 0 Natural gas for biomass 5) 21.3 20 0.02 Solar water heating 5) 4 30 0 Solar thermal electricity 5) 49.1 20 0
Alternative energy generation source
Biomass gasification 64 30 0.02 Selective catalytic reduction 5.7 20 0.06 Selective non-catalytic reduction 4.3 20 0.06
NOx control 6)
Low-NOx burner 1.8 20 0.06 Increase dry solid content of black liquor
2.65 20 0
Over fire air technology 5.2 20 0
Optimization in recovery boiler
Black liquor gasification 223 30 0.05 Alternative fuels in lime kiln Natural gas for bunker oil 5) 92 20 0.02
O2 enrichment kiln 0.86 20 0 Lime combustion optimization Improve lime mud washing 1.75 20 0
SO2 control 6) Scrubber 31.8 15 0.09 Gas collection and combustion in lime kiln
9.08 20 0.06
Gas collection and combustion in separate furnace
13.27 20 0.06
Odor (TRS ) control
Condensate stripping 3.49 10 0.2 Electrostatic precipitator 10.3 10 0.08 Cyclone 4.6 15 0.05
Particulates control 6)
Bag filter 2.7 0.05 Make available of residual lime mud 0 1 0 Solid waste reduction Installation of additional lime kiln 9 20 0.06
1) Interest rate (q) = 6%, based on Bank of Thailand (2005) 2) See Annex 3 for details on the method to calculate cost at the sector level 3) See topic 3) in Annex 3 for details on the method to calculate cost at the sector level 4) See topic 1.1) in Annex 3 for details on the method to calculate cost at the sector level 5) See topic 2) in Annex 3 for details on the method to calculate cost at the sector level 6) See topic 1.2) in Annex 3 for details on the method to calculate cost at the sector level
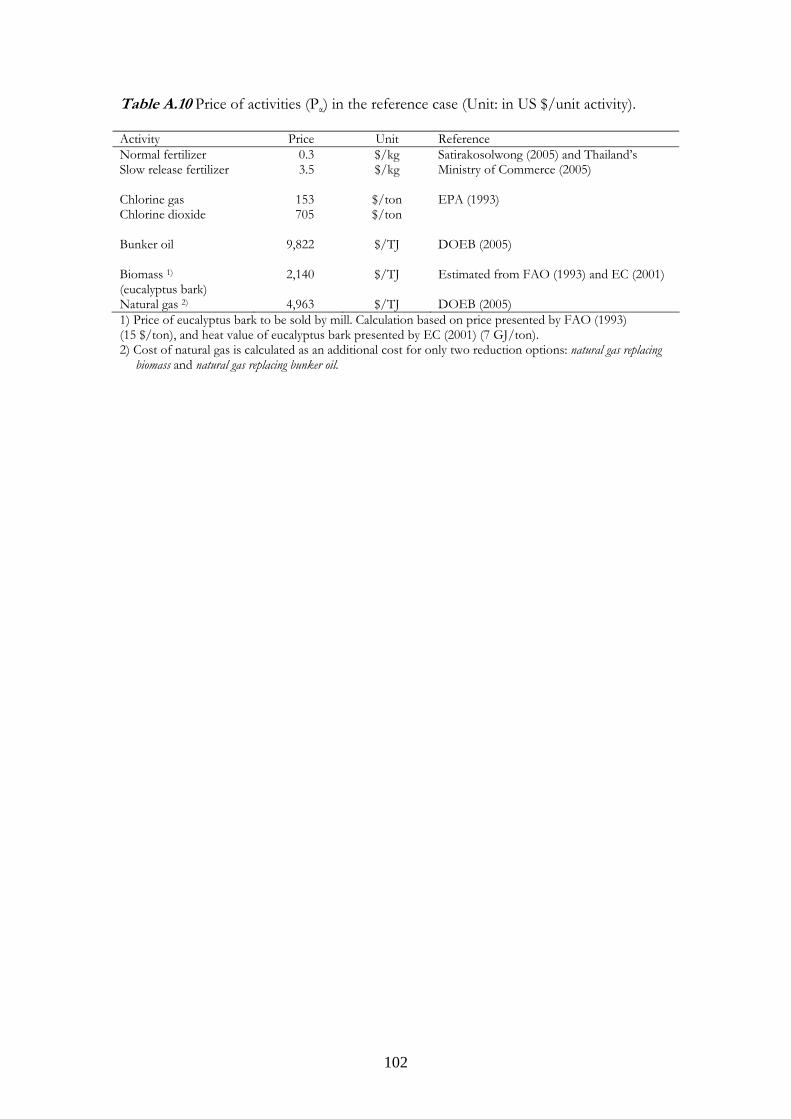
102
Table A.10 Price of activities (Pα) in the reference case (Unit: in US $/unit activity). Activity Price Unit Reference Normal fertilizer 0.3 $/kg Slow release fertilizer 3.5 $/kg
Satirakosolwong (2005) and Thailand’s Ministry of Commerce (2005)
Chlorine gas 153 $/ton Chlorine dioxide 705 $/ton
EPA (1993)
Bunker oil 9,822 $/TJ DOEB (2005)
Biomass 1)
(eucalyptus bark) 2,140 $/TJ Estimated from FAO (1993) and EC (2001)
Natural gas 2) 4,963 $/TJ DOEB (2005) 1) Price of eucalyptus bark to be sold by mill. Calculation based on price presented by FAO (1993) (15 $/ton), and heat value of eucalyptus bark presented by EC (2001) (7 GJ/ton). 2) Cost of natural gas is calculated as an additional cost for only two reduction options: natural gas replacing
biomass and natural gas replacing bunker oil.

103

104
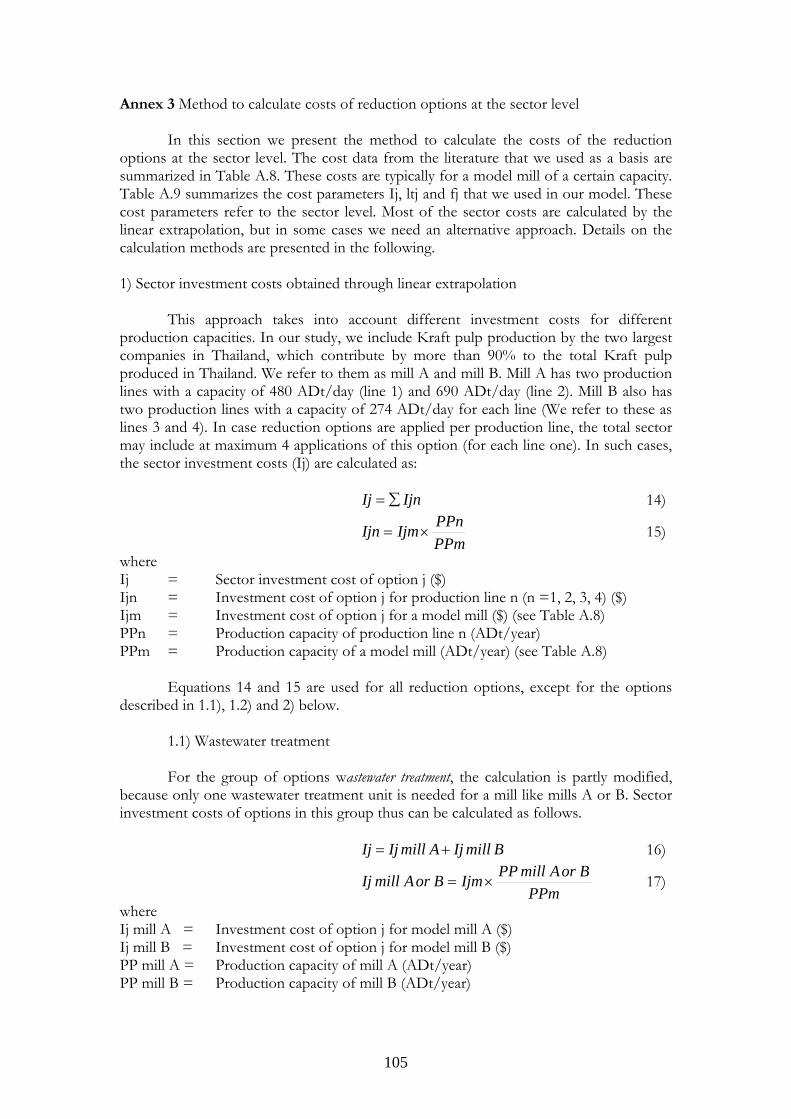
105
Annex 3 Method to calculate costs of reduction options at the sector level In this section we present the method to calculate the costs of the reduction options at the sector level. The cost data from the literature that we used as a basis are summarized in Table A.8. These costs are typically for a model mill of a certain capacity. Table A.9 summarizes the cost parameters Ij, ltj and fj that we used in our model. These cost parameters refer to the sector level. Most of the sector costs are calculated by the linear extrapolation, but in some cases we need an alternative approach. Details on the calculation methods are presented in the following. 1) Sector investment costs obtained through linear extrapolation This approach takes into account different investment costs for different production capacities. In our study, we include Kraft pulp production by the two largest companies in Thailand, which contribute by more than 90% to the total Kraft pulp produced in Thailand. We refer to them as mill A and mill B. Mill A has two production lines with a capacity of 480 ADt/day (line 1) and 690 ADt/day (line 2). Mill B also has two production lines with a capacity of 274 ADt/day for each line (We refer to these as lines 3 and 4). In case reduction options are applied per production line, the total sector may include at maximum 4 applications of this option (for each line one). In such cases, the sector investment costs (Ij) are calculated as:
IjnIj ∑= 14)
PPmPPnIjmIjn ×= 15)
where Ij = Sector investment cost of option j ($) Ijn = Investment cost of option j for production line n (n =1, 2, 3, 4) ($) Ijm = Investment cost of option j for a model mill ($) (see Table A.8) PPn = Production capacity of production line n (ADt/year) PPm = Production capacity of a model mill (ADt/year) (see Table A.8)
Equations 14 and 15 are used for all reduction options, except for the options described in 1.1), 1.2) and 2) below.
1.1) Wastewater treatment For the group of options wastewater treatment, the calculation is partly modified,
because only one wastewater treatment unit is needed for a mill like mills A or B. Sector investment costs of options in this group thus can be calculated as follows.
BmillIjAmillIjIj += 16)
PPmBorAmillPPIjmBorAmillIj ×= 17)
where Ij mill A = Investment cost of option j for model mill A ($) Ij mill B = Investment cost of option j for model mill B ($) PP mill A = Production capacity of mill A (ADt/year) PP mill B = Production capacity of mill B (ADt/year)
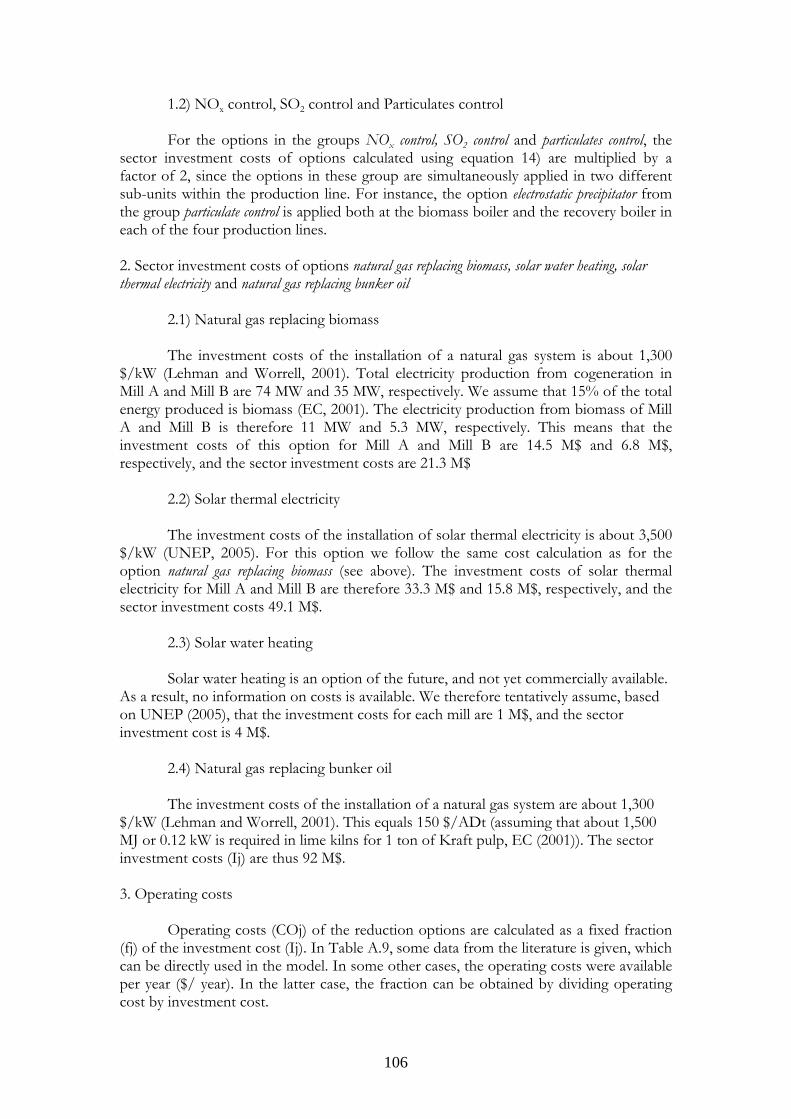
106
1.2) NOx control, SO2 control and Particulates control For the options in the groups NOx control, SO2 control and particulates control, the
sector investment costs of options calculated using equation 14) are multiplied by a factor of 2, since the options in these group are simultaneously applied in two different sub-units within the production line. For instance, the option electrostatic precipitator from the group particulate control is applied both at the biomass boiler and the recovery boiler in each of the four production lines. 2. Sector investment costs of options natural gas replacing biomass, solar water heating, solar thermal electricity and natural gas replacing bunker oil 2.1) Natural gas replacing biomass
The investment costs of the installation of a natural gas system is about 1,300 $/kW (Lehman and Worrell, 2001). Total electricity production from cogeneration in Mill A and Mill B are 74 MW and 35 MW, respectively. We assume that 15% of the total energy produced is biomass (EC, 2001). The electricity production from biomass of Mill A and Mill B is therefore 11 MW and 5.3 MW, respectively. This means that the investment costs of this option for Mill A and Mill B are 14.5 M$ and 6.8 M$, respectively, and the sector investment costs are 21.3 M$ 2.2) Solar thermal electricity
The investment costs of the installation of solar thermal electricity is about 3,500 $/kW (UNEP, 2005). For this option we follow the same cost calculation as for the option natural gas replacing biomass (see above). The investment costs of solar thermal electricity for Mill A and Mill B are therefore 33.3 M$ and 15.8 M$, respectively, and the sector investment costs 49.1 M$.
2.3) Solar water heating Solar water heating is an option of the future, and not yet commercially available. As a result, no information on costs is available. We therefore tentatively assume, based on UNEP (2005), that the investment costs for each mill are 1 M$, and the sector investment cost is 4 M$.
2.4) Natural gas replacing bunker oil
The investment costs of the installation of a natural gas system are about 1,300 $/kW (Lehman and Worrell, 2001). This equals 150 $/ADt (assuming that about 1,500 MJ or 0.12 kW is required in lime kilns for 1 ton of Kraft pulp, EC (2001)). The sector investment costs (Ij) are thus 92 M$.
3. Operating costs Operating costs (COj) of the reduction options are calculated as a fixed fraction (fj) of the investment cost (Ij). In Table A.9, some data from the literature is given, which can be directly used in the model. In some other cases, the operating costs were available per year ($/ year). In the latter case, the fraction can be obtained by dividing operating cost by investment cost.

107

108
109
Annex 4 Application of the Analytic Hierarchy Process (AHP) to generate valuation factors (Vµ) The Analytical Hierarchy Process (AHP) is a multi-criteria decision making tool that enables the user to establish weights for selected criteria by means of a series of pair wise comparisons, which involves one-on-one comparisons of the indicators. When making these comparisons preferences must be made explicit, while satisfying the reciprocal condition: If A is x time more important than B, the B is 1/x time more important that A (Vargas, 1990).
In this study valuation or weighing factors (Vµ) are established to aggregate the environmental impacts, which are global warming (GW), acidification (AD), eutrophication (EP), smog (POF), human toxicity (HT) and solid waste (SW), into a single index. The relative importance of each environmental impact may be different depending on the geographical scale that is looked at (Hermann et al., 2006). Three set of weights based on global, regional and local perspectives, which take the geographical scale of the environmental impact into account, are thus developed. This means, for instance, that global warming is assigned greater importance than human toxicity in from global perspective. Likewise, human toxicity is considered to be more important than global warming from a local perspective.
For the global perspective, the hierarchy of importance of the environmental impacts is:
Global warming> Acidification> Eutrophication> Smog> Human toxicity> Solid waste
For the regional perspective, the hierarchy of importance of the environmental impacts is:
Acidification, Eutrophication > Smog, Human toxicity > Solid waste > Global warming
For the local perspective, the hierarchy of importance of the environmental impacts is:
Human toxicity > Solid waste > Smog >Eutrophication> Acidification > Global warming
Based on these assumptions, the valuation factors (V) for each of the six environmental impact categories (µ) are calculated according to the AHP procedure described by CIFOR (1999). To this end, 6 × 6 matrices are established with numbers between 1 and 6 expressing the degree of importance of one impact relative to the others4). In the following, we present a method for valuation factors calculation for a global perspective as an example.
4 By principle, the methodology allows numbers between 1 and 9, but for this study six environmental impact are ranked resulting in numbers ranging from 1 to 6.
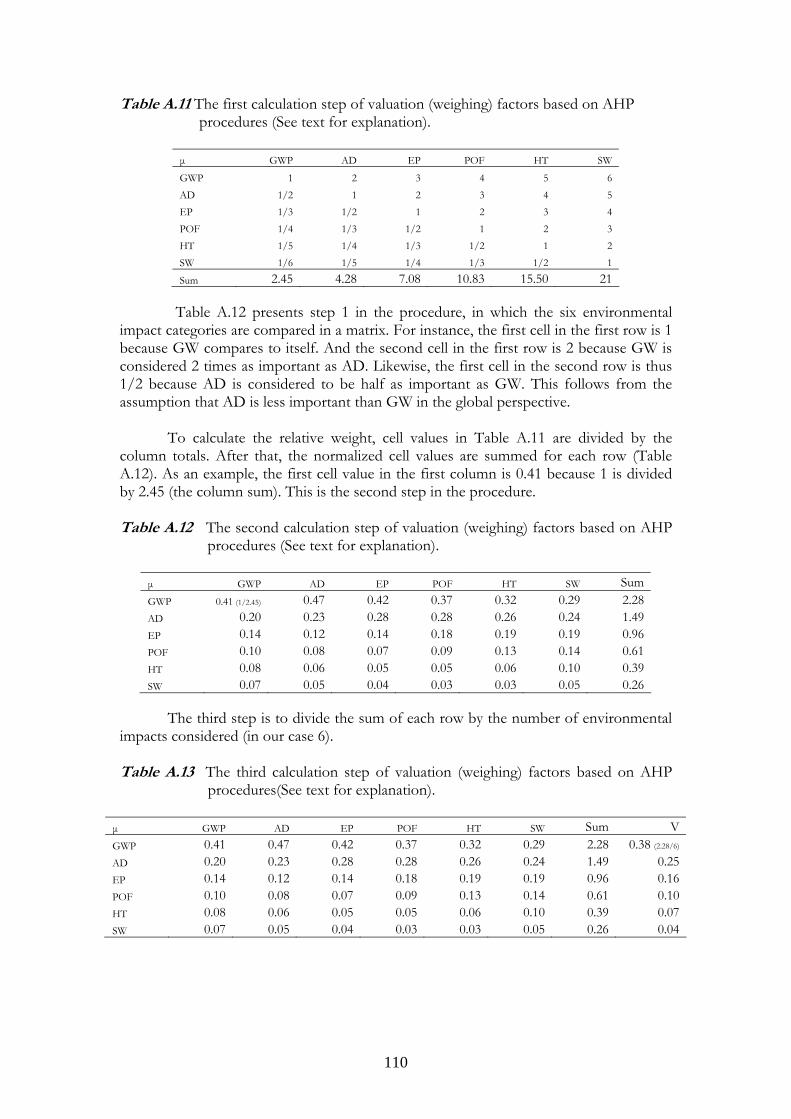
110
Table A.11 The first calculation step of valuation (weighing) factors based on AHP procedures (See text for explanation).
µ GWP AD EP POF HT SW
GWP 1 2 3 4 5 6 AD 1/2 1 2 3 4 5 EP 1/3 1/2 1 2 3 4 POF 1/4 1/3 1/2 1 2 3 HT 1/5 1/4 1/3 1/2 1 2 SW 1/6 1/5 1/4 1/3 1/2 1
Sum 2.45 4.28 7.08 10.83 15.50 21
Table A.12 presents step 1 in the procedure, in which the six environmental impact categories are compared in a matrix. For instance, the first cell in the first row is 1 because GW compares to itself. And the second cell in the first row is 2 because GW is considered 2 times as important as AD. Likewise, the first cell in the second row is thus 1/2 because AD is considered to be half as important as GW. This follows from the assumption that AD is less important than GW in the global perspective.
To calculate the relative weight, cell values in Table A.11 are divided by the column totals. After that, the normalized cell values are summed for each row (Table A.12). As an example, the first cell value in the first column is 0.41 because 1 is divided by 2.45 (the column sum). This is the second step in the procedure. Table A.12 The second calculation step of valuation (weighing) factors based on AHP
procedures (See text for explanation).
µ GWP AD EP POF HT SW Sum GWP 0.41 (1/2.45) 0.47 0.42 0.37 0.32 0.29 2.28 AD 0.20 0.23 0.28 0.28 0.26 0.24 1.49 EP 0.14 0.12 0.14 0.18 0.19 0.19 0.96 POF 0.10 0.08 0.07 0.09 0.13 0.14 0.61 HT 0.08 0.06 0.05 0.05 0.06 0.10 0.39 SW 0.07 0.05 0.04 0.03 0.03 0.05 0.26
The third step is to divide the sum of each row by the number of environmental impacts considered (in our case 6). Table A.13 The third calculation step of valuation (weighing) factors based on AHP
procedures(See text for explanation).
µ GWP AD EP POF HT SW Sum VGWP 0.41 0.47 0.42 0.37 0.32 0.29 2.28 0.38 (2.28/6)
AD 0.20 0.23 0.28 0.28 0.26 0.24 1.49 0.25EP 0.14 0.12 0.14 0.18 0.19 0.19 0.96 0.16POF 0.10 0.08 0.07 0.09 0.13 0.14 0.61 0.10HT 0.08 0.06 0.05 0.05 0.06 0.10 0.39 0.07SW 0.07 0.05 0.04 0.03 0.03 0.05 0.26 0.04
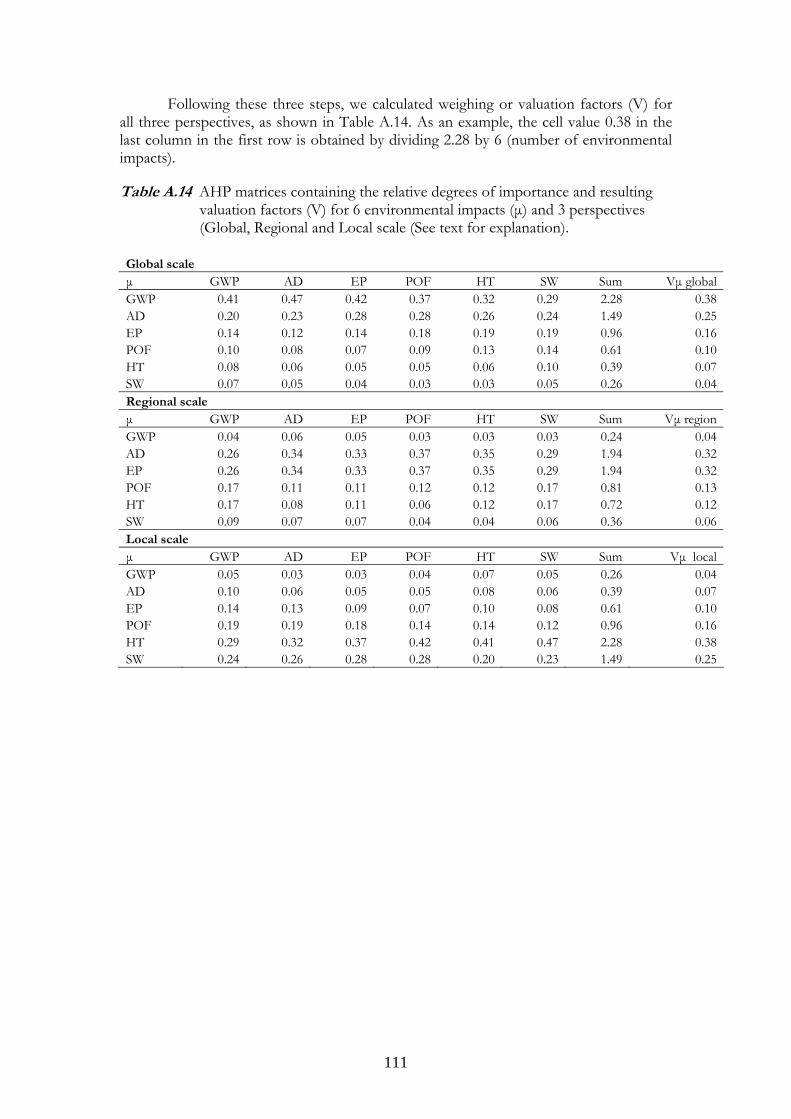
111
Following these three steps, we calculated weighing or valuation factors (V) for all three perspectives, as shown in Table A.14. As an example, the cell value 0.38 in the last column in the first row is obtained by dividing 2.28 by 6 (number of environmental impacts).
Table A.14 AHP matrices containing the relative degrees of importance and resulting valuation factors (V) for 6 environmental impacts (µ) and 3 perspectives (Global, Regional and Local scale (See text for explanation).
Global scale µ GWP AD EP POF HT SW Sum Vµ globalGWP 0.41 0.47 0.42 0.37 0.32 0.29 2.28 0.38AD 0.20 0.23 0.28 0.28 0.26 0.24 1.49 0.25EP 0.14 0.12 0.14 0.18 0.19 0.19 0.96 0.16POF 0.10 0.08 0.07 0.09 0.13 0.14 0.61 0.10HT 0.08 0.06 0.05 0.05 0.06 0.10 0.39 0.07SW 0.07 0.05 0.04 0.03 0.03 0.05 0.26 0.04Regional scale µ GWP AD EP POF HT SW Sum Vµ regionGWP 0.04 0.06 0.05 0.03 0.03 0.03 0.24 0.04AD 0.26 0.34 0.33 0.37 0.35 0.29 1.94 0.32EP 0.26 0.34 0.33 0.37 0.35 0.29 1.94 0.32POF 0.17 0.11 0.11 0.12 0.12 0.17 0.81 0.13HT 0.17 0.08 0.11 0.06 0.12 0.17 0.72 0.12SW 0.09 0.07 0.07 0.04 0.04 0.06 0.36 0.06Local scale µ GWP AD EP POF HT SW Sum Vµ localGWP 0.05 0.03 0.03 0.04 0.07 0.05 0.26 0.04AD 0.10 0.06 0.05 0.05 0.08 0.06 0.39 0.07EP 0.14 0.13 0.09 0.07 0.10 0.08 0.61 0.10POF 0.19 0.19 0.18 0.14 0.14 0.12 0.96 0.16HT 0.29 0.32 0.37 0.42 0.41 0.47 2.28 0.38SW 0.24 0.26 0.28 0.28 0.20 0.23 1.49 0.25

112

Chapter 3
This chapter has been submitted to Journal of Cleaner Production.
This chapter was presented in the international conferences Environmental Governance in Asia: Regional Perspectives on Institutional and Industrial Transformation: the 2nd Annual INREF-AGITS Conference at Asia Europe Institute, University of Malaya, Sarawak, Malaysia. November, 2004.
Warit Jawjit, Carolien Kroeze, Wit Soontaranun and Leen Hordijk

114
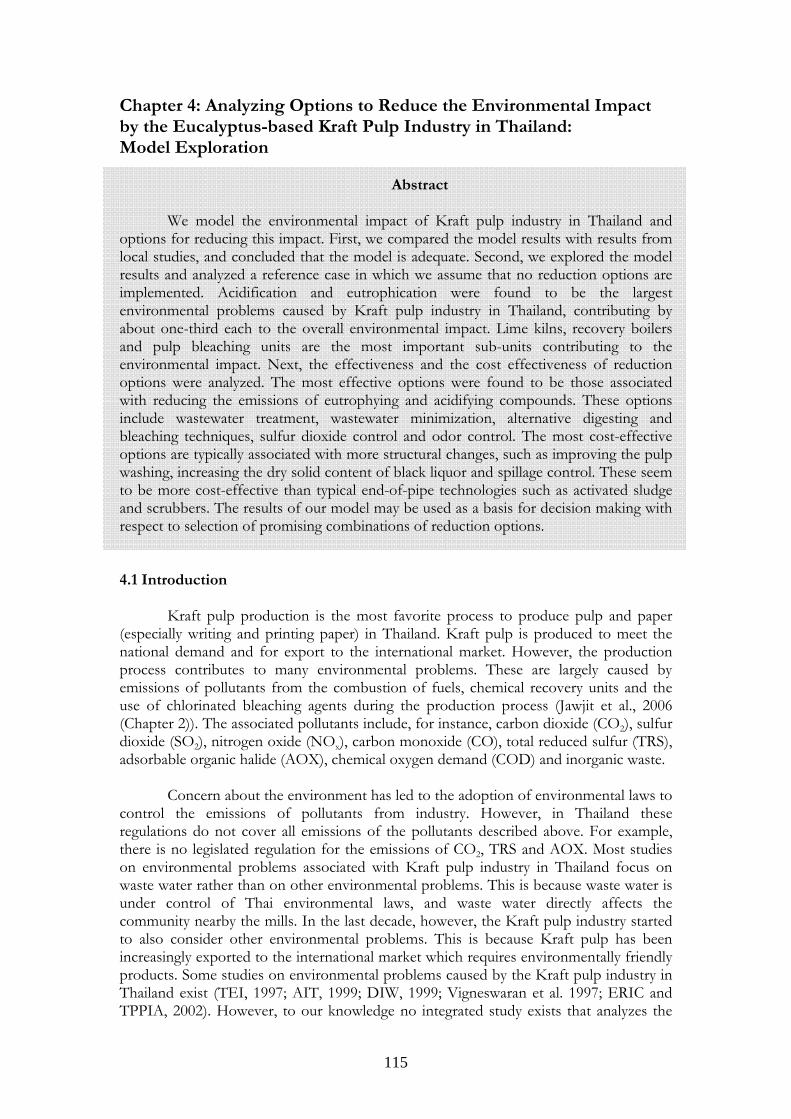
115
Chapter 4: Analyzing Options to Reduce the Environmental Impact by the Eucalyptus-based Kraft Pulp Industry in Thailand: Model Exploration
Abstract
We model the environmental impact of Kraft pulp industry in Thailand and options for reducing this impact. First, we compared the model results with results from local studies, and concluded that the model is adequate. Second, we explored the model results and analyzed a reference case in which we assume that no reduction options are implemented. Acidification and eutrophication were found to be the largest environmental problems caused by Kraft pulp industry in Thailand, contributing by about one-third each to the overall environmental impact. Lime kilns, recovery boilers and pulp bleaching units are the most important sub-units contributing to the environmental impact. Next, the effectiveness and the cost effectiveness of reduction options were analyzed. The most effective options were found to be those associated with reducing the emissions of eutrophying and acidifying compounds. These options include wastewater treatment, wastewater minimization, alternative digesting and bleaching techniques, sulfur dioxide control and odor control. The most cost-effective options are typically associated with more structural changes, such as improving the pulp washing, increasing the dry solid content of black liquor and spillage control. These seem to be more cost-effective than typical end-of-pipe technologies such as activated sludge and scrubbers. The results of our model may be used as a basis for decision making with respect to selection of promising combinations of reduction options.
4.1 Introduction Kraft pulp production is the most favorite process to produce pulp and paper (especially writing and printing paper) in Thailand. Kraft pulp is produced to meet the national demand and for export to the international market. However, the production process contributes to many environmental problems. These are largely caused by emissions of pollutants from the combustion of fuels, chemical recovery units and the use of chlorinated bleaching agents during the production process (Jawjit et al., 2006 (Chapter 2)). The associated pollutants include, for instance, carbon dioxide (CO2), sulfur dioxide (SO2), nitrogen oxide (NOx), carbon monoxide (CO), total reduced sulfur (TRS), adsorbable organic halide (AOX), chemical oxygen demand (COD) and inorganic waste. Concern about the environment has led to the adoption of environmental laws to control the emissions of pollutants from industry. However, in Thailand these regulations do not cover all emissions of the pollutants described above. For example, there is no legislated regulation for the emissions of CO2, TRS and AOX. Most studies on environmental problems associated with Kraft pulp industry in Thailand focus on waste water rather than on other environmental problems. This is because waste water is under control of Thai environmental laws, and waste water directly affects the community nearby the mills. In the last decade, however, the Kraft pulp industry started to also consider other environmental problems. This is because Kraft pulp has been increasingly exported to the international market which requires environmentally friendly products. Some studies on environmental problems caused by the Kraft pulp industry in Thailand exist (TEI, 1997; AIT, 1999; DIW, 1999; Vigneswaran et al. 1997; ERIC and TPPIA, 2002). However, to our knowledge no integrated study exists that analyzes the
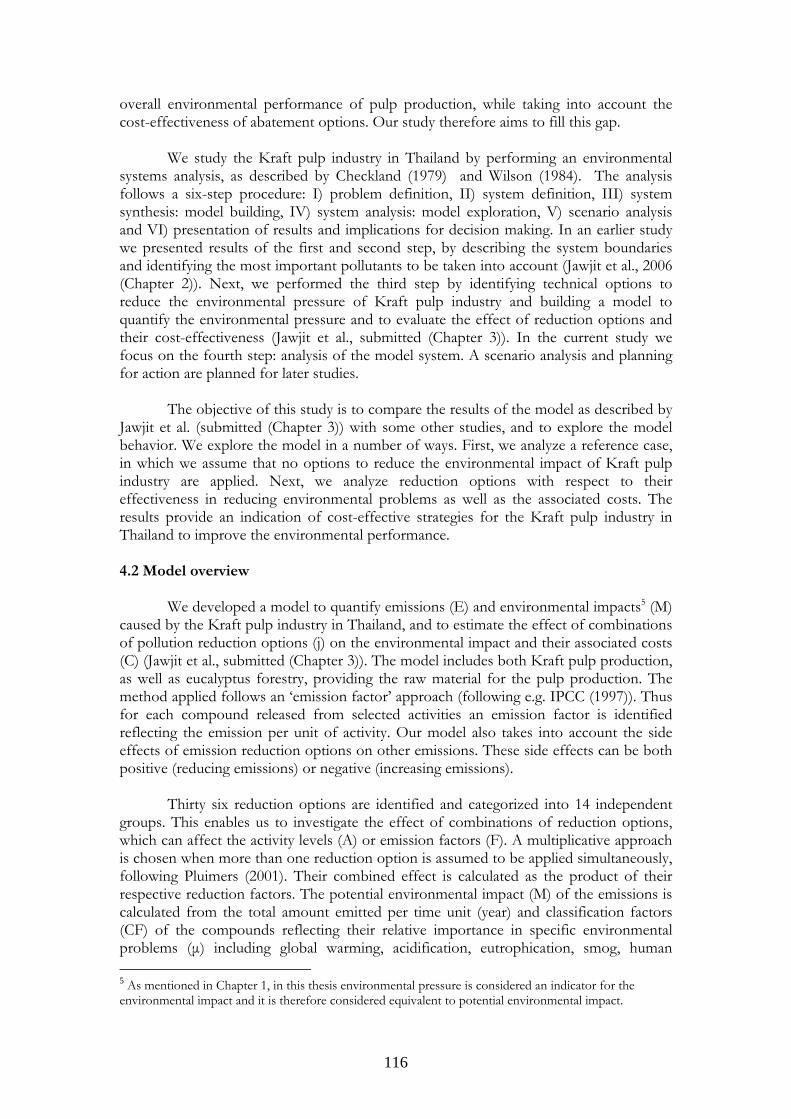
116
overall environmental performance of pulp production, while taking into account the cost-effectiveness of abatement options. Our study therefore aims to fill this gap. We study the Kraft pulp industry in Thailand by performing an environmental systems analysis, as described by Checkland (1979) and Wilson (1984). The analysis follows a six-step procedure: I) problem definition, II) system definition, III) system synthesis: model building, IV) system analysis: model exploration, V) scenario analysis and VI) presentation of results and implications for decision making. In an earlier study we presented results of the first and second step, by describing the system boundaries and identifying the most important pollutants to be taken into account (Jawjit et al., 2006 (Chapter 2)). Next, we performed the third step by identifying technical options to reduce the environmental pressure of Kraft pulp industry and building a model to quantify the environmental pressure and to evaluate the effect of reduction options and their cost-effectiveness (Jawjit et al., submitted (Chapter 3)). In the current study we focus on the fourth step: analysis of the model system. A scenario analysis and planning for action are planned for later studies. The objective of this study is to compare the results of the model as described by Jawjit et al. (submitted (Chapter 3)) with some other studies, and to explore the model behavior. We explore the model in a number of ways. First, we analyze a reference case, in which we assume that no options to reduce the environmental impact of Kraft pulp industry are applied. Next, we analyze reduction options with respect to their effectiveness in reducing environmental problems as well as the associated costs. The results provide an indication of cost-effective strategies for the Kraft pulp industry in Thailand to improve the environmental performance. 4.2 Model overview
We developed a model to quantify emissions (E) and environmental impacts5 (M) caused by the Kraft pulp industry in Thailand, and to estimate the effect of combinations of pollution reduction options (j) on the environmental impact and their associated costs (C) (Jawjit et al., submitted (Chapter 3)). The model includes both Kraft pulp production, as well as eucalyptus forestry, providing the raw material for the pulp production. The method applied follows an ‘emission factor’ approach (following e.g. IPCC (1997)). Thus for each compound released from selected activities an emission factor is identified reflecting the emission per unit of activity. Our model also takes into account the side effects of emission reduction options on other emissions. These side effects can be both positive (reducing emissions) or negative (increasing emissions).
Thirty six reduction options are identified and categorized into 14 independent
groups. This enables us to investigate the effect of combinations of reduction options, which can affect the activity levels (A) or emission factors (F). A multiplicative approach is chosen when more than one reduction option is assumed to be applied simultaneously, following Pluimers (2001). Their combined effect is calculated as the product of their respective reduction factors. The potential environmental impact (M) of the emissions is calculated from the total amount emitted per time unit (year) and classification factors (CF) of the compounds reflecting their relative importance in specific environmental problems (µ) including global warming, acidification, eutrophication, smog, human 5 As mentioned in Chapter 1, in this thesis environmental pressure is considered an indicator for the environmental impact and it is therefore considered equivalent to potential environmental impact.
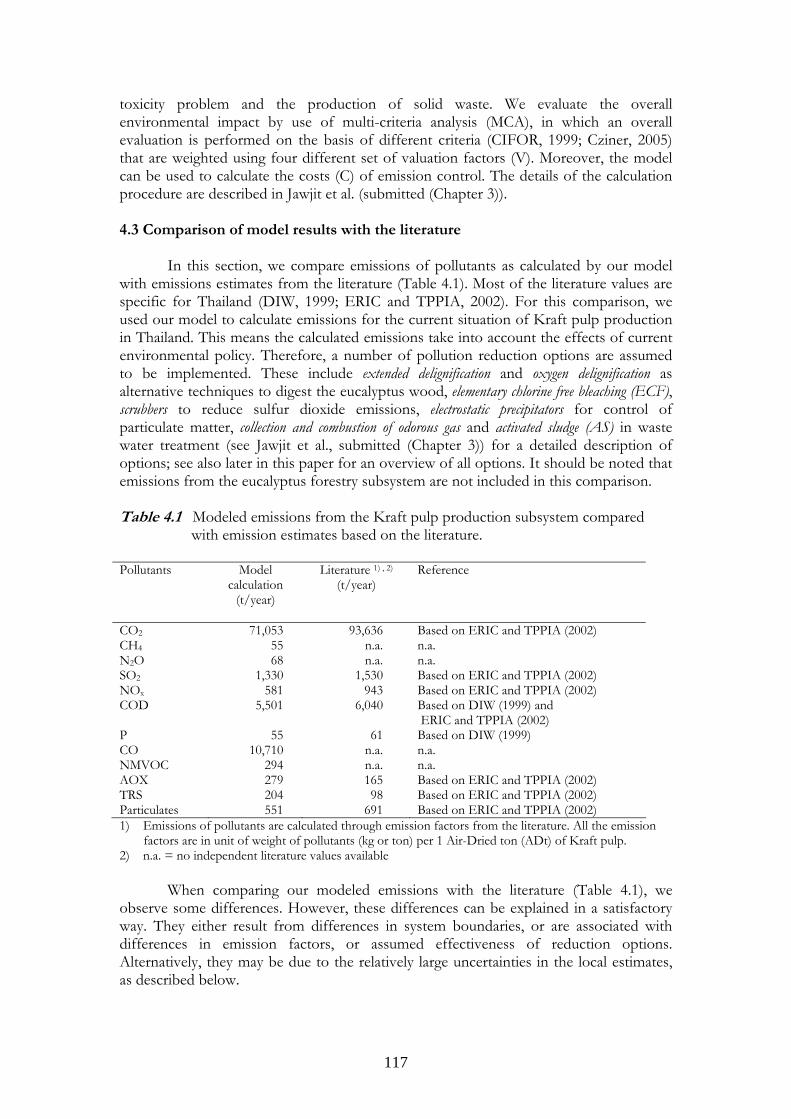
117
toxicity problem and the production of solid waste. We evaluate the overall environmental impact by use of multi-criteria analysis (MCA), in which an overall evaluation is performed on the basis of different criteria (CIFOR, 1999; Cziner, 2005) that are weighted using four different set of valuation factors (V). Moreover, the model can be used to calculate the costs (C) of emission control. The details of the calculation procedure are described in Jawjit et al. (submitted (Chapter 3)).
4.3 Comparison of model results with the literature
In this section, we compare emissions of pollutants as calculated by our model
with emissions estimates from the literature (Table 4.1). Most of the literature values are specific for Thailand (DIW, 1999; ERIC and TPPIA, 2002). For this comparison, we used our model to calculate emissions for the current situation of Kraft pulp production in Thailand. This means the calculated emissions take into account the effects of current environmental policy. Therefore, a number of pollution reduction options are assumed to be implemented. These include extended delignification and oxygen delignification as alternative techniques to digest the eucalyptus wood, elementary chlorine free bleaching (ECF), scrubbers to reduce sulfur dioxide emissions, electrostatic precipitators for control of particulate matter, collection and combustion of odorous gas and activated sludge (AS) in waste water treatment (see Jawjit et al., submitted (Chapter 3)) for a detailed description of options; see also later in this paper for an overview of all options. It should be noted that emissions from the eucalyptus forestry subsystem are not included in this comparison.
Table 4.1 Modeled emissions from the Kraft pulp production subsystem compared
with emission estimates based on the literature. Pollutants Model
calculation (t/year)
Literature 1) , 2)
(t/year) Reference
CO2 71,053 93,636 Based on ERIC and TPPIA (2002) CH4 55 n.a. n.a. N2O 68 n.a. n.a. SO2 1,330 1,530 Based on ERIC and TPPIA (2002) NOx 581 943 Based on ERIC and TPPIA (2002) COD 5,501 6,040 Based on DIW (1999) and
ERIC and TPPIA (2002) P 55 61 Based on DIW (1999) CO 10,710 n.a. n.a. NMVOC 294 n.a. n.a. AOX 279 165 Based on ERIC and TPPIA (2002) TRS 204 98 Based on ERIC and TPPIA (2002) Particulates 551 691 Based on ERIC and TPPIA (2002) 1) Emissions of pollutants are calculated through emission factors from the literature. All the emission
factors are in unit of weight of pollutants (kg or ton) per 1 Air-Dried ton (ADt) of Kraft pulp. 2) n.a. = no independent literature values available When comparing our modeled emissions with the literature (Table 4.1), we observe some differences. However, these differences can be explained in a satisfactory way. They either result from differences in system boundaries, or are associated with differences in emission factors, or assumed effectiveness of reduction options. Alternatively, they may be due to the relatively large uncertainties in the local estimates, as described below.
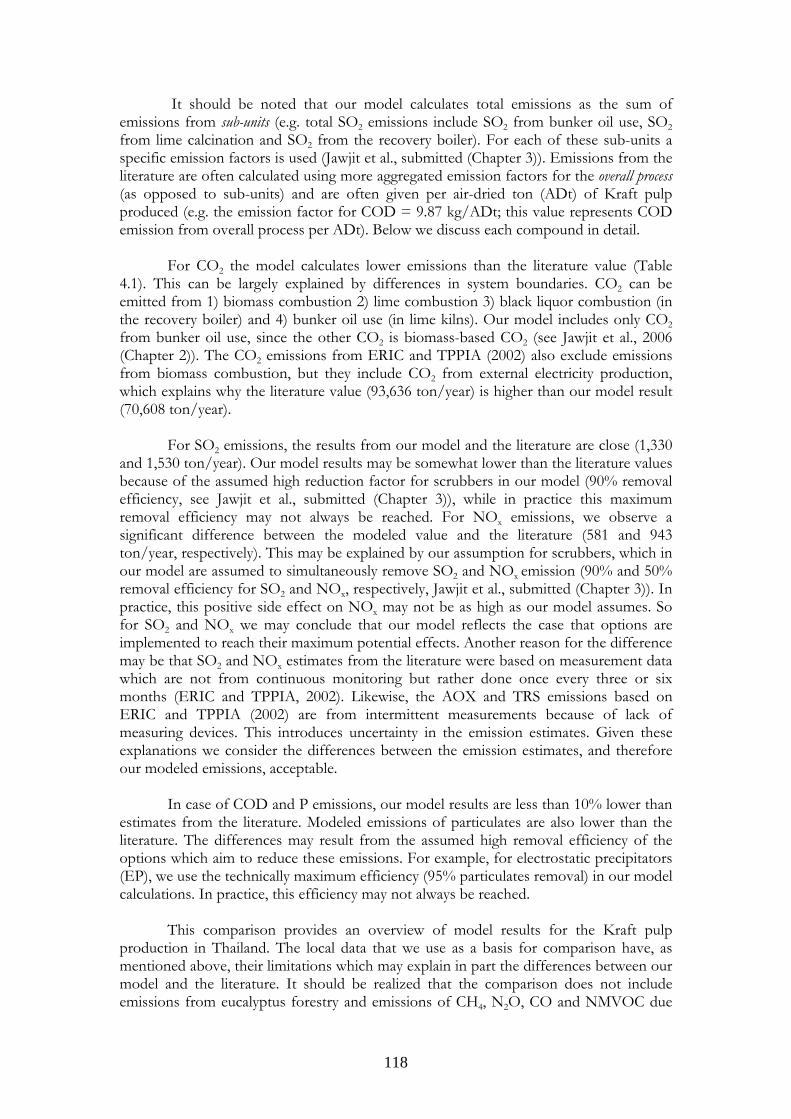
118
It should be noted that our model calculates total emissions as the sum of emissions from sub-units (e.g. total SO2 emissions include SO2 from bunker oil use, SO2 from lime calcination and SO2 from the recovery boiler). For each of these sub-units a specific emission factors is used (Jawjit et al., submitted (Chapter 3)). Emissions from the literature are often calculated using more aggregated emission factors for the overall process (as opposed to sub-units) and are often given per air-dried ton (ADt) of Kraft pulp produced (e.g. the emission factor for COD = 9.87 kg/ADt; this value represents COD emission from overall process per ADt). Below we discuss each compound in detail.
For CO2 the model calculates lower emissions than the literature value (Table 4.1). This can be largely explained by differences in system boundaries. CO2 can be emitted from 1) biomass combustion 2) lime combustion 3) black liquor combustion (in the recovery boiler) and 4) bunker oil use (in lime kilns). Our model includes only CO2 from bunker oil use, since the other CO2 is biomass-based CO2 (see Jawjit et al., 2006 (Chapter 2)). The CO2 emissions from ERIC and TPPIA (2002) also exclude emissions from biomass combustion, but they include CO2 from external electricity production, which explains why the literature value (93,636 ton/year) is higher than our model result (70,608 ton/year).
For SO2 emissions, the results from our model and the literature are close (1,330
and 1,530 ton/year). Our model results may be somewhat lower than the literature values because of the assumed high reduction factor for scrubbers in our model (90% removal efficiency, see Jawjit et al., submitted (Chapter 3)), while in practice this maximum removal efficiency may not always be reached. For NOx emissions, we observe a significant difference between the modeled value and the literature (581 and 943 ton/year, respectively). This may be explained by our assumption for scrubbers, which in our model are assumed to simultaneously remove SO2 and NOx emission (90% and 50% removal efficiency for SO2 and NOx, respectively, Jawjit et al., submitted (Chapter 3)). In practice, this positive side effect on NOx may not be as high as our model assumes. So for SO2 and NOx we may conclude that our model reflects the case that options are implemented to reach their maximum potential effects. Another reason for the difference may be that SO2 and NOx estimates from the literature were based on measurement data which are not from continuous monitoring but rather done once every three or six months (ERIC and TPPIA, 2002). Likewise, the AOX and TRS emissions based on ERIC and TPPIA (2002) are from intermittent measurements because of lack of measuring devices. This introduces uncertainty in the emission estimates. Given these explanations we consider the differences between the emission estimates, and therefore our modeled emissions, acceptable.
In case of COD and P emissions, our model results are less than 10% lower than
estimates from the literature. Modeled emissions of particulates are also lower than the literature. The differences may result from the assumed high removal efficiency of the options which aim to reduce these emissions. For example, for electrostatic precipitators (EP), we use the technically maximum efficiency (95% particulates removal) in our model calculations. In practice, this efficiency may not always be reached.
This comparison provides an overview of model results for the Kraft pulp production in Thailand. The local data that we use as a basis for comparison have, as mentioned above, their limitations which may explain in part the differences between our model and the literature. It should be realized that the comparison does not include emissions from eucalyptus forestry and emissions of CH4, N2O, CO and NMVOC due
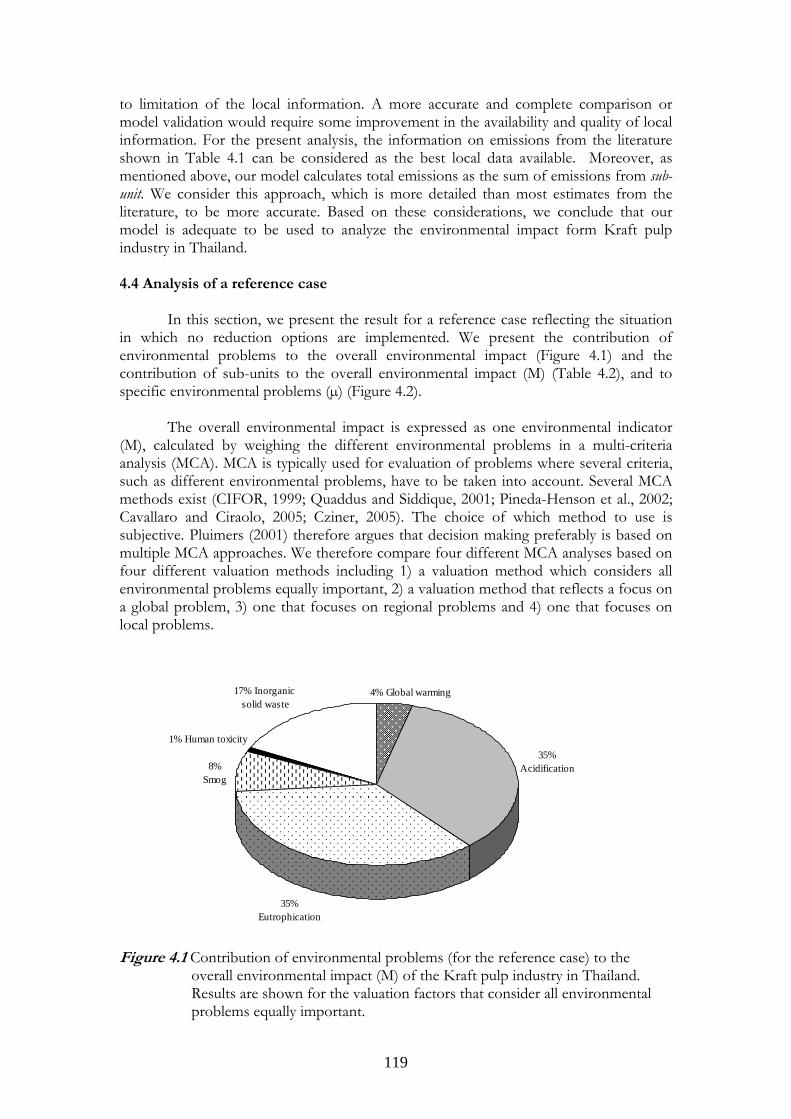
119
to limitation of the local information. A more accurate and complete comparison or model validation would require some improvement in the availability and quality of local information. For the present analysis, the information on emissions from the literature shown in Table 4.1 can be considered as the best local data available. Moreover, as mentioned above, our model calculates total emissions as the sum of emissions from sub-unit. We consider this approach, which is more detailed than most estimates from the literature, to be more accurate. Based on these considerations, we conclude that our model is adequate to be used to analyze the environmental impact form Kraft pulp industry in Thailand. 4.4 Analysis of a reference case In this section, we present the result for a reference case reflecting the situation in which no reduction options are implemented. We present the contribution of environmental problems to the overall environmental impact (Figure 4.1) and the contribution of sub-units to the overall environmental impact (M) (Table 4.2), and to specific environmental problems (µ) (Figure 4.2).
The overall environmental impact is expressed as one environmental indicator (M), calculated by weighing the different environmental problems in a multi-criteria analysis (MCA). MCA is typically used for evaluation of problems where several criteria, such as different environmental problems, have to be taken into account. Several MCA methods exist (CIFOR, 1999; Quaddus and Siddique, 2001; Pineda-Henson et al., 2002; Cavallaro and Ciraolo, 2005; Cziner, 2005). The choice of which method to use is subjective. Pluimers (2001) therefore argues that decision making preferably is based on multiple MCA approaches. We therefore compare four different MCA analyses based on four different valuation methods including 1) a valuation method which considers all environmental problems equally important, 2) a valuation method that reflects a focus on a global problem, 3) one that focuses on regional problems and 4) one that focuses on local problems.
35%Acidification
35%Eutrophication
8%Smog
4% Global warming17% Inorganic solid waste
1% Human toxicity
Figure 4.1 Contribution of environmental problems (for the reference case) to the
overall environmental impact (M) of the Kraft pulp industry in Thailand. Results are shown for the valuation factors that consider all environmental problems equally important.
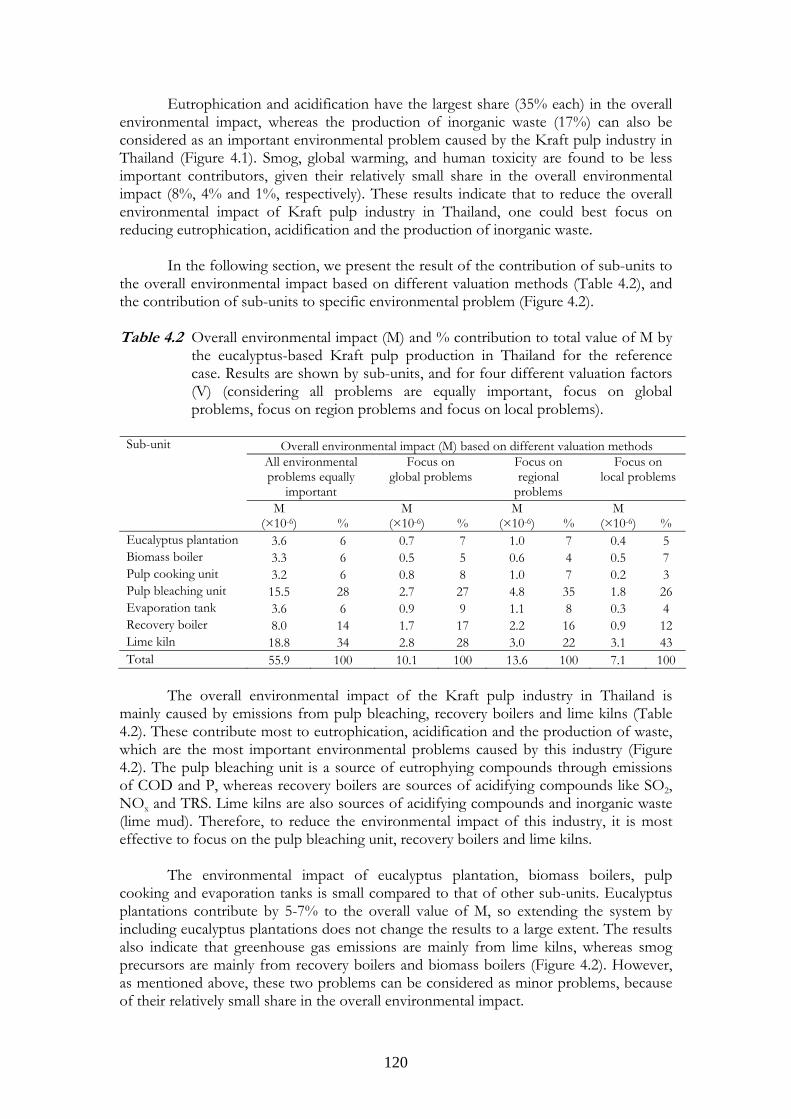
120
Eutrophication and acidification have the largest share (35% each) in the overall environmental impact, whereas the production of inorganic waste (17%) can also be considered as an important environmental problem caused by the Kraft pulp industry in Thailand (Figure 4.1). Smog, global warming, and human toxicity are found to be less important contributors, given their relatively small share in the overall environmental impact (8%, 4% and 1%, respectively). These results indicate that to reduce the overall environmental impact of Kraft pulp industry in Thailand, one could best focus on reducing eutrophication, acidification and the production of inorganic waste. In the following section, we present the result of the contribution of sub-units to the overall environmental impact based on different valuation methods (Table 4.2), and the contribution of sub-units to specific environmental problem (Figure 4.2). Table 4.2 Overall environmental impact (M) and % contribution to total value of M by
the eucalyptus-based Kraft pulp production in Thailand for the reference case. Results are shown by sub-units, and for four different valuation factors (V) (considering all problems are equally important, focus on global problems, focus on region problems and focus on local problems).
Overall environmental impact (M) based on different valuation methods
All environmental problems equally
important
Focus on global problems
Focus on regional
problems
Focus on local problems
Sub-unit
M (×10-6) %
M (×10-6) %
M (×10-6) %
M (×10-6) %
Eucalyptus plantation 3.6 6 0.7 7 1.0 7 0.4 5 Biomass boiler 3.3 6 0.5 5 0.6 4 0.5 7 Pulp cooking unit 3.2 6 0.8 8 1.0 7 0.2 3 Pulp bleaching unit 15.5 28 2.7 27 4.8 35 1.8 26 Evaporation tank 3.6 6 0.9 9 1.1 8 0.3 4 Recovery boiler 8.0 14 1.7 17 2.2 16 0.9 12 Lime kiln 18.8 34 2.8 28 3.0 22 3.1 43 Total 55.9 100 10.1 100 13.6 100 7.1 100
The overall environmental impact of the Kraft pulp industry in Thailand is
mainly caused by emissions from pulp bleaching, recovery boilers and lime kilns (Table 4.2). These contribute most to eutrophication, acidification and the production of waste, which are the most important environmental problems caused by this industry (Figure 4.2). The pulp bleaching unit is a source of eutrophying compounds through emissions of COD and P, whereas recovery boilers are sources of acidifying compounds like SO2, NOx and TRS. Lime kilns are also sources of acidifying compounds and inorganic waste (lime mud). Therefore, to reduce the environmental impact of this industry, it is most effective to focus on the pulp bleaching unit, recovery boilers and lime kilns.
The environmental impact of eucalyptus plantation, biomass boilers, pulp cooking and evaporation tanks is small compared to that of other sub-units. Eucalyptus plantations contribute by 5-7% to the overall value of M, so extending the system by including eucalyptus plantations does not change the results to a large extent. The results also indicate that greenhouse gas emissions are mainly from lime kilns, whereas smog precursors are mainly from recovery boilers and biomass boilers (Figure 4.2). However, as mentioned above, these two problems can be considered as minor problems, because of their relatively small share in the overall environmental impact.
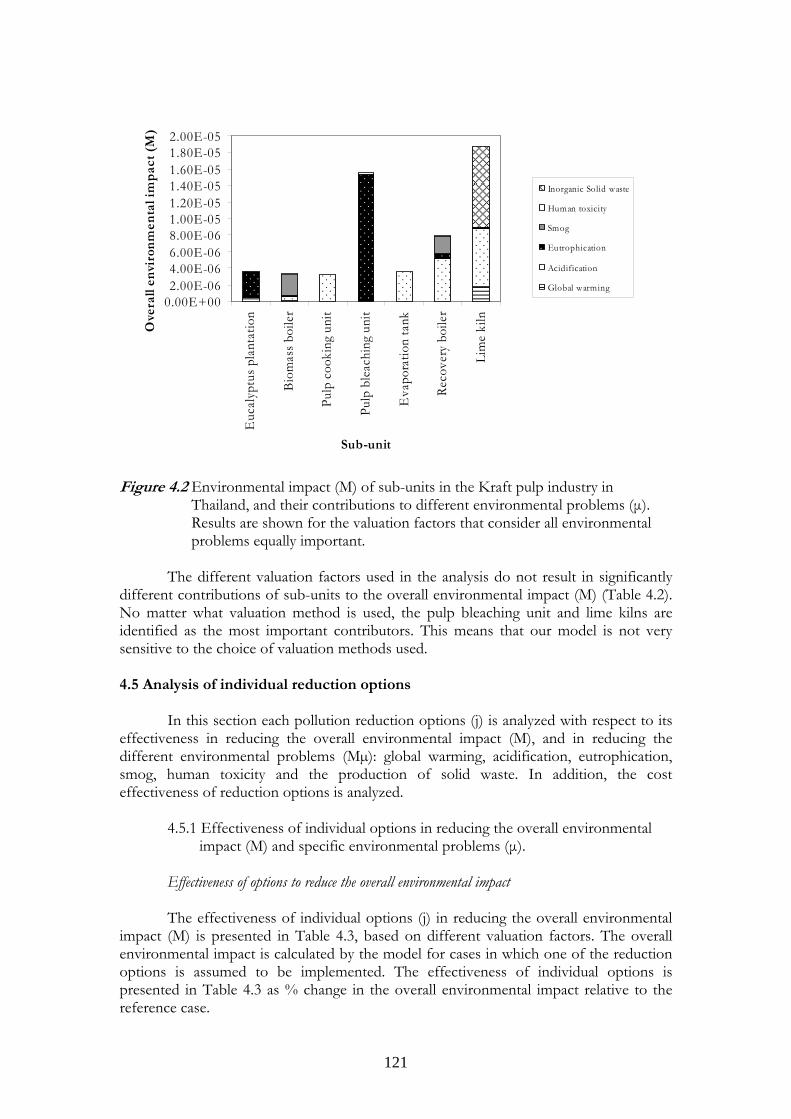
121
0.00E+002.00E-064.00E-066.00E-068.00E-061.00E-051.20E-051.40E-051.60E-051.80E-052.00E-05
Euc
alyp
tus p
lant
atio
n
Biom
ass b
oile
r
Pulp
coo
king
uni
t
Pulp
ble
achi
ng u
nit
Eva
pora
tion
tank
Reco
very
boi
ler
Lim
e ki
ln
Sub-unit
Ove
rall
envi
ron
men
tal i
mp
act
(M)
Inorganic Solid waste
Human toxicity
Smog
Eutrophication
Acidification
Global warming
Figure 4.2 Environmental impact (M) of sub-units in the Kraft pulp industry in
Thailand, and their contributions to different environmental problems (µ). Results are shown for the valuation factors that consider all environmental problems equally important.
The different valuation factors used in the analysis do not result in significantly
different contributions of sub-units to the overall environmental impact (M) (Table 4.2). No matter what valuation method is used, the pulp bleaching unit and lime kilns are identified as the most important contributors. This means that our model is not very sensitive to the choice of valuation methods used. 4.5 Analysis of individual reduction options In this section each pollution reduction options (j) is analyzed with respect to its effectiveness in reducing the overall environmental impact (M), and in reducing the different environmental problems (Mµ): global warming, acidification, eutrophication, smog, human toxicity and the production of solid waste. In addition, the cost effectiveness of reduction options is analyzed.
4.5.1 Effectiveness of individual options in reducing the overall environmental impact (M) and specific environmental problems (µ).
Effectiveness of options to reduce the overall environmental impact
The effectiveness of individual options (j) in reducing the overall environmental impact (M) is presented in Table 4.3, based on different valuation factors. The overall environmental impact is calculated by the model for cases in which one of the reduction options is assumed to be implemented. The effectiveness of individual options is presented in Table 4.3 as % change in the overall environmental impact relative to the reference case.
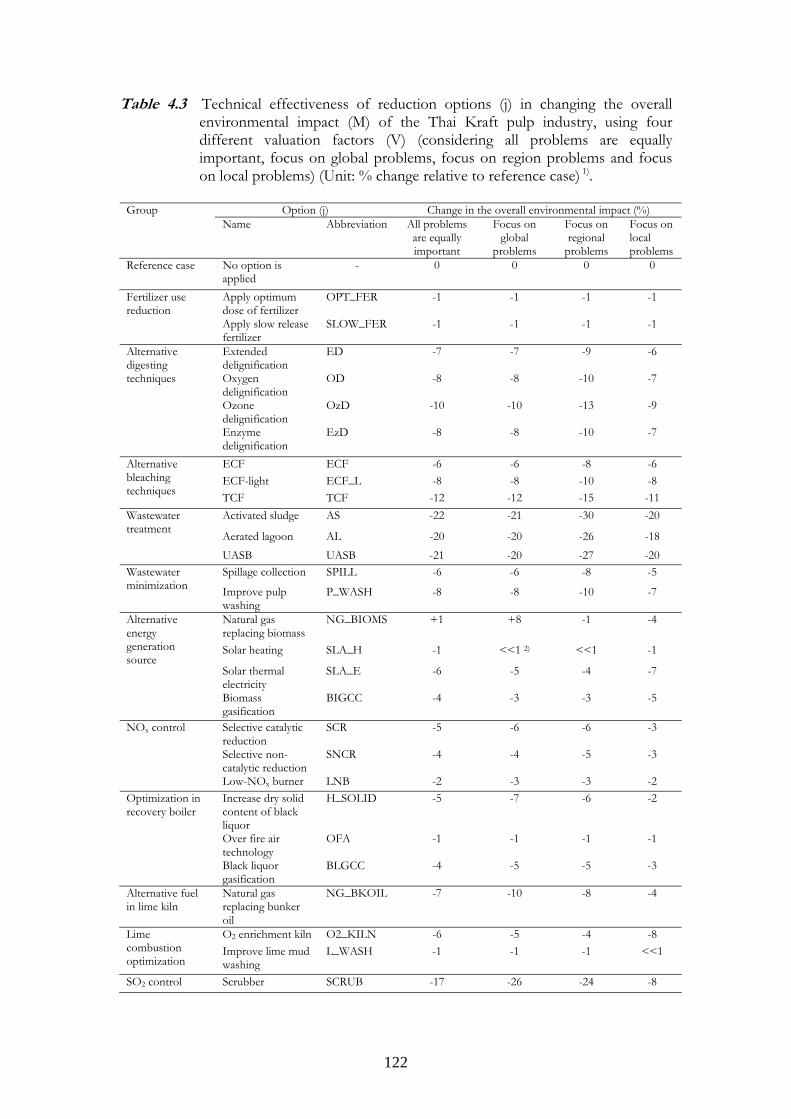
122
Table 4.3 Technical effectiveness of reduction options (j) in changing the overall environmental impact (M) of the Thai Kraft pulp industry, using four different valuation factors (V) (considering all problems are equally important, focus on global problems, focus on region problems and focus on local problems) (Unit: % change relative to reference case) 1).
Option (j) Change in the overall environmental impact (%) Group Name Abbreviation All problems
are equally important
Focus on global
problems
Focus on regional
problems
Focus on local problems
Reference case No option is applied
- 0 0 0 0
Apply optimum dose of fertilizer
OPT_FER -1 -1 -1 -1 Fertilizer use reduction
Apply slow release fertilizer
SLOW_FER -1 -1 -1 -1
Extended delignification
ED -7 -7 -9 -6
Oxygen delignification
OD -8 -8 -10 -7
Ozone delignification
OzD -10 -10 -13 -9
Alternative digesting techniques
Enzyme delignification
EzD -8 -8 -10 -7
ECF ECF -6 -6 -8 -6 ECF-light ECF_L -8 -8 -10 -8
Alternative bleaching techniques TCF TCF -12 -12 -15 -11
Activated sludge AS -22 -21 -30 -20
Aerated lagoon AL -20 -20 -26 -18
Wastewater treatment
UASB UASB -21 -20 -27 -20 Spillage collection SPILL -6 -6 -8 -5 Wastewater
minimization Improve pulp washing
P_WASH -8 -8 -10 -7
Natural gas replacing biomass
NG_BIOMS +1 +8 -1 -4
Solar heating SLA_H -1 <<1 2) <<1 -1
Solar thermal electricity
SLA_E -6 -5 -4 -7
Alternative energy generation source
Biomass gasification
BIGCC -4 -3 -3 -5
Selective catalytic reduction
SCR -5 -6 -6 -3
Selective non-catalytic reduction
SNCR -4 -4 -5 -3
NOx control
Low-NOx burner LNB -2 -3 -3 -2 Increase dry solid content of black liquor
H_SOLID -5 -7 -6 -2
Over fire air technology
OFA -1 -1 -1 -1
Optimization in recovery boiler
Black liquor gasification
BLGCC -4 -5 -5 -3
Alternative fuel in lime kiln
Natural gas replacing bunker oil
NG_BKOIL -7 -10 -8 -4
O2 enrichment kiln O2_KILN -6 -5 -4 -8 Lime combustion optimization
Improve lime mud washing
L_WASH -1 -1 -1 <<1
SO2 control Scrubber SCRUB -17 -26 -24 -8
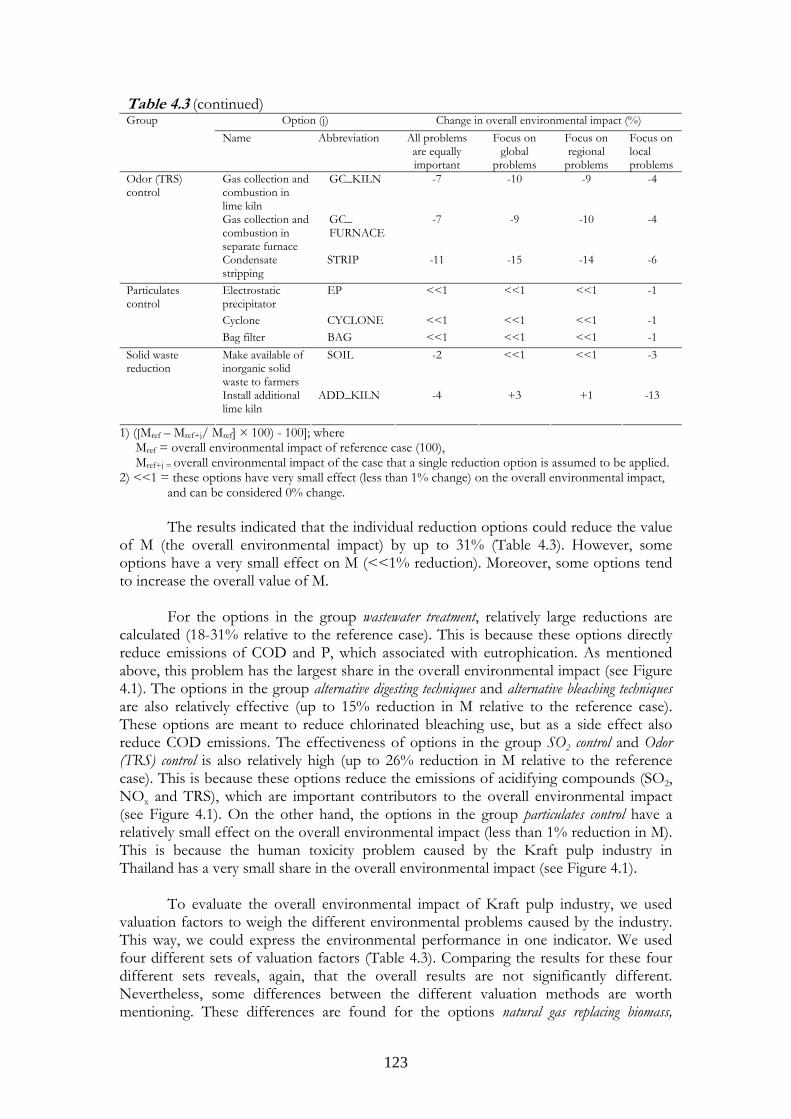
123
Table 4.3 (continued) Option (j) Change in overall environmental impact (%) Group
Name Abbreviation All problems are equally important
Focus on global
problems
Focus on regional
problems
Focus on local problems
Gas collection and combustion in lime kiln
GC_KILN -7 -10 -9 -4
Gas collection and combustion in separate furnace
GC_ FURNACE
-7 -9 -10 -4
Odor (TRS) control
Condensate stripping
STRIP -11 -15 -14 -6
Electrostatic precipitator
EP <<1 <<1 <<1 -1
Cyclone CYCLONE <<1 <<1 <<1 -1
Particulates control
Bag filter BAG <<1 <<1 <<1 -1 Make available of inorganic solid waste to farmers
SOIL -2 <<1 <<1 -3 Solid waste reduction
Install additional lime kiln
ADD_KILN -4 +3 +1 -13
1) ([Mref – Mref+j/ Mref] × 100) - 100]; where Mref = overall environmental impact of reference case (100), Mref+j = overall environmental impact of the case that a single reduction option is assumed to be applied.
2) <<1 = these options have very small effect (less than 1% change) on the overall environmental impact, and can be considered 0% change.
The results indicated that the individual reduction options could reduce the value
of M (the overall environmental impact) by up to 31% (Table 4.3). However, some options have a very small effect on M (<<1% reduction). Moreover, some options tend to increase the overall value of M.
For the options in the group wastewater treatment, relatively large reductions are
calculated (18-31% relative to the reference case). This is because these options directly reduce emissions of COD and P, which associated with eutrophication. As mentioned above, this problem has the largest share in the overall environmental impact (see Figure 4.1). The options in the group alternative digesting techniques and alternative bleaching techniques are also relatively effective (up to 15% reduction in M relative to the reference case). These options are meant to reduce chlorinated bleaching use, but as a side effect also reduce COD emissions. The effectiveness of options in the group SO2 control and Odor (TRS) control is also relatively high (up to 26% reduction in M relative to the reference case). This is because these options reduce the emissions of acidifying compounds (SO2, NOx and TRS), which are important contributors to the overall environmental impact (see Figure 4.1). On the other hand, the options in the group particulates control have a relatively small effect on the overall environmental impact (less than 1% reduction in M). This is because the human toxicity problem caused by the Kraft pulp industry in Thailand has a very small share in the overall environmental impact (see Figure 4.1).
To evaluate the overall environmental impact of Kraft pulp industry, we used valuation factors to weigh the different environmental problems caused by the industry. This way, we could express the environmental performance in one indicator. We used four different sets of valuation factors (Table 4.3). Comparing the results for these four different sets reveals, again, that the overall results are not significantly different. Nevertheless, some differences between the different valuation methods are worth mentioning. These differences are found for the options natural gas replacing biomass,
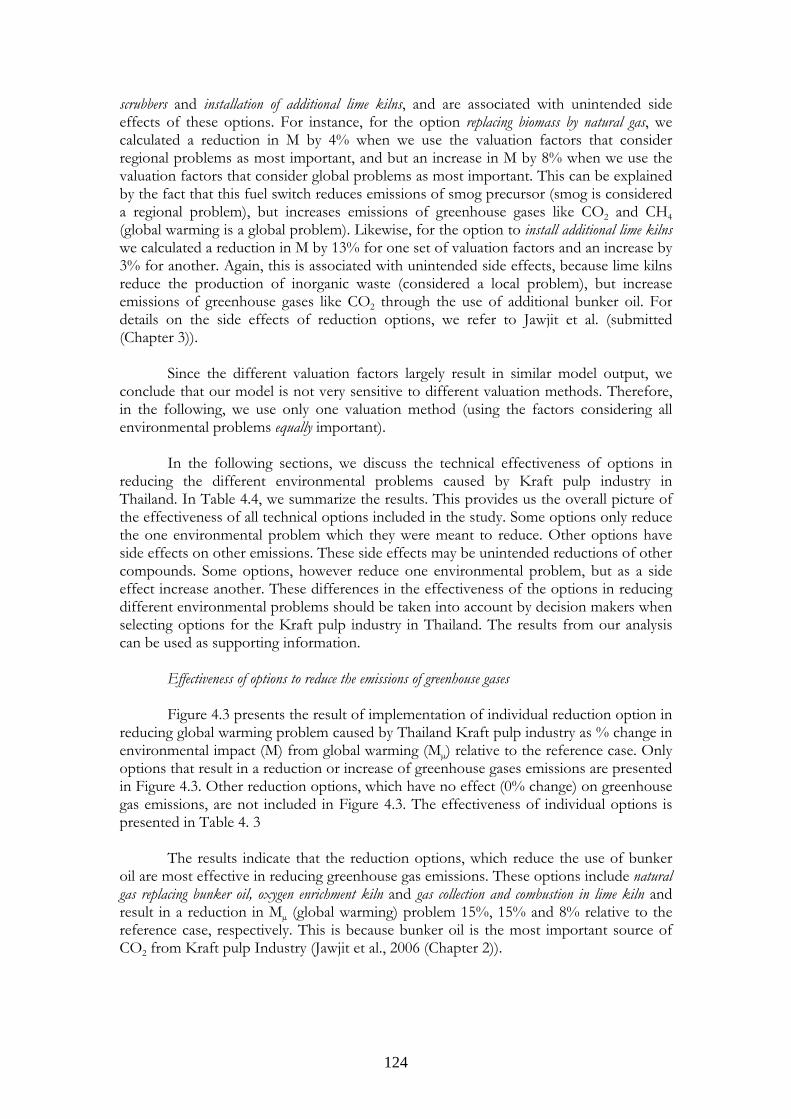
124
scrubbers and installation of additional lime kilns, and are associated with unintended side effects of these options. For instance, for the option replacing biomass by natural gas, we calculated a reduction in M by 4% when we use the valuation factors that consider regional problems as most important, and but an increase in M by 8% when we use the valuation factors that consider global problems as most important. This can be explained by the fact that this fuel switch reduces emissions of smog precursor (smog is considered a regional problem), but increases emissions of greenhouse gases like CO2 and CH4 (global warming is a global problem). Likewise, for the option to install additional lime kilns we calculated a reduction in M by 13% for one set of valuation factors and an increase by 3% for another. Again, this is associated with unintended side effects, because lime kilns reduce the production of inorganic waste (considered a local problem), but increase emissions of greenhouse gases like CO2 through the use of additional bunker oil. For details on the side effects of reduction options, we refer to Jawjit et al. (submitted (Chapter 3)). Since the different valuation factors largely result in similar model output, we conclude that our model is not very sensitive to different valuation methods. Therefore, in the following, we use only one valuation method (using the factors considering all environmental problems equally important). In the following sections, we discuss the technical effectiveness of options in reducing the different environmental problems caused by Kraft pulp industry in Thailand. In Table 4.4, we summarize the results. This provides us the overall picture of the effectiveness of all technical options included in the study. Some options only reduce the one environmental problem which they were meant to reduce. Other options have side effects on other emissions. These side effects may be unintended reductions of other compounds. Some options, however reduce one environmental problem, but as a side effect increase another. These differences in the effectiveness of the options in reducing different environmental problems should be taken into account by decision makers when selecting options for the Kraft pulp industry in Thailand. The results from our analysis can be used as supporting information.
Effectiveness of options to reduce the emissions of greenhouse gases
Figure 4.3 presents the result of implementation of individual reduction option in reducing global warming problem caused by Thailand Kraft pulp industry as % change in environmental impact (M) from global warming (Mµ) relative to the reference case. Only options that result in a reduction or increase of greenhouse gases emissions are presented in Figure 4.3. Other reduction options, which have no effect (0% change) on greenhouse gas emissions, are not included in Figure 4.3. The effectiveness of individual options is presented in Table 4. 3
The results indicate that the reduction options, which reduce the use of bunker
oil are most effective in reducing greenhouse gas emissions. These options include natural gas replacing bunker oil, oxygen enrichment kiln and gas collection and combustion in lime kiln and result in a reduction in Mµ (global warming) problem 15%, 15% and 8% relative to the reference case, respectively. This is because bunker oil is the most important source of CO2 from Kraft pulp Industry (Jawjit et al., 2006 (Chapter 2)).
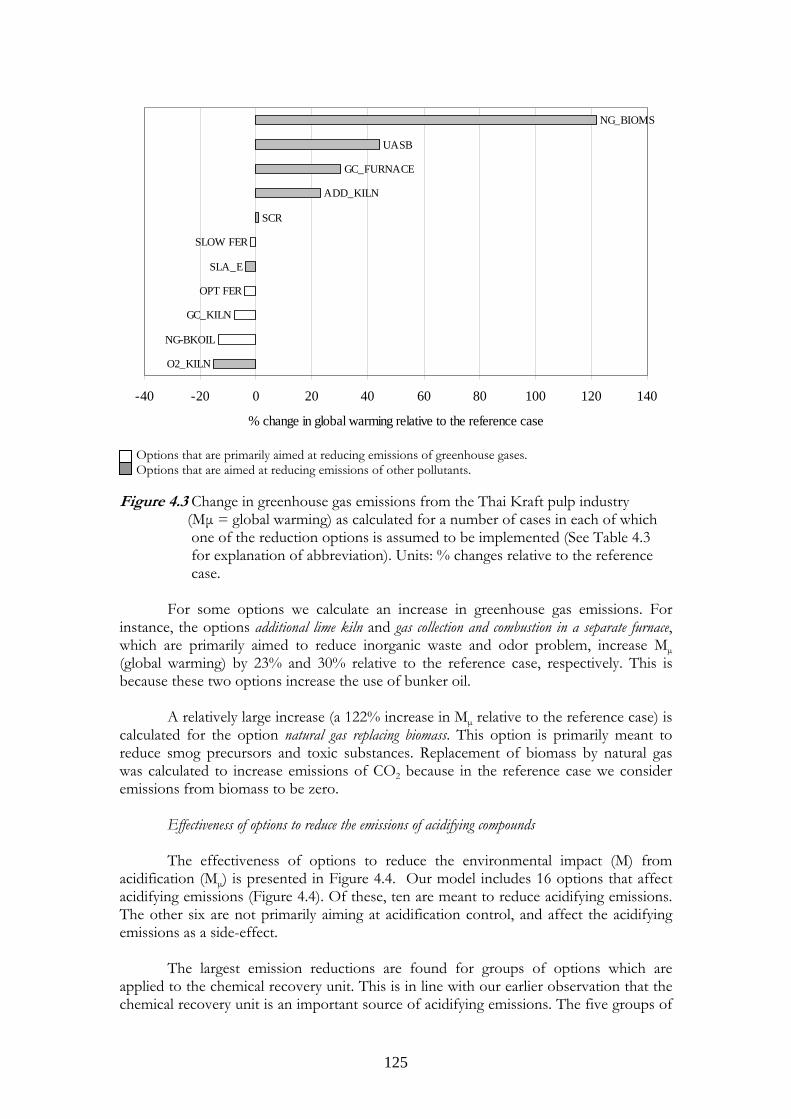
125
O2_KILN
NG-BKOIL
GC_KILN
OPT FER
SLOW FER
SCR
ADD_KILN
GC_FURNACE
UASB
NG_BIOMS
SLA_E
-40 -20 0 20 40 60 80 100 120 140
% change in global warming relative to the reference case
Options that are primarily aimed at reducing emissions of greenhouse gases. Options that are aimed at reducing emissions of other pollutants. Figure 4.3 Change in greenhouse gas emissions from the Thai Kraft pulp industry
(Mµ = global warming) as calculated for a number of cases in each of which one of the reduction options is assumed to be implemented (See Table 4.3 for explanation of abbreviation). Units: % changes relative to the reference case.
For some options we calculate an increase in greenhouse gas emissions. For
instance, the options additional lime kiln and gas collection and combustion in a separate furnace, which are primarily aimed to reduce inorganic waste and odor problem, increase Mµ (global warming) by 23% and 30% relative to the reference case, respectively. This is because these two options increase the use of bunker oil.
A relatively large increase (a 122% increase in Mµ relative to the reference case) is
calculated for the option natural gas replacing biomass. This option is primarily meant to reduce smog precursors and toxic substances. Replacement of biomass by natural gas was calculated to increase emissions of CO2 because in the reference case we consider emissions from biomass to be zero.
Effectiveness of options to reduce the emissions of acidifying compounds
The effectiveness of options to reduce the environmental impact (M) from acidification (Mµ) is presented in Figure 4.4. Our model includes 16 options that affect acidifying emissions (Figure 4.4). Of these, ten are meant to reduce acidifying emissions. The other six are not primarily aiming at acidification control, and affect the acidifying emissions as a side-effect.
The largest emission reductions are found for groups of options which are
applied to the chemical recovery unit. This is in line with our earlier observation that the chemical recovery unit is an important source of acidifying emissions. The five groups of
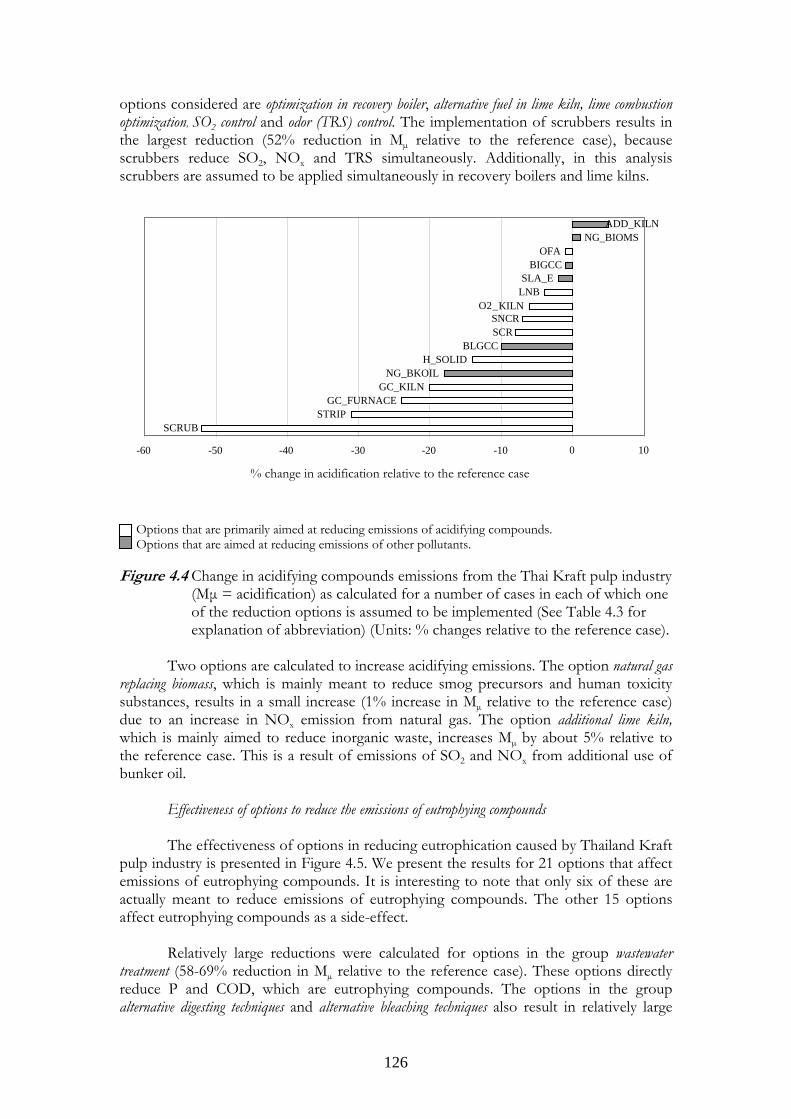
126
options considered are optimization in recovery boiler, alternative fuel in lime kiln, lime combustion optimization, SO2 control and odor (TRS) control. The implementation of scrubbers results in the largest reduction (52% reduction in Mµ relative to the reference case), because scrubbers reduce SO2, NOx and TRS simultaneously. Additionally, in this analysis scrubbers are assumed to be applied simultaneously in recovery boilers and lime kilns.
Options that are primarily aimed at reducing emissions of acidifying compounds. Options that are aimed at reducing emissions of other pollutants. Figure 4.4 Change in acidifying compounds emissions from the Thai Kraft pulp industry
(Mµ = acidification) as calculated for a number of cases in each of which one of the reduction options is assumed to be implemented (See Table 4.3 for explanation of abbreviation) (Units: % changes relative to the reference case).
Two options are calculated to increase acidifying emissions. The option natural gas
replacing biomass, which is mainly meant to reduce smog precursors and human toxicity substances, results in a small increase (1% increase in Mµ relative to the reference case) due to an increase in NOx emission from natural gas. The option additional lime kiln, which is mainly aimed to reduce inorganic waste, increases Mµ by about 5% relative to the reference case. This is a result of emissions of SO2 and NOx from additional use of bunker oil.
Effectiveness of options to reduce the emissions of eutrophying compounds
The effectiveness of options in reducing eutrophication caused by Thailand Kraft pulp industry is presented in Figure 4.5. We present the results for 21 options that affect emissions of eutrophying compounds. It is interesting to note that only six of these are actually meant to reduce emissions of eutrophying compounds. The other 15 options affect eutrophying compounds as a side-effect.
Relatively large reductions were calculated for options in the group wastewater
treatment (58-69% reduction in Mµ relative to the reference case). These options directly reduce P and COD, which are eutrophying compounds. The options in the group alternative digesting techniques and alternative bleaching techniques also result in relatively large
SCRUB STRIP
GC_FURNACEGC_KILN
NG_BKOILH_SOLID
BLGCCSCRSNCR
O2_KILNLNBSLA_E
BIGCC OFA
NG_BIOMS ADD_KILN
-60 -50 -40 -30 -20 -10 0 10 % change in acidification relative to the reference case
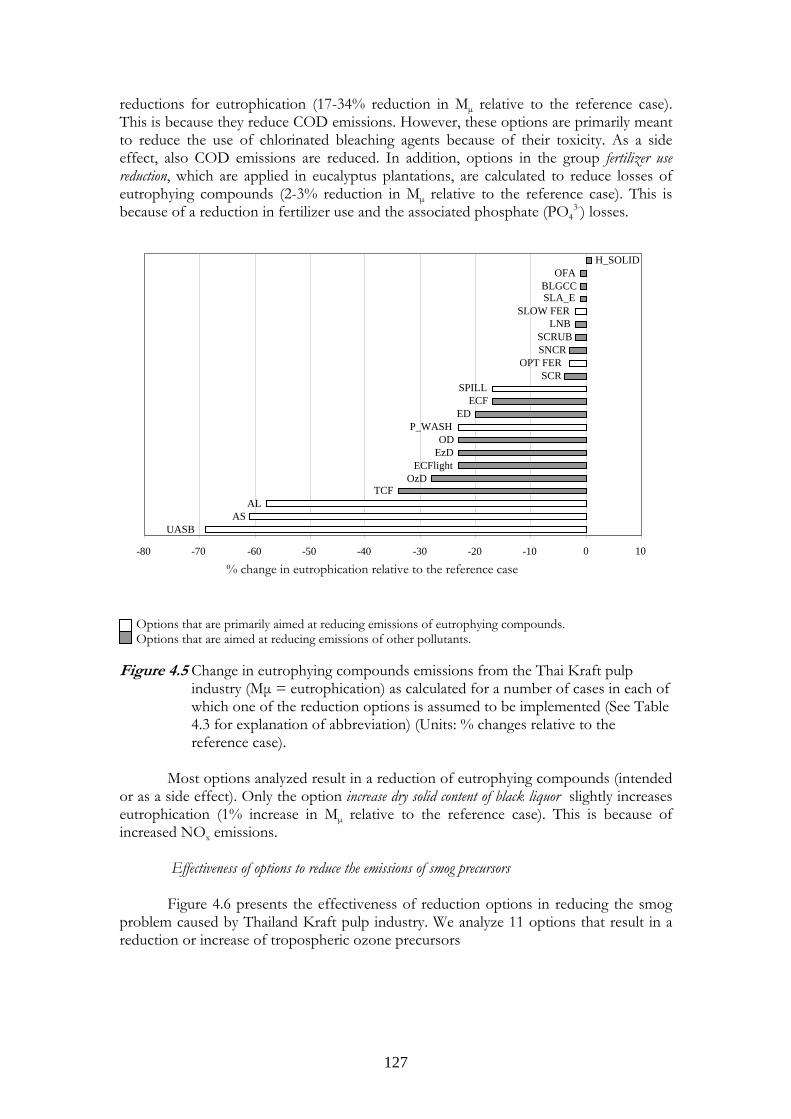
127
reductions for eutrophication (17-34% reduction in Mµ relative to the reference case). This is because they reduce COD emissions. However, these options are primarily meant to reduce the use of chlorinated bleaching agents because of their toxicity. As a side effect, also COD emissions are reduced. In addition, options in the group fertilizer use reduction, which are applied in eucalyptus plantations, are calculated to reduce losses of eutrophying compounds (2-3% reduction in Mµ relative to the reference case). This is because of a reduction in fertilizer use and the associated phosphate (PO4
3-) losses.
Options that are primarily aimed at reducing emissions of eutrophying compounds. Options that are aimed at reducing emissions of other pollutants. Figure 4.5 Change in eutrophying compounds emissions from the Thai Kraft pulp
industry (Mµ = eutrophication) as calculated for a number of cases in each of which one of the reduction options is assumed to be implemented (See Table 4.3 for explanation of abbreviation) (Units: % changes relative to the reference case).
Most options analyzed result in a reduction of eutrophying compounds (intended
or as a side effect). Only the option increase dry solid content of black liquor slightly increases eutrophication (1% increase in Mµ relative to the reference case). This is because of increased NOx emissions.
Effectiveness of options to reduce the emissions of smog precursors
Figure 4.6 presents the effectiveness of reduction options in reducing the smog problem caused by Thailand Kraft pulp industry. We analyze 11 options that result in a reduction or increase of tropospheric ozone precursors
AS AL
TCFOzD
ECFlightEzDOD
P_WASHED
ECFSPILL
SCR OPT FER
SNCR SCRUB
LNB SLOW FER
SLA_E BLGCC
OFA H_SOLID
UASB -80 -70 -60 -50 -40 -30 -20 -10 0 10
% change in eutrophication relative to the reference case
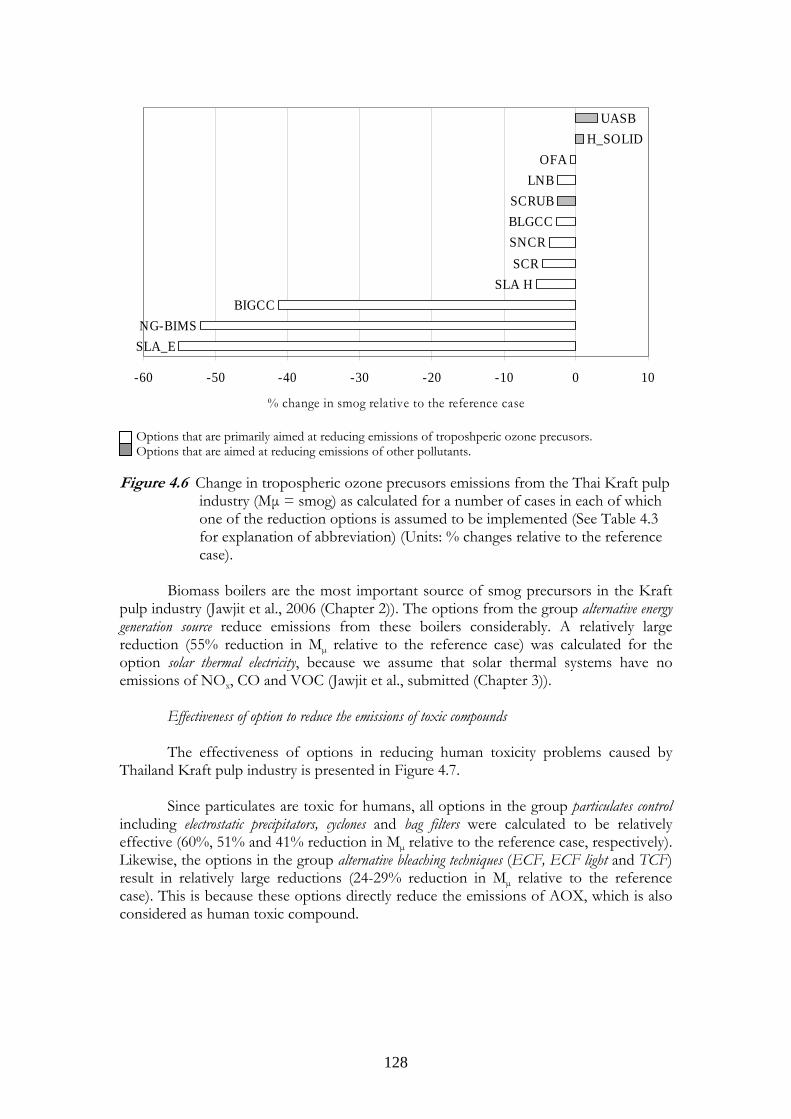
128
SLA_E
BIGCC
SNCRBLGCCSCRUB
LNBOFA
H_SOLIDUASB
NG-BIMS
SLA HSCR
-60 -50 -40 -30 -20 -10 0 10
% change in smog relative to the reference case
Options that are primarily aimed at reducing emissions of troposhperic ozone precusors. Options that are aimed at reducing emissions of other pollutants. Figure 4.6 Change in tropospheric ozone precusors emissions from the Thai Kraft pulp
industry (Mµ = smog) as calculated for a number of cases in each of which one of the reduction options is assumed to be implemented (See Table 4.3 for explanation of abbreviation) (Units: % changes relative to the reference case).
Biomass boilers are the most important source of smog precursors in the Kraft
pulp industry (Jawjit et al., 2006 (Chapter 2)). The options from the group alternative energy generation source reduce emissions from these boilers considerably. A relatively large reduction (55% reduction in Mµ relative to the reference case) was calculated for the option solar thermal electricity, because we assume that solar thermal systems have no emissions of NOx, CO and VOC (Jawjit et al., submitted (Chapter 3)).
Effectiveness of option to reduce the emissions of toxic compounds
The effectiveness of options in reducing human toxicity problems caused by Thailand Kraft pulp industry is presented in Figure 4.7.
Since particulates are toxic for humans, all options in the group particulates control including electrostatic precipitators, cyclones and bag filters were calculated to be relatively effective (60%, 51% and 41% reduction in Mµ relative to the reference case, respectively). Likewise, the options in the group alternative bleaching techniques (ECF, ECF light and TCF) result in relatively large reductions (24-29% reduction in Mµ relative to the reference case). This is because these options directly reduce the emissions of AOX, which is also considered as human toxic compound.
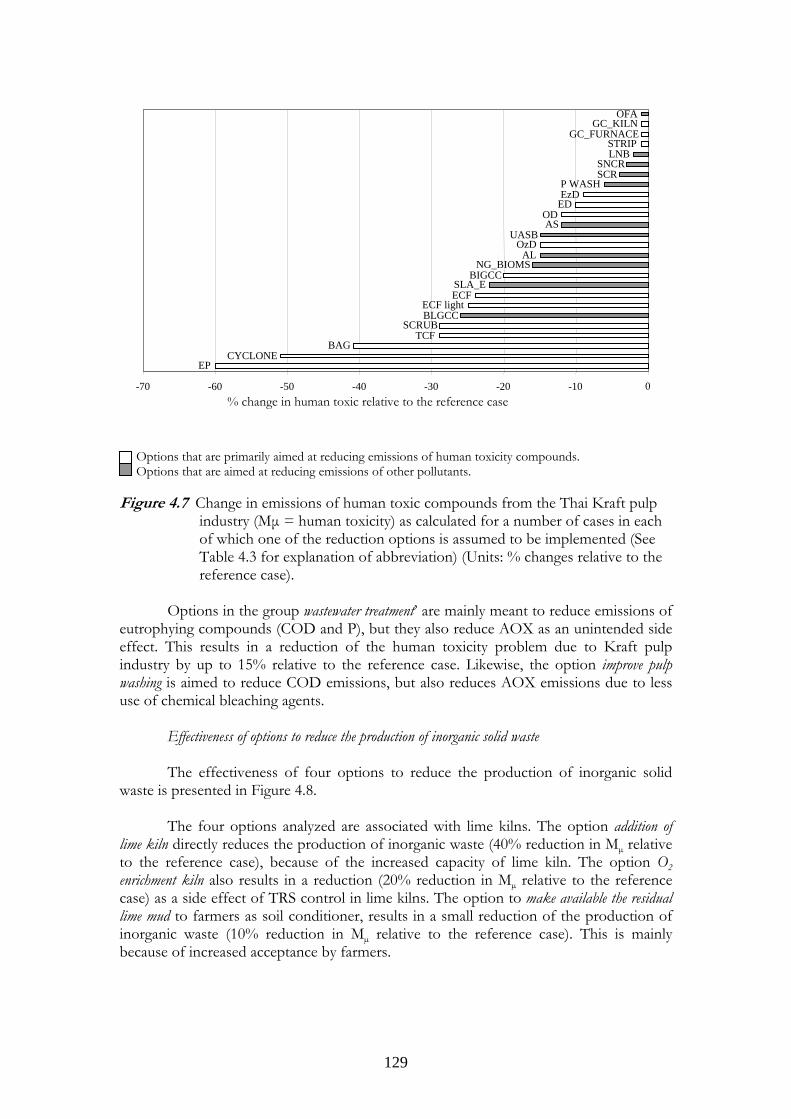
129
Options that are primarily aimed at reducing emissions of human toxicity compounds. Options that are aimed at reducing emissions of other pollutants. Figure 4.7 Change in emissions of human toxic compounds from the Thai Kraft pulp
industry (Mµ = human toxicity) as calculated for a number of cases in each of which one of the reduction options is assumed to be implemented (See Table 4.3 for explanation of abbreviation) (Units: % changes relative to the reference case).
Options in the group wastewater treatment’ are mainly meant to reduce emissions of
eutrophying compounds (COD and P), but they also reduce AOX as an unintended side effect. This results in a reduction of the human toxicity problem due to Kraft pulp industry by up to 15% relative to the reference case. Likewise, the option improve pulp washing is aimed to reduce COD emissions, but also reduces AOX emissions due to less use of chemical bleaching agents.
Effectiveness of options to reduce the production of inorganic solid waste
The effectiveness of four options to reduce the production of inorganic solid waste is presented in Figure 4.8.
The four options analyzed are associated with lime kilns. The option addition of
lime kiln directly reduces the production of inorganic waste (40% reduction in Mµ relative to the reference case), because of the increased capacity of lime kiln. The option O2 enrichment kiln also results in a reduction (20% reduction in Mµ relative to the reference case) as a side effect of TRS control in lime kilns. The option to make available the residual lime mud to farmers as soil conditioner, results in a small reduction of the production of inorganic waste (10% reduction in Mµ relative to the reference case). This is mainly because of increased acceptance by farmers.
EP CYCLONE BAG
TCFSCRUB
BLGCCECF light
ECFSLA_E
BIGCCNG_BIOMS
ALOzD
UASBAS
ODED EzD P WASH SCR
SNCR LNB STRIP GC_FURNACE GC_KILN OFA
-70 -60 -50 -40 -30 -20 -10 0 % change in human toxic relative to the reference case
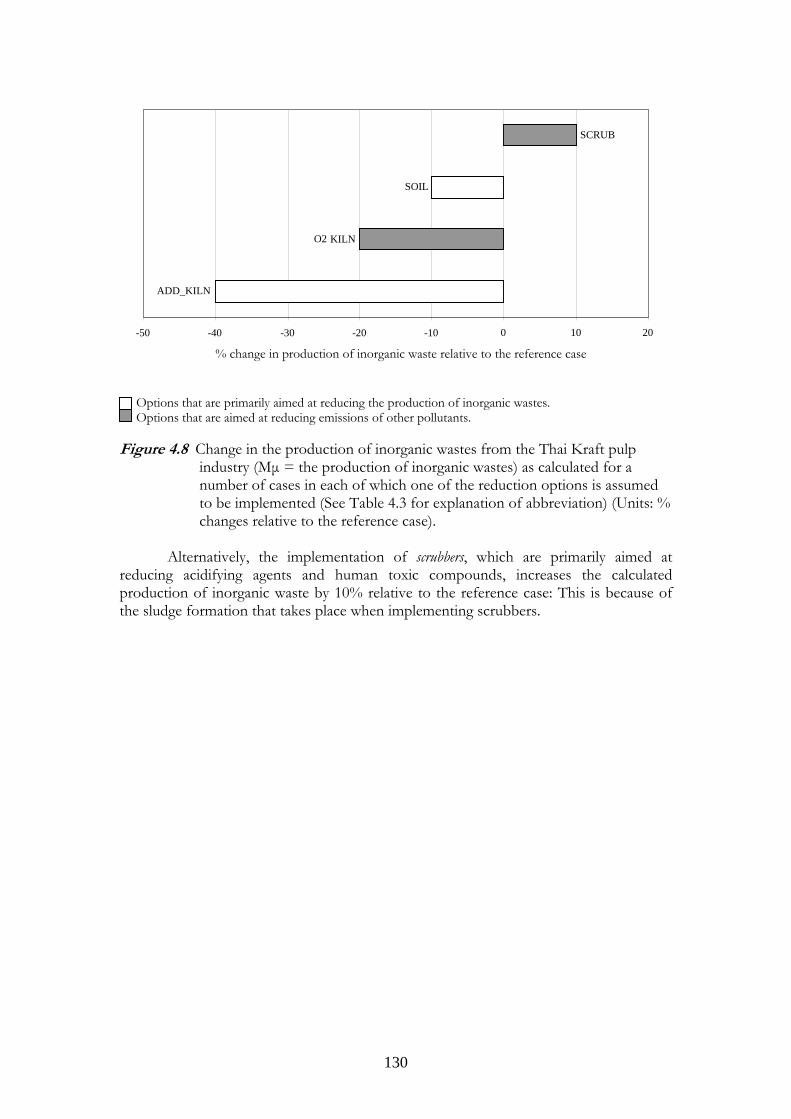
130
Options that are primarily aimed at reducing the production of inorganic wastes. Options that are aimed at reducing emissions of other pollutants. Figure 4.8 Change in the production of inorganic wastes from the Thai Kraft pulp
industry (Mµ = the production of inorganic wastes) as calculated for a number of cases in each of which one of the reduction options is assumed to be implemented (See Table 4.3 for explanation of abbreviation) (Units: % changes relative to the reference case).
Alternatively, the implementation of scrubbers, which are primarily aimed at
reducing acidifying agents and human toxic compounds, increases the calculated production of inorganic waste by 10% relative to the reference case: This is because of the sludge formation that takes place when implementing scrubbers.
ADD_KILN
O 2 KILN
SOIL
SCRUB
-50 -40 -30 -20 -10 0 10 20 % change in production of inorganic waste relative to the reference case
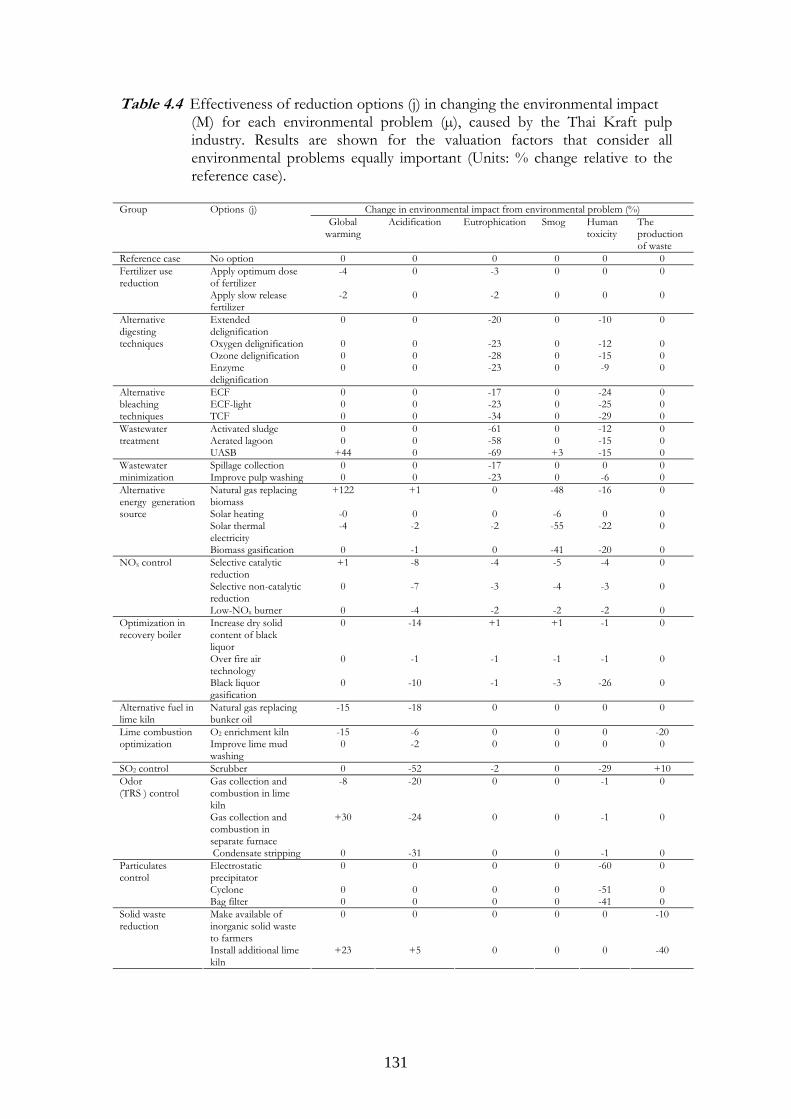
131
Table 4.4 Effectiveness of reduction options (j) in changing the environmental impact (M) for each environmental problem (µ), caused by the Thai Kraft pulp
industry. Results are shown for the valuation factors that consider all environmental problems equally important (Units: % change relative to the reference case).
Change in environmental impact from environmental problem (%) Group Options (j)
Global warming
Acidification Eutrophication Smog Human toxicity
The production of waste
Reference case No option 0 0 0 0 0 0 Apply optimum dose of fertilizer
-4 0 -3 0 0 0 Fertilizer use reduction
Apply slow release fertilizer
-2 0 -2 0 0 0 Extended delignification
0 0 -20 0 -10 0 Oxygen delignification 0 0 -23 0 -12 0 Ozone delignification 0 0 -28 0 -15 0
Alternative digesting techniques
Enzyme delignification
0 0 -23 0 -9 0 ECF 0 0 -17 0 -24 0 ECF-light 0 0 -23 0 -25 0
Alternative bleaching techniques TCF 0 0 -34 0 -29 0
Activated sludge 0 0 -61 0 -12 0 Aerated lagoon 0 0 -58 0 -15 0
Wastewater treatment
UASB +44 0 -69 +3 -15 0 Spillage collection 0 0 -17 0 0 0 Wastewater
minimization Improve pulp washing 0 0 -23 0 -6 0 Natural gas replacing biomass
+122 +1 0 -48 -16 0 Solar heating -0 0 0 -6 0 0 Solar thermal electricity
-4 -2 -2 -55 -22 0
Alternative energy generation source
Biomass gasification 0 -1 0 -41 -20 0 Selective catalytic reduction
+1 -8 -4 -5 -4 0 Selective non-catalytic reduction
0 -7 -3 -4 -3 0 NOx control
Low-NOx burner 0 -4 -2 -2 -2 0 Increase dry solid content of black liquor
0 -14 +1 +1 -1 0
Over fire air technology
0 -1 -1 -1 -1 0
Optimization in recovery boiler
Black liquor gasification
0 -10 -1 -3 -26 0 Alternative fuel in lime kiln
Natural gas replacing bunker oil
-15 -18 0 0 0 0 O2 enrichment kiln -15 -6 0 0 0 -20 Lime combustion
optimization Improve lime mud washing
0 -2 0 0 0 0 SO2 control Scrubber 0 -52 -2 0 -29 +10
Gas collection and combustion in lime kiln
-8 -20 0 0 -1 0
Gas collection and combustion in separate furnace
+30 -24 0 0 -1 0
Odor (TRS ) control
Condensate stripping 0 -31 0 0 -1 0 Electrostatic precipitator
0 0 0 0 -60 0 Cyclone 0 0 0 0 -51 0
Particulates control
Bag filter 0 0 0 0 -41 0 Make available of inorganic solid waste to farmers
0 0 0 0 0 -10 Solid waste reduction
Install additional lime kiln
+23 +5 0 0 0 -40
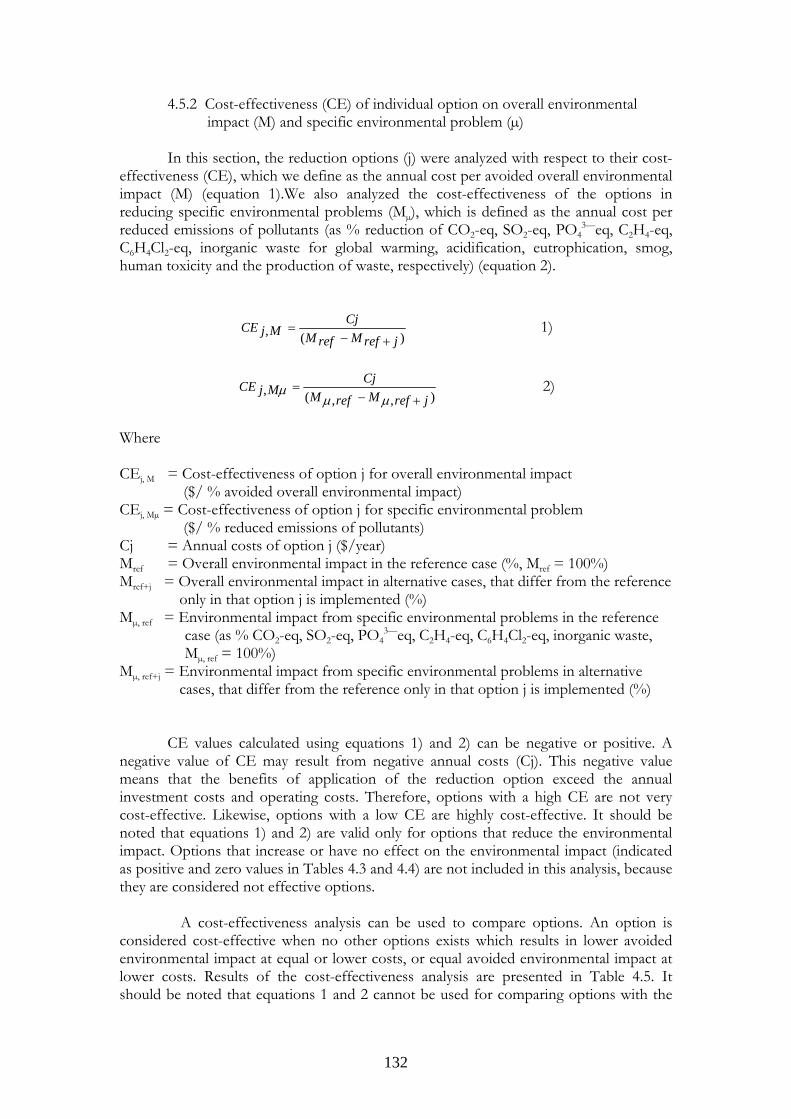
132
4.5.2 Cost-effectiveness (CE) of individual option on overall environmental impact (M) and specific environmental problem (µ)
In this section, the reduction options (j) were analyzed with respect to their cost-effectiveness (CE), which we define as the annual cost per avoided overall environmental impact (M) (equation 1).We also analyzed the cost-effectiveness of the options in reducing specific environmental problems (Mµ), which is defined as the annual cost per reduced emissions of pollutants (as % reduction of CO2-eq, SO2-eq, PO4
3—eq, C2H4-eq, C6H4Cl2-eq, inorganic waste for global warming, acidification, eutrophication, smog, human toxicity and the production of waste, respectively) (equation 2).
)(,jrefMrefM
CjMjCE
+−= 1)
),,(,jrefMrefM
CjMjCE
+−=
µµµ 2)
Where CEj, M = Cost-effectiveness of option j for overall environmental impact ($/ % avoided overall environmental impact) CEj, Mµ = Cost-effectiveness of option j for specific environmental problem ($/ % reduced emissions of pollutants) Cj = Annual costs of option j ($/year) Mref = Overall environmental impact in the reference case (%, Mref = 100%) Mref+j = Overall environmental impact in alternative cases, that differ from the reference
only in that option j is implemented (%) Mµ, ref = Environmental impact from specific environmental problems in the reference
case (as % CO2-eq, SO2-eq, PO43—eq, C2H4-eq, C6H4Cl2-eq, inorganic waste,
Mµ, ref = 100%) Mµ, ref+j = Environmental impact from specific environmental problems in alternative
cases, that differ from the reference only in that option j is implemented (%)
CE values calculated using equations 1) and 2) can be negative or positive. A
negative value of CE may result from negative annual costs (Cj). This negative value means that the benefits of application of the reduction option exceed the annual investment costs and operating costs. Therefore, options with a high CE are not very cost-effective. Likewise, options with a low CE are highly cost-effective. It should be noted that equations 1) and 2) are valid only for options that reduce the environmental impact. Options that increase or have no effect on the environmental impact (indicated as positive and zero values in Tables 4.3 and 4.4) are not included in this analysis, because they are considered not effective options.
A cost-effectiveness analysis can be used to compare options. An option is considered cost-effective when no other options exists which results in lower avoided environmental impact at equal or lower costs, or equal avoided environmental impact at lower costs. Results of the cost-effectiveness analysis are presented in Table 4.5. It should be noted that equations 1 and 2 cannot be used for comparing options with the
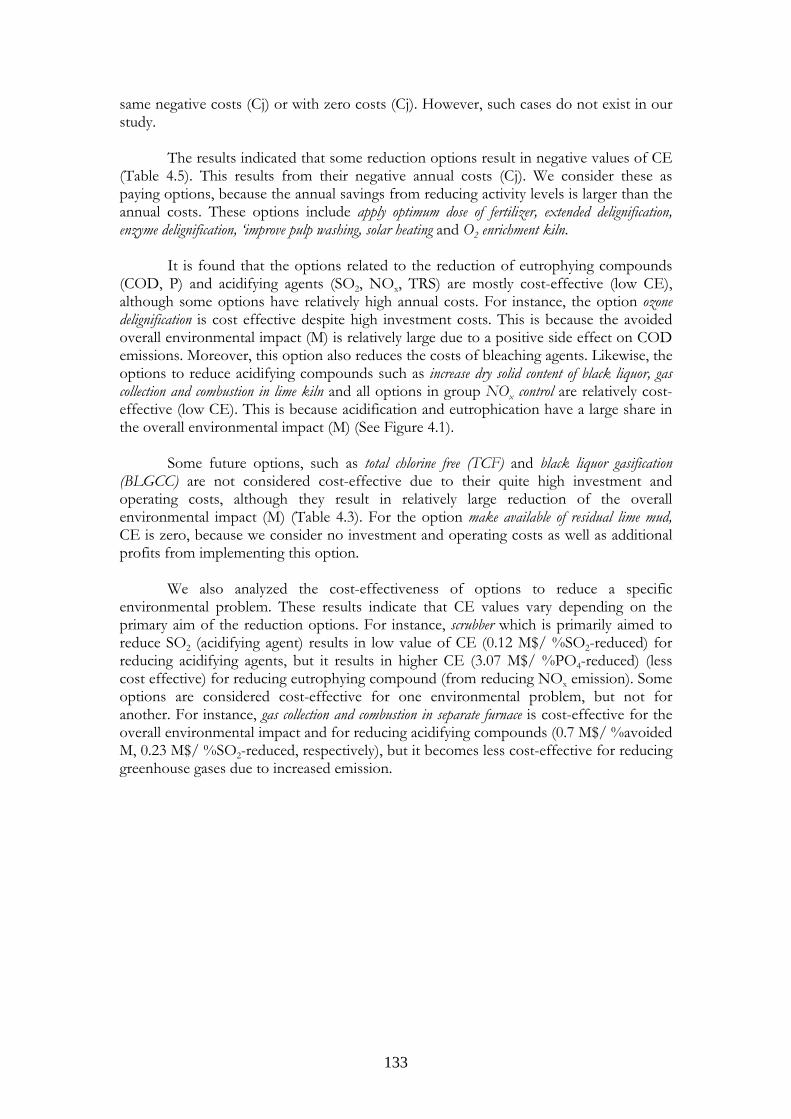
133
same negative costs (Cj) or with zero costs (Cj). However, such cases do not exist in our study.
The results indicated that some reduction options result in negative values of CE (Table 4.5). This results from their negative annual costs (Cj). We consider these as paying options, because the annual savings from reducing activity levels is larger than the annual costs. These options include apply optimum dose of fertilizer, extended delignification, enzyme delignification, ‘improve pulp washing, solar heating and O2 enrichment kiln.
It is found that the options related to the reduction of eutrophying compounds (COD, P) and acidifying agents (SO2, NOx, TRS) are mostly cost-effective (low CE), although some options have relatively high annual costs. For instance, the option ozone delignification is cost effective despite high investment costs. This is because the avoided overall environmental impact (M) is relatively large due to a positive side effect on COD emissions. Moreover, this option also reduces the costs of bleaching agents. Likewise, the options to reduce acidifying compounds such as increase dry solid content of black liquor, gas collection and combustion in lime kiln and all options in group NOx control are relatively cost-effective (low CE). This is because acidification and eutrophication have a large share in the overall environmental impact (M) (See Figure 4.1).
Some future options, such as total chlorine free (TCF) and black liquor gasification (BLGCC) are not considered cost-effective due to their quite high investment and operating costs, although they result in relatively large reduction of the overall environmental impact (M) (Table 4.3). For the option make available of residual lime mud, CE is zero, because we consider no investment and operating costs as well as additional profits from implementing this option. We also analyzed the cost-effectiveness of options to reduce a specific environmental problem. These results indicate that CE values vary depending on the primary aim of the reduction options. For instance, scrubber which is primarily aimed to reduce SO2 (acidifying agent) results in low value of CE (0.12 M$/ %SO2-reduced) for reducing acidifying agents, but it results in higher CE (3.07 M$/ %PO4-reduced) (less cost effective) for reducing eutrophying compound (from reducing NOx emission). Some options are considered cost-effective for one environmental problem, but not for another. For instance, gas collection and combustion in separate furnace is cost-effective for the overall environmental impact and for reducing acidifying compounds (0.7 M$/ %avoided M, 0.23 M$/ %SO2-reduced, respectively), but it becomes less cost-effective for reducing greenhouse gases due to increased emission.
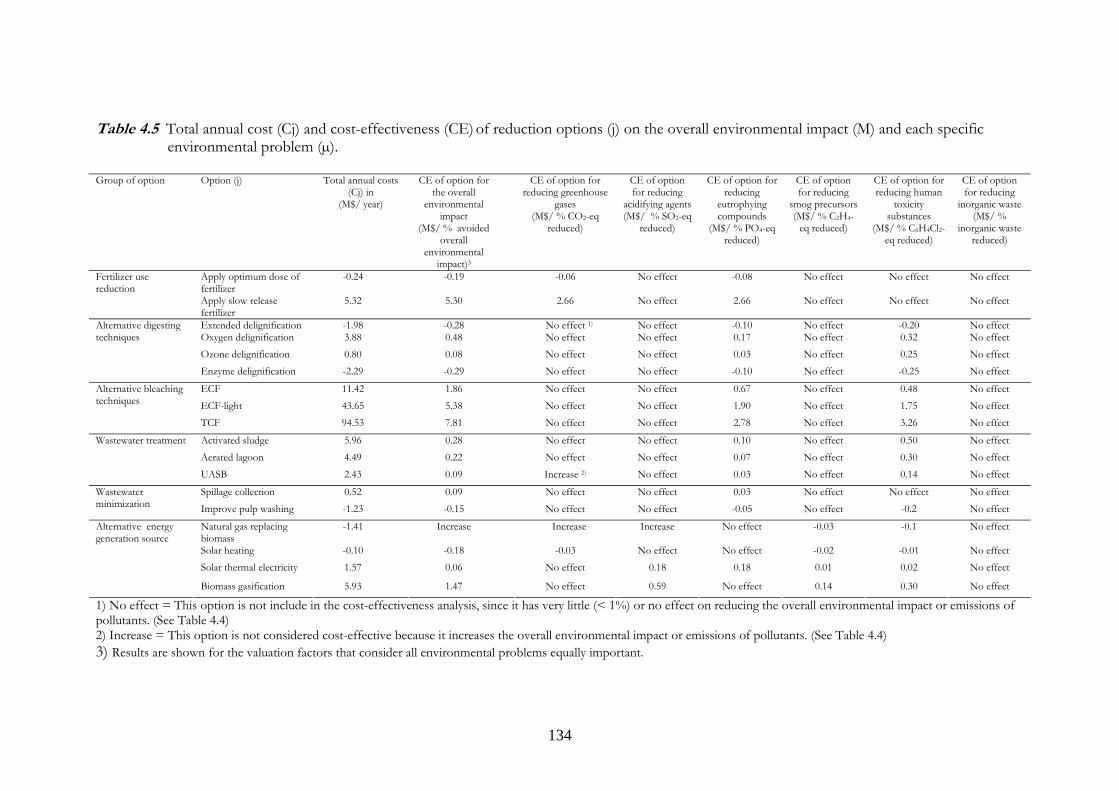
134
Table 4.5 Total annual cost (Cj) and cost-effectiveness (CE) of reduction options (j) on the overall environmental impact (M) and each specific environmental problem (µ).
Group of option Option (j) Total annual costs
(Cj) in (M$/ year)
CE of option for the overall
environmental impact
(M$/ % avoided overall
environmental impact)3
CE of option for reducing greenhouse
gases (M$/ % CO2-eq
reduced)
CE of option for reducing
acidifying agents (M$/ % SO2-eq
reduced)
CE of option for reducing
eutrophying compounds
(M$/ % PO4-eq reduced)
CE of option for reducing
smog precursors (M$/ % C2H4-
eq reduced)
CE of option for reducing human
toxicity substances
(M$/ % C6H4Cl2-eq reduced)
CE of option for reducing
inorganic waste (M$/ %
inorganic waste reduced)
Apply optimum dose of fertilizer
-0.24 -0.19 -0.06 No effect -0.08 No effect No effect No effect Fertilizer use reduction
Apply slow release fertilizer
5.32 5.30 2.66 No effect 2.66 No effect No effect No effect Extended delignification -1.98 -0.28 No effect 1) No effect -0.10 No effect -0.20 No effect Oxygen delignification 3.88 0.48 No effect No effect 0.17 No effect 0.32 No effect Ozone delignification 0.80 0.08 No effect No effect 0.03 No effect 0.25 No effect
Alternative digesting techniques
Enzyme delignification -2.29 -0.29 No effect No effect -0.10 No effect -0.25 No effect ECF 11.42 1.86 No effect No effect 0.67 No effect 0.48 No effect ECF-light 43.65 5.38 No effect No effect 1.90 No effect 1.75 No effect
Alternative bleaching techniques
TCF 94.53 7.81 No effect No effect 2.78 No effect 3.26 No effect Activated sludge 5.96 0.28 No effect No effect 0.10 No effect 0.50 No effect Aerated lagoon 4.49 0.22 No effect No effect 0.07 No effect 0.30 No effect
Wastewater treatment
UASB 2.43 0.09 Increase 2) No effect 0.03 No effect 0.14 No effect Spillage collection 0.52 0.09 No effect No effect 0.03 No effect No effect No effect Wastewater
minimization Improve pulp washing -1.23 -0.15 No effect No effect -0.05 No effect -0.2 No effect Natural gas replacing biomass
-1.41 Increase Increase Increase No effect -0.03 -0.1 No effect Solar heating -0.10 -0.18 -0.03 No effect No effect -0.02 -0.01 No effect Solar thermal electricity 1.57 0.06 No effect 0.18 0.18 0.01 0.02 No effect
Alternative energy generation source
Biomass gasification 5.93 1.47 No effect 0.59 No effect 0.14 0.30 No effect 1) No effect = This option is not include in the cost-effectiveness analysis, since it has very little (< 1%) or no effect on reducing the overall environmental impact or emissions of pollutants. (See Table 4.4) 2) Increase = This option is not considered cost-effective because it increases the overall environmental impact or emissions of pollutants. (See Table 4.4) 3) Results are shown for the valuation factors that consider all environmental problems equally important.
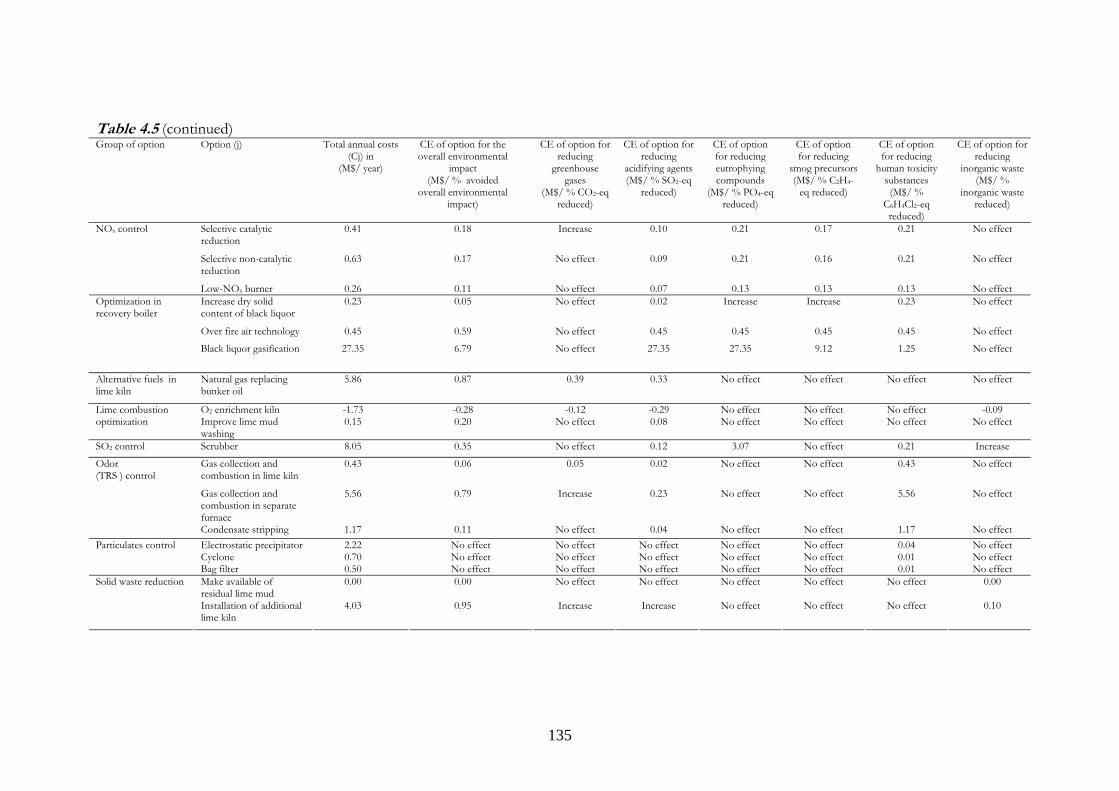
135
Table 4.5 (continued) Group of option Option (j) Total annual costs
(Cj) in (M$/ year)
CE of option for the overall environmental
impact (M$/ % avoided
overall environmental impact)
CE of option for reducing
greenhouse gases
(M$/ % CO2-eq reduced)
CE of option for reducing
acidifying agents (M$/ % SO2-eq
reduced)
CE of option for reducing eutrophying compounds
(M$/ % PO4-eq reduced)
CE of option for reducing
smog precursors (M$/ % C2H4-
eq reduced)
CE of option for reducing
human toxicity substances (M$/ %
C6H4Cl2-eq reduced)
CE of option for reducing
inorganic waste (M$/ %
inorganic waste reduced)
Selective catalytic reduction
0.41 0.18 Increase 0.10 0.21 0.17 0.21 No effect
Selective non-catalytic reduction
0.63 0.17 No effect 0.09 0.21 0.16 0.21 No effect
NOx control
Low-NOx burner 0.26 0.11 No effect 0.07 0.13 0.13 0.13 No effect Increase dry solid content of black liquor
0.23 0.05 No effect 0.02 Increase Increase 0.23 No effect
Over fire air technology 0.45 0.59 No effect 0.45 0.45 0.45 0.45 No effect
Optimization in recovery boiler
Black liquor gasification 27.35 6.79 No effect 27.35 27.35 9.12 1.25 No effect
Alternative fuels in lime kiln
Natural gas replacing bunker oil
5.86 0.87 0.39 0.33 No effect No effect No effect No effect
O2 enrichment kiln -1.73 -0.28 -0.12 -0.29 No effect No effect No effect -0.09 Lime combustion optimization Improve lime mud
washing 0.15 0.20 No effect 0.08 No effect No effect No effect No effect
SO2 control Scrubber 8.05 0.35 No effect 0.12 3.07 No effect 0.21 Increase
Gas collection and combustion in lime kiln
0.43 0.06 0.05 0.02 No effect No effect 0.43 No effect
Gas collection and combustion in separate furnace
5.56 0.79 Increase 0.23 No effect No effect 5.56 No effect
Odor (TRS ) control
Condensate stripping 1.17 0.11 No effect 0.04 No effect No effect 1.17 No effect Electrostatic precipitator 2.22 No effect No effect No effect No effect No effect 0.04 No effect Cyclone 0.70 No effect No effect No effect No effect No effect 0.01 No effect
Particulates control
Bag filter 0.50 No effect No effect No effect No effect No effect 0.01 No effect Make available of residual lime mud
0.00 0.00 No effect No effect No effect No effect No effect 0.00 Solid waste reduction
Installation of additional lime kiln
4.03 0.95 Increase Increase No effect No effect No effect 0.10
136
4.6 Conclusion In this study we explore the behavior of our model of the Thai Kraft pulp
industry as described in a previous study (Jawjit et al., submitted (Chapter 3)). Firstly, we compared our model results with some Thailand-based studies. This shows that our model is adequate for analyses of the environmental impact from Kraft pulp industry in Thailand. Next, we analyzed a reference case, in which we assume that no options to reduce the environmental impact from Kraft pulp industry in Thailand are implemented. The analysis of the reference case reflects the behavior of the model, and reveals the important environmental problems and their causes. Eutrophication and acidification were found to be the most important environmental problems caused by Kraft pulp industry in Thailand. Global warming, smog and human toxicity problems have a relatively small share in the overall environmental impact. We also analyzed the contribution of sub-units in Kraft pulp industry. Lime kilns, pulp bleaching units and recovery boilers were found to be the most important causes of the overall environmental impact. These three sub-units are important sources of eutrophying emissions (from pulp bleaching units), acidifying emissions (from lime kilns and recovery boilers) and the production of inorganic waste (from lime kilns). The analysis of the reference case also reveals that our model is not very sensitive to the choice of valuation methods used to weigh the different environmental problems in the multi-criteria analyses.
Next, the reduction options were analyzed with respect to their effectiveness in reducing the overall environmental impact, and with respect to their effectiveness in reducing global warming, acidification, eutrophication, smog, human toxicity and the production of waste. The results indicate that the groups of options associated with reducing emissions of eutrophying compounds (wastewater treatment, wastewater minimization, alternative digesting and bleaching techniques) and acidifying compounds (SO2 control and odor control) are relatively effective in reducing the overall environmental impact of the Kraft pulp industry in Thailand. This is because eutrophication and acidification are the most important contributors to the overall environmental impact.
The cost-effectiveness (CE) of the reduction options was also analyzed. Some
options were found to be ‘paying options’ (having a negative value of CE), because the annual savings from implementing these option are larger than the annual costs. Paying options include apply optimum dose of fertilizer, extended delignification, enzyme delignification, improve pulp washing, solar heating, and O2 enrichment kiln. In general, options that aim to reduce pollution at the source like improve pulp washing, increase dry solid content of black liquor and spillage control seem to be more cost-effective than typical end-of-pipe techniques like activated sludge and scrubbers.
.
137
4.7 Discussion Our model is aimed to quantify emissions (E) and environmental impacts (M)
caused by the Kraft pulp industry in Thailand, and to estimate the effect of pollution reduction options (j) on the environmental impact and their associated costs (C). Results from our model calculation are compared estimated from selected literature sources. However, this comparison did not included emissions from eucalyptus forestry sub-system and emissions of CH4, N2O, CO and NMVOC due to limitation of the local information. In the future, the comparison or model validation could be more accurate and complete, if the availability and quality of this missing Thailand-specific information is improved. For now, we consider the information used in this comparison as the best available data, and we consider the model adequate for analyses of the environmental impact of Kraft pulp industry in Thailand.
The results of analysis of the reference case may help prioritizing environmental management. To reduce the overall environmental impact of Thailand’s Kraft pulp industry, one could best focus on reducing eutrophication and acidification. Moreover, industrial concern about eutrophication and acidification would be in line with the so-called “Polluter Pay Principle (PPP)”, which is now (2005) at the initial stage of implementation for wastewater problems and possibly in the near future for air pollution. The PPP is used to regulate the pollution control on the basis of loading (which is consistent with the approach in our model) rather than on the basis of concentrations, which is current practice. This upcoming change will challenge Thailand’s Kraft pulp industries to adjust their strategies on environmental policies.
Production of waste was found to be another important environmental problem
caused by the Kraft pulp industry. A main component of this inorganic waste is lime mud mixed with dredge, grit and ashes. Landfilling of this type of waste will become more and more restricted in Thailand by regulations and as a result of opposition by affected people and society in general. Appropriate areas for landfilling also become scarce and expensive. Alternatives approaches to waste handling may thus be needed.
Kraft pulp industry is a relatively energy intensive industry. Such industries are in general associated with large greenhouse gas emissions. The awareness of the global warming problem has been raising in Thailand since the agreement on the Kyoto protocol. However, our analysis shows that greenhouse gas emissions have a relatively small share in the overall environmental impact of Kraft pulp industry. This is because biomass is the main sources of energy in the Kraft pulp mills in Thailand (eucalyptus bark combustion and black liquor combustion). We consider the emissions of greenhouse gases zero for bio-based fuels. As a result, the Kraft pulp industry in Thailand can be considered a minor contributor to global warming. In this study, we analyzed options as if they would be implemented individually. In reality, however, companies will combine different reduction options and implement them simultaneously. Our analyses of the effectiveness and the cost-effectiveness of individual reduction options may help decision makers in choosing reduction options that are in line with their preferred environmental strategies. For example, a person preferring to focus on reducing acidification, may choose from each group of options the option that is most effective in reducing acidifying emissions (Table 4.4). Alternatively, if a company would like to base its decisions on economic arguments, the most cost effective option may be chosen from each group of reduction option (Table 4.5). Clearly,
138
different environmental strategies will lead to different combinations of options. Our model may be used to analyze the environmental consequences of such combinations, and the associated costs of emission control. As such the model is highly relevant for the decision makers.
The strength of our model is its capability to evaluate options to reduce the environmental impact of the Kraft pulp industry in Thailand, while taking into account both the different environmental problems and the cost-effectiveness of the reduction options. Our model allows the users to analyze any environmental problem of interest, and to make user-defined combination of options. Alternatively, the model can be used to compare different environmental problems or to analyze the overall environmental impact using one overall indicator. The latter is done by multi-criteria analysis (MCA), in which the valuation of different environmental problems is essential. There are several valuation methods available, and the choice of which method to use is subjective. It may not be wise to use only one valuation method as a basis for decision-making. We therefore explored four different valuation methods. Comparing the results from these different MCA approaches reveals only small differences. We therefore conclude that our model is not very sensitive to the different MCA approaches. The results from our model may provide useful information for the decision makers and the Kraft pulp industry in Thailand. It may help them to prepare for strategies to reduce the environmental impact.
139
References AIT. 1999. Cleaner production in the pulp and paper industry: Technology fact sheets. Asian Institute of Technology. Pathumthani. Thailand. Azapagic A, Clift R. 1999. The application of life cycle assessment to process optimization. Computers & Chemical Engineering 23(10):1509-1526. Cavallaro F, Ciraolo L. 2005. A multicriteria approach to evaluate wind energy plants on an Italian island. Energy Policy 33(2):235-244. Checkland P B. 1979. Techniques in soft systems practice: Building conceptual models, Journal of Applied Systems Analysis 6:41-49. CIFOR. 1999. Guidelines for Applying Multi-Criteria Analysis to the Assessment of Criteria and Indicators; The Criteria and Indicators Toolbox Series 9. Centre for International Forestry Research, Jakarta, Indonesia. Cziner K, Tuomaala M and Hurme M. 2005. Multicriteria decision making in process integration. Journal of Cleaner Production 13:475-483. DIW. 1999. Technical guideline for environmental management for pulp and paper in Thailand. Department of Industrial Work, Bureau of Environmental Technology, Ministry of Industry. Bangkok, Thailand. ERIC and TPPIA. 2002. Application of the production performance indicators in accordance with Global Reporting Initiative (GRI) to Thai pulp and paper industries. Thai Pulp and Paper Industries Association. Bangkok, Thailand. IPCC. 1997. Greenhouse Gas Inventory Reference Manual. IPCC Guidelines for National Greenhouse Gas Inventories Volume 3, Intergovernmental Panel on Climate Change.
Jawjit W, Kroeze C, Soontaranun W and Hordijk L. 2006. An analysis of the environmental pressure exerted by the eucalyptus-based Kraft pulp industry in Thailand. Journal of Environment, Sustainability and Development 8(2):289-311. (Chapter 2 of this thesis) Jawjit W, Kroeze C, Soontaranun W and Hordijk L. Options to Reduce the Environmental Impact by Kraft Pulp Industry in Thailand: Model description. Journal of Cleaner Production (submitted). (Chapter 3 of this thesis) Pineda-Henson R, Culaba A B, Mendoza G A. 2002. Evaluating Evironmental Performance of Pulp and Paper Manufacturing Using the Analytical Hierarchy Process and Life-Cycle Assessment. Journal of Industrial Ecology 6(1):15-28. Pluimers J C. 2001. An Environmental Systems Analysis of Greenhouse Horticulture in the Netherlands: the Tomato Case. PhD Thesis. Wageningen University. Wageningen, The Netherlands. Quaddus M A, Siddique M A B. 2001. Modeling sustainable development planning: A multicriteria decision conferencing approach. Environment International 27(2-3):89-95.

140
TEI. 1997. Thailand’s National Greenhouse Gas Inventory 1990. Thailand Environment Institute, submitted to Office of Environmental Policy and Planning, Ministry of Science, Technology and Environment. Bangkok, Thailand. Vigneswaran S, Jegatheesan V and Visvanathan C. 1999. Industrial waste minimization initiatives in Thailand: concept, examples and pilot scale trials. Journal of Cleaner Production 7:43-47. Wilson B. 1984. System: concepts, methodologies and applications. John Wiley&Sons. Chichester, United Kingdom,
Chapter 3
This chapter has been submitted to Environmental Science and Policy.
This chapter has been accepted for presentation at the international conference The Greening of Agro-Industries and Networks in Asia: Challenges and Opportunities: the 3rd Annual INREF-AGITS Conference at Chulalongkorn University, Bangkok. October, 2006.
Warit Jawjit, Carolien Kroeze, Wit Soontaranun and Leen Hordijk

142
143
Chapter 5: Future Trends in the Environmental Impact of Eucalyptus-based Kraft Pulp Industry in Thailand: A Scenario Analysis
Abstract
This study explores possible future trends in the environmental impact of the Kraft pulp industry in Thailand between 2000 and 2020. We developed scenarios to analyze the effect of different options to reduce the future environmental impact, and the costs associated with the implementation of these options. The analysis indicates that without currently applied reduction options the environmental impact would be twice as high as it currently is. For a Business-as-Usual scenario, in which no additional pollution reduction options are assumed to be implemented, the overall environmental impact was calculated to increase between 2000 and 2020 by a factor of two. Next, we defined five Environmental Policy scenarios reflecting different strategies to reduce the environmental impact. We conclude that it is theoretically possible to reduce the overall environmental impact by almost 50% relative to the BAU 2020 levels. This scenario, however, may not be feasible because of the high costs involved. Four other Environmental Policy scenarios result in a reduction of the impact by 24-37% relative to the BAU scenario. Based on these results, it can be concluded that there are different ways to reduce the overall environmental impact by about one-third relative to BAU trends. We also observe relatively large differences in the costs of the options included in the scenarios. We conclude that combining the most cost effective options may be the most interesting strategy for reducing the overall environmental impact of Kraft pulp industry in Thailand. 5.1 Introduction
Pulp and paper industry was founded in Thailand around 1923. Since then, this industry expanded considerably. However, during the nineties the average growth rate of pulp and paper production decreased from about 15% per year around 1990 to 5% per year in 1997. This decrease is due to changes in the price of pulp and paper on the world market and the Asian economic crisis (DIW, 1999). After the economic recession, the industry gradually increased again. For the coming years, the Thai Pulp and Paper Industries Association (TPPIA) anticipates an average growth rate of 5% per year.
In Thailand, most pulp is produced using eucalyptus wood as raw material, even though many other wood and non-wood raw materials are available. Moreover, most Thai pulp is produced through the so-called Kraft (sulfate) process.
The production of pulp is a source of several environmental pollutants, including
greenhouse gases, acidifying compounds, eutrophying compounds, smog precursors, toxic compounds and waste (Gonzalez and Zaror, 2000; Schnell et al., 2000; Ali and Sreekrishnan, 2001; Bordado and Gomes, 2002). This has been challenging pulp entrepreneurs to seek for appropriate environmental policies to manage these problems. Moreover, since the eucalyptus-based Kraft pulp is being exported, the environmental performance should not only meet the domestic environmental regulations, but also take into account the demand for environmentally friendly products in the international market. Analyses of the future trends in the environmental impact of pulp production
144
may help decision makers and the industry to decide on environmental management. Scenario analysis can be used to achieve this objective. To date, no such studies exist for pulp industry in Thailand.
Scenario analysis is an important tool used in environmental systems analysis, and
can be defined as typical descriptions of alternative images of the future, created from mental maps or models that reflect different perspectives on past, present and future developments (Alcamo, 2001). Scenario analysis typically results in a set of answers to “what if” type of questions, illustrating the consequences of a range of alternative decisions (Schwarz, 1997). In this study, it is used as a tool to provide a picture of the future Kraft pulp industry in Thailand. The objective of this study is to analyze future trends (2000-2020) in the environmental pressure6 of eucalyptus-based Kraft pulp industry in Thailand, taking into account the technical and economical implications of combinations of environmental reduction options. A number of scenarios are analyzed based on different strategies to reduce the environmental impact, and the associated costs. To this end, we run a model that we recently developed and that is described elsewhere (Jawjit et al., submitted (Chapter 3)) and summarized in the next section.
5.2 Model description
Our model is aimed to quantify emissions (E) and environmental impacts (M) caused by Kraft pulp industry in Thailand, and to estimate the effect of combinations of pollution reduction options (j) on the environmental impact and their associated costs (C) (Jawjit et al., submitted (Chapter 3)). The model includes two subsystems, which are a eucalyptus forestry subsystem and the Kraft pulp production subsystem. The method applied follows an ‘emission factor’ approach. Thus for each compound released from selected activities (A) an emission factor (F) is identified reflecting the emission per unit of activity. Our model also takes into account possible side effects of emission reduction options on other emissions. These side effects can be both positive (reducing emissions) or negative (increasing emissions).
Thirty six reduction options are included in the model and categorized into 14
independent groups (see Tables 5.1 and 5.2 for an overview7). This enables us to investigate the effect of combinations of reduction options, which can affect the activity levels (A) or emission factors (F). A multiplicative approach is chosen when more than one reduction option is assumed to be applied simultaneously, following Pluimers (2001). Thus their combined effect is calculated as the product of their respective reduction factors. The potential environmental impact (M) of the emissions is calculated from the total amount emitted per time unit (year) and classification factors (CF) of the compounds reflecting their relative importance in specific environmental problems (µ) including global warming, acidification, eutrophication, smog, human toxicity and the production of solid waste. We evaluate the overall environmental impact by use of multi-criteria analysis, in which an overall evaluation is performed on the basis of different criteria (Azapagic and Clift, 1999; Cavallaro and Ciraolo, 2005; CIFOR, 1999: Pineda-Henson et al., 2002; Cziner et al., 2005) that are weighted using four different set of valuation factors (V) (Hermann et al., 2006). The details of the calculation procedure are
6 As mentioned in chapter 1, in this thesis environmental pressure is considered an indicator for the environmental impact and it is therefore considered equivalent to potential environmental impact. 7 Please note that the results presented in Tables 5.1 and 5.2 will be described later in this paper.
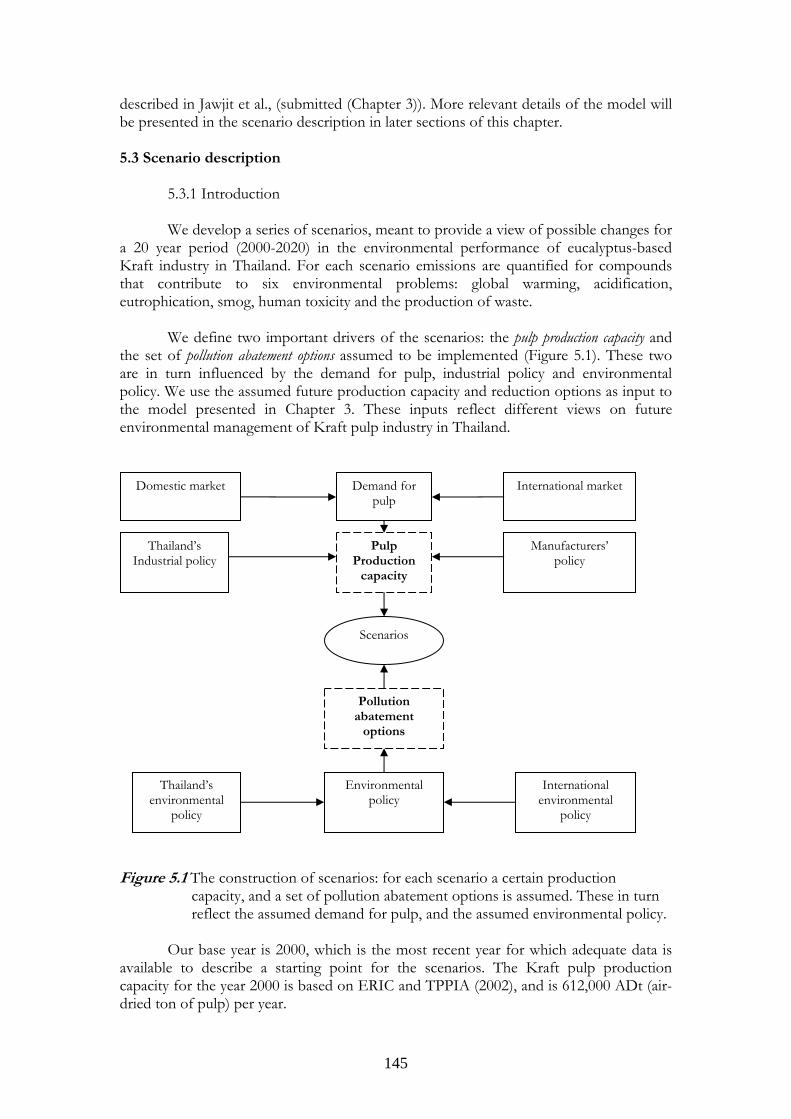
145
described in Jawjit et al., (submitted (Chapter 3)). More relevant details of the model will be presented in the scenario description in later sections of this chapter. 5.3 Scenario description 5.3.1 Introduction We develop a series of scenarios, meant to provide a view of possible changes for a 20 year period (2000-2020) in the environmental performance of eucalyptus-based Kraft industry in Thailand. For each scenario emissions are quantified for compounds that contribute to six environmental problems: global warming, acidification, eutrophication, smog, human toxicity and the production of waste.
We define two important drivers of the scenarios: the pulp production capacity and the set of pollution abatement options assumed to be implemented (Figure 5.1). These two are in turn influenced by the demand for pulp, industrial policy and environmental policy. We use the assumed future production capacity and reduction options as input to the model presented in Chapter 3. These inputs reflect different views on future environmental management of Kraft pulp industry in Thailand.
Figure 5.1 The construction of scenarios: for each scenario a certain production
capacity, and a set of pollution abatement options is assumed. These in turn reflect the assumed demand for pulp, and the assumed environmental policy.
Our base year is 2000, which is the most recent year for which adequate data is
available to describe a starting point for the scenarios. The Kraft pulp production capacity for the year 2000 is based on ERIC and TPPIA (2002), and is 612,000 ADt (air-dried ton of pulp) per year.
Scenarios
Pulp Production
capacity
Environmental policy
Thailand’s environmental
policy
International environmental
policy
Manufacturers’ policy
Thailand’s Industrial policy
Pollution abatement
options
Demand for pulp
Domestic market International market
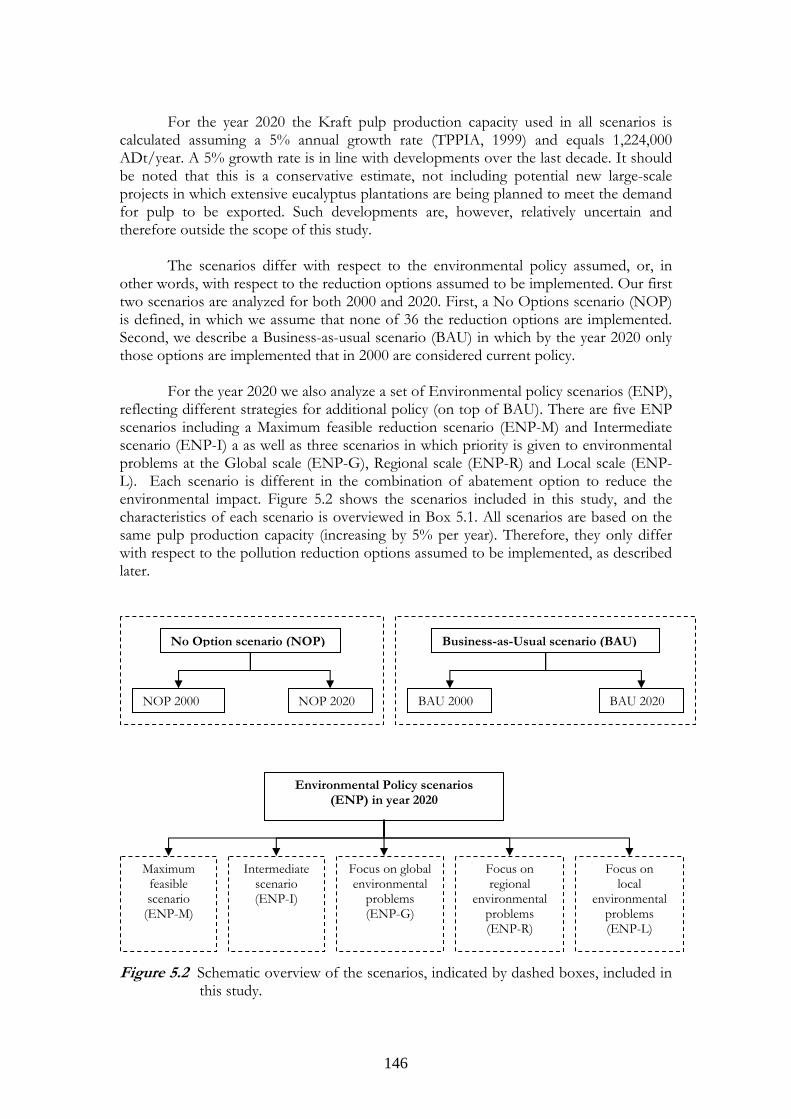
146
For the year 2020 the Kraft pulp production capacity used in all scenarios is calculated assuming a 5% annual growth rate (TPPIA, 1999) and equals 1,224,000 ADt/year. A 5% growth rate is in line with developments over the last decade. It should be noted that this is a conservative estimate, not including potential new large-scale projects in which extensive eucalyptus plantations are being planned to meet the demand for pulp to be exported. Such developments are, however, relatively uncertain and therefore outside the scope of this study.
The scenarios differ with respect to the environmental policy assumed, or, in other words, with respect to the reduction options assumed to be implemented. Our first two scenarios are analyzed for both 2000 and 2020. First, a No Options scenario (NOP) is defined, in which we assume that none of 36 the reduction options are implemented. Second, we describe a Business-as-usual scenario (BAU) in which by the year 2020 only those options are implemented that in 2000 are considered current policy.
For the year 2020 we also analyze a set of Environmental policy scenarios (ENP), reflecting different strategies for additional policy (on top of BAU). There are five ENP scenarios including a Maximum feasible reduction scenario (ENP-M) and Intermediate scenario (ENP-I) a as well as three scenarios in which priority is given to environmental problems at the Global scale (ENP-G), Regional scale (ENP-R) and Local scale (ENP-L). Each scenario is different in the combination of abatement option to reduce the environmental impact. Figure 5.2 shows the scenarios included in this study, and the characteristics of each scenario is overviewed in Box 5.1. All scenarios are based on the same pulp production capacity (increasing by 5% per year). Therefore, they only differ with respect to the pollution reduction options assumed to be implemented, as described later.
Figure 5.2 Schematic overview of the scenarios, indicated by dashed boxes, included in
this study.
No Option scenario (NOP)
NOP 2000 NOP 2020
Business-as-Usual scenario (BAU)
BAU 2000 BAU 2020
Environmental Policy scenarios (ENP) in year 2020
Maximum feasible scenario
(ENP-M)
Intermediate scenario (ENP-I)
Focus on global environmental
problems (ENP-G)
Focus on regional
environmental problems (ENP-R)
Focus on local
environmental problems (ENP-L)
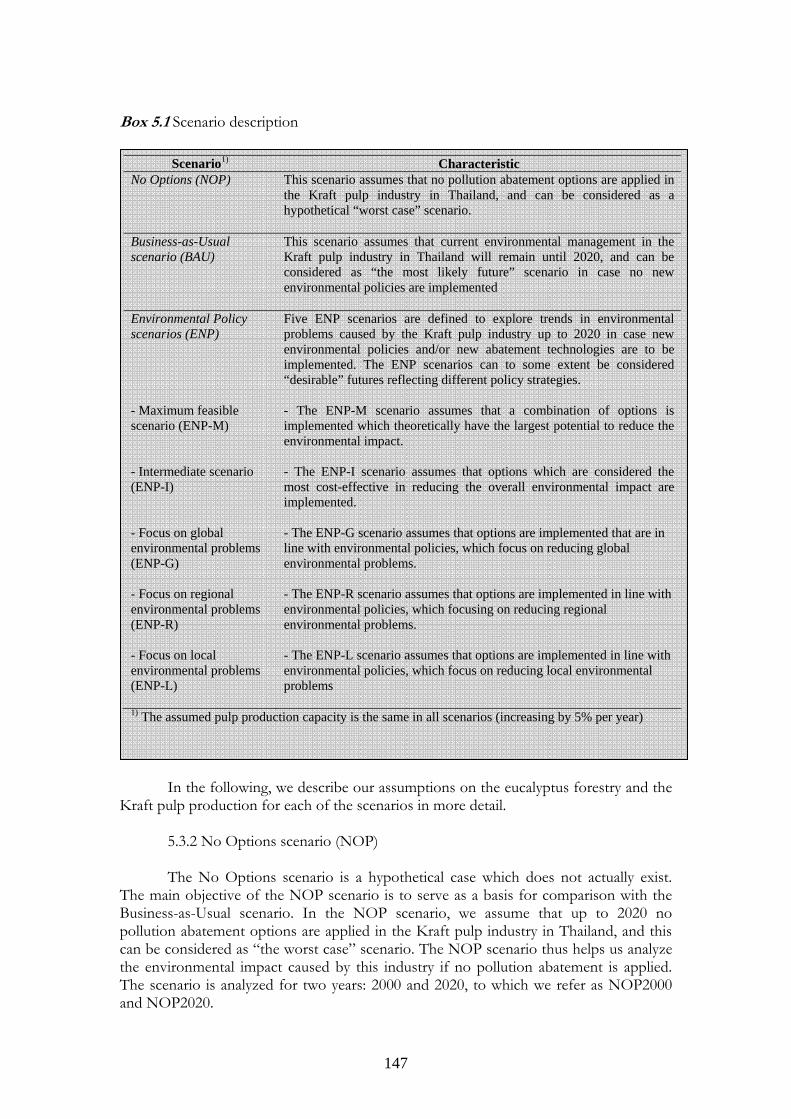
147
Box 5.1 Scenario description
In the following, we describe our assumptions on the eucalyptus forestry and the Kraft pulp production for each of the scenarios in more detail.
5.3.2 No Options scenario (NOP) The No Options scenario is a hypothetical case which does not actually exist. The main objective of the NOP scenario is to serve as a basis for comparison with the Business-as-Usual scenario. In the NOP scenario, we assume that up to 2020 no pollution abatement options are applied in the Kraft pulp industry in Thailand, and this can be considered as “the worst case” scenario. The NOP scenario thus helps us analyze the environmental impact caused by this industry if no pollution abatement is applied. The scenario is analyzed for two years: 2000 and 2020, to which we refer as NOP2000 and NOP2020.
Scenario1) Characteristic No Options (NOP) This scenario assumes that no pollution abatement options are applied in
the Kraft pulp industry in Thailand, and can be considered as a hypothetical “worst case” scenario.
Business-as-Usual scenario (BAU)
This scenario assumes that current environmental management in the Kraft pulp industry in Thailand will remain until 2020, and can be considered as “the most likely future” scenario in case no new environmental policies are implemented
Environmental Policy scenarios (ENP) - Maximum feasible scenario (ENP-M) - Intermediate scenario (ENP-I) - Focus on global environmental problems (ENP-G) - Focus on regional environmental problems (ENP-R) - Focus on local environmental problems (ENP-L)
Five ENP scenarios are defined to explore trends in environmental problems caused by the Kraft pulp industry up to 2020 in case new environmental policies and/or new abatement technologies are to be implemented. The ENP scenarios can to some extent be considered “desirable” futures reflecting different policy strategies. - The ENP-M scenario assumes that a combination of options is implemented which theoretically have the largest potential to reduce the environmental impact. - The ENP-I scenario assumes that options which are considered the most cost-effective in reducing the overall environmental impact are implemented. - The ENP-G scenario assumes that options are implemented that are in line with environmental policies, which focus on reducing global environmental problems. - The ENP-R scenario assumes that options are implemented in line with environmental policies, which focusing on reducing regional environmental problems. - The ENP-L scenario assumes that options are implemented in line with environmental policies, which focus on reducing local environmental problems
1) The assumed pulp production capacity is the same in all scenarios (increasing by 5% per year)
148
For eucalyptus plantation in the NOP scenario, fertilizer is assumed to be used at a level that ensures maximum yield for intensive plantation. The amount of fertilizer use is based on recommendations to foresters (Poethai, 1997).
In the Kraft pulp production process, eucalyptus timber is first chipped to a uniform chip-size before feeding to digester. Sodium sulfide (Na2S) and sodium hydroxide (NaOH) are the major chemicals used for digesting (Sakurai, 1995).We assume that no additional technique is applied to enhance lignin fragmentation. A subsequent pulp washing step, performed by conventional drum washer, separates the cellulose fibers from the remaining solution containing the spent pulping chemicals and the lignin and hemicellulose from the wood. This solution is called ‘Black liquor’, which is subsequently sent to the chemical recovery unit to generate energy and recover cooking chemicals. The next step is the bleaching process. For the NOP scenario, we assume a bleaching sequence used in one of the largest Kraft pulp mills in the early 1990s in Thailand. That bleaching sequence is C-Eo-D-D (C= elemental chlorine, Eo = alkali (NaOH) extraction with subsequent addition of oxygen, D = chlorine dioxide) (Sakurai, 1995). Whitened pulp is then washed to remove the contaminants before dewatering and sheet forming. We assume that there is no wastewater control in the Kraft pulp production unit and that all wastewater is discharged to surface water without treatment.
We also assume that no pollution abatement options are applied in the NOP
scenarios in the chemical recovery unit. The recovery process normally starts with concentrating black liquor in an evaporator, and then burning it in a conventional Tomlinson recovery boiler to recover the chemicals and to generate energy. The inorganic fraction of the black liquor leaves the Tomlinson reactor as a molten smelt containing largely sodium sulfide (Na2S) and sodium carbonate (Na2CO3). The smelt is dissolved in water to form green liquor that is later sent to a causticizer, where lime (CaO) is applied to convert the Na2CO3 back to the desired caustic pulping chemical, NaOH. The lime is converted to calcium carbonate (CaCO3) in the causticizer and can be recovered by calcination in a lime kiln. In the NOP scenario, bunker oil is used as a fuel for lime calcination. In the energy generation unit, eucalyptus bark plus wood dust from the wood preparation stage are sent to the biomass boiler (bark-fired boiler) to generate energy. In the NOP scenario, we assume that all electricity needed is produced in the mill itself by the co-generation system. We also assume that no pollution abatement measures are applied in the energy generation unit.
For the production of solid waste, we focus on inorganic waste, such as residual
lime mud, dredges and grit. Dredges, grit and ashes are often mixed with the lime mud. It is difficult to explicitly quantify each of these three (EC, 2001). In this study, we therefore lump these in one type of inorganic solid waste. In the NOP scenario, we assume that these inorganic wastes, which are mainly from the chemical recovery unit, are all landfilled.
5.3.3 Business-as-Usual scenario (BAU) In the Business-as-Usual scenario it is assumed that the current level of environmental management in the Kraft pulp industry in Thailand will continue to exist until 2020. The BAU scenario reflects the most likely future environmental impact caused by this industry, in case new environmental policies either do not exist or do not have a discernable influence on the environment. The BAU scenario is based on the
149
pollution abatement options that are currently applied (technology used in the year 2000) and current environment control policies. The BAU scenario thus help us analyze trends in the environmental problems generated by this industry if no additional abatement technologies and/or no new control policies are implemented. The BAU scenario is analyzed for two years: 2000 and 2020, to which we refer as BAU2000 and BAU2020. The BAU 2000 scenario reflects the current environmental management of the Kraft pulp mills in Thailand, which is influenced by two important environmental regulations including 1) the 1992 National environmental quality promotion and preservation Act, and 2) the 1992 Factory Act. In line with these acts, the mills focus on controlling SO2, NOx, CO, particulates, COD. Several options to reduce emissions of these pollutants are applied including, for example, scrubbers (for SO2, NOx control), electrostatic precipitators (for particulate control), and aerobic wastewater treatment (Table 5.3). In addition, losses of chlorinated compounds measured as AOX (adsorbable organic halide), which are not mentioned in the current Thai environmental laws have also been controlled since the last decade, because of concern on environmentally friendly pulp in the international market. Technical options are applied to reduce AOX emission from bleaching including elementary chlorine free (ECF) bleaching, which is applied to replace elementary chlorine bleaching used in the beginning of the nineties, and additional pulp digesting processes (Vigneswaran et al., 1999). The reduction options assumed to be implemented in the BAU 2000 scenario are based on information about technology, which is obtained by site visits in the year 2003, including interviews of experts and technicians. We consider this information applicable to the year 2000. For the BAU 2020 scenario, we assume that the current environmental laws will still be used, and no additional regulations/ policies will be employed. This implies that the regulations for pollution control will still be implemented on concentration-basis in 2020. This may be not realistic since loading-basis pollution control is now (year 2005) at the initial stage of development, and may be introduced in the near future in Thailand. The reduction options included in the BAU 2020 scenario are assumed to be the same as those in the BAU 2000 scenario (Table 5.3).
5.3.4 Environmental Policy scenario (ENP)
The Environmental Policy (ENP) scenarios are meant to analyze future effects of different environmental policies and, associated with that, implementation of additional and/ or improved pollution abatement options to reduce the environmental problems. The ENP scenarios can be considered as possible scenarios, or perhaps desirable scenarios reflecting different policy strategies.
Five ENP scenarios are introduced, including ENP-M, ENP-I, ENP-G, ENP-R and ENP-L. These scenarios reflect the effect of different environmental policies on the possible future environmental impact from the Kraft pulp industry in Thailand. The different ENP scenarios assume that different combinations of options are implemented for emission reduction. The selection of options in the combinations in these five scenarios is based on the results of an earlier analysis of individual options (Jawjit et al., submitted (Chapter 4)). Here, we briefly summarize the results of that study, including the effectiveness and the cost effectiveness of the individual options in reducing the environmental impact (Tables 5.1 and 5.2). In the following paragraph, we describe each ENP scenario and a method to select options to form a combination of options for each ENP scenario.
150
ENP-Maximum (ENP-M) scenario The ENP-M (M= Maximum) scenario includes a set of options which can be
considered the theoretical maximum potential to reduce emission. In this scenario, from each group of reduction options, one is chosen (Table 5.3). The option, which results in the largest reduction in the overall environmental impact (M) (Table 5.1), is selected. In case options reduce the environmental impact to the same extent, the most cost effective option is selected (Table 5.2). If the options also have the same cost effectiveness (CE), the option with the lowest total annual costs (Cj) is selected (see Table 5.2). The ENP-M scenario must be considered unrealistic because the practicality and economic feasibility of reduction options are ignored. Like the NOP scenario, the ENP-M scenario is introduced for the sake of comparison.
. ENP-Intermediate (ENP-I) scenario
The ENP-I (I= Intermediate) scenario is an intermediate scenario with more realistic assumptions about the reduction options, because this scenario takes the economic aspect into account. At maximum one option from each group of reduction options is chosen. In this case, the options selected, are the most cost-effective options to reduce the overall environmental impact (M) (Table 5.2). In case the options have equal cost effectiveness (CE), of these the option with the lowest total annual cost (Cj) is selected (see Table 5.2)). ENP-Global (ENP-G) scenario
The ENP-G (G = Global) scenario reflects the effect of environmental policies,
which give priority to reduce global environmental problems. In this study, the only global problem included is global warming. Since Thailand signed the Kyoto protocol, global warming has been given more attention by industrial sector in the last decade. In the ENP-G scenario it is assumed that the Kraft pulp entrepreneurs focus on reducing greenhouse gas emissions. Groups of options which are primarily aimed at reducing greenhouse gas emissions include fertilizer use reduction, alternative energy generation source, alternative fuel in lime kiln and lime combustion optimization (Table 5.1). One option from these groups, which results in the largest reduction of greenhouse gases emissions, is chosen (Table 5.3). For the other groups, the option that is also assumed for the BAU scenario is selected.
ENP-Regional (ENP-R) scenario
The ENP-R (R = Regional) scenario is reflecting environmental policies giving priority to regional environmental problems. In this study, acidification and eutrophication are considered regional problems. In our earlier study, we concluded that acidification and eutrophication have a relatively large contribution in the overall environmental impact of Kraft pulp industry in Thailand (Jawjit et al., submitted (Chapter 4)). The ENP-R scenario is in line with current trends in environmental management of the Thai Kraft pulp industry, because the emissions of some acidifying compounds and eutrophying compounds are under regulations in Thai environmental laws (see the BAU scenario). The groups of option which are meant to reduce these two regional environmental problems include fertilizer use reduction, wastewater treatment, wastewater minimization, alternative energy generation source, NOx control, optimization in recovery
151
boiler, alternative fuel in lime kiln, lime combustion optimization, SO2 control and odor control (Table 5.1). For the ENP-R scenario we selected from each of these groups the option with the largest potential to reduce emissions of acidifying compounds and/ or eutrophying compounds. For the other groups the option is chosen that is also selected in the BAU scenario.
ENP-Local (ENP-L) scenario The ENP-L (L = Local) scenario explores the effect of environmental policies, which focus on reducing local environmental problems. The Kraft pulp industry contributes to the following local problems: smog, human toxicity problems, and the production of inorganic waste. These problems are likely to affect the health of people nearby the mills. Some of pollutants, such as particulates and hydrogen sulfide, are presently controlled by Thai environmental regulations (EEA, 2005). AOX (adsorbable organic halide), which is an important pollutant from the bleaching process, is currently not controlled, but likely to be legislated in the future as a result of requirements for environmentally friendly pulp in the international market. The combination of options included in the ENP-R scenario includes at maximum one option from each group (Table 5.3). The options selected, have the largest potential to reduce the emissions of smog precursor or human toxic substances or the production of inorganic waste. There are exceptions in the groups of fertilizer use reduction, wastewater treatment and wastewater minimization, because these groups are aimed to reduce the emissions of eutrophying compounds. Options to be selected in these three groups are based on the BAU scenario (Table 5.1).
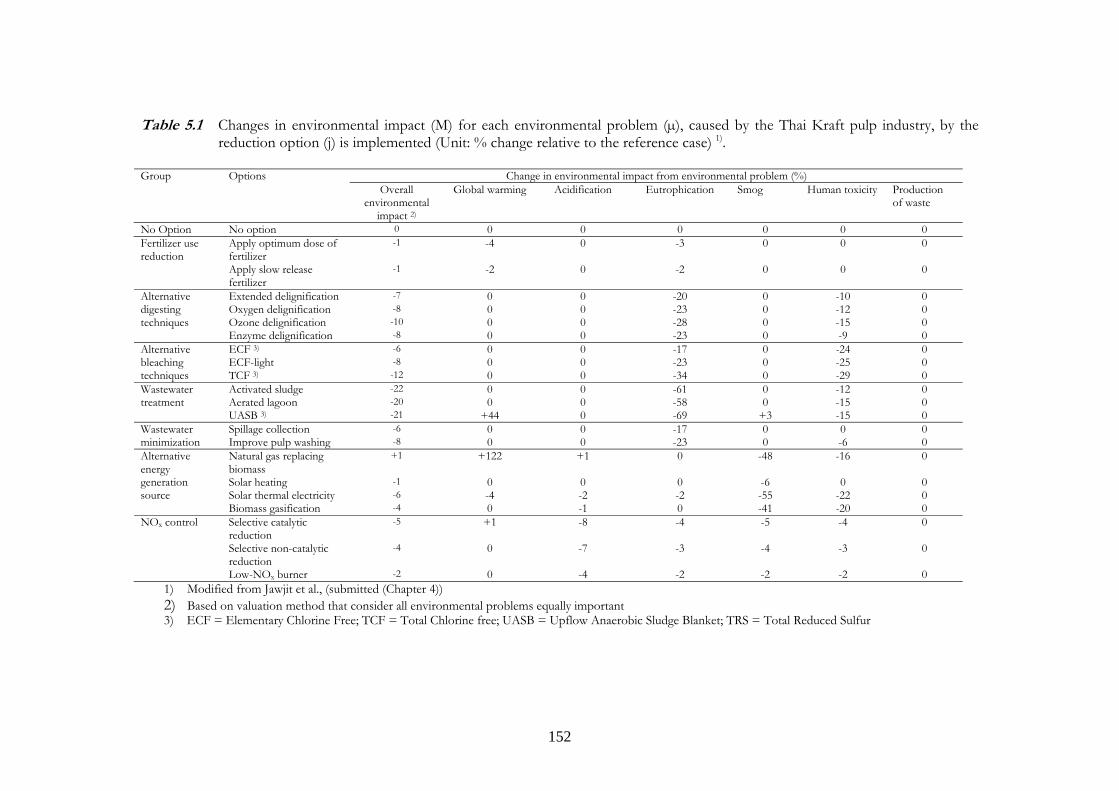
152
Table 5.1 Changes in environmental impact (M) for each environmental problem (µ), caused by the Thai Kraft pulp industry, by the reduction option (j) is implemented (Unit: % change relative to the reference case) 1).
Change in environmental impact from environmental problem (%) Group Options
Overall environmental
impact 2)
Global warming Acidification Eutrophication Smog Human toxicity Production of waste
No Option No option 0 0 0 0 0 0 0 Apply optimum dose of fertilizer
-1 -4 0 -3 0 0 0 Fertilizer use reduction
Apply slow release fertilizer
-1 -2 0 -2 0 0 0
Extended delignification -7 0 0 -20 0 -10 0 Oxygen delignification -8 0 0 -23 0 -12 0 Ozone delignification -10 0 0 -28 0 -15 0
Alternative digesting techniques
Enzyme delignification -8 0 0 -23 0 -9 0 ECF 3) -6 0 0 -17 0 -24 0 ECF-light -8 0 0 -23 0 -25 0
Alternative bleaching techniques TCF 3) -12 0 0 -34 0 -29 0
Activated sludge -22 0 0 -61 0 -12 0 Aerated lagoon -20 0 0 -58 0 -15 0
Wastewater treatment
UASB 3) -21 +44 0 -69 +3 -15 0 Spillage collection -6 0 0 -17 0 0 0 Wastewater
minimization Improve pulp washing -8 0 0 -23 0 -6 0 Natural gas replacing biomass
+1 +122 +1 0 -48 -16 0
Solar heating -1 0 0 0 -6 0 0 Solar thermal electricity -6 -4 -2 -2 -55 -22 0
Alternative energy generation source
Biomass gasification -4 0 -1 0 -41 -20 0 Selective catalytic reduction
-5 +1 -8 -4 -5 -4 0
Selective non-catalytic reduction
-4 0 -7 -3 -4 -3 0
NOx control
Low-NOx burner -2 0 -4 -2 -2 -2 0 1) Modified from Jawjit et al., (submitted (Chapter 4)) 2) Based on valuation method that consider all environmental problems equally important
3) ECF = Elementary Chlorine Free; TCF = Total Chlorine free; UASB = Upflow Anaerobic Sludge Blanket; TRS = Total Reduced Sulfur
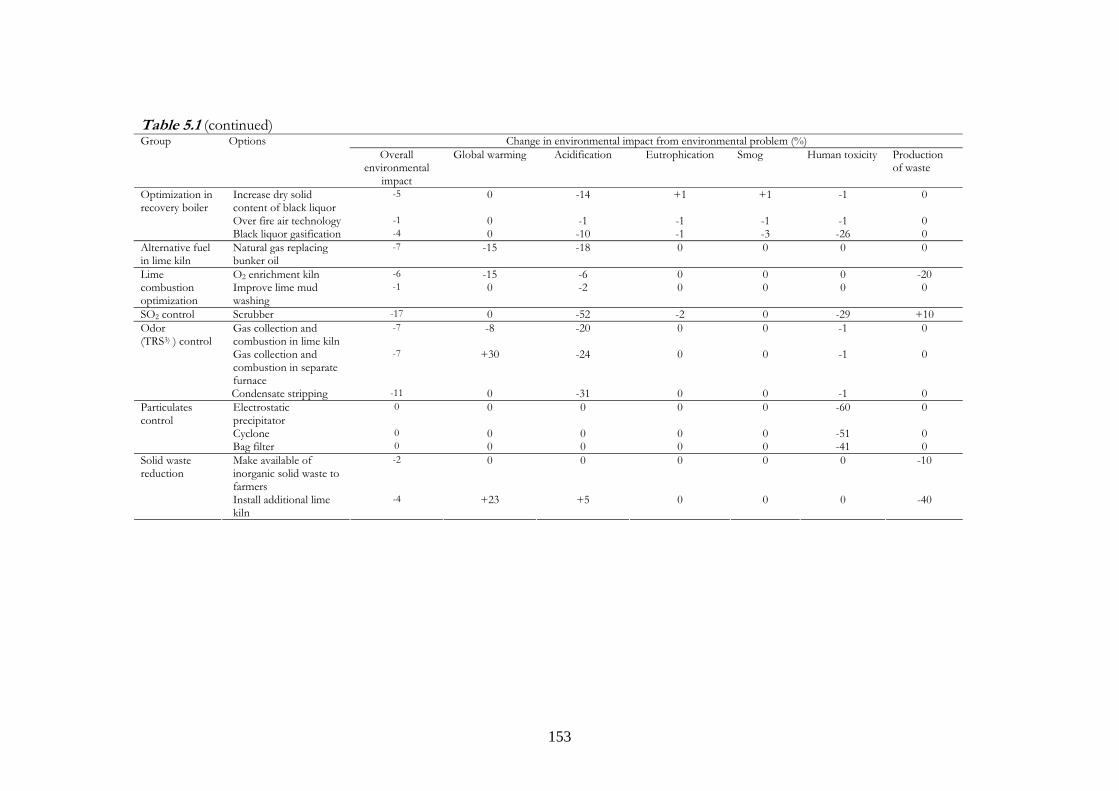
153
Table 5.1 (continued) Change in environmental impact from environmental problem (%) Group Options
Overall environmental
impact
Global warming Acidification Eutrophication Smog Human toxicity Production of waste
Increase dry solid content of black liquor
-5 0 -14 +1 +1 -1 0
Over fire air technology -1 0 -1 -1 -1 -1 0
Optimization in recovery boiler
Black liquor gasification -4 0 -10 -1 -3 -26 0 Alternative fuel in lime kiln
Natural gas replacing bunker oil
-7 -15 -18 0 0 0 0
O2 enrichment kiln -6 -15 -6 0 0 0 -20 Lime combustion optimization
Improve lime mud washing
-1 0 -2 0 0 0 0
SO2 control Scrubber -17 0 -52 -2 0 -29 +10 Gas collection and combustion in lime kiln
-7 -8 -20 0 0 -1 0
Gas collection and combustion in separate furnace
-7 +30 -24 0 0 -1 0
Odor (TRS3) ) control
Condensate stripping -11 0 -31 0 0 -1 0 Electrostatic precipitator
0 0 0 0 0 -60 0
Cyclone 0 0 0 0 0 -51 0
Particulates control
Bag filter 0 0 0 0 0 -41 0 Make available of inorganic solid waste to farmers
-2 0 0 0 0 0 -10 Solid waste reduction
Install additional lime kiln
-4 +23 +5 0 0 0 -40
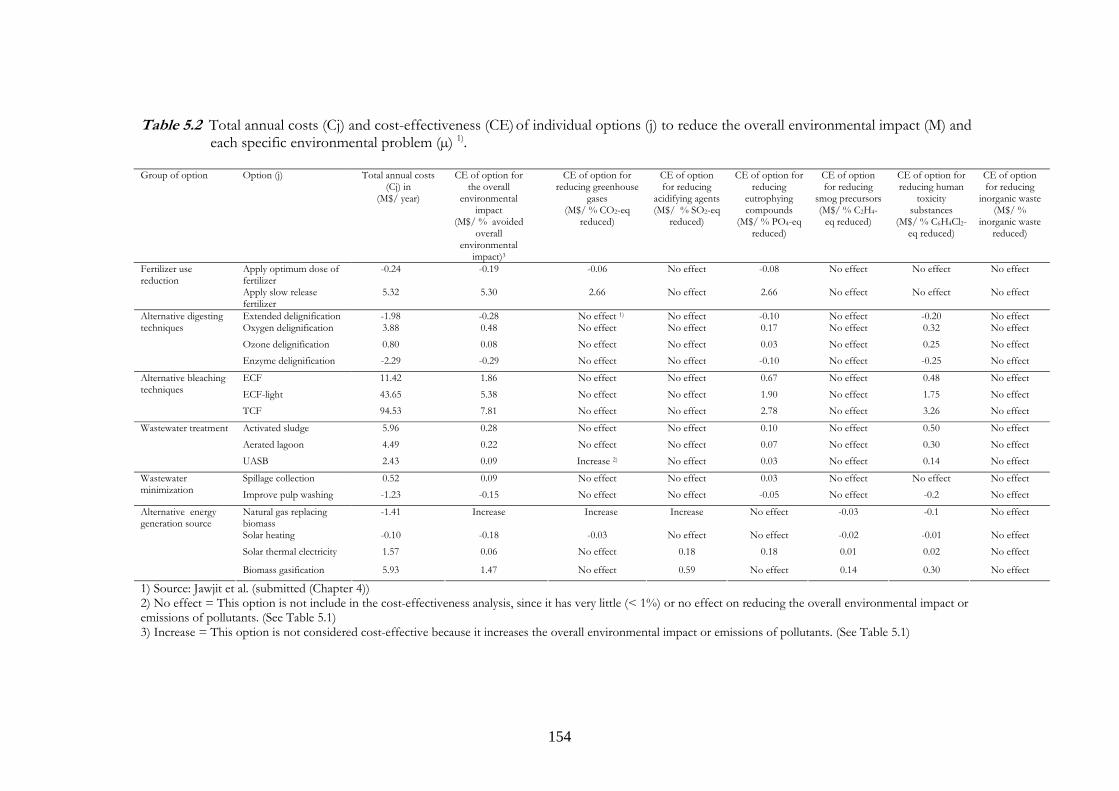
154
Table 5.2 Total annual costs (Cj) and cost-effectiveness (CE) of individual options (j) to reduce the overall environmental impact (M) and each specific environmental problem (µ) 1).
Group of option Option (j) Total annual costs
(Cj) in (M$/ year)
CE of option for the overall
environmental impact
(M$/ % avoided overall
environmental impact)3
CE of option for reducing greenhouse
gases (M$/ % CO2-eq
reduced)
CE of option for reducing
acidifying agents (M$/ % SO2-eq
reduced)
CE of option for reducing
eutrophying compounds
(M$/ % PO4-eq reduced)
CE of option for reducing
smog precursors (M$/ % C2H4-
eq reduced)
CE of option for reducing human
toxicity substances
(M$/ % C6H4Cl2-eq reduced)
CE of option for reducing
inorganic waste (M$/ %
inorganic waste reduced)
Apply optimum dose of fertilizer
-0.24 -0.19 -0.06 No effect -0.08 No effect No effect No effect Fertilizer use reduction
Apply slow release fertilizer
5.32 5.30 2.66 No effect 2.66 No effect No effect No effect Extended delignification -1.98 -0.28 No effect 1) No effect -0.10 No effect -0.20 No effect Oxygen delignification 3.88 0.48 No effect No effect 0.17 No effect 0.32 No effect Ozone delignification 0.80 0.08 No effect No effect 0.03 No effect 0.25 No effect
Alternative digesting techniques
Enzyme delignification -2.29 -0.29 No effect No effect -0.10 No effect -0.25 No effect ECF 11.42 1.86 No effect No effect 0.67 No effect 0.48 No effect ECF-light 43.65 5.38 No effect No effect 1.90 No effect 1.75 No effect
Alternative bleaching techniques
TCF 94.53 7.81 No effect No effect 2.78 No effect 3.26 No effect Activated sludge 5.96 0.28 No effect No effect 0.10 No effect 0.50 No effect Aerated lagoon 4.49 0.22 No effect No effect 0.07 No effect 0.30 No effect
Wastewater treatment
UASB 2.43 0.09 Increase 2) No effect 0.03 No effect 0.14 No effect Spillage collection 0.52 0.09 No effect No effect 0.03 No effect No effect No effect Wastewater
minimization Improve pulp washing -1.23 -0.15 No effect No effect -0.05 No effect -0.2 No effect Natural gas replacing biomass
-1.41 Increase Increase Increase No effect -0.03 -0.1 No effect Solar heating -0.10 -0.18 -0.03 No effect No effect -0.02 -0.01 No effect Solar thermal electricity 1.57 0.06 No effect 0.18 0.18 0.01 0.02 No effect
Alternative energy generation source
Biomass gasification 5.93 1.47 No effect 0.59 No effect 0.14 0.30 No effect 1) Source: Jawjit et al. (submitted (Chapter 4)) 2) No effect = This option is not include in the cost-effectiveness analysis, since it has very little (< 1%) or no effect on reducing the overall environmental impact or emissions of pollutants. (See Table 5.1) 3) Increase = This option is not considered cost-effective because it increases the overall environmental impact or emissions of pollutants. (See Table 5.1)
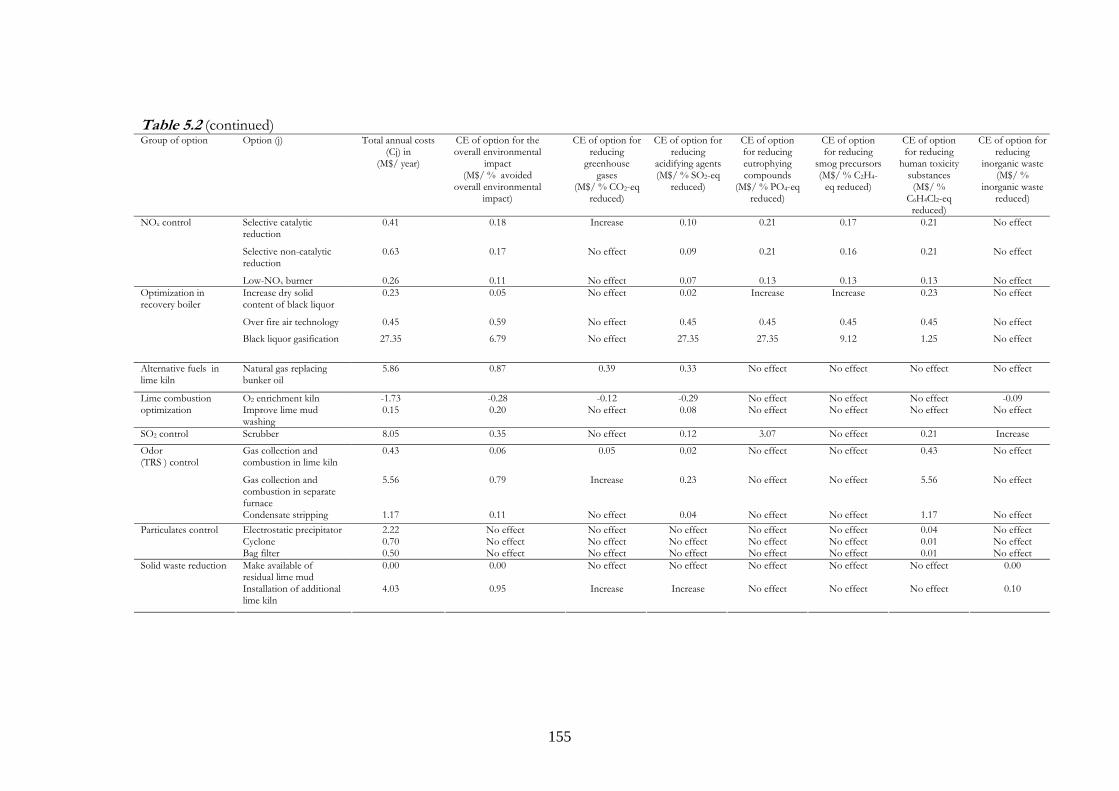
155
Table 5.2 (continued) Group of option Option (j) Total annual costs
(Cj) in (M$/ year)
CE of option for the overall environmental
impact (M$/ % avoided
overall environmental impact)
CE of option for reducing
greenhouse gases
(M$/ % CO2-eq reduced)
CE of option for reducing
acidifying agents (M$/ % SO2-eq
reduced)
CE of option for reducing eutrophying compounds
(M$/ % PO4-eq reduced)
CE of option for reducing
smog precursors (M$/ % C2H4-
eq reduced)
CE of option for reducing
human toxicity substances (M$/ %
C6H4Cl2-eq reduced)
CE of option for reducing
inorganic waste (M$/ %
inorganic waste reduced)
Selective catalytic reduction
0.41 0.18 Increase 0.10 0.21 0.17 0.21 No effect
Selective non-catalytic reduction
0.63 0.17 No effect 0.09 0.21 0.16 0.21 No effect
NOx control
Low-NOx burner 0.26 0.11 No effect 0.07 0.13 0.13 0.13 No effect Increase dry solid content of black liquor
0.23 0.05 No effect 0.02 Increase Increase 0.23 No effect
Over fire air technology 0.45 0.59 No effect 0.45 0.45 0.45 0.45 No effect
Optimization in recovery boiler
Black liquor gasification 27.35 6.79 No effect 27.35 27.35 9.12 1.25 No effect
Alternative fuels in lime kiln
Natural gas replacing bunker oil
5.86 0.87 0.39 0.33 No effect No effect No effect No effect
O2 enrichment kiln -1.73 -0.28 -0.12 -0.29 No effect No effect No effect -0.09 Lime combustion optimization Improve lime mud
washing 0.15 0.20 No effect 0.08 No effect No effect No effect No effect
SO2 control Scrubber 8.05 0.35 No effect 0.12 3.07 No effect 0.21 Increase
Gas collection and combustion in lime kiln
0.43 0.06 0.05 0.02 No effect No effect 0.43 No effect
Gas collection and combustion in separate furnace
5.56 0.79 Increase 0.23 No effect No effect 5.56 No effect
Odor (TRS ) control
Condensate stripping 1.17 0.11 No effect 0.04 No effect No effect 1.17 No effect Electrostatic precipitator 2.22 No effect No effect No effect No effect No effect 0.04 No effect Cyclone 0.70 No effect No effect No effect No effect No effect 0.01 No effect
Particulates control
Bag filter 0.50 No effect No effect No effect No effect No effect 0.01 No effect Make available of residual lime mud
0.00 0.00 No effect No effect No effect No effect No effect 0.00 Solid waste reduction
Installation of additional lime kiln
4.03 0.95 Increase Increase No effect No effect No effect 0.10
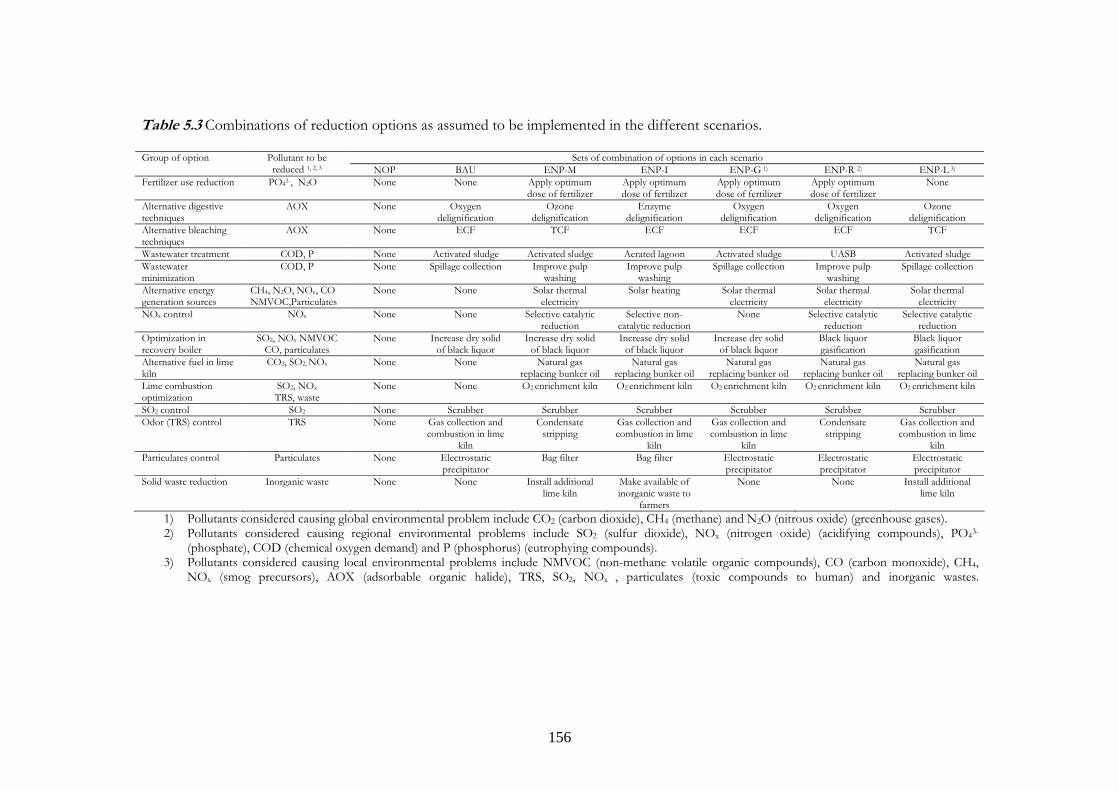
156
Table 5.3 Combinations of reduction options as assumed to be implemented in the different scenarios.
Sets of combination of options in each scenario Group of option Pollutant to be reduced 1, 2, 3 NOP BAU ENP-M ENP-I ENP-G 1) ENP-R 2) ENP-L 3)
Fertilizer use reduction PO43-, N2O None None Apply optimum dose of fertilizer
Apply optimum dose of fertilizer
Apply optimum dose of fertilizer
Apply optimum dose of fertilizer
None
Alternative digestive techniques
AOX None Oxygen delignification
Ozone delignification
Enzyme delignification
Oxygen delignification
Oxygen delignification
Ozone delignification
Alternative bleaching techniques
AOX None ECF TCF ECF ECF ECF TCF
Wastewater treatment COD, P None Activated sludge Activated sludge Aerated lagoon Activated sludge UASB Activated sludge Wastewater minimization
COD, P None Spillage collection Improve pulp washing
Improve pulp washing
Spillage collection Improve pulp washing
Spillage collection
Alternative energy generation sources
CH4, N2O, NOx, CO NMVOC,Particulates
None None Solar thermal electricity
Solar heating Solar thermal electricity
Solar thermal electricity
Solar thermal electricity
NOx control NOx None None Selective catalytic reduction
Selective non-catalytic reduction
None Selective catalytic reduction
Selective catalytic reduction
Optimization in recovery boiler
SO2, NOx NMVOC CO, particulates
None Increase dry solid of black liquor
Increase dry solid of black liquor
Increase dry solid of black liquor
Increase dry solid of black liquor
Black liquor gasification
Black liquor gasification
Alternative fuel in lime kiln
CO2, SO2, NOx None None Natural gas replacing bunker oil
Natural gas replacing bunker oil
Natural gas replacing bunker oil
Natural gas replacing bunker oil
Natural gas replacing bunker oil
Lime combustion optimization
SO2, NOx TRS, waste
None None O2 enrichment kiln O2 enrichment kiln O2 enrichment kiln O2 enrichment kiln O2 enrichment kiln
SO2 control SO2 None Scrubber Scrubber Scrubber Scrubber Scrubber Scrubber Odor (TRS) control TRS None Gas collection and
combustion in lime kiln
Condensate stripping
Gas collection and combustion in lime
kiln
Gas collection and combustion in lime
kiln
Condensate stripping
Gas collection and combustion in lime
kiln Particulates control Particulates None Electrostatic
precipitator Bag filter Bag filter Electrostatic
precipitator Electrostatic precipitator
Electrostatic precipitator
Solid waste reduction Inorganic waste None None Install additional lime kiln
Make available of inorganic waste to
farmers
None None Install additional lime kiln
1) Pollutants considered causing global environmental problem include CO2 (carbon dioxide), CH4 (methane) and N2O (nitrous oxide) (greenhouse gases). 2) Pollutants considered causing regional environmental problems include SO2 (sulfur dioxide), NOx (nitrogen oxide) (acidifying compounds), PO43-
(phosphate), COD (chemical oxygen demand) and P (phosphorus) (eutrophying compounds). 3) Pollutants considered causing local environmental problems include NMVOC (non-methane volatile organic compounds), CO (carbon monoxide), CH4,
NOx (smog precursors), AOX (adsorbable organic halide), TRS, SO2, NOx , particulates (toxic compounds to human) and inorganic wastes.
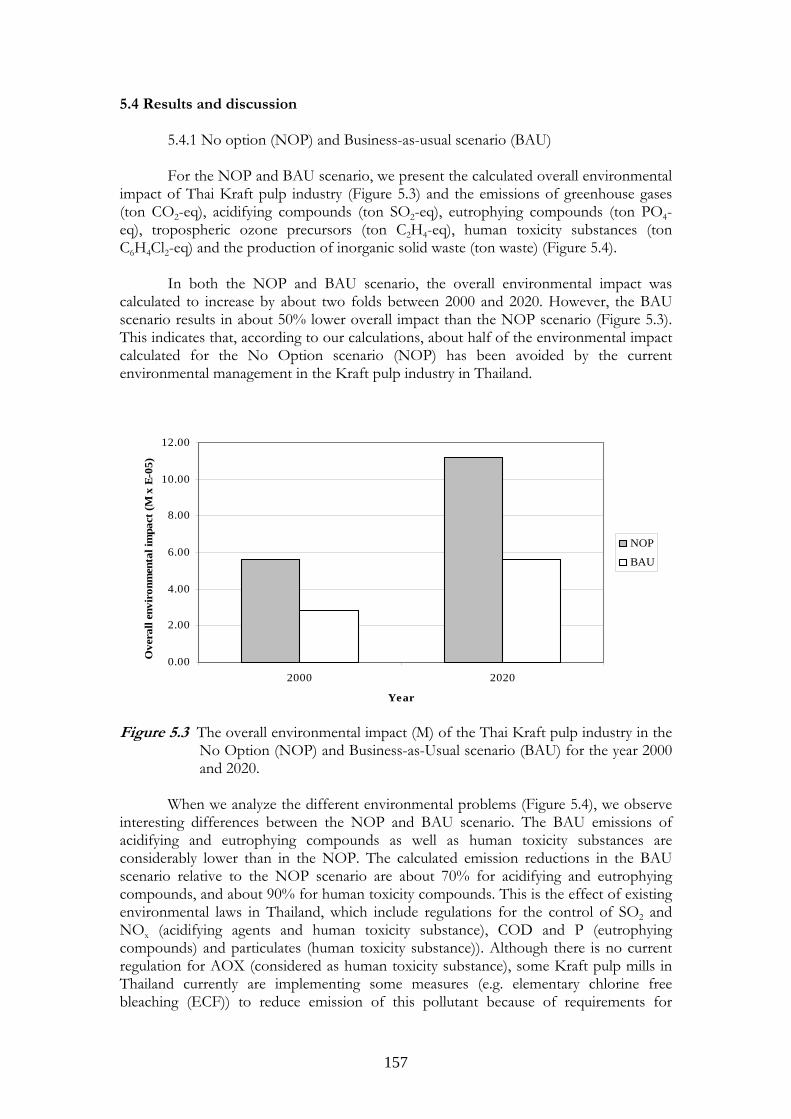
157
5.4 Results and discussion 5.4.1 No option (NOP) and Business-as-usual scenario (BAU)
For the NOP and BAU scenario, we present the calculated overall environmental impact of Thai Kraft pulp industry (Figure 5.3) and the emissions of greenhouse gases (ton CO2-eq), acidifying compounds (ton SO2-eq), eutrophying compounds (ton PO4-eq), tropospheric ozone precursors (ton C2H4-eq), human toxicity substances (ton C6H4Cl2-eq) and the production of inorganic solid waste (ton waste) (Figure 5.4).
In both the NOP and BAU scenario, the overall environmental impact was calculated to increase by about two folds between 2000 and 2020. However, the BAU scenario results in about 50% lower overall impact than the NOP scenario (Figure 5.3). This indicates that, according to our calculations, about half of the environmental impact calculated for the No Option scenario (NOP) has been avoided by the current environmental management in the Kraft pulp industry in Thailand.
0.00
2.00
4.00
6.00
8.00
10.00
12.00
2000 2020
Year
Ove
rall
envi
ronm
enta
l im
pact
(M x
E-0
5)
NOP
BAU
Figure 5.3 The overall environmental impact (M) of the Thai Kraft pulp industry in the
No Option (NOP) and Business-as-Usual scenario (BAU) for the year 2000 and 2020.
When we analyze the different environmental problems (Figure 5.4), we observe
interesting differences between the NOP and BAU scenario. The BAU emissions of acidifying and eutrophying compounds as well as human toxicity substances are considerably lower than in the NOP. The calculated emission reductions in the BAU scenario relative to the NOP scenario are about 70% for acidifying and eutrophying compounds, and about 90% for human toxicity compounds. This is the effect of existing environmental laws in Thailand, which include regulations for the control of SO2 and NOx (acidifying agents and human toxicity substance), COD and P (eutrophying compounds) and particulates (human toxicity substance)). Although there is no current regulation for AOX (considered as human toxicity substance), some Kraft pulp mills in Thailand currently are implementing some measures (e.g. elementary chlorine free bleaching (ECF)) to reduce emission of this pollutant because of requirements for
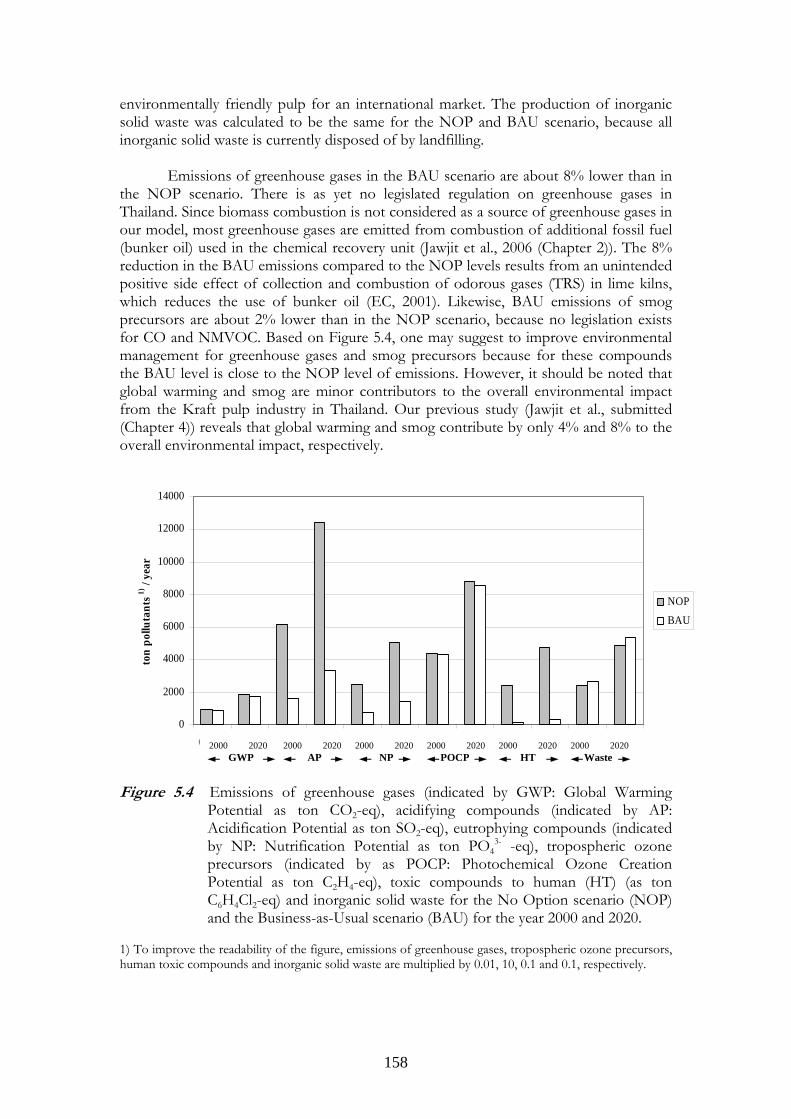
158
environmentally friendly pulp for an international market. The production of inorganic solid waste was calculated to be the same for the NOP and BAU scenario, because all inorganic solid waste is currently disposed of by landfilling.
Emissions of greenhouse gases in the BAU scenario are about 8% lower than in
the NOP scenario. There is as yet no legislated regulation on greenhouse gases in Thailand. Since biomass combustion is not considered as a source of greenhouse gases in our model, most greenhouse gases are emitted from combustion of additional fossil fuel (bunker oil) used in the chemical recovery unit (Jawjit et al., 2006 (Chapter 2)). The 8% reduction in the BAU emissions compared to the NOP levels results from an unintended positive side effect of collection and combustion of odorous gases (TRS) in lime kilns, which reduces the use of bunker oil (EC, 2001). Likewise, BAU emissions of smog precursors are about 2% lower than in the NOP scenario, because no legislation exists for CO and NMVOC. Based on Figure 5.4, one may suggest to improve environmental management for greenhouse gases and smog precursors because for these compounds the BAU level is close to the NOP level of emissions. However, it should be noted that global warming and smog are minor contributors to the overall environmental impact from the Kraft pulp industry in Thailand. Our previous study (Jawjit et al., submitted (Chapter 4)) reveals that global warming and smog contribute by only 4% and 8% to the overall environmental impact, respectively.
0
2000
4000
6000
8000
10000
12000
14000
GWP-2000
GWP-2020
AP-2000
AP-2020
NP-2000
NP-2020
POCP-2000
POCP-2020
HT-2000
HT-2020
waste-2000
waste-2020
ton
pollu
tant
s 1) /
year
NOP
BAU
Figure 5.4 Emissions of greenhouse gases (indicated by GWP: Global Warming
Potential as ton CO2-eq), acidifying compounds (indicated by AP: Acidification Potential as ton SO2-eq), eutrophying compounds (indicated by NP: Nutrification Potential as ton PO4
3- -eq), tropospheric ozone precursors (indicated by as POCP: Photochemical Ozone Creation Potential as ton C2H4-eq), toxic compounds to human (HT) (as ton C6H4Cl2-eq) and inorganic solid waste for the No Option scenario (NOP) and the Business-as-Usual scenario (BAU) for the year 2000 and 2020.
1) To improve the readability of the figure, emissions of greenhouse gases, tropospheric ozone precursors, human toxic compounds and inorganic solid waste are multiplied by 0.01, 10, 0.1 and 0.1, respectively.
2000 2020 GWP
2000 2020 AP
2000 2020 NP
2000 2020 POCP
2000 2020 HT
2000 2020 Waste
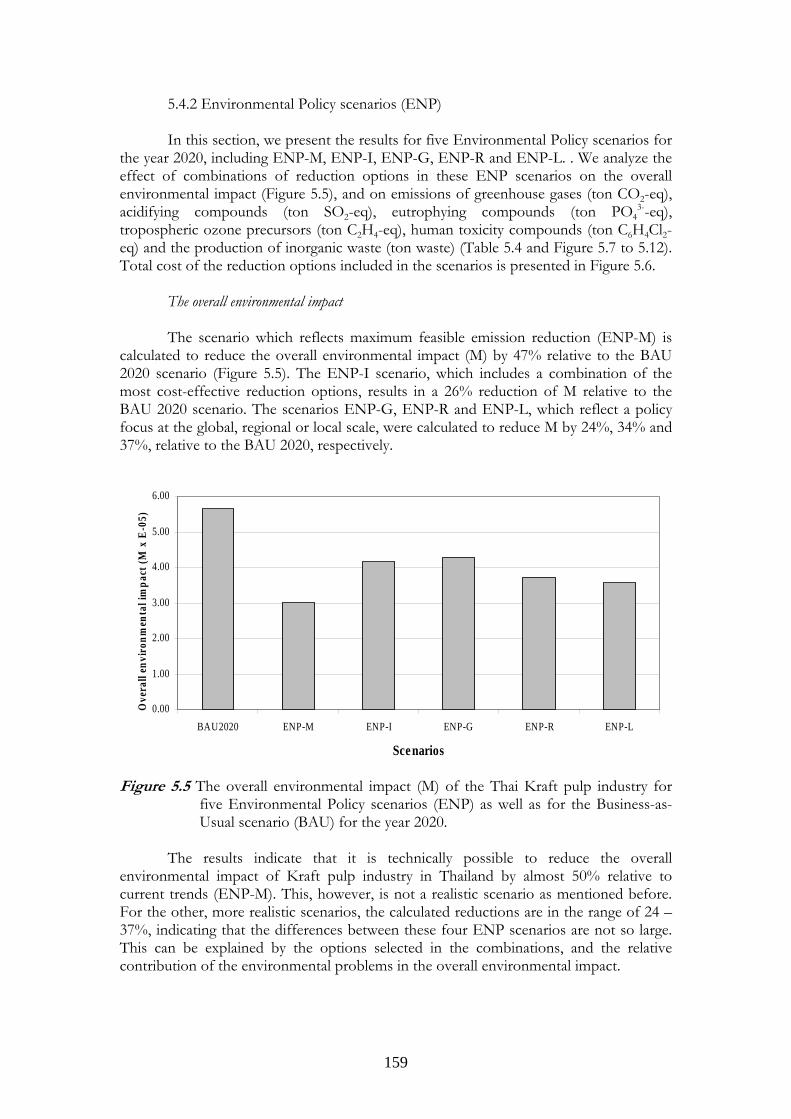
159
5.4.2 Environmental Policy scenarios (ENP) In this section, we present the results for five Environmental Policy scenarios for the year 2020, including ENP-M, ENP-I, ENP-G, ENP-R and ENP-L. . We analyze the effect of combinations of reduction options in these ENP scenarios on the overall environmental impact (Figure 5.5), and on emissions of greenhouse gases (ton CO2-eq), acidifying compounds (ton SO2-eq), eutrophying compounds (ton PO4
3--eq), tropospheric ozone precursors (ton C2H4-eq), human toxicity compounds (ton C6H4Cl2-eq) and the production of inorganic waste (ton waste) (Table 5.4 and Figure 5.7 to 5.12). Total cost of the reduction options included in the scenarios is presented in Figure 5.6. The overall environmental impact
The scenario which reflects maximum feasible emission reduction (ENP-M) is calculated to reduce the overall environmental impact (M) by 47% relative to the BAU 2020 scenario (Figure 5.5). The ENP-I scenario, which includes a combination of the most cost-effective reduction options, results in a 26% reduction of M relative to the BAU 2020 scenario. The scenarios ENP-G, ENP-R and ENP-L, which reflect a policy focus at the global, regional or local scale, were calculated to reduce M by 24%, 34% and 37%, relative to the BAU 2020, respectively.
0.00
1.00
2.00
3.00
4.00
5.00
6.00
BAU2020 ENP-M ENP-I ENP-G ENP-R ENP-L
Scenarios
Ove
rall
envi
ronm
enta
l im
pact
(M x
E-0
5)
Figure 5.5 The overall environmental impact (M) of the Thai Kraft pulp industry for
five Environmental Policy scenarios (ENP) as well as for the Business-as-Usual scenario (BAU) for the year 2020.
The results indicate that it is technically possible to reduce the overall
environmental impact of Kraft pulp industry in Thailand by almost 50% relative to current trends (ENP-M). This, however, is not a realistic scenario as mentioned before. For the other, more realistic scenarios, the calculated reductions are in the range of 24 – 37%, indicating that the differences between these four ENP scenarios are not so large. This can be explained by the options selected in the combinations, and the relative contribution of the environmental problems in the overall environmental impact.
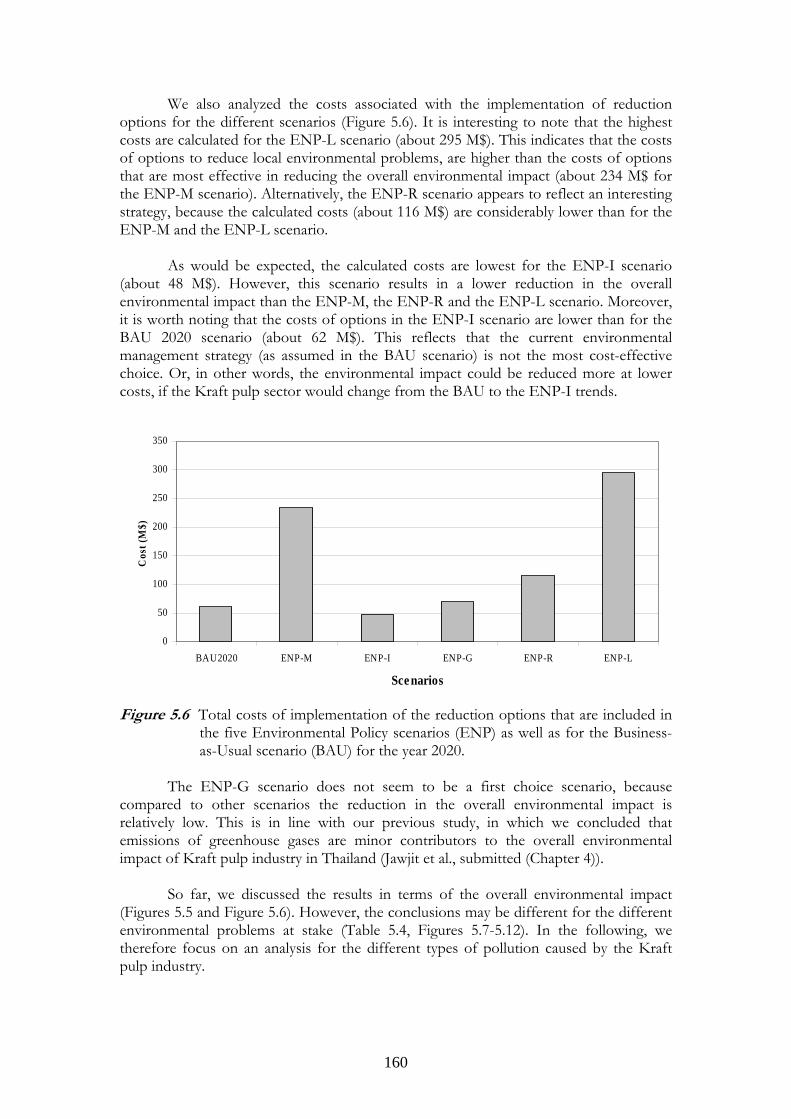
160
We also analyzed the costs associated with the implementation of reduction options for the different scenarios (Figure 5.6). It is interesting to note that the highest costs are calculated for the ENP-L scenario (about 295 M$). This indicates that the costs of options to reduce local environmental problems, are higher than the costs of options that are most effective in reducing the overall environmental impact (about 234 M$ for the ENP-M scenario). Alternatively, the ENP-R scenario appears to reflect an interesting strategy, because the calculated costs (about 116 M$) are considerably lower than for the ENP-M and the ENP-L scenario.
As would be expected, the calculated costs are lowest for the ENP-I scenario
(about 48 M$). However, this scenario results in a lower reduction in the overall environmental impact than the ENP-M, the ENP-R and the ENP-L scenario. Moreover, it is worth noting that the costs of options in the ENP-I scenario are lower than for the BAU 2020 scenario (about 62 M$). This reflects that the current environmental management strategy (as assumed in the BAU scenario) is not the most cost-effective choice. Or, in other words, the environmental impact could be reduced more at lower costs, if the Kraft pulp sector would change from the BAU to the ENP-I trends.
0
50
100
150
200
250
300
350
BAU2020 ENP-M ENP-I ENP-G ENP-R ENP-L
Sce narios
Cos
t (M
$)
Figure 5.6 Total costs of implementation of the reduction options that are included in
the five Environmental Policy scenarios (ENP) as well as for the Business-as-Usual scenario (BAU) for the year 2020.
The ENP-G scenario does not seem to be a first choice scenario, because compared to other scenarios the reduction in the overall environmental impact is relatively low. This is in line with our previous study, in which we concluded that emissions of greenhouse gases are minor contributors to the overall environmental impact of Kraft pulp industry in Thailand (Jawjit et al., submitted (Chapter 4)).
So far, we discussed the results in terms of the overall environmental impact
(Figures 5.5 and Figure 5.6). However, the conclusions may be different for the different environmental problems at stake (Table 5.4, Figures 5.7-5.12). In the following, we therefore focus on an analysis for the different types of pollution caused by the Kraft pulp industry.
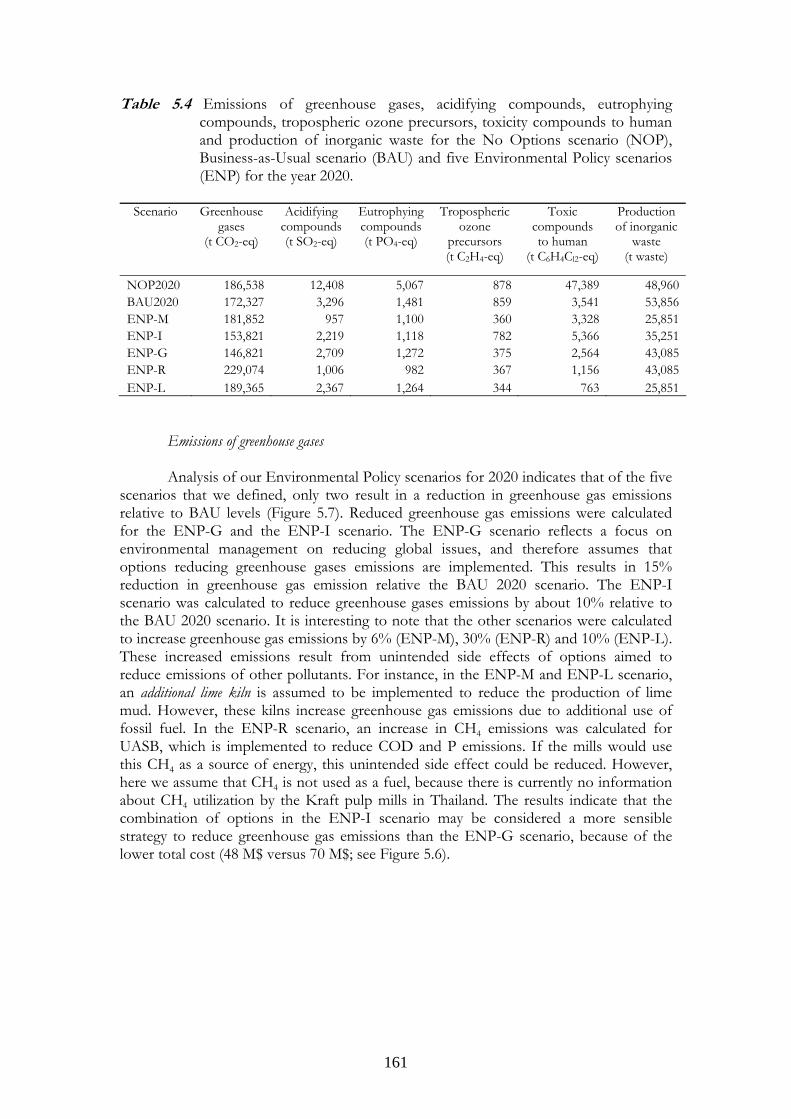
161
Table 5.4 Emissions of greenhouse gases, acidifying compounds, eutrophying compounds, tropospheric ozone precursors, toxicity compounds to human and production of inorganic waste for the No Options scenario (NOP), Business-as-Usual scenario (BAU) and five Environmental Policy scenarios (ENP) for the year 2020.
Scenario Greenhouse
gases (t CO2-eq)
Acidifying compounds (t SO2-eq)
Eutrophying compounds (t PO4-eq)
Tropospheric ozone
precursors (t C2H4-eq)
Toxic compounds to human
(t C6H4Cl2-eq)
Production of inorganic
waste (t waste)
NOP2020 186,538 12,408 5,067 878 47,389 48,960BAU2020 172,327 3,296 1,481 859 3,541 53,856ENP-M 181,852 957 1,100 360 3,328 25,851ENP-I 153,821 2,219 1,118 782 5,366 35,251ENP-G 146,821 2,709 1,272 375 2,564 43,085ENP-R 229,074 1,006 982 367 1,156 43,085ENP-L 189,365 2,367 1,264 344 763 25,851
Emissions of greenhouse gases
Analysis of our Environmental Policy scenarios for 2020 indicates that of the five scenarios that we defined, only two result in a reduction in greenhouse gas emissions relative to BAU levels (Figure 5.7). Reduced greenhouse gas emissions were calculated for the ENP-G and the ENP-I scenario. The ENP-G scenario reflects a focus on environmental management on reducing global issues, and therefore assumes that options reducing greenhouse gases emissions are implemented. This results in 15% reduction in greenhouse gas emission relative the BAU 2020 scenario. The ENP-I scenario was calculated to reduce greenhouse gases emissions by about 10% relative to the BAU 2020 scenario. It is interesting to note that the other scenarios were calculated to increase greenhouse gas emissions by 6% (ENP-M), 30% (ENP-R) and 10% (ENP-L). These increased emissions result from unintended side effects of options aimed to reduce emissions of other pollutants. For instance, in the ENP-M and ENP-L scenario, an additional lime kiln is assumed to be implemented to reduce the production of lime mud. However, these kilns increase greenhouse gas emissions due to additional use of fossil fuel. In the ENP-R scenario, an increase in CH4 emissions was calculated for UASB, which is implemented to reduce COD and P emissions. If the mills would use this CH4 as a source of energy, this unintended side effect could be reduced. However, here we assume that CH4 is not used as a fuel, because there is currently no information about CH4 utilization by the Kraft pulp mills in Thailand. The results indicate that the combination of options in the ENP-I scenario may be considered a more sensible strategy to reduce greenhouse gas emissions than the ENP-G scenario, because of the lower total cost (48 M$ versus 70 M$; see Figure 5.6).
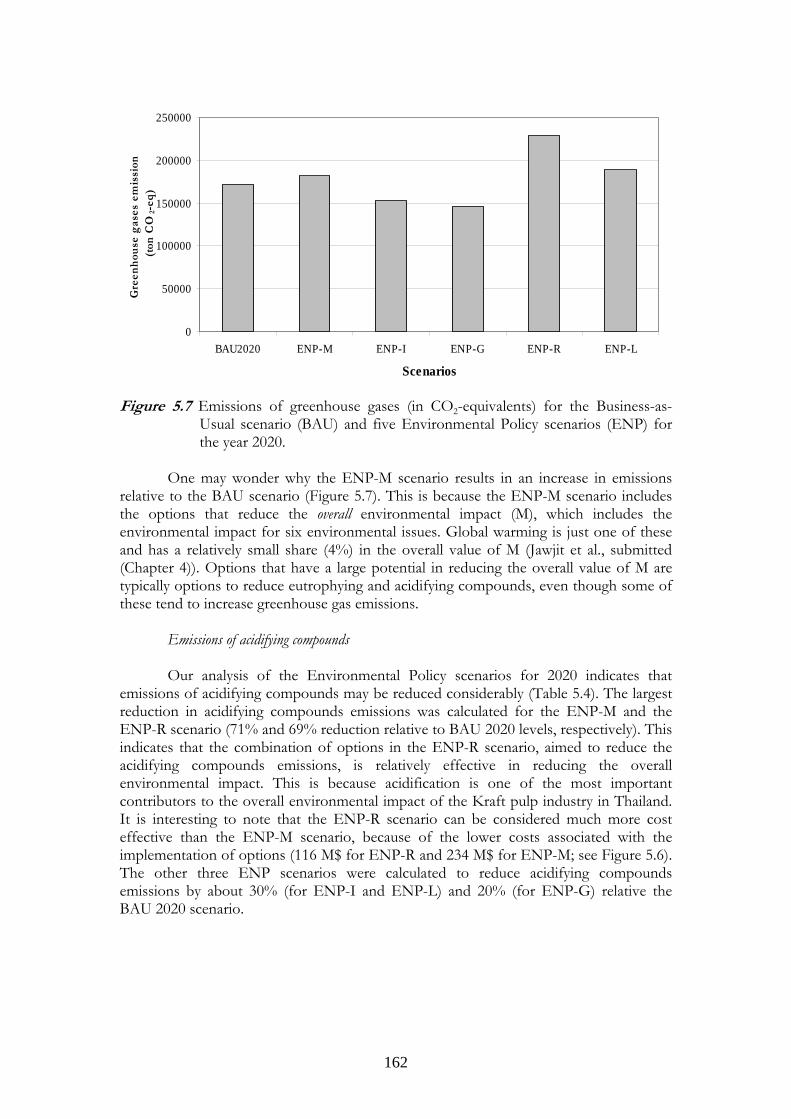
162
0
50000
100000
150000
200000
250000
BAU2020 ENP-M ENP-I ENP-G ENP-R ENP-L
Scenarios
Gre
enh
ouse
gas
es e
mis
sion
(t
on C
O2-
eq)
Figure 5.7 Emissions of greenhouse gases (in CO2-equivalents) for the Business-as-
Usual scenario (BAU) and five Environmental Policy scenarios (ENP) for the year 2020.
One may wonder why the ENP-M scenario results in an increase in emissions
relative to the BAU scenario (Figure 5.7). This is because the ENP-M scenario includes the options that reduce the overall environmental impact (M), which includes the environmental impact for six environmental issues. Global warming is just one of these and has a relatively small share (4%) in the overall value of M (Jawjit et al., submitted (Chapter 4)). Options that have a large potential in reducing the overall value of M are typically options to reduce eutrophying and acidifying compounds, even though some of these tend to increase greenhouse gas emissions.
Emissions of acidifying compounds
Our analysis of the Environmental Policy scenarios for 2020 indicates that emissions of acidifying compounds may be reduced considerably (Table 5.4). The largest reduction in acidifying compounds emissions was calculated for the ENP-M and the ENP-R scenario (71% and 69% reduction relative to BAU 2020 levels, respectively). This indicates that the combination of options in the ENP-R scenario, aimed to reduce the acidifying compounds emissions, is relatively effective in reducing the overall environmental impact. This is because acidification is one of the most important contributors to the overall environmental impact of the Kraft pulp industry in Thailand. It is interesting to note that the ENP-R scenario can be considered much more cost effective than the ENP-M scenario, because of the lower costs associated with the implementation of options (116 M$ for ENP-R and 234 M$ for ENP-M; see Figure 5.6). The other three ENP scenarios were calculated to reduce acidifying compounds emissions by about 30% (for ENP-I and ENP-L) and 20% (for ENP-G) relative the BAU 2020 scenario.
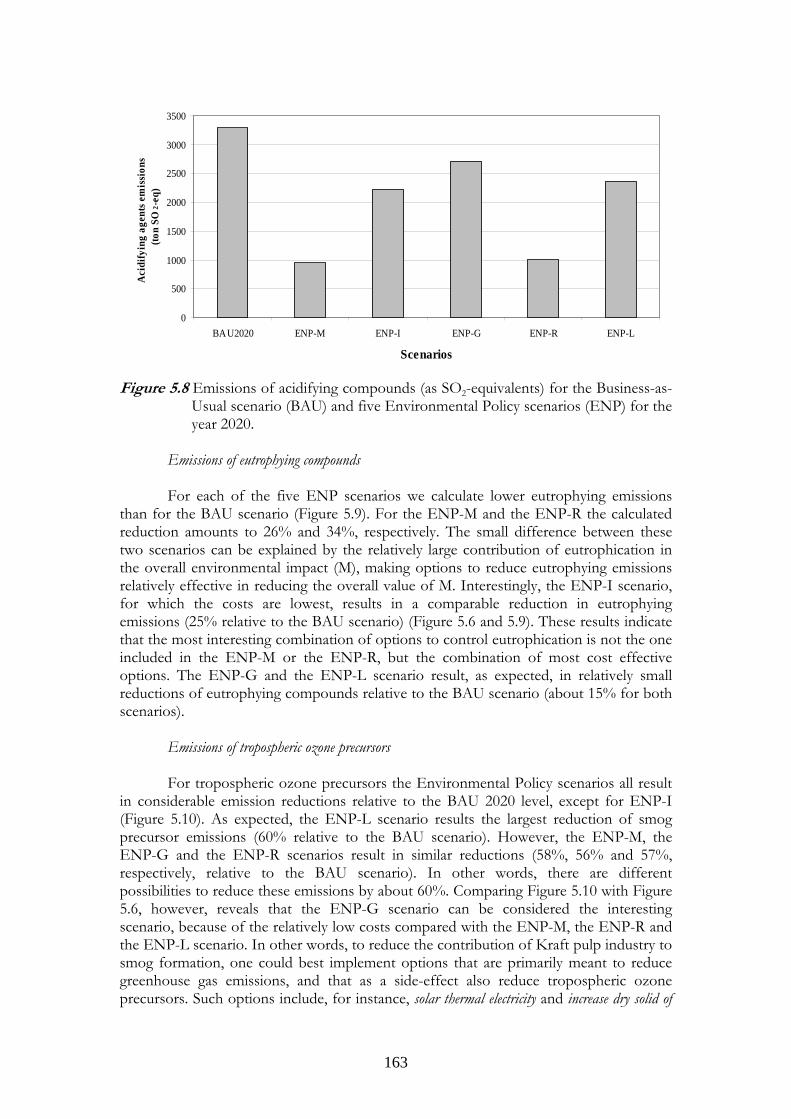
163
0
500
1000
1500
2000
2500
3000
3500
BAU2020 ENP-M ENP-I ENP-G ENP-R ENP-L
Scenarios
Aci
dify
ing
agen
ts e
mis
sion
s (to
n SO
2 -eq
)
Figure 5.8 Emissions of acidifying compounds (as SO2-equivalents) for the Business-as-
Usual scenario (BAU) and five Environmental Policy scenarios (ENP) for the year 2020.
Emissions of eutrophying compounds
For each of the five ENP scenarios we calculate lower eutrophying emissions than for the BAU scenario (Figure 5.9). For the ENP-M and the ENP-R the calculated reduction amounts to 26% and 34%, respectively. The small difference between these two scenarios can be explained by the relatively large contribution of eutrophication in the overall environmental impact (M), making options to reduce eutrophying emissions relatively effective in reducing the overall value of M. Interestingly, the ENP-I scenario, for which the costs are lowest, results in a comparable reduction in eutrophying emissions (25% relative to the BAU scenario) (Figure 5.6 and 5.9). These results indicate that the most interesting combination of options to control eutrophication is not the one included in the ENP-M or the ENP-R, but the combination of most cost effective options. The ENP-G and the ENP-L scenario result, as expected, in relatively small reductions of eutrophying compounds relative to the BAU scenario (about 15% for both scenarios).
Emissions of tropospheric ozone precursors For tropospheric ozone precursors the Environmental Policy scenarios all result in considerable emission reductions relative to the BAU 2020 level, except for ENP-I (Figure 5.10). As expected, the ENP-L scenario results the largest reduction of smog precursor emissions (60% relative to the BAU scenario). However, the ENP-M, the ENP-G and the ENP-R scenarios result in similar reductions (58%, 56% and 57%, respectively, relative to the BAU scenario). In other words, there are different possibilities to reduce these emissions by about 60%. Comparing Figure 5.10 with Figure 5.6, however, reveals that the ENP-G scenario can be considered the interesting scenario, because of the relatively low costs compared with the ENP-M, the ENP-R and the ENP-L scenario. In other words, to reduce the contribution of Kraft pulp industry to smog formation, one could best implement options that are primarily meant to reduce greenhouse gas emissions, and that as a side-effect also reduce tropospheric ozone precursors. Such options include, for instance, solar thermal electricity and increase dry solid of
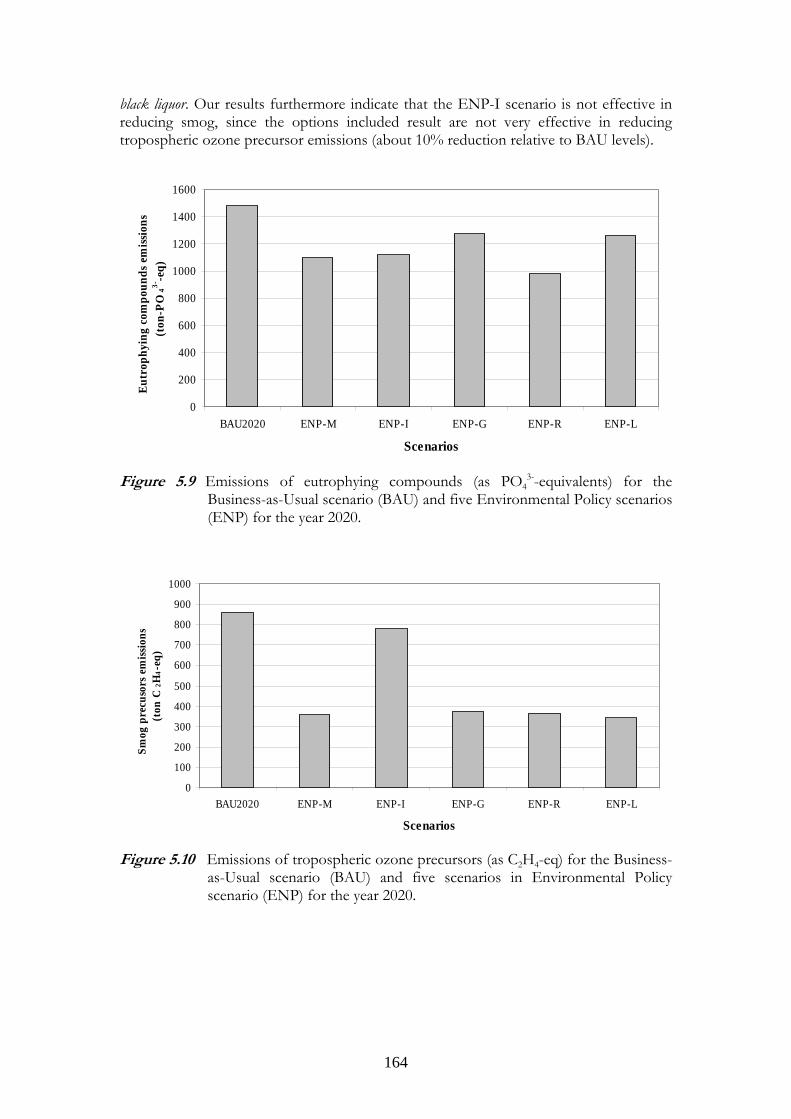
164
black liquor. Our results furthermore indicate that the ENP-I scenario is not effective in reducing smog, since the options included result are not very effective in reducing tropospheric ozone precursor emissions (about 10% reduction relative to BAU levels).
0
200
400
600
800
1000
1200
1400
1600
BAU2020 ENP-M ENP-I ENP-G ENP-R ENP-L
Scenarios
Eutr
ophy
ing
com
poun
ds e
miss
ions
(t
on-P
O43-
-eq)
Figure 5.9 Emissions of eutrophying compounds (as PO4
3--equivalents) for the Business-as-Usual scenario (BAU) and five Environmental Policy scenarios (ENP) for the year 2020.
0
100
200
300
400
500
600
700
800
900
1000
BAU2020 ENP-M ENP-I ENP-G ENP-R ENP-L
Scenarios
Smog
pre
cuso
rs e
miss
ions
(t
on C
2H4-e
q)
Figure 5.10 Emissions of tropospheric ozone precursors (as C2H4-eq) for the Business-
as-Usual scenario (BAU) and five scenarios in Environmental Policy scenario (ENP) for the year 2020.
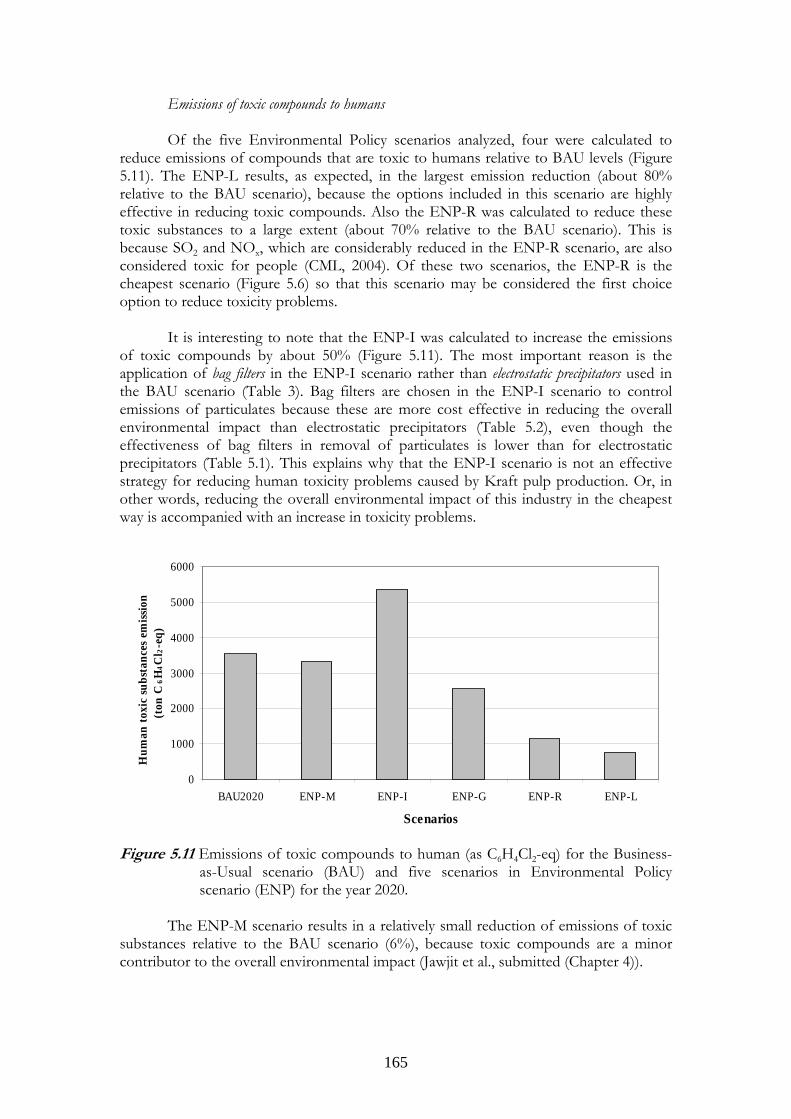
165
Emissions of toxic compounds to humans Of the five Environmental Policy scenarios analyzed, four were calculated to reduce emissions of compounds that are toxic to humans relative to BAU levels (Figure 5.11). The ENP-L results, as expected, in the largest emission reduction (about 80% relative to the BAU scenario), because the options included in this scenario are highly effective in reducing toxic compounds. Also the ENP-R was calculated to reduce these toxic substances to a large extent (about 70% relative to the BAU scenario). This is because SO2 and NOx, which are considerably reduced in the ENP-R scenario, are also considered toxic for people (CML, 2004). Of these two scenarios, the ENP-R is the cheapest scenario (Figure 5.6) so that this scenario may be considered the first choice option to reduce toxicity problems.
It is interesting to note that the ENP-I was calculated to increase the emissions of toxic compounds by about 50% (Figure 5.11). The most important reason is the application of bag filters in the ENP-I scenario rather than electrostatic precipitators used in the BAU scenario (Table 3). Bag filters are chosen in the ENP-I scenario to control emissions of particulates because these are more cost effective in reducing the overall environmental impact than electrostatic precipitators (Table 5.2), even though the effectiveness of bag filters in removal of particulates is lower than for electrostatic precipitators (Table 5.1). This explains why that the ENP-I scenario is not an effective strategy for reducing human toxicity problems caused by Kraft pulp production. Or, in other words, reducing the overall environmental impact of this industry in the cheapest way is accompanied with an increase in toxicity problems.
0
1000
2000
3000
4000
5000
6000
BAU2020 ENP-M ENP-I ENP-G ENP-R ENP-L
Scenarios
Hum
an to
xic
subs
tanc
es e
miss
ion
(ton
C6H
4C
l 2-e
q)
Figure 5.11 Emissions of toxic compounds to human (as C6H4Cl2-eq) for the Business-
as-Usual scenario (BAU) and five scenarios in Environmental Policy scenario (ENP) for the year 2020.
The ENP-M scenario results in a relatively small reduction of emissions of toxic
substances relative to the BAU scenario (6%), because toxic compounds are a minor contributor to the overall environmental impact (Jawjit et al., submitted (Chapter 4)).
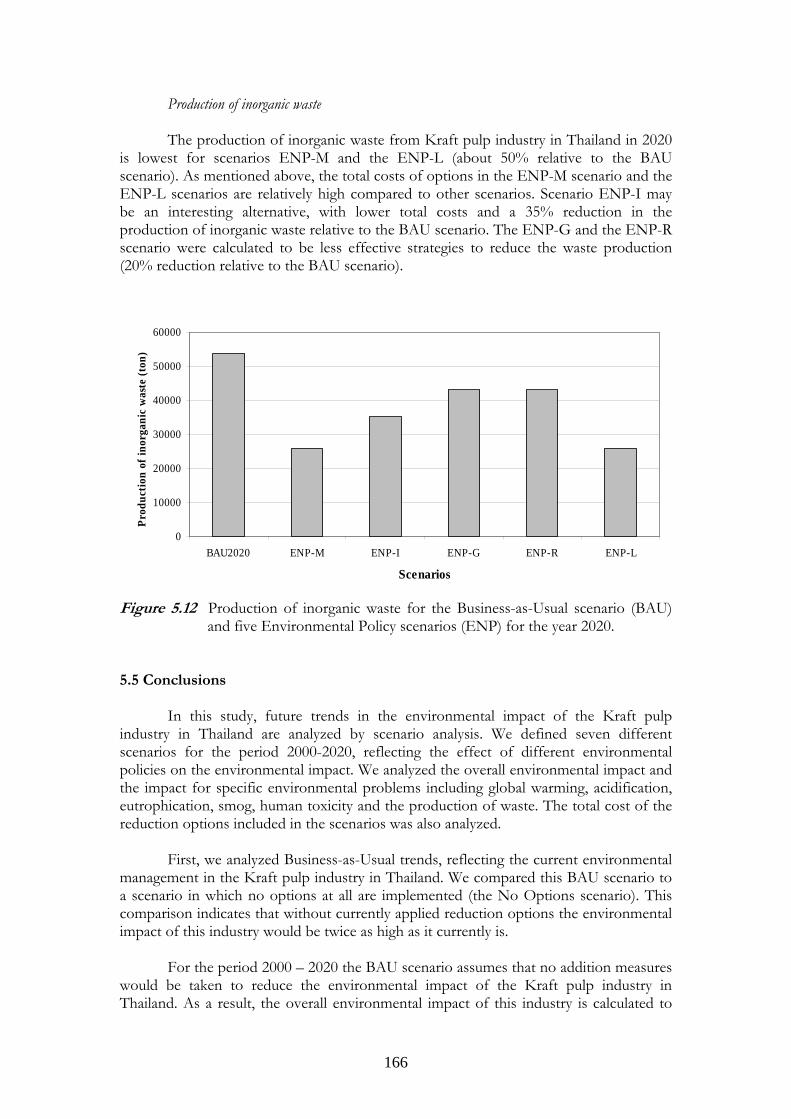
166
Production of inorganic waste The production of inorganic waste from Kraft pulp industry in Thailand in 2020 is lowest for scenarios ENP-M and the ENP-L (about 50% relative to the BAU scenario). As mentioned above, the total costs of options in the ENP-M scenario and the ENP-L scenarios are relatively high compared to other scenarios. Scenario ENP-I may be an interesting alternative, with lower total costs and a 35% reduction in the production of inorganic waste relative to the BAU scenario. The ENP-G and the ENP-R scenario were calculated to be less effective strategies to reduce the waste production (20% reduction relative to the BAU scenario).
0
10000
20000
30000
40000
50000
60000
BAU2020 ENP-M ENP-I ENP-G ENP-R ENP-L
Scenarios
Prod
uctio
n of
inor
gani
c w
aste
(ton
)
Figure 5.12 Production of inorganic waste for the Business-as-Usual scenario (BAU)
and five Environmental Policy scenarios (ENP) for the year 2020. 5.5 Conclusions
In this study, future trends in the environmental impact of the Kraft pulp industry in Thailand are analyzed by scenario analysis. We defined seven different scenarios for the period 2000-2020, reflecting the effect of different environmental policies on the environmental impact. We analyzed the overall environmental impact and the impact for specific environmental problems including global warming, acidification, eutrophication, smog, human toxicity and the production of waste. The total cost of the reduction options included in the scenarios was also analyzed.
First, we analyzed Business-as-Usual trends, reflecting the current environmental
management in the Kraft pulp industry in Thailand. We compared this BAU scenario to a scenario in which no options at all are implemented (the No Options scenario). This comparison indicates that without currently applied reduction options the environmental impact of this industry would be twice as high as it currently is.
For the period 2000 – 2020 the BAU scenario assumes that no addition measures
would be taken to reduce the environmental impact of the Kraft pulp industry in Thailand. As a result, the overall environmental impact of this industry is calculated to
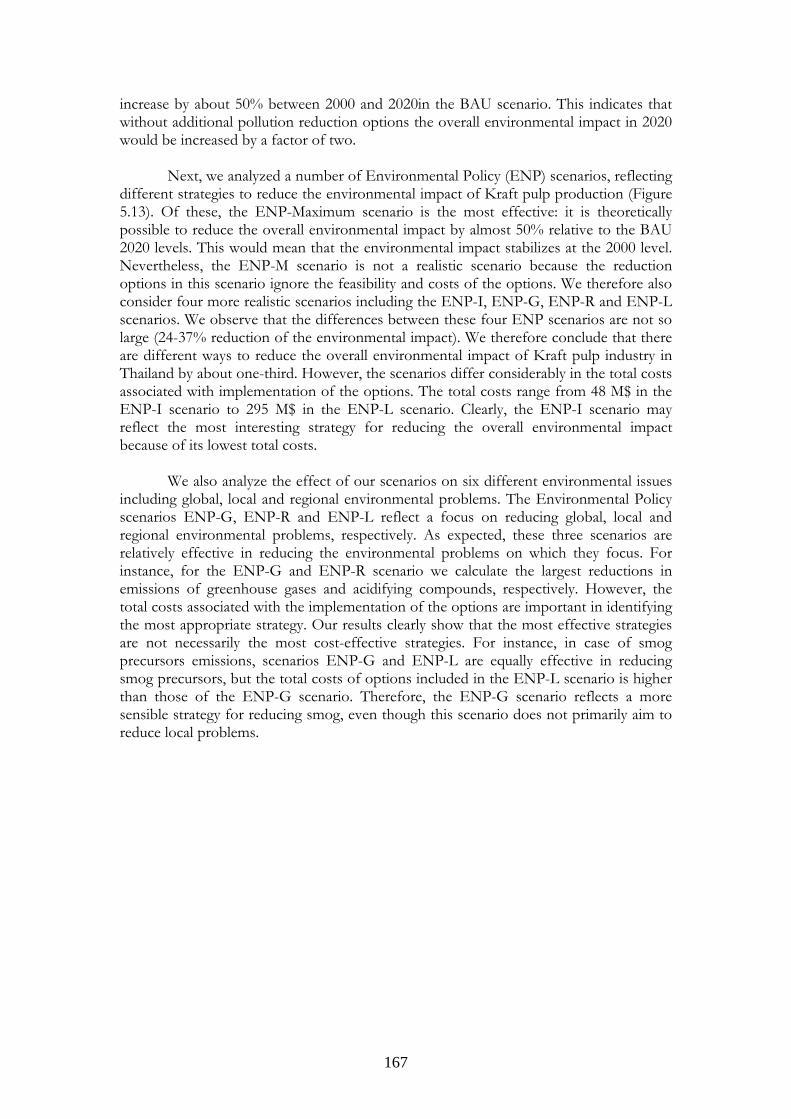
167
increase by about 50% between 2000 and 2020in the BAU scenario. This indicates that without additional pollution reduction options the overall environmental impact in 2020 would be increased by a factor of two.
Next, we analyzed a number of Environmental Policy (ENP) scenarios, reflecting
different strategies to reduce the environmental impact of Kraft pulp production (Figure 5.13). Of these, the ENP-Maximum scenario is the most effective: it is theoretically possible to reduce the overall environmental impact by almost 50% relative to the BAU 2020 levels. This would mean that the environmental impact stabilizes at the 2000 level. Nevertheless, the ENP-M scenario is not a realistic scenario because the reduction options in this scenario ignore the feasibility and costs of the options. We therefore also consider four more realistic scenarios including the ENP-I, ENP-G, ENP-R and ENP-L scenarios. We observe that the differences between these four ENP scenarios are not so large (24-37% reduction of the environmental impact). We therefore conclude that there are different ways to reduce the overall environmental impact of Kraft pulp industry in Thailand by about one-third. However, the scenarios differ considerably in the total costs associated with implementation of the options. The total costs range from 48 M$ in the ENP-I scenario to 295 M$ in the ENP-L scenario. Clearly, the ENP-I scenario may reflect the most interesting strategy for reducing the overall environmental impact because of its lowest total costs.
We also analyze the effect of our scenarios on six different environmental issues including global, local and regional environmental problems. The Environmental Policy scenarios ENP-G, ENP-R and ENP-L reflect a focus on reducing global, local and regional environmental problems, respectively. As expected, these three scenarios are relatively effective in reducing the environmental problems on which they focus. For instance, for the ENP-G and ENP-R scenario we calculate the largest reductions in emissions of greenhouse gases and acidifying compounds, respectively. However, the total costs associated with the implementation of the options are important in identifying the most appropriate strategy. Our results clearly show that the most effective strategies are not necessarily the most cost-effective strategies. For instance, in case of smog precursors emissions, scenarios ENP-G and ENP-L are equally effective in reducing smog precursors, but the total costs of options included in the ENP-L scenario is higher than those of the ENP-G scenario. Therefore, the ENP-G scenario reflects a more sensible strategy for reducing smog, even though this scenario does not primarily aim to reduce local problems.
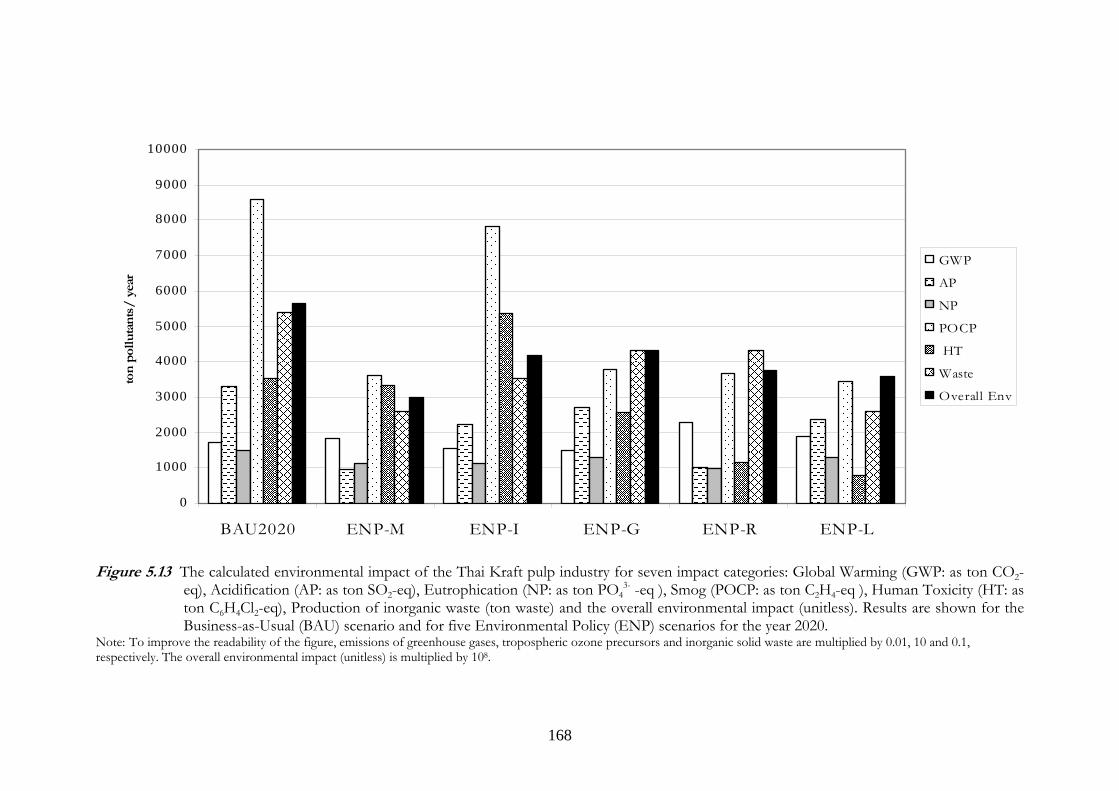
168
0
1000
2000
3000
4000
5000
6000
7000
8000
9000
10000
BAU2020 ENP-M ENP-I ENP-G ENP-R ENP-L
ton
poll
utan
ts/
yea
r
GWP
AP
NP
POCP
HT
Waste
Overall Env
Figure 5.13 The calculated environmental impact of the Thai Kraft pulp industry for seven impact categories: Global Warming (GWP: as ton CO2-
eq), Acidification (AP: as ton SO2-eq), Eutrophication (NP: as ton PO43- -eq ), Smog (POCP: as ton C2H4-eq ), Human Toxicity (HT: as
ton C6H4Cl2-eq), Production of inorganic waste (ton waste) and the overall environmental impact (unitless). Results are shown for the Business-as-Usual (BAU) scenario and for five Environmental Policy (ENP) scenarios for the year 2020.
Note: To improve the readability of the figure, emissions of greenhouse gases, tropospheric ozone precursors and inorganic solid waste are multiplied by 0.01, 10 and 0.1, respectively. The overall environmental impact (unitless) is multiplied by 108.
169
References Alcamo J. 2001. Scenarios as tools for international environmental assessments. Environmental issue report No.24. European Environmental Agency. Copenhagen, Denmark. Ali M, Sreekrishnan T R. 2001. Aquatic toxicity from pulp and paper mill effluents: a review. Advances in Environmental Research 5, 75-196. Azapagic A, Clift R. 1999. The application of life cycle assessment to process optimization. Computers & Chemical Engineering 23 (10),1509-1526. Bordado J C M, Gomes J F P. 2002. Atmospheric emissions of Kraft pulp mills. Journal of Chemical Engineering and Processing 41, 667-671. Cavallaro F, Ciraolo L. 2005. A multicriteria approach to evaluate wind energy plants on an Italian island. Energy Policy 33 (2), 235-244. CML. 2004. Impact assessment spreadsheet version 2.7. Center of Environmental Science. Lieden University, The Netherlands. Cziner K, Tuomaala M, Hurme M. 2005. Multicriteria decision making in process integration. Journal of Cleaner Production 13, 475-483. DIW. 1999. Technical guideline for environmental management for pulp and paper in Thailand. Department of Industrial Work, Bureau of Environmental Technology, Ministry of Industry, Bangkok, Thailand. EC. 2001. Integrated Pollution Prevention Control (IPPC); Reference Document on Best Available Techniques in the Pulp and Paper Industry. European Commission. EEA. 2005. Thailand Environmental Laws. Thailand Environmental Engineering Association. Bangkok, Thailand (Thai edition) ERIC and TPPIA. 2002. Application of the production performance indicators in accordance with Global Reporting Initiative (GRI) to Thai pulp and paper industries. Environmental Research Institute of Chulalongkorn University and Thai Pulp and Paper Industries Association. Bangkok, Thailand (Thai edition). Gonzalez P, Zaror C. 2000. Effect of process modifications on AOX emissions from Kraft pulp bleaching, using Chilean pine and eucalyptus. Journal of Cleaner Production 8, 233-241. Hermann B G, Kroeze C, Jawjit W. 2006. COMPLIMENT - Assessing environmental performance by combining life cycle analysis, multi-criteria analysis and environmental performance indicators. Journal of Cleaner Production: in press.
Jawjit W, Kroeze C, Soontaranun W and Hordijk L. Options to Reduce the Environmental Impact by Kraft Pulp Industry in Thailand: Model description. Journal of Cleaner Production (submitted). (Chapter 3 of this thesis)
170
Jawjit W, Kroeze C, Soontaranun W and Hordijk L. Analyzing Options to Reduce the Environmental Impact by Kraft Pulp Industry in Thailand: Model description. Journal of Cleaner Production (submitted). (Chapter 4 of this thesis) Pineda-Henson R, Culaba A B, Mendoza G A. 2002. Evaluating Evironmental Performance of Pulp and Paper Manufacturing Using the Analytical Hierarchy Process and Life-Cycle Assessment. Journal of Industrial Ecology 6(1),15-28. Poethai M. 1997. Handbook of Eucalyptus plantation, fourth edition. M.P. Reforestation Group. Bangkok, Thailand. (Thai edition) TPPIA. 1999. Annual report year 1998. Thai Pulp and Paper Industries Association. Bangkok, Thailand. (Thai edition) Vigneswaran S, Jegatheesan V, Visvanathan C. 1999. Industrial waste minimization initiatives in Thailand: concept, examples and pilot scale trials, Journal of Cleaner Production 7, 43-47. Sakurai K. 1995.Cleaner Production for Green Productivity: Asian Perspective. Asian Productivity Organization. Tokyo Schnell A, Steel P, Melcer H, Hodson P V, Carey J H. 2000. Enhanced biological treatment of bleached Kraft mill effluents: I. Removal of chlorinated organic compounds and toxicity. Water Research 34(2), 493-500. Schwarz B. 1997. Forecasting and Scenario’s. In: H.J. Miser and E.S. Quade. Handbook of systems analysis. Volume Two - Craft Issues and Procedural Choices. John Wiley and Sons, Chichester, UK: 327-367.


172
173
Chapter 6: Conclusion and Discussion 6.1 Introduction
The overall objective of this thesis is to analyse the environmental pressures of the eucalyptus-based Kraft pulp industry in Thailand, and to identify options to reduce this pressure and evaluate their cost-effectiveness. In this chapter, conclusions are drawn in section 6.2 with respect to the research questions and objective of this thesis as described in the first chapter. Important aspects of the environmental systems analysis approach and application of environmental systems analysis tools are discussed in section 6.3. Discussions on the implications of research findings for the Kraft pulp industry are presented in section 6.4. The chapter closes with recommendations for future research in section 6.5. 6.2 Conclusions In chapter 1, three research questions were formulated to achieve the overall objective of the thesis. In the following, conclusions are drawn for these research questions. Research question A: What is the current environmental pressure of the eucalyptus-based Kraft pulp industry in Thailand? The following conclusions can be drawn:
- The Kraft pulp industry as studied in this thesis includes Kraft pulp production and its upstream supply chain, eucalyptus forestry. The emissions from these activities contribute to a number of known environmental problems, specifically, global warming, acidification, eutrophication, smog, human toxicity and the production of waste. Emissions from Kraft pulp production were found to exceed those from eucalyptus forestry in every aspect.
- Acidification and eutrophication were found to be the most important
contributors to the overall environmental impact 8of the Kraft pulp industry. They contribute by about one-third each to the overall environmental impact, largely through emissions from lime kilns, recovery boilers and pulp bleaching.
- In terms of activities causing environmental problems, the chemical recovery was
found to be the most significant contributor to global warming (when biomass-based CO2 (carbon dioxide) was not included) and acidification by releasing more than half of the relevant pollutants. Wastewater treatment is, on the other hand, responsible for eutrophication as it is the source of almost three quarters of eutrophying compounds. Biomass combustion in the energy generation unit is the most important contributor to smog and human toxicity by generating about 80% and 40% to total emissions of smog precursors and human toxic substances, respectively.
8 As mentioned in Chapter 1, in this thesis environmental pressure is considered an indicator for the environmental impact and it is therefore considered equivalent to potential environmental impact.
174
- Although the overall emissions from the eucalyptus forestry are small compared with those from the Kraft pulp production, the influence of N2O (nitrous oxide) and PO4
3- (phosphate) on global warming and eutrophication, respectively, from fertilizer use in eucalyptus plantation can not be neglected.
- All in all, the results imply that not all activities contribute equally to the
environmental problems. In order to effectively reduce the environmental pressure from the Kraft pulp industry in Thailand, there are six major activities that contribute largely to total emissions. However, not all emissions from these activities need to be included in this assessment. The model developed in this thesis accounts for 85% of the total environmental pressure of the Kraft pulp industry. To this end, the following emissions and associated activities were considered: CH4 (methane), N2O, NOx (nitrogen oxide), CO (carbon monoxide), VOC (volatile organic compounds) and particulates from biomass combustion; CO2 and SO2 (sulfur dioxide) from bunker oil used in lime combustion; SO2, NOx and VOC from lime combustion; AOX (adsorbable organic halide), COD (chemical oxygen demand) and TRS (total reduced sulfur) from pulp production; P (phosphorus) from wastewater treatment; and N2O and PO4
3- from fertilizer use in eucalyptus plantation.
Research question B: Which options are available for reducing the environmental pressure, and what are their technical reduction potentials and associated costs? The following conclusions can be drawn:
- Thirty six options to reduce the environmental pressure of the Kraft pulp industry were identified and categorized into 14 groups, largely consisting of mutually exclusive options. In eucalyptus forestry there is one group of options (fertilizer use reduction), whereas in Kraft pulp production there are four groups associated with the pulp production (alternative digesting techniques, alternative bleaching techniques, wastewater treatment and wastewater minimization); two groups associated with energy generation (alternative energy generation sources and NOx control); and seven groups associated with chemical recovery (optimization in recovery boiler, alternative fuel in lime kilns, lime combustion optimization, SO2 control, odor (TRS) control, particulates control and inorganic waste management). These options can reduce activities and/or emission factors.
- The technical effectiveness of these options to reduce the environmental
pressure as well as their implementation costs are investigated using the model developed specifically in this study that is capable of quantifying emissions. By using multi-criteria analysis (MCA) for generating valuation factors, the model has also been used to evaluate the overall environmental potential impact.
- Technical reduction potentials of the options are analyzed relative to the situation
in which none of the options are applied (reference case). Options associated with reducing the emissions of eutrophying and acidifying compounds were found to be the most effective options to reduce the overall environmental impact. For instance the options in the group wastewater treatment result in relatively large reductions in the overall environmental impact (up to 31% relative to the reference case), while the effectiveness of options in the group SO2 control and odor (TRS) control is also fairly high (up to 26% reduction relative to the
175
reference case). The other groups included options that can reduce the overall environmental impact typically by less than 12%.
- The technical effectiveness of reduction options differ by environmental theme.
Options in the group alternative fuel in lime kiln and lime combustion optimization are highly effective for reducing global warming, whereas options in the group SO2 control result in the largest reduction of acidification. Options in the group wastewater treatment were found highly effective for reducing eutrophication, whereas the group alternative energy generation source is the most effective in reducing smog. The group particulate control is the most effective for reducing human toxicity, and the group solid waste reduction for reducing the production of waste.
- To reduce the overall environmental impact, options leading to structural
changes and pollution prevention, such as improving the pulp washing, increasing the dry solid content of black liquor and spillage control, are more cost effective than typical end-of-pipe technologies such as activated sludge and scrubbers. In addition, most options that are related to the reduction of acidifying and eutrophying compounds are also cost-effective. This is because, as mentioned before, acidification and eutrophication have a large share in the overall environmental impact.
- The cost-effectiveness of reduction options differs by environmental theme. To
reduce global warming, acidification and the production of waste, the O2 enrichment kiln was found to be most cost-effective. Extended delignification is highly cost-effective in reducing eutrophication. Options that appear the most cost-effective for reducing smog and human toxicity are solar heating and enzyme delignification, respectively.
- Some options were found to be paying options, which mean the annual saving
from reducing activity level/ emissions is larger than the annual costs. These options include apply optimum dose of fertilizer, extended delignification, enzyme delignification, improve pulp washing, solar heating and O2 enrichment kiln.
Research question C: What are possible future trends (2000-2020) in the environmental pressure of the eucalyptus-based Kraft pulp industry in Thailand, taking into account the technical and economical implications of combinations of environmental reduction options? The following conclusions can be drawn:
- Seven scenarios, including a No Option scenario (NOP), a Business-As-Usual scenario (BAU) and five different Environment Policy scenarios (ENP), were developed and analyzed reflecting different strategies to reduce the environmental impact, and the associated costs. The five ENP scenarios include ENP- M (theoretical maximum potential), ENP- I (intermediate; priority on cost-effective strategy), ENP-G (priority on global environmental problems), ENP-R (priority on regional environmental problems) and ENP-L (priority on local environmental problems).
- The results indicate that without currently applied reduction options the
environmental impact would be twice as high as it currently is. For the BAU
176
scenario, in which no additional pollution reduction options are assumed to be implemented, the overall environmental impact is calculated to increase between 2000 and 2020 by a factor of two.
- The largest reduction of approximately 50% of the overall environmental impact
(relative to BAU scenario) can be achieved by implementing a combination of options, each of which has the largest potential in reduce emissions (as in the ENP-M scenario). This scenario is, however, considered not feasible because of the high costs involved.
- When cost-effectiveness is given priority (as in the ENP-I scenario), it was found
that 26% reduction of the overall environmental impact can be obtained compared to the BAU scenario while the implementation costs are almost 25% lower. This indicates that currently applied options are not the most cost-effective ones.
- Giving priority to solving problems at either the global, regional or local scale,
may reduce the overall impact by 24-37% relative to the BAU scenario. These results indicate that reduction of the overall environmental impact by about one-third relative to BAU scenario can be achieved through different strategies. However, it is important to note that these scenarios differ with the respect the costs of options implemented (cost of ENP-L> ENP-R> ENP-G).
This thesis shows that environmental systems analysis (ESA) is a powerful tool
for helping us to achieve the objective of the study. It is therefore worthwhile to discuss the methodological aspects of the ESA procedures and tools used in the subsequent section.
6.3 Discussion: Environmental systems analysis approach It is clear from the above that the stepwise procedure forms the basis for the system analysis performed in this thesis. Equally important, the combination of different system analysis tools greatly contributed to the final results. The discussion of tools used in each phase of the analysis provides insight in the local context (the Kraft pulp industry in Thailand in this case) by which the research questions are addressed. 6.3.1 The six steps procedure
The six steps environmental systems analysis procedure used in this thesis, is based on Checkland (1979), Wilson (1984), Findeisen and Quade (1997) and Pluimers (2001). The six steps include: 1) problem definition; 2) system definition; 3) system synthesis; 4) system analysis; 5) scenario analysis; and 6) presentation of results and implication for decision making, as described in Chapter 1 (section 1.4.1). Here, the experiences with this step-wise approach are discussed with respect to the sequence of steps, and iterations.
177
Sequence of steps The stepwise approach has been adopted to provide a framework within which
the analysis can be performed systematically. The six steps used in this thesis are largely based on Pluimers (2001), who developed her approach based on Checkland (1979) and Wilson (1984). However, we also adopted elements from the systems analysis procedure described by Findeisen and Quade (1997). It should be noted that the systems analysis approaches in these four studies show many similarities. In the following, some differences between our approach and the others are discussed.
The first difference is related to step 3 – system synthesis -. Findeisen and Quade
(1997) suggested that options for reducing the environmental pressure should be identified and screened prior to the model building. In this thesis, the model and the reduction options were developed simultaneously. Similar step sequencing has been applied by Pluimers (2001). For the Kraft pulp industry, the number of activities and associated technologies are large. We argue that without narrowing down the alternatives prior to model building, the system could become unnecessary complex affecting the efficiency (in terms of processing/analysis time) and leading to unnecessary re-iterations due to irrelevant results. The approach followed here resulted in thirty six reduction options chosen for the pollutants and activities included in the model. By defining the system carefully, it is ensured that the most important emissions are sufficiently covered with minimal effort and the selected options are strictly restricted to the system boundary.
The second difference is related to step 5. Checkland (1979) and Wilson (1984),
who refer to this step as “selection of the optimal system”, suggest that in this step decision criteria are described and the consequences are evaluated. Pluimers (2001) identified cost optimal solutions for the current situation or very near future through optimization analysis. This was done without analyzing future trends. Since our objective in this step is to explore the possible trends for the coming two decades, we perform a scenario analysis, in line with step 3 as described by Findeisen and Quade (1997). However, Findeisen and Quade (1997) employed the scenario analysis at an earlier stage of systems analysis prior to model building to forecast future context and to explore possible options. In contrast, the objective set in this thesis is to investigate the future consequences of various implementations of reduction options. The scenario analysis is thus carried out after the model was developed.
A related difference is associated with comparing and ranking alternatives. Findeisen and Quade (1997) consider this independent of scenario analysis, and suggest that forecasting the future context is performed before evaluation of alternatives. In this thesis the alternatives (the reduction options) are first compared with respect to their effectiveness and cost effectiveness in reducing the potential environmental impact and then ranked. This ranking is used to select the options to be combined in the scenarios. This way, these two steps are not independent.
Iterations
So far, the stepwise procedure has been discussed as if it is performed
sequentially. In practice, it is experienced, however, in this thesis that these steps of the ESA procedure are not necessarily performed in a single trial. Iterations were needed in various circumstances as illustrated in Figure 6.1. Three iteration loops were carried out
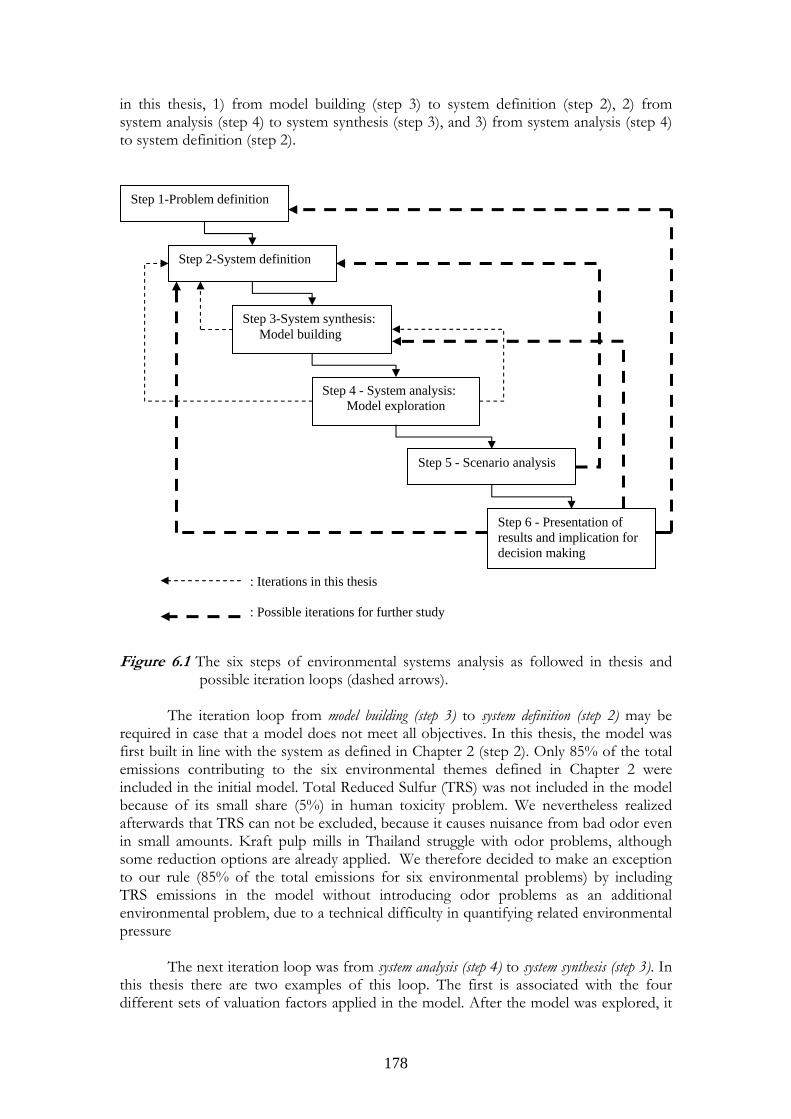
178
in this thesis, 1) from model building (step 3) to system definition (step 2), 2) from system analysis (step 4) to system synthesis (step 3), and 3) from system analysis (step 4) to system definition (step 2).
Figure 6.1 The six steps of environmental systems analysis as followed in thesis and
possible iteration loops (dashed arrows).
The iteration loop from model building (step 3) to system definition (step 2) may be required in case that a model does not meet all objectives. In this thesis, the model was first built in line with the system as defined in Chapter 2 (step 2). Only 85% of the total emissions contributing to the six environmental themes defined in Chapter 2 were included in the initial model. Total Reduced Sulfur (TRS) was not included in the model because of its small share (5%) in human toxicity problem. We nevertheless realized afterwards that TRS can not be excluded, because it causes nuisance from bad odor even in small amounts. Kraft pulp mills in Thailand struggle with odor problems, although some reduction options are already applied. We therefore decided to make an exception to our rule (85% of the total emissions for six environmental problems) by including TRS emissions in the model without introducing odor problems as an additional environmental problem, due to a technical difficulty in quantifying related environmental pressure
The next iteration loop was from system analysis (step 4) to system synthesis (step 3). In
this thesis there are two examples of this loop. The first is associated with the four different sets of valuation factors applied in the model. After the model was explored, it
Step 1-Problem definition
Step 2-System definition
Step 3-System synthesis: Model building
Step 4 - System analysis: Model exploration
Step 5 - Scenario analysis
Step 6 - Presentation of results and implication for decision making
: Iterations in this thesis : Possible iterations for further study
179
was found that the results are not very sensitive to the choice of the valuation method. Therefore, only one valuation method was used in the model for the subsequent analyses. Secondly, this iteration loop includes refining some model parameters. During the model development many model parameters were based on international literature, because of relative large uncertainties, and because Thailand-specific estimates did not exist. However, in a few cases, Thailand-specific values became available during the system synthesis phase, making it desirable to improve the model.
The last iteration loop was from system analysis (step 4) to system definition (step 2). In
the analysis of current environmental pressure as presented in Chapter 2, the Kraft pulp production consists of four main units; pulp production, energy generation, chemical recovery and wastewater treatment. However, a preliminary analysis of the reference case revealed that an analysis at the level of “sub-units”, such as lime kilns and recovery boilers in chemical recovery, was necessary for the Kraft pulp production subsystem to determine the most important contributors to the potential environmental impact, and specific reduction options to reduce emissions from these sub-units (see section 4.4 for details). Therefore, the system studied was refined by including these sub-units. Another iteration from step 4 to step 2 would have been possible, but was not performed in this thesis. It involves selecting the most important environmental problems during the system analysis, and based on that, restrict further analyses to only the most important problems. For example, in this thesis the analysis of the reference case indicates that eutrophication and acidification are the most important environmental problems, while global warming, smog and human toxicity are relatively minor problems. Based on these results, one may redefine the system by restricting it to only the most important problems. However in this thesis, we included also the minor problems in all detail in the subsequent scenario analysis for reasons of completeness.
There are other iteration loops mentioned in the literature, which were not
carried out in this thesis. For example, the iteration loop from scenario analysis (step 5) to system definition (step 2) as suggested by Findeisen and Quade (1997). In this thesis five environmental policy scenarios (ENPs), which reflect the effect of different environmental policies, were developed. In future studies, if one would like to investigate more specific environmental policies or problems, for example focusing only on water pollution, refinement of the system boundaries may be required. Likewise, the iteration loop from presentation of results (step 6) to system synthesis (step 3) may be useful for further studies, if the results, which are presented to decision makers, give rise to changes in the system. Findeisen and Quade (1997) also suggested that the iteration loops from presentation of results (step 6) to choosing objectives (step 2) and problem definition (step 1) may be needed, in case that the overall objective could not be met. Besides these examples, other iterations in the six steps procedure may be possible, because the stepwise approach, clearly, is flexible and usually not linear. Alternative sequences of steps as well as iterations are needed to meet the objectives of the study.
6.3.2 Environmental systems analysis tools
Many environmental systems analysis tools exist. They can be used individually or in combination depending on the aim and type of the study. The tools applied in this thesis include environmental indicators, life cycle assessment (LCA), multi-criteria analysis (MCA), cost-effectiveness analysis and scenario analysis. In the following these tools are discussed with respect to the three phases of the study.
180
Phase 1: Analysis of current environmental pressure of the eucalyptus-based Kraft pulp industry in Thailand
In phase 1, environmental indicators and life cycle assessment (LCA) were the tools used. Environmental indicators provide information about phenomena that are regarded typical for and/or critical to environmental quality, while LCA is a tool to assess the environmental impacts and resource use throughout a product life from raw material acquisition through production, use and disposal (Finnveden and Moberg, 2005). These tools were used in combination to define the system, and to analyze the current environmental pressure of the eucalyptus-based Kraft pulp industry in Thailand. Environmental performance indicators, such as water use and chemicals use, served as a starting point and then were extended along LCA system boundaries. A partial LCA, including a cradle-to-gate and gate-to-gate approach, was then performed in order to determine the emissions and their sources that have to be taken into account for environmental improvement.
This thesis confirms that environmental indicators can be a useful tool to quantify the environmental pressure of an industry. Application of environmental indicators to the Kraft pulp industry in Thailand has the advantage of data availability and accessibility and, thus, resulted in low time and data requirement. However, a disadvantage is that environmental indicators are often only collected for aspects for which data is easily available and only represent characteristics of importance for the industry (Hermann et al., 2006). Indeed, the available environmental indicators (e.g. COD, SO2) for Kraft pulp mills in Thailand are often collected and reported in accordance with regulatory requirements. Missing indicators therefore needed to be taken or estimate from other sources. This introduces uncertainty in the results.
Applying partial LCA was found to be a useful tool to systematically determine
all relevant environmental problems and the contribution of the different sub-processes in the Kraft pulp industry to the overall environmental impact. A Life Cycle Inventory (LCI) was used to quantify emissions from “cradle”- eucalyptus forestry – to “gate” – Kraft pulp production, while Life Cycle Impact Assessment (LCIA) was used to quantify the relative contributions of emissions to six environmental problems. However, there are also disadvantages of applying LCA at the sector or company level. This is because of the large amount of detailed data, time and expert knowledge needed to carry out a full LCA (Rebitzer et al., 2004). Because of a lack of local information, the classification factors and some emission factors had to be taken from international sources. In this phase of the research, the choice was made to use environmental indicators and LCA. One may wonder whether other tools, like substance flow analysis (SFA), could have been used. SFA is a tool to analyze the flows of a single substance through the economy and the environment, and identifies where any hazardous accumulation or emission occurs (Bouwman, 2000). SFA can also be used to analyze the contribution of different units in a system to the emissions. However, the environmental pressure of the Kraft pulp industry is caused by several pollutants and some pollutants contribute to more than one problem (e.g. NOx). This makes it complicated to perform SFA. Moreover, the objective of this phase is not only to identify the contribution of sources and activities to the emissions but also to the different environmental problems. This makes LCA is more appropriate tool for phase 1 of this thesis.
181
Environmental Impact Assessment (EIA) and Strategic Environmental Assessment (SEA) are also possible tools to assess environmental problems. EIA is a site-specific tool used to provide the decision makers with information that is as comprehensive as possible about different environmental effects of projects (Viikari, 2004; Finnveden and Moberg, 2005), whereas SEA is a systematic tool for assessing the potential significant adverse environmental impacts of proposed policies, plans, and programs early in the decision making process (Liou and Yu, 2004). This means SEA is undertaken earlier in the decision making process than EIA. However, this thesis does not aim to investigate the potential environmental impact from either a site-specific Kraft pulp project or proposed policies for the Kraft pulp industry. These two tools are therefore not suitable to meet our objective and to address our research questions. Phase 2: Model building including reduction options for the eucalyptus-based Kraft pulp industry in Thailand, and model exploration
In phase 2 a model was built to quantify emissions, and to evaluate the technical effectiveness and cost-effectiveness of options. The model has the following characteristics. First, it is a deterministic model, implying that it does not explicitly account for uncertainties as is the case for stochastic models. Second, it is an emission factor-based model, although parts may be classified as process-based. It is not a regression-based model. These choices were made because we would like to keep the model simple yet complete and appropriate to serve our study objective. Third, the model is designed for scenario analysis, and not for optimization analysis. The latter would require other modeling techniques, such as linear programming. We choose scenario analysis because our objective is to explore possible future trends, and not the desirable future as in optimization analysis. To this end, we combined different approaches from some environmental systems analysis tools to build the model, as discussed in the following paragraphs.
Three tools were combined, including life cycle assessment (LCA), multi-criteria analysis (MCA) and cost-effectiveness analysis, to develop an integrated environmental assessment model. The mathematical formulations are largely based on LCA approaches. Formulations aimed for quantifying emissions are based on a Life Cycle Inventory (LCI) approach, whereas a Life Cycle Impact Assessment (LCIA) approach is applied in formulations used to quantify the relative contributions of emissions to six environmental problems.
An MCA approach was also taken in building the model. MCA was used to aggregate six different environmental impacts into one overall environmental indicator. Several MCA methods exist. In this thesis, the Analytical Hierarchy Process (AHP) was selected to generate the valuation (weighing) factors, because it is a flexible weighted scoring decision making tool to assist in setting priorities and making the decisions when many different criteria, that are not always easy to quantify, of a decision need to be considered (Saaty, 1990). Besides considering all environmental problems equally important, three sets of weights were developed to generate valuation factors, based on global, regional and local perspectives. We developed this approach because the Kraft pulp industry affects environmental problems at different spatial scales.
182
Alternative MCA methods include “Distance-to-target methods”, “NSAEL methods” and “Panel methods”, which have not been used in this study. In a Distance-to-target approach, the valuation factors reflect the difference (distance) between the calculated present day emissions of a certain pollutant and some desired (target) level. Since the desired level is a political choice, these valuation factors reflect the political preferences. This method was not chosen, since no environmental targets have been set for either the Kraft pulp industry or other industries in Thailand. Although valuation factors based on this method are available in the Eco-Indicator 95 (Goedkoop, 1995), this method was considered not appropriate for this Thailand specific case study, since the targets used in this study are based on an analysis of the damage to ecosystems and human health caused by an environmental pressure at the European scale. Valuation factors can also be based on NSAEL (No Significant Adverse Effect Level), which is defined as the level at which structural changes to ecosystems caused by environmental pressures do not occur, or where the effects are considered acceptable (Pluimers, 2001). The valuation factors could reflect to what extent these NSAEL are exceeded. In general, the NSAELs are based on scientific studies of the sensitivity of organisms to toxic compounds. Although some NSAEL-based valuation factors are available (Kortman et al., 1994), these factors are not suitable for Thailand because they relate to the Dutch area and the Dutch situation. For the Panel method, valuation factors are based on the judgment of a panel of environmental experts, who can be scientists, policy makers and/or stakeholders (e.g. pulp entrepreneur). These valuation factors reflect the personal opinions of experts, who may base their opinion on political and/or scientific arguments (Lindeijer, 1996). This method therefore is considered highly subjective. Another reason to not use the Panel method was that it is relatively time consuming.
An important disadvantage of any MCA method is the subjectivity in generating valuation factors. It is therefore worthwhile to compare the results of several MCA methods (reflecting different priorities) in order to gain insight into the sensitivity of the MCA results to the choice of the valuation methods (Pluimers, 2001). In this thesis, we applied four different sets of valuation factors. The model results were found to be not very sensitive to the choice of valuation factors, though some differences resulted from the different valuation methods were observed (see section 4.5.1 in Chapter 4).
In this thesis, cost-effectiveness analysis is used to reflect the relation between the costs of the reduction options and the environmental improvement. It is also used to compare and rank the options, based on which a selection of combinations of options can be made for subsequent scenario analyses. A disadvantage of cost-effectiveness analysis is that it considers only costs of implementing and maintaining the alternative (the reduction options) and ignores other costs, such as costs of environmental damage and costs of human health. To include these other costs in an analysis cost-benefit analysis can be used. Cost-benefit analysis is an economic tool for supporting decisions on large investments from a social point of view (CML, 2003). In cost-benefit analysis, both costs and benefits are expressed in monetary terms. However, cost-benefit analysis is not included in the thesis because the uncertainties in quantifying the monetary benefits (avoided damage) are large compared to the monetary costs. As a result this thesis provides entrepreneurs and decision makers with information on the effectiveness and the cost-effectiveness of options to reduce the environmental impact caused by the Kraft pulp industry, rather than information on the cost of environmental damage and the benefit of the reduction options in monetary terms.
183
Phase 3: Analysis of future trends in environmental management of the eucalyptus-based Kraft pulp industry in Thailand
In phase 3 a scenario analysis was performed to investigate future trends (2000-2020) in environmental pressure of the Kraft pulp industry in Thailand, and to assess the possible implementation of different strategies to reduce the environmental impact (in line with UNEP, 2002 and Robinson, 2003). In this thesis the scenario analysis is following an exploratory approach, since our objective is to explore possible future trends. The choice of the scenario period (time horizon) depends very much on the objectives of the scenario analysis. In this thesis, the time horizon is 20 years (2000-2020). This period is chosen because the life time of many reduction options is typically about 15-25 years (see Table A.9 in Chapter 3). This period is also appropriate, because we aim to focus on the environmental pressure (the potential impact) from the emissions of pollutants, rather than the state of the environment (e.g. changing of climate) which would need a longer time period to be analyzed. Likewise, the choices of scenarios depend on the objectives of Kraft pulp entrepreneurs and decision makers. For example, if they would like to focus only on environmental problems that are currently regulated by Thai environmental laws, a new scenario can be developed to achieve that objective.
The scenarios analyzed in this thesis can be classified as exploratory scenario.
Alternatively, anticipatory scenarios could have been analyzed. These start with a prescribed vision of the future (target) and then work backwards in time to visualize how this future could emerge (Alcamo, 2001).This is also referred to as backcasting (as opposed to forecasting in exploratory scenario). The model used in this thesis could be applied in backcasting exercises in case that Kraft pulp mills in Thailand set desirable environmental targets, such as total-chlorine-free pulp in 2020 or zero-effluent mills in 2020. Information about the selection of reduction options required to reach such targets can be obtained from the model through multiple model runs. However, the model can not be used for optimization analysis aiming at reaching targets at minimal costs or emissions.
Scenario analysis can be performed with or without involvement of stakeholders
(participatory and non-participatory approaches). Alcamo (2001) describes a scenario and simulation procedure, in which stakeholders participate, and cooperate with systems analysts to develop scenarios reflecting stakeholders’ opinions and views. One may argue, therefore, that to gain more insight in sustainable future development of the Kraft pulp industry in Thailand, different stakeholders (e.g. pulp entrepreneurs, eucalyptus farmers, policy makers) could have been invited to participate in developing the scenarios. In this thesis, such a participatory approach was not followed, because it is relatively time consuming and costly due to multiple cycles of storyline writing, quantification and scenario review from several participants (Alcamo, 2001; Mietzner and Reger, 2004). This is considered out of our scope of study. Rather, a set of possible futures was explored reflecting a number of reduction strategies.
184
6.3.3 Uncertainty analysis Uncertainties exist in all environmental systems analysis studies. The sources of uncertainty include: context uncertainty, model uncertainty, inputs uncertainty, parameter uncertainty and model outcome uncertainty (see Walker et al. (2003) for details). In this thesis, important uncertainties are associated with model input and parameter values. Input uncertainty includes extrapolation error (e.g. amount of fertilizer use in eucalyptus plantation), measurement error (e.g. SO2, AOX measurement of Thai Kraft pulp mills), unknown developments (e.g. costs of future reduction options) and reporting errors (Van Aardenne, 2002). Parameter uncertainty in this thesis is largely associated with constants in the model, including emission factors, classification factors, normalization factors and valuation factors (see Chapter 3). These parameters are uncertain, partly because they are not Thailand-specific. There are several methods for assessment of uncertainty. In this thesis uncertainty analysis was only partly performed. In Chapter 4, sensitivity analysis was performed for different sets of valuation factors, and model results were compared with the literature. Uncertainty analysis includes both qualitative and quantitative approaches. Qualitative uncertainty analysis includes, for example, expert judgment (asking experts to give a qualitative or quantitative assessment of the uncertainties), data quality rating (alphabetical or numerical scores are assigned to inputs and parameters to express the uncertainty in a qualitative way (high-low)) and qualitative discussion (a discussion of the sources of inaccuracy that are known to occur). Quantitative uncertainty analysis includes, for example, error propagation (calculation of uncertainty in inventory induced by inaccuracy in input values), importance analysis (calculation of the relative importance of uncertainty in input values to the overall uncertainty) and comparison results with direct and direct measurements (Van Aardenne, 2002). These methods are not extensively performed in this thesis. It would be interesting to further analyze uncertainties in the future, in order to direct experimental studies in Thailand towards relatively uncertain and important processes. It is worth noting that the environmental systems analysis procedure itself can reduce uncertainty, since the stepwise approach allows for iteration. Iteration loops associated with system definition can reduce context uncertainty, whereas iteration loops associated with model building can reduce model uncertainty, inputs uncertainty, parameter uncertainty as well as model outcome uncertainty. For example, the iteration that leads to including TRS in the model did reduce the context uncertainty, which is associated with the boundaries of the system to be modeled.
185
6.4 Implication of study results for the Kraft pulp industry The usefulness of this work for the Kraft pulp industry in Thailand arises from individual findings in each phase of study from the understanding of environmental pressure, and the identification of reduction options and their cost-effectiveness, to the scenario analysis results.
Environmental pressure
The study revealed that among six major environmental problems, acidification and eutrophication can be considered the most important in terms of their large contributions to the overall environmental impact. Therefore, one could best focus on these two problems, if the focus of environmental management is on the overall environmental impact. In other words, a firm having effectively controlling acidification and eutrophication tends to have a better overall environmental management. When considering the Thai national policies, it is encouraging to find that the current environmental regulations include some pollutants contributing to acidification and eutrophication (SO2, NOx and COD). This line of practice will become more stringent in the near future as the “Polluter Pay Principle (PPP)” is being implemented progressively. At present, the PPP concept is enforced in specific industrial sectors which generate a considerable amount of wastewater and/or BOD, COD loading. Our results further indicate that the upcoming legislation related to PPP in the Thai Kraft pulp industry could be focused on sources of acidification. However, it is important to note that phosphorus (P), which has a relatively high nutrification potential (Heijungs et al., 1992) and an important share in eutrophication, is not yet legislated in Thailand’s industrial effluent regulations (EEA, 2005). Clearly, addition of phosphorus to the existing effluent standards can enhance the effectiveness in environmental management of the Kraft pulp industry.
Although the results in this thesis reveal that eucalyptus forestry has a relatively
small share in the environmental impact of the Kraft pulp industry in Thailand, the results are useful and revealing the current status of environmental pressure of eucalyptus forestry. The results will also be interesting for decision makers on future projects, especially large scale intensive eucalyptus plantations. N2O and PO4
3- emissions, which we found to be important pollutants from fertilizer in eucalyptus plantation, from such large plantation can not be neglected. For instance, environmental effects from eucalyptus forestry could not be excluded in the future study on a mega Kraft pulp project in which the Chinese government and Thailand’s largest pulp and paper company are involved, because this project requires 120,000 ha for an intensive eucalyptus plantation (Rajesh, 2000).
Our model includes at least 85% of total emissions associated with the Kraft pulp
industry (see Chapter 2). This means that some activities and emissions, such as fuel use in eucalyptus transportation, are omitted, and not included in the analysis of reduction options. Based on the current status of the Kraft pulp industry in Thailand, these excluded activities and emissions can be considered as minor contributors to the environmental impact. Including them would complicate the model and elaborate subsequent analyses. However, these omitted sources could become significant contributors in the future, if important factors, such as the production capacity, the production process, environmental targets, would change. In addition, we can not
186
guarantee that some options to reduce these 15% emissions are relatively cost effective. Nevertheless, we consider our model adequate for the purpose of our study.
The system boundary of thesis goes beyond the emissions which are currently
obligatory by Thailand environmental laws. For example, emissions of CO2, CH4, N2O, NMVOC and AOX are not covered by the current environmental regulations in Thailand. However, the results of this thesis indicate that it may be appropriate to include them in future regulations. The results of environmental pressure analysis for the Kraft pulp industry are therefore not only useful for environmental management in the current situation, but also for the future.
Technical effectiveness and cost-effectiveness of the reduction options
Analyses of the effectiveness and cost-effectiveness of the reduction options are useful for Kraft pulp mill’s decision makers. They may help to make a selection of options to be implemented. This study provides Kraft pulp entrepreneurs with a list of the most cost-effective options, to reduce either the overall environmental impact or specific environment problems. There may be cases that these cost-effective options are not enough to meet specific environmental targets. In such cases, the entrepreneurs may wish to consider more effective options regardless of their costs.
The results in technical effectiveness and cost-effectiveness of options can guide
decision makers. For instance, if Kraft pulp entrepreneurs in Thailand aim to reduce acidification in line with the upcoming “Polluter Pay Principle PPP” regulations, they may consider the three options with the largest potential to reduce emissions of acidifying compounds including scrubbers (currently applied), condensate stripping and gas collection and combustion in separate furnaces. However, the results of cost-effectiveness analysis indicate that scrubbers and gas collection and combustion in separate furnaces are less attractive due to their relatively high costs. Instead, O2 enrichment kilns could be an attractive choice for Thai Kraft pulp entrepreneurs, since it was found to be the most cost effective option for reducing emissions of acidifying compounds, and also a paying option (described below).
To reduce eutrophication, activated sludge (AS) is a favorite process applied now in
Thai Kraft pulp mills to mainly reduce eutrophying COD, since the effluent regulations currently only focus on COD. However, our analysis indicates that P is also important in eutrophication. In this study UASB (Upflow Anaerobic Sludge Blanket) was found to be the option with the largest potential to reduce overall eutrophying emissions, and more cost effective than AS. UASB can be considered a potential alternative, especially if P would be part of future legislation in Thailand for industrial effluent. UASB could be operated in combined with the currently applied reduction-at-source options including spillage collection, extended delignification, improve pulp washing, or even future options like enzyme delignification. These reduction-at-source options were found to be relatively cost effective.
Analysis of individual reduction options indicates that for some options the
annual savings exceed the annual costs. We refer to these options as paying options. They include apply optimum dose of fertilizer, extended delignification, enzyme delignification, improve pulp washing, solar heating and O2 enrichment kiln. To our knowledge, extended delignification and improve pulp washing are currently applied in some Thai Kraft pulp mills, but other options are not, partly because they are not currently available yet at the industrial scale
187
(enzyme delignifiation, solar heating and O2 enrichment kiln), partly because of ignorance (apply optimum dose of fertilizer).
Scenario analysis Environmental policy of the Thai Kraft pulp industry may depend on several factors, such as social expectation, government environmental regulations, international market demand. The implication of the results therefore depends much on the environmental targets of the industry. The results from our model can serve as the supporting information for decision making on different environmental targets, including ‘the overall environmental impact’, ‘environmental impact for specific problems’ and ‘emissions of specific pollutants’. In this thesis, the results from the scenario analysis are useful for reflecting on the consequences of different environmental policies, and may help Kraft pulp mill’s decision and policy makers to develop environmental strategies for the future. For example, one Kraft pulp mill in the north eastern of Thailand is struggling with wastewater problems (causing eutrophication). The results of the ENP-R scenario, which gives first priority to regional problems (including eutrophication), indicate that a 30% reduction in eutrophying compounds relative to the current practices (BAU scenario) can be achieved. However, it is worth noting that 25% reduction in eutrophying compounds in the ENP-I scenario can be achieved, at 50% lower costs than in ENP-R. Therefore, the combination of options included in the ENP-I scenario is may be more attractive for this Kraft pulp mill. Other challenging issues for the Thai Kraft pulp industry are emissions of AOX and TRS from the pulp production process, even though human toxicity (caused by AOX and TRS) was found a minor contributor to the overall environmental impact. Minimal AOX content in effluent is required by the international market, whereas odorous TRS is the often the first issue complained about by communities nearby Thai Kraft pulp mills (Wongsomboon, 2004). The results from the ENP-L scenario, which reflect a policy preference for local problems (including human toxicity), indicate that about 80% reduction of toxic compounds relative to the BAU scenario can be achieved. However, the costs of this scenario are relatively high. Interestingly enough, the combination of options in the ENP-R scenario is found to be an attractive alternative, since it results in a 70% reduction in toxic compounds at only one-third of the costs of the ENP-L scenario.
Clearly, different policy preferences will lead to different combinations of
options. Our model allows the users to analyze any of the six environmental problems included, and to make user-defined combinations of options. The model can be used to analyze the environmental consequences of such combinations, and the associated costs of emission control. As such the model is highly relevant for decision makers.
188
6.5 Recommendation for future research Novel aspects of this thesis are 1) the development of an integrated environmental assessment model for the Kraft pulp industry in Thailand, 2) the analysis of interaction of the reduction options, 3) the cost-effectiveness analysis of reduction options and 4) a analysis of future trend of the Kraft pulp industry in Thailand. These results can contribute to filling the knowledge gaps identified in Chapter 1 (section 1.2.3), and are helpful for our analyses to achieve the overall objective. However, there are some interesting issues for future study as discussed in the following.
The integrated environmental assessment model developed in this thesis aims to be used for decision making in eucalyptus forestry and Kraft pulp production. However, the model is to some extent flexible in the choice of system boundaries to some extent. For example, expanding the system boundary to include paper production is technically possible. However, there are two important aspects that need to be taken into account. The first is that the current model can be used to quantify the potential environmental impact, and evaluate the effectiveness and cost-effectiveness of options for a given final product. Therefore, it is essential to indicate the type of final paper products (e.g. bleach or non-bleach writing paper, sanitary paper, paper board), each of which has a different production process. The second is that a new reference case needs to be developed when system boundaries change, because the activity levels calculated in the model are relative to the assumed reference case. To extend the system boundary to also include the use, disposal and recycling of paper may not be possible for the current model. A full LCA would for such a study be more appropriate. To reduce the model uncertainties, further studies on national and/ or local parameters used in the model, such as emission factors, classification factors, normalization factors, are needed. A recent study performed by Pavasant et al. (2006) has attempted to use most local emission factors in LCA software, but all classification factors and normalization factors are still based on the international sources. Uncertainty analysis are also worthwhile, since in this thesis we did not perform uncertainty analysis to a large extent. This thesis analyzed the technical reduction potential as well as cost-effectiveness of options aimed to reduce the environmental pressure of the Kraft pulp industry in Thailand. However, we did not analyze the national or sectoral economic developments nor did we perform a cost-benefits analysis. Such studies could be helpful for future studies on costs and environmental impact of a certain large scale pulp project.
Alternative reference cases would be interesting to study, since the technical reduction potentials of the options are analyzed relative to the reference case. In this thesis the reference case was defined as the situation in which none of the options are applied, because we would like to investigate the potential of the reduction options currently applied in Thai Kraft pulp mills. However, one could define a different reference cases based on other objectives of analysis. For example, if the goal of a Kraft pulp mill is to become a ‘TCF (total chlorine free) Kraft pulp’ mill in the future, using the current practices in that Kraft pulp mill as the reference case is sensible.
189
Our model is built to serve as a basis for scenario analysis. It allows users to
define combinations of options reflecting their personal interest to be analyzed in scenarios. This flexibility is valuable for future model applications. Future scenario analysis could be performed at the mill scale or at the sector scale, for example, including ‘a zero effluent mill’ scenario, or ‘a large scale eucalyptus plantation’ scenario. A ‘Polluter Pay Principle (PPP)’ scenario could be performed to analyze the consequences of possible environmental regulations. Environmental systems analysis proved to be a powerful tool to perform an integrated environmental assessment of the Kraft pulp industry. It may help the Kraft pulp entrepreneurs to decide on future strategies in environmental management. For the case of Thai Kraft pulp industry, this thesis shows that the industry has been successful in avoiding environmental pressure by implementing a number of reduction options. However, it is also clear that there is room to improve the environmental performance, since the currently applied reduction options may not be the most cost-effective choices for the future. The industry may be most interested in the paying options that were identified in the cost-effectiveness analysis. Moreover, this thesis also provides new information about the overall (integrated) environmental impact and the future trends that is beneficial for decision making by the Kraft pulp entrepreneurs in Thailand.
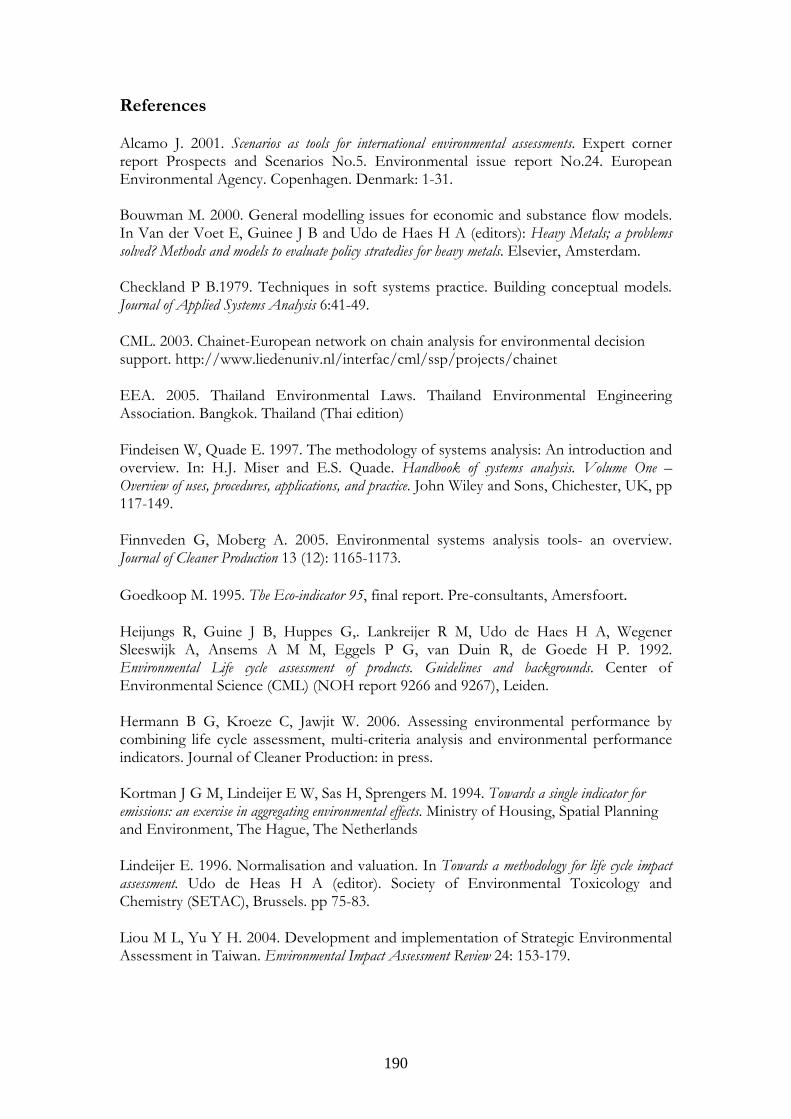
190
References Alcamo J. 2001. Scenarios as tools for international environmental assessments. Expert corner report Prospects and Scenarios No.5. Environmental issue report No.24. European Environmental Agency. Copenhagen. Denmark: 1-31. Bouwman M. 2000. General modelling issues for economic and substance flow models. In Van der Voet E, Guinee J B and Udo de Haes H A (editors): Heavy Metals; a problems solved? Methods and models to evaluate policy stratedies for heavy metals. Elsevier, Amsterdam. Checkland P B.1979. Techniques in soft systems practice. Building conceptual models. Journal of Applied Systems Analysis 6:41-49. CML. 2003. Chainet-European network on chain analysis for environmental decision support. http://www.liedenuniv.nl/interfac/cml/ssp/projects/chainet EEA. 2005. Thailand Environmental Laws. Thailand Environmental Engineering Association. Bangkok. Thailand (Thai edition) Findeisen W, Quade E. 1997. The methodology of systems analysis: An introduction and overview. In: H.J. Miser and E.S. Quade. Handbook of systems analysis. Volume One – Overview of uses, procedures, applications, and practice. John Wiley and Sons, Chichester, UK, pp 117-149. Finnveden G, Moberg A. 2005. Environmental systems analysis tools- an overview. Journal of Cleaner Production 13 (12): 1165-1173. Goedkoop M. 1995. The Eco-indicator 95, final report. Pre-consultants, Amersfoort. Heijungs R, Guine J B, Huppes G,. Lankreijer R M, Udo de Haes H A, Wegener Sleeswijk A, Ansems A M M, Eggels P G, van Duin R, de Goede H P. 1992. Environmental Life cycle assessment of products. Guidelines and backgrounds. Center of Environmental Science (CML) (NOH report 9266 and 9267), Leiden. Hermann B G, Kroeze C, Jawjit W. 2006. Assessing environmental performance by combining life cycle assessment, multi-criteria analysis and environmental performance indicators. Journal of Cleaner Production: in press. Kortman J G M, Lindeijer E W, Sas H, Sprengers M. 1994. Towards a single indicator for emissions: an exercise in aggregating environmental effects. Ministry of Housing, Spatial Planning and Environment, The Hague, The Netherlands Lindeijer E. 1996. Normalisation and valuation. In Towards a methodology for life cycle impact assessment. Udo de Heas H A (editor). Society of Environmental Toxicology and Chemistry (SETAC), Brussels. pp 75-83. Liou M L, Yu Y H. 2004. Development and implementation of Strategic Environmental Assessment in Taiwan. Environmental Impact Assessment Review 24: 153-179.
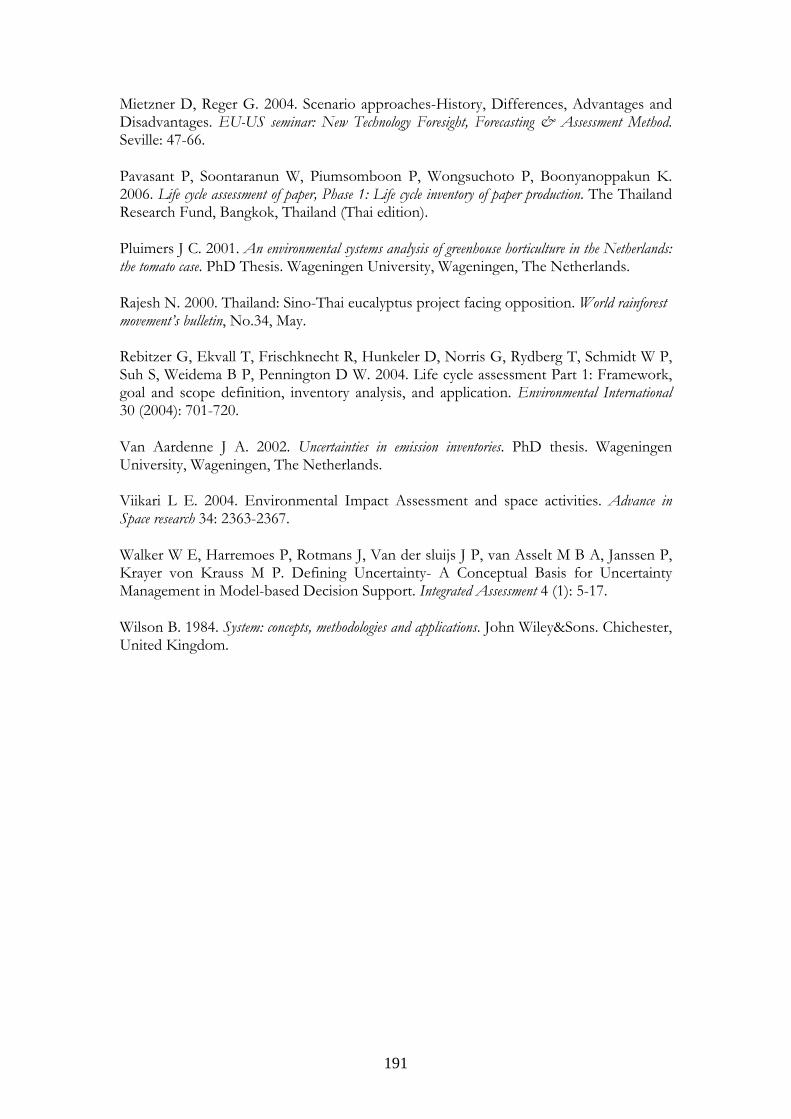
191
Mietzner D, Reger G. 2004. Scenario approaches-History, Differences, Advantages and Disadvantages. EU-US seminar: New Technology Foresight, Forecasting & Assessment Method. Seville: 47-66. Pavasant P, Soontaranun W, Piumsomboon P, Wongsuchoto P, Boonyanoppakun K. 2006. Life cycle assessment of paper, Phase 1: Life cycle inventory of paper production. The Thailand Research Fund, Bangkok, Thailand (Thai edition). Pluimers J C. 2001. An environmental systems analysis of greenhouse horticulture in the Netherlands: the tomato case. PhD Thesis. Wageningen University, Wageningen, The Netherlands. Rajesh N. 2000. Thailand: Sino-Thai eucalyptus project facing opposition. World rainforest movement’s bulletin, No.34, May. Rebitzer G, Ekvall T, Frischknecht R, Hunkeler D, Norris G, Rydberg T, Schmidt W P, Suh S, Weidema B P, Pennington D W. 2004. Life cycle assessment Part 1: Framework, goal and scope definition, inventory analysis, and application. Environmental International 30 (2004): 701-720. Van Aardenne J A. 2002. Uncertainties in emission inventories. PhD thesis. Wageningen University, Wageningen, The Netherlands. Viikari L E. 2004. Environmental Impact Assessment and space activities. Advance in Space research 34: 2363-2367. Walker W E, Harremoes P, Rotmans J, Van der sluijs J P, van Asselt M B A, Janssen P, Krayer von Krauss M P. Defining Uncertainty- A Conceptual Basis for Uncertainty Management in Model-based Decision Support. Integrated Assessment 4 (1): 5-17. Wilson B. 1984. System: concepts, methodologies and applications. John Wiley&Sons. Chichester, United Kingdom.

192
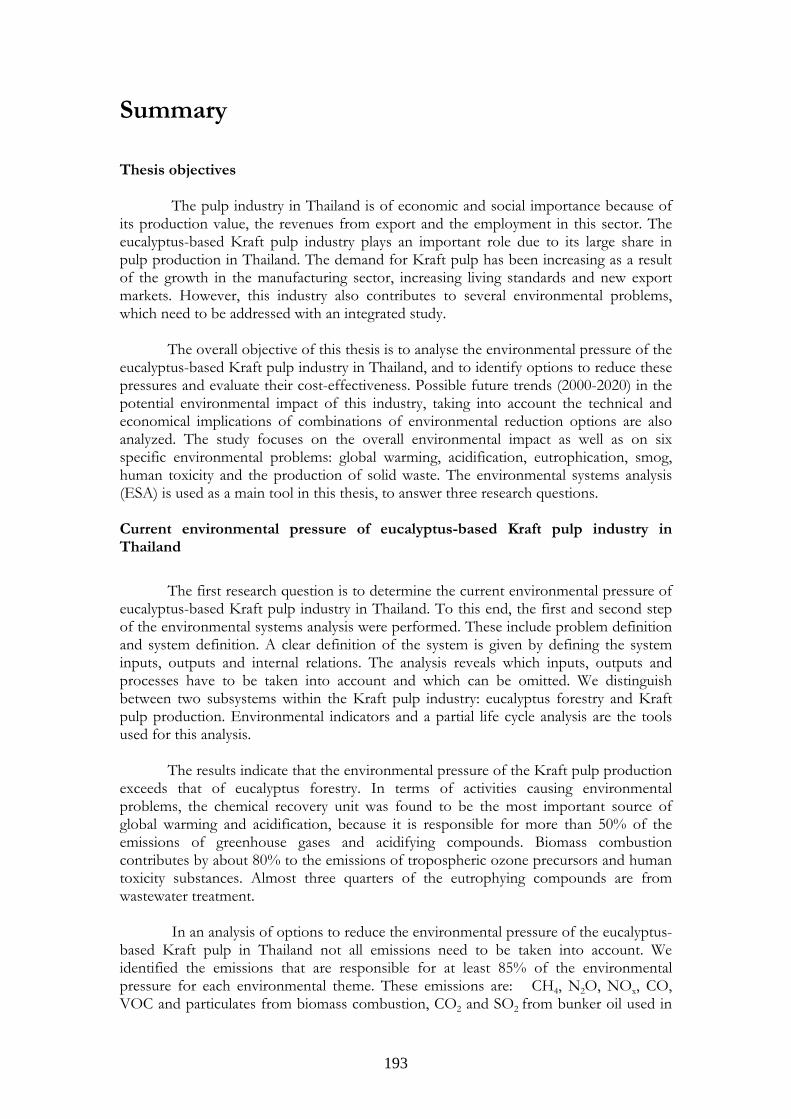
193
Summary Thesis objectives The pulp industry in Thailand is of economic and social importance because of its production value, the revenues from export and the employment in this sector. The eucalyptus-based Kraft pulp industry plays an important role due to its large share in pulp production in Thailand. The demand for Kraft pulp has been increasing as a result of the growth in the manufacturing sector, increasing living standards and new export markets. However, this industry also contributes to several environmental problems, which need to be addressed with an integrated study. The overall objective of this thesis is to analyse the environmental pressure of the eucalyptus-based Kraft pulp industry in Thailand, and to identify options to reduce these pressures and evaluate their cost-effectiveness. Possible future trends (2000-2020) in the potential environmental impact of this industry, taking into account the technical and economical implications of combinations of environmental reduction options are also analyzed. The study focuses on the overall environmental impact as well as on six specific environmental problems: global warming, acidification, eutrophication, smog, human toxicity and the production of solid waste. The environmental systems analysis (ESA) is used as a main tool in this thesis, to answer three research questions. Current environmental pressure of eucalyptus-based Kraft pulp industry in Thailand
The first research question is to determine the current environmental pressure of
eucalyptus-based Kraft pulp industry in Thailand. To this end, the first and second step of the environmental systems analysis were performed. These include problem definition and system definition. A clear definition of the system is given by defining the system inputs, outputs and internal relations. The analysis reveals which inputs, outputs and processes have to be taken into account and which can be omitted. We distinguish between two subsystems within the Kraft pulp industry: eucalyptus forestry and Kraft pulp production. Environmental indicators and a partial life cycle analysis are the tools used for this analysis.
The results indicate that the environmental pressure of the Kraft pulp production
exceeds that of eucalyptus forestry. In terms of activities causing environmental problems, the chemical recovery unit was found to be the most important source of global warming and acidification, because it is responsible for more than 50% of the emissions of greenhouse gases and acidifying compounds. Biomass combustion contributes by about 80% to the emissions of tropospheric ozone precursors and human toxicity substances. Almost three quarters of the eutrophying compounds are from wastewater treatment.
In an analysis of options to reduce the environmental pressure of the eucalyptus-
based Kraft pulp in Thailand not all emissions need to be taken into account. We identified the emissions that are responsible for at least 85% of the environmental pressure for each environmental theme. These emissions are: CH4, N2O, NOx, CO, VOC and particulates from biomass combustion, CO2 and SO2 from bunker oil used in
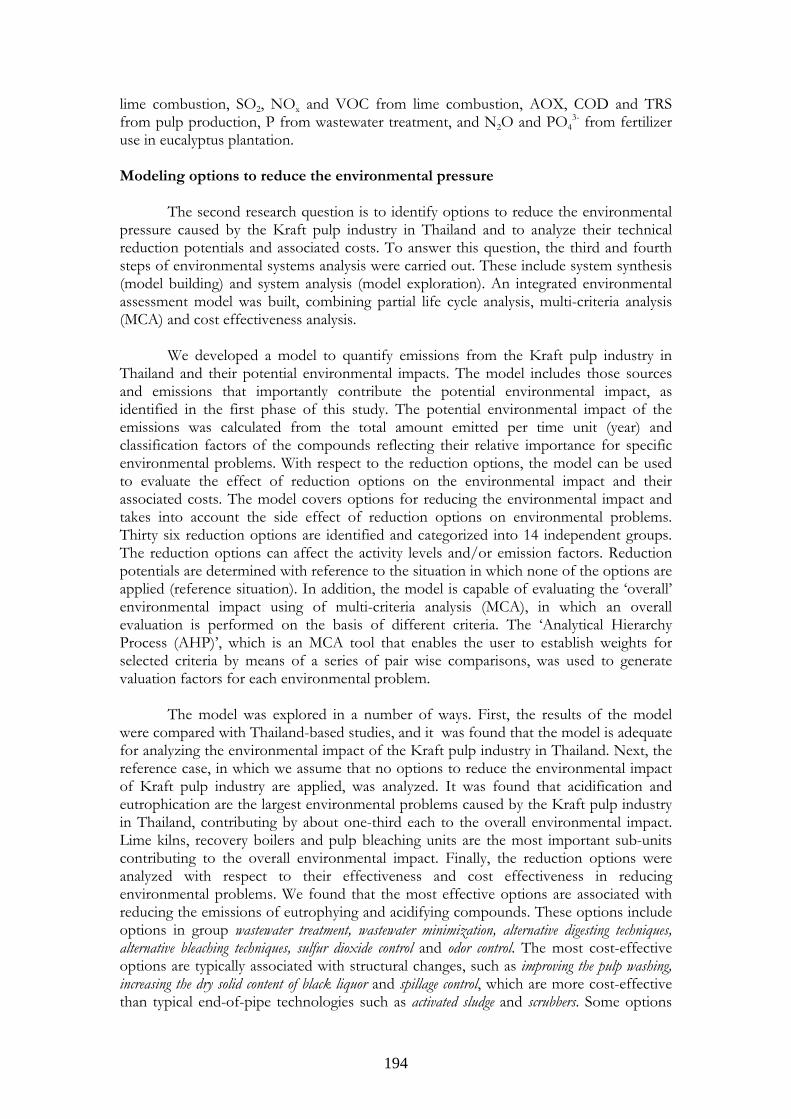
194
lime combustion, SO2, NOx and VOC from lime combustion, AOX, COD and TRS from pulp production, P from wastewater treatment, and N2O and PO4
3- from fertilizer use in eucalyptus plantation.
Modeling options to reduce the environmental pressure
The second research question is to identify options to reduce the environmental pressure caused by the Kraft pulp industry in Thailand and to analyze their technical reduction potentials and associated costs. To answer this question, the third and fourth steps of environmental systems analysis were carried out. These include system synthesis (model building) and system analysis (model exploration). An integrated environmental assessment model was built, combining partial life cycle analysis, multi-criteria analysis (MCA) and cost effectiveness analysis.
We developed a model to quantify emissions from the Kraft pulp industry in
Thailand and their potential environmental impacts. The model includes those sources and emissions that importantly contribute the potential environmental impact, as identified in the first phase of this study. The potential environmental impact of the emissions was calculated from the total amount emitted per time unit (year) and classification factors of the compounds reflecting their relative importance for specific environmental problems. With respect to the reduction options, the model can be used to evaluate the effect of reduction options on the environmental impact and their associated costs. The model covers options for reducing the environmental impact and takes into account the side effect of reduction options on environmental problems. Thirty six reduction options are identified and categorized into 14 independent groups. The reduction options can affect the activity levels and/or emission factors. Reduction potentials are determined with reference to the situation in which none of the options are applied (reference situation). In addition, the model is capable of evaluating the ‘overall’ environmental impact using of multi-criteria analysis (MCA), in which an overall evaluation is performed on the basis of different criteria. The ‘Analytical Hierarchy Process (AHP)’, which is an MCA tool that enables the user to establish weights for selected criteria by means of a series of pair wise comparisons, was used to generate valuation factors for each environmental problem.
The model was explored in a number of ways. First, the results of the model
were compared with Thailand-based studies, and it was found that the model is adequate for analyzing the environmental impact of the Kraft pulp industry in Thailand. Next, the reference case, in which we assume that no options to reduce the environmental impact of Kraft pulp industry are applied, was analyzed. It was found that acidification and eutrophication are the largest environmental problems caused by the Kraft pulp industry in Thailand, contributing by about one-third each to the overall environmental impact. Lime kilns, recovery boilers and pulp bleaching units are the most important sub-units contributing to the overall environmental impact. Finally, the reduction options were analyzed with respect to their effectiveness and cost effectiveness in reducing environmental problems. We found that the most effective options are associated with reducing the emissions of eutrophying and acidifying compounds. These options include options in group wastewater treatment, wastewater minimization, alternative digesting techniques, alternative bleaching techniques, sulfur dioxide control and odor control. The most cost-effective options are typically associated with structural changes, such as improving the pulp washing, increasing the dry solid content of black liquor and spillage control, which are more cost-effective than typical end-of-pipe technologies such as activated sludge and scrubbers. Some options
195
were found to be paying options, which means that the annual saving from reducing activity levels and/or emissions is larger than the annual costs. These options include applying optimum doses of fertilizer, extended delignification, enzyme delignification, improve pulp washing, solar heating and O2 enrichment kilns.
The results of the analysis of the reference case may help decision makers in
prioritizing environmental management, while the analyses of the effectiveness and the cost-effectiveness of individual reduction options may help in choosing reduction options that are in line with their preferred environmental strategies. Different environmental strategies will lead to different combinations of options. The model can be used to analyze the environmental consequences and the associated costs of such combinations. As such the model is highly relevant for decision makers.
Scenario analysis
The last research question is to investigate possible future trends in the environmental pressure caused by the eucalyptus-based Kraft pulp industry in Thailand. Possible changes in the environmental performance of the eucalyptus-based Kraft industry in Thailand are analyzed for a 20 year period (2000-2020) through scenario analysis.
Seven scenarios were developed and analyzed, including a No Option scenario
(NOP), a Business-As-Usual scenario (BAU) and five different Environment Policy scenarios (ENP), reflecting different strategies to reduce the environmental impact. These scenarios were analyzed with respect to their effectiveness in reducing the environmental pressure, and the associated costs. For each scenario, the overall environmental impact was calculated, and emissions were quantified for compounds that contribute to six environmental problems: global warming, acidification, eutrophication, smog, human toxicity and the production of waste.
The results indicate that without currently applied reduction options the environmental impact would be twice as high as it currently is. For the BAU scenario, in which no additional pollution reduction options are assumed to be implemented, the overall environmental impact was calculated to increase between 2000 and 2020 by a factor of two. The five Environmental Policy scenarios (ENP) reflect different strategies to reduce the environmental impact. The results indicate that, in the case of the ENP-M (theoretical maximum potential) scenario, it is theoretically possible to reduce the overall environmental impact by almost 50% relative to the BAU 2020 levels. This, however, may not be feasible because of the high costs involved. In the ENP-I (intermediate) scenario, for which cost-effectiveness is given a high priority, a 26% reduction in the overall environmental impact was calculated relative to the BAU scenario at almost 25% lower costs. This makes the ENP-I scenario the cheapest of the scenarios studied here. The other ENP scenarios reflect different policy preferences for solving environmental problems at the global (ENP-G), regional (ENP-R), and local (ENP-L) scale. The results for these scenarios indicate that 24-37% reduction of the overall impact relative to the BAU scenario can be achieved. This reflects that reduction of the overall environmental impact by about one-third relative to BAU scenario can be achieved through strategies which have a different focus. However, it is important to note that the costs of options implemented in these scenarios are different (cost of ENP-L> ENP-R> ENP-G).
196
Environmental systems analysis procedure
Environmental systems analysis (ESA) was found to be a useful procedure to analyze the environmental pressure, identify options to reduce these pressures and evaluate their cost-effectiveness for the eucalyptus-based Kraft pulp industry in Thailand. It was applied in six steps: 1) problem definition; 2) system definition; 3) system synthesis; 4) system analysis; 5) scenario analysis; and 6) presentation of results and implications for decision making. We have learned that this step-wise approach is not necessarily linear. Iterations were found to be needed to meet the objectives of the study.
Environmental indicators, life cycle assessment (LCA), multi-criteria analysis
(MCA), cost-effectiveness analysis and scenario analysis, have been proved to be essential tools for the analysis in this thesis. First, environmental indicators and LCA were combined to define the system boundary and quantify the environmental pressure of eucalyptus-based Kraft pulp industry. Next, the model, used to quantify the potential environmental impact and evaluate the reduction option, was developed based on LCA, MCA and cost effectiveness approaches. Finally, scenario analysis appeared a powerful tool to analyze the possible future consequences of different strategies to reduce the potential environmental impact of the eucalyptus-based Kraft pulp industry in Thailand.
Novel aspects of this study not only include a better understanding of eucalyptus-
based Kraft pulp production in Thailand, but also an improved insight in the usefulness of systems analysis tools for evaluating environmental policies in Thailand. The application of environmental systems analysis is based on a unique combination of tools applied to a case in Thailand. This contributes to the further development of environmental systems analysis and increase the understanding to the applicability of environmental systems analysis tools.
197
Samenvatting Doel van het onderzoek De pulp industrie in Thailand is van economisch en maatschappelijk belang, vanwege de productiewaarde, de omzet geassocieerd met export, en de werkgelegenheid in de sector. Een groot deel van de pulp productie in Thailand betreft Kraft pulp, geproduceerd van eucalyptus hout. De vraag naar Kraft pulp is toegenomen als gevolg van een groeiende verwerkende industrie, een stijgende levenstandaard en nieuwe export mogelijkheden. Deze industrie draagt echter tevens bij aan een aantal milieuproblemen, die een geïntegreerde analyse vereisen. Het uiteindelijke doel van deze studie is om de milieubelasting van de productie van Kraft pulp uit eucalyptus hout in Thailand te analyseren, om opties te identificeren om deze milieubelasting te reduceren en om de kosteneffectiviteit van deze opties te evalueren. Tevens worden mogelijke toekomstige trends (2000-2020) in de milieueffecten van deze industrie geanalyseerd, rekening houdend met de technische en economische implicaties van combinaties van reductieopties. De studie concentreert zich zowel op de totale milieueffecten, als op zes specifieke milieuproblemen: klimaatverandering, verzuring, eutrofiëring, smog, toxiciteit voor mensen en de productie van afval. Milieusysteemanalyse (MSA) is een belangrijk tool in deze studie om de drie onderzoeksvragen te beantwoorden.
Huidige milieubelasting van de productie van Kraft pulp uit eucalyptus hout in Thailand
De eerste onderzoeksvraag betreft het vaststellen van de huidige milieubelasting door productie van Kraft pulp uit eucalyptus hout in Thailand. Hiertoe zijn de eerste en tweede stap van de milieusysteemanalyse uitgevoerd. Deze stappen betreffen het definiëren van het probleem en het systeem. Een heldere definitie van het systeem wordt gegeven door het definiëren van de input, de output en de interne relaties in het systeem. De analyse maakt duidelijk welke input, output en processen in beschouwing genomen dienen te worden en welke buiten beschouwing gelaten kunnen worden. We onderscheiden twee subsystemen binnen de Kraft pulp industrie: eucalyptusteelt en Kraft pulp productie. Milieu-indicatoren en een gedeeltelijke levenscyclusanalyse zijn de analytische tools die in deze analyse zijn gebruikt. De resultaten tonen aan dat de milieubelasting door Kraft pulp productie groter is dan die van de eucalyptusteelt. Van de verschillende activiteiten die de milieubelasting veroorzaken leveren de recuperatieketels de belangrijkste bijdrage aan klimaatverandering en verzuring, omdat dit proces de bron is van ruim 50% van de emissies van broeikasgassen en verzurende stoffen. Biomassaverbranding draagt ongeveer 80% bij aan de emissies van stoffen die aanleiding geven tot de vorming van troposferisch ozon en stoffen die toxisch zijn voor mensen. Bijna driekwart van de eutrofiërende stoffen is afkomstig van afvalwaterzuivering. Het is niet noodzakelijk om alle emissies in beschouwing te nemen in een analyse van opties om de milieubelasting te reduceren. Wij hebben voor elk van de milieuthema´s de emissies geïdentificeerd, die tenminste 85% van de milieubelasting veroorzaken. Deze
198
emissies zijn: CH4, N2O, NOx, CO, VOC en stofdeeltjes van biomassaverbranding, CO2 en SO2 van het verbruik van bunkerolie in de kalkovens, AOX, COD en TRS uit pulp productie, P uit afvalwaterzuivering, en N2O en PO4
3- van bemesting in de eucalyptusteelt.
Het modelleren van opties om de milieubelasting te verminderen
De tweede onderzoeksvraag betreft het identificeren van opties om de milieubelasting van de productie van Kraft pulp uit eucalyptus hout in Thailand te verminderen en het analyseren van de technisch haalbare reductie door deze opties en de daarmee gemoeide kosten. Om deze onderzoeksvraag te beantwoorden zijn de derde en vierde stap van de milieusysteemanalyse uitgevoerd. Deze stappen betreffen een synthese (modelbouw) en analyse van het systeem (modelverkenning). Een geïntegreerd milieumodel is ontwikkeld, op basis van een gedeeltelijke levenscyclusanalyse, gecombineerd met een multicriteria analyse (MCA) en een kosteneffectiviteitanalyse. We hebben een model ontwikkeld dat de emissies kwantificeert van de Kraft pulp industrie in Thailand en de potentiële effecten daarvan op het milieu. Het model beschrijft de bronnen en emissies die een belangrijke bijdrage leveren aan de potentiële milieueffecten zoals vastgesteld in de eerste fase van deze studie. De potentiële milieueffecten van emissies zijn berekend op basis van de totale hoeveelheid emissie per tijdseenheid (jaar) en classificatiefactoren van de stoffen die hun relatieve aandeel in specifieke problemen weergeeft. Het model kan gebruikt worden om de effecten van reductieopties op het milieu te evalueren en de kosten daarvan. Het model bevat opties voor het reduceren van de milieueffecten, en houdt rekening met neveneffecten van reductieopties op milieuproblemen. Zesendertig reductieopties zijn geïdentificeerd, en gegroepeerd in veertien onafhankelijke groepen. De reductieopties kunnen de niveaus van de activiteiten en/of de emissiefactoren beïnvloeden. Potentiële reducties zijn vastgesteld in vergelijking met de situatie waarin geen van de opties is toegepast (referentiesituatie). Daarnaast kan het model gebruikt worden voor het evalueren van de totale milieu-impact, op basis van een multicriteria analyse (MCA) waarin een evaluatie is gebaseerd op verschillende criteria. Wegingsfactoren voor de verschillende milieuproblemen zijn bepaald op basis van een Analytical Hierachy Process (AHP), waarbij gewichten bepaald worden voor geselecteerde criteria op basis van een serie paarsgewijze vergelijkingen. Het model is op een aantal manieren verkend. Eerst zijn de modelresultaten vergeleken met Thaise studies, en hieruit bleek dat het model adequaat is voor het analyseren van de milieueffecten van de Kraft pulp industrie in Thailand. Voorts is de referentie casus geanalyseerd, waarin we veronderstellen dat geen van de opties om de milieueffecten van de Kraft pulp industrie te reduceren zijn toegepast. Verzuring en eutrofiëring bleken de grootste milieuproblemen die worden veroorzaakt door de Kraft pulp industrie in Thailand; ze dragen beide eenderde bij aan de totale milieubelasting. Kalkovens, recuperatieketels en het bleken van de pulp zijn de belangrijkste subsystemen die bijdragen aan de totale milieubelasting. Tot slot is de effectiviteit en kosteneffectiviteit van de reductieopties om de milieubelasting te reduceren geanalyseerd. We constateren dat de opties om emissies van eutrofiërende en verzurende stoffen terug te dringen het meest effectief zijn. Het betreft opties uit de volgende groepen: afvalwaterzuivering, afvalwater reductie, alternatieve technieken voor het ontsluiten van vezels, alternatieve technieken voor het bleken van pulp, zwaveldioxidereductie, en geurbestrijding. De meest kosteneffectieve opties
199
betreffen meer structurele veranderingen, zoals verbeterde pulpwassers, een verhoging van het droge stof gehalte van zwarte loog en preventie van verspilling. Deze zijn meer kosteneffectief dan de typische end-of-pipe technologie, zoals biologische afvalwaterzuivering en scrubbers. Een aantal opties bleek winstgevend, hetgeen betekent dat de jaarlijkse besparingen door het verlagen van activiteitenniveaus en/of emissies groter zijn dan de jaarlijkse kosten. Dit betreft de volgende opties: het toedienen van optimale dosis meststoffen, langduriger verwijdering van lignine, lignineverwijdering met behulp van enzymen, verbeterde wassers, zonneboilers en met zuurstof verrijkte kalkovens. De resultaten van de analyse van de referentie casus kunnen beleidsmakers helpen bij het prioriteren van milieumaatregelen. Daarnaast kunnen de analyses van de effectiviteit en de kosteneffectiviteit van individuele reductieopties helpen bij het kiezen van reductieopties die passen bij preferente milieustrategieën. Verschillende strategieën zullen zo aanleiding geven tot verschillende combinaties van opties. Het model kan gebruikt worden om de milieuconsequenties en de kosten van dergelijke combinaties van opties te analyseren. Het model is in deze zin zeer relevant voor beleidsmakers.
Scenario analyse
De laatste onderzoeksvraag betreft het onderzoeken van mogelijke toekomstige trends in de belasting van het milieu door productie van Kraft pulp uit eucalyptus hout in Thailand. Mogelijke veranderingen in de milieuperformance van de Kraft pulp industrie in Thailand zijn geanalyseerd voor een periode van twintig jaar (2000/2020) door middel van scenario analyse.
Zeven scenario’s zijn ontwikkeld en geanalyseerd: een No Option scenario (NOP), Business-as-Usual scenario (BAU) en vijf verschillende Environmental Policy scenario´s (ENP). Deze laatste vijf reflecteren verschillende strategieën om de milieubelasting te reduceren. De scenario’s zijn geanalyseerd met betrekking tot hun effectiviteit in het verminderen van de milieubelasting en de daarmee gemoeide kosten. Voor elk scenario is de totale milieubelasting berekend en zijn emissies gekwantificeerd voor de stoffen die bijdragen aan de volgende zes milieuproblemen klimaatverandering, verzuring, eutrofiëring, smog, toxiciteit voor mensen en de productie van afval.
Uit de resultaten blijkt dat zonder de thans geïmplementeerde reductieopties, de milieubelasting tweemaal zo hoog zou zijn als momenteel het geval is. In het BAU scenario, waarin wordt verondersteld dat geen additionele reductieopties worden geïmplementeerd, verdubbelt de totale berekende milieubelasting tussen 20000 en 2020. De vijf Environmental Policy scenario’s (ENP) zijn gebaseerd op verschillende strategieën om de milieubelasting te verminderen. Uit de resultaten voor het ENP-M (theoretical maximum potential) scenario blijkt dat het theoretisch mogelijk is om de totale milieubelasting met bijna 50% te verminderen ten opzichte van het BAU niveau in 2020. Dit lijkt echter niet haalbaar vanwege de hoge kosten. In het ENP-I (intermediate) scenario wordt hoge prioriteit gegeven aan kosteneffectiviteit en is de berekende milieubelasting 26% lager dan in het BAU scenario, tegen bijna 25% lagere kosten. Dit maakt het ENP-I scenario het goedkoopste van de zeven bestudeerde scenario’s. De overige ENP scenario´s reflecteren beleidspreferenties voor het oplossen van milieuproblemen op mondiale (ENP-G), regionale (ENP-R) of locale (ENP-L) schaal. De resultaten voor
200
deze scenario’s tonen aan dat 24-37% reductie in de totale milieubelasting ten opzichte van het BAU scenario gerealiseerd kan worden. Er zijn dus verschillende strategieën denkbaar die kunnen resulteren in eenderde reductie in de totale milieubelasting ten opzichte van het BAU scenario. De implementatiekosten van de opties verschillen per echter scenario (kosten van ENP-L > ENP-R > ENP-G).
Procedure voor milieusysteemanalyse
Milieusysteemanalyse (MSA) bleek een bruikbare procedure voor het analyseren van de milieubelasting het identificeren van opties op deze belasting te reduceren en het evalueren van de kosteneffectiviteit van die opties voor de productie van Kraft pulp uit eucalyptus hout in Thailand. De MSA bestond uit zes stappen: 1) het definiëren van het probleem, 2) het definiëren van het systeem, 3) synthese van het systeem, 4) analyse van het systeem, 5) scenario analyse en 6) presentatie van de resultaten en implicaties voor beleid. We hebben geleerd dat deze stapsgewijze benadering niet noodzakelijkerwijs lineair is. Iteraties bleken noodzakelijk om de doelen van de studie te realiseren.
Milieu-indicatoren, levenscyclusanalyse (LCA), multicriteria analyse (MCA), kosteneffectiviteitanalyse en scenario analyse bleken essentiële tools voor de analyse. Eerst zijn milieu-indicatoren en LCA gecombineerd om de systeemgrenzen te kunnen vaststellen en de milieubelasting van Kraft pulp productie te kwantificeren. Vervolgens is het model ontwikkeld dat gebruikt is voor het kwantificeren van de potentiële milieueffecten en het evalueren van de reductieopties. Dit model is gebaseerd op LCA, MCA en kosteneffectiviteitanalyse. Tot slot bleek scenario analyse een krachtige methode voor het analyseren van mogelijke toekomstige consequenties van verschillende strategieën om de potentiële milieueffecten van de productie van Kraft pulp uit eucalyptus hout in Thailand te reduceren.
Het vernieuwende van deze studie is niet alleen een beter begrip van de productie van Kraft pulp uit eucalyptus hout in Thailand, maar ook een verbeterd inzicht in de bruikbaarheid van systeemanalytische tools voor de evaluatie van het milieubeleid in Thailand. De toepassing van milieusysteemanalyse is gebaseerd op een unieke combinatie van tools, toegepast op een casus in Thailand. Hiermee draagt dit onderzoek bij aan de verdere ontwikkeling van de milieusysteemanalyse en een beter begrip van de toepasbaarheid van milieusysteemanalytsche tools.
201
Curriculum Vitae Warit Jawjit was born on February 6, 1974 in Chiang Mai, Thailand. He completed high school at Panabhandhu Viddhaya, Bangkok. In 1991, he started a bachelor program in agricultural chemistry at Kasetsart University, Bangkok. During his study, he was elected as president of agricultural chemistry students in 1993, and qualified as an exchange student for training at Tokyo University of Agriculture, Japan in 1994. He received the bachelor’s degree in 1995. He then continued a master program in environmental science (specialized in wastewater treatment), and received the MSc degree in 1998 also from Kasetsart University. Warit started his Ph.D. study in November, 2002 at Environmental Systems Analysis group, Wageningen University, The Netherlands. His study was funded by AGITS (Agro-Industrial Transformation Towards Sustainability; Southeast and East Asia in Global Perspective) project, which is a collaboration between Wageningen University and National Research Center for Environmental and Hazardous Waste Management (NRC-EHWM), Chulalongkorn University, Thailand. Warit has been working as a lecturer at Faculty of Science and Technology, Rajamangala University of Technology Srivijaya since 1999. His fields of interest are integrated environmental assessment, environmental modeling, cleaner technologies, and wastewater treatment technology. He lives with his wife, Siriuma Jawjit- Walailak University’s lecturer, and his daughter, Jitrtiwa Jawjit at Nakhon Si Thammarat in the south of Thailand. Contact: Warit Jawjit Faculty of Science and Technology Rajamangala University of Technology Srivijaya Nakhon Si Thammarat Campus (Saiyai) Tum yai, Thung song District Nakhon Si Thammarat, 80110 THAILAND Tel: +66-81-9791125 e-mail: [email protected]

202
203

204


