JOURNAL OF AEROSOL MEDICINE Volume 14, Number 1, 2001 Mary Ann Liebert, Inc. Pp. 31–42 The Equivalence of Compressor Pressure-Flow Relationships with Respect to Jet Nebulizer Aerosolization Characteristics THOMAS A. STANDAERT, Ph.D., 1 S. ELWOOD BOHN, Ph.D., 2 MOIRA L. AITKEN, M.D., 3 and BONNIE RAMSEY, M.D. 1 ABSTRACT Manufacturers of aerosolized medications, approved by the Food and Drug Administration, specify the nebulizer(s) and compressor to be used with their product, in an attempt to achieve efficacy comparable to that obtained in the clinical trials. The need to limit the compressor to that used in the trials has not been investigated in detail. We suggest a technique to de- termine the equivalency of different compressors such that a chosen nebulizer’s performance is not significantly altered. Aerosol particle size (MMD) was measured with a laser; com- pressor flow and pressure were measured with a mass flow meter and pressure gauge, re- spectively. For all models of nebulizer, increased flow or driving pressure caused a decrease in aerosol MMD. The flow resistance of nebulizer models varied, and the flow output of com- pressors decreased as imposed nebulizer resistance increased. However, for any specific com- pressor-nebulizer combination there is a unique flow and pressure, and the nebulizer gener- ates a given MMD. We demonstrate methods to choose alternate compressors that may be used to drive a nebulizer and yet keep the nebulizer’s MMD and performance within pre- determined limits. Once an acceptable range of variance in a nebulizer’s MMD is defined, al- ternate compressors may be safely chosen. We recommend that these techniques be used by manufacturers of medications and of compressors to safely determine the acceptability of sev- eral rather than a single model compressor to drive a chosen nebulizer. The techniques as- sure consistency of the nebulizer’s clinically demonstrated performance characteristics. Key words: compressor, nebulizer, pressure, backpressure, flow rate, resistance, aerosol, per- formance, equivalence 31 INTRODUCTION T HE MANUFACTURERS of aerosolized medica- tions, approved by the Food and Drug Ad- ministration, specify the nebulizer and compres- sor model(s) to be used with their product. The specified devices are those used in the clinical tri- als, and help ensure a uniform administered dose, 1 Department of Pediatrics, Cystic Fibrosis Research Center, Children’s Hospital and Medical Center, Seattle, Wash- ington. 2 Department of Mathematics, Miami University, Oxford, Ohio. 3 Department of Medicine, Cystic Fibrosis Research Center, University of Washington, Seattle, Washington. Supported in part by the Research and Development Program of the Cystic Fibrosis Foundation, #R565.
Transcript
JOURNAL OF AEROSOL MEDICINEVolume 14, Number 1, 2001Mary Ann Liebert, Inc.Pp. 31–42
The Equivalence of Compressor Pressure-FlowRelationships with Respect to Jet Nebulizer
Aerosolization Characteristics
THOMAS A. STANDAERT, Ph.D.,1 S. ELWOOD BOHN, Ph.D.,2 MOIRA L. AITKEN, M.D.,3
and BONNIE RAMSEY, M.D.1
ABSTRACT
Manufacturers of aerosolized medications, approved by the Food and Drug Administration,specify the nebulizer(s) and compressor to be used with their product, in an attempt to achieveefficacy comparable to that obtained in the clinical trials. The need to limit the compressorto that used in the trials has not been investigated in detail. We suggest a technique to de-termine the equivalency of different compressors such that a chosen nebulizer’s performanceis not significantly altered. Aerosol particle size (MMD) was measured with a laser; com-pressor flow and pressure were measured with a mass flow meter and pressure gauge, re-spectively. For all models of nebulizer, increased flow or driving pressure caused a decreasein aerosol MMD. The flow resistance of nebulizer models varied, and the flow output of com-pressors decreased as imposed nebulizer resistance increased. However, for any specific com-pressor-nebulizer combination there is a unique flow and pressure, and the nebulizer gener-ates a given MMD. We demonstrate methods to choose alternate compressors that may beused to drive a nebulizer and yet keep the nebulizer’s MMD and performance within pre-determined limits. Once an acceptable range of variance in a nebulizer’s MMD is defined, al-ternate compressors may be safely chosen. We recommend that these techniques be used bymanufacturers of medications and of compressors to safely determine the acceptability of sev-eral rather than a single model compressor to drive a chosen nebulizer. The techniques as-sure consistency of the nebulizer’s clinically demonstrated performance characteristics.
THE MANUFACTURERS of aerosolized medica-tions, approved by the Food and Drug Ad-
ministration, specify the nebulizer and compres-sor model(s) to be used with their product. Thespecified devices are those used in the clinical tri-als, and help ensure a uniform administered dose,
1Department of Pediatrics, Cystic Fibrosis Research Center, Children’s Hospital and Medical Center, Seattle, Wash-ington.
2Department of Mathematics, Miami University, Oxford, Ohio.3Department of Medicine, Cystic Fibrosis Research Center, University of Washington, Seattle, Washington.Supported in part by the Research and Development Program of the Cystic Fibrosis Foundation, #R565.
a uniform site of airway deposition, and there-fore a clinical efficacy similar to that obtained inthe clinical trials.
The compressor recommended to drive thenebulizer is limited to that used in the clinicaltrial(s), as nebulizer flow is important to a nebu-lizer’s performance. A higher gas flow will in-crease the rate of output and decrease the nebu-lization time.(1–9) More importantly, a higher flowwill decrease the particle size of the aerosol, in-creasing the respirable dose, and theoretically de-positing deeper within the lung.(1–4,10–14)
There is a wide selection of compressors avail-able for the delivery of aerosolized medications.Some are large, robust, and powerful while oth-ers are “portable” (or battery operated) models;the latter may be less effective in delivering med-ication within the respirable range. Though theeffects of different compressors or gas flows on anebulizers performance have been previouslydemonstrated,(1–7,10,15–19) a clear understandingof, or a systematic approach toward the equiva-lence of compressor performance has not beenpreviously examined.
Despite advances in the field of aerosol deliv-ery with ultrasonic nebulizers, metered dose in-halers, dry powder inhalers, and so forth, weforesee an increase in the number of nebulizedmedications over the next decade,(10,20–24) eachspecified with a unique compressor-nebulizercombination. We are concerned that despite theclear recommendations, patients and hospitals donot always adhere to the suggestions, usually dueto convenience, educational, or financial consid-erations. Patients are not likely to purchase anduse several expensive compressors for their spec-trum of daily or weekly medications, and we sug-gest methods to determine rationally acceptablealternative compressors. If standardized in the in-dustry, this approach should assist regulatoryagencies, device manufacturers, and manufactur-ers of aerosolized medications in specifying agroup of compressors to be used with their med-ication, rather than limiting the recommendationto the model(s) used in the clinical trials. The datashould reduce the chances of random or inap-propriate compressor selection; choosing anequivalent or a different nebulizer from that orig-inally recommended for a particular medicationis not suggested or addressed in this study.
Specifically, we demonstrate (1) the effect ofgas flow and driving pressure on a nebulizer’smass median diameter (MMD); (2) that there is a
unique pressure-flow pair for each nebulizer-compressor combination; and (3) techniques todetermine the equivalence of compressors withrespect to either their effect on a nebulizer’saerosolization characteristics (e.g., MMD) or ontheir statistical equivalence of pressure-flow per-formance under load.
MATERIALS AND METHODS
Pressure and flow measurements
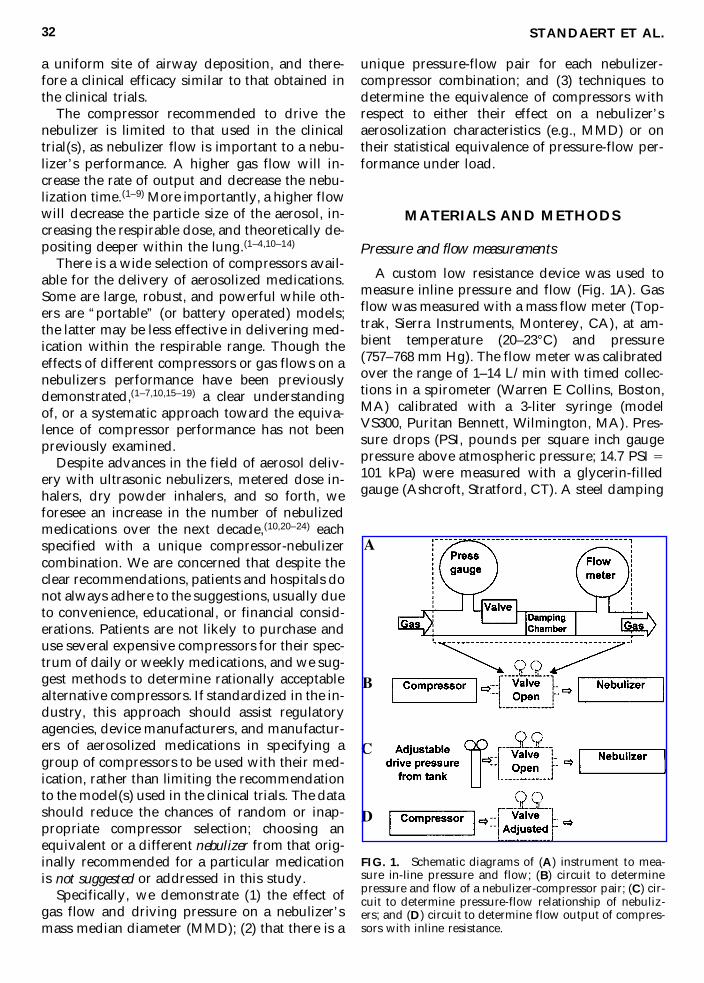
A custom low resistance device was used tomeasure inline pressure and flow (Fig. 1A). Gasflow was measured with a mass flow meter (Top-trak, Sierra Instruments, Monterey, CA), at am-bient temperature (20–23°C) and pressure(757–768 mm Hg). The flow meter was calibratedover the range of 1–14 L/min with timed collec-tions in a spirometer (Warren E Collins, Boston,MA) calibrated with a 3-liter syringe (modelVS300, Puritan Bennett, Wilmington, MA). Pres-sure drops (PSI, pounds per square inch gaugepressure above atmospheric pressure; 14.7 PSI 5101 kPa) were measured with a glycerin-filledgauge (Ashcroft, Stratford, CT). A steel damping
STANDAERT ET AL.32
FIG. 1. Schematic diagrams of (A) instrument to mea-sure in-line pressure and flow; (B) circuit to determinepressure and flow of a nebulizer-compressor pair; (C) cir-cuit to determine pressure-flow relationship of nebuliz-ers; and (D) circuit to determine flow output of compres-sors with inline resistance.
chamber (98 mL) prior to the flowmeter reducedcompressor-induced oscillations in gas flow,which cause the mass flow meter to read erro-neously high. An adjustable resistance (10-turnneedle valve) was used to increase the inline re-sistance. The pressure-flow device presented aflow resistance of about 1 PSI at 20 L/min (andwas measured as 4.5 cm H2O/L/min over therange of 5–15 L/min).
The circuit in Fig. 1B was used to measure thepressure and flow output of a compressor, witha specified nebulizer (and its tubing set). The cir-cuit in Fig. 1C was used to generate a pressure-flow relationship for a nebulizer (and tubing set);a regulator on a compressed air tank was used toadjust the driving pressure. To measure a com-pressor’s gas flow output over a range of imposedresistances, the circuit in Fig. 1D was used. Theflow was measured at increments of the resis-tance, noted as an increase in the backpressure onthe gauge.
Aerosol particle size measurements
The aerosol mass median diameter (MMD) wasobtained with a laser diffraction particle size an-alyzer (Mastersizer X, Malvern, Southborough,MA), using 0.9% saline.(15)
Nebulizers and compressors tested
Table 1 presents the devices tested. Several dif-ferent compressors were evaluated to illustratethe principals involved and the range of perfor-mance differences that may be expected. A vari-ety of commonly used nebulizers were tested toillustrate the range of resistances that may befound.
Initial measures on four to six samples indi-cated excellent agreement between samples (seeSD bars on figures), and thereafter a minimum oftwo samples of each nebulizer model were eval-uated for pressure-flow relationships in this sur-vey; likewise a minimum of two samples of eachcompressor model were evaluated, except for theDeVilbiss PulmoMate and MedicAid PortaNeb(n 5 1 each, run in triplicate). The nebulizer’spressure-flow relationship is independent of thepresence of a solute within the device, but theywere filled with 4 mL of 0.9% saline.
Curve fit and equations
Linear or polynomial regression curves werefit to data sets and equations obtained using theplotting routines of Excel 97 (Microsoft, Red-mond, WA). The correlation coefficient (r2) for all
EQUIVALENCE OF COMPRESSORS FOR JET NEBULIZERS 33
TABLE 1. NEBULIZERS AND COMPRESSORS EVALUATED
Samples
NebulizersAcorn II Marquest Medical Products, Englewood, CO 7LC Plus Pari, Richmond, VA 11LC Star Pari, Richmond, VA 6PermNeb DeVilbiss, Somerset PA 3Raindrop Nellcor Puritan Bennett, Oxfordshire, UK 3Sidestream MedicAid, West Sussex, UK 6T Updraft II Hudson RCI, Temecula, CA 8Ultravent Malinkrodt Medical, St. Louis, MO 2
CompressorsUS Market
Master Pari, Richmond, VA 3ProNeb Turbo Pari, Richmond, VA 2ProNeb Pari, Richmond, VA 3PulmoAide DeVilbiss, Somerset PA 3PulmoMate DeVilbiss, Somerset PA 1
European MarketHercules Aiolos, Karlstad, Sweden 2CR60 MedicAid, West Sussex, UK 2CR50 MedicAid, West Sussex, UK 2PortaNeb MedicAid, West Sussex, UK 1Master Pari, Richmond, VA 2Boy Pari, Richmond, VA 223ST SystAm, Villeneuve/lot, France 226ST SystAm, Villeneuve/lot, France 2
curves ranged from 0.97 to 1.0, with an averageof 0.99.
RESULTS
Effect of pressure and flow on a nebulizer’s MMD
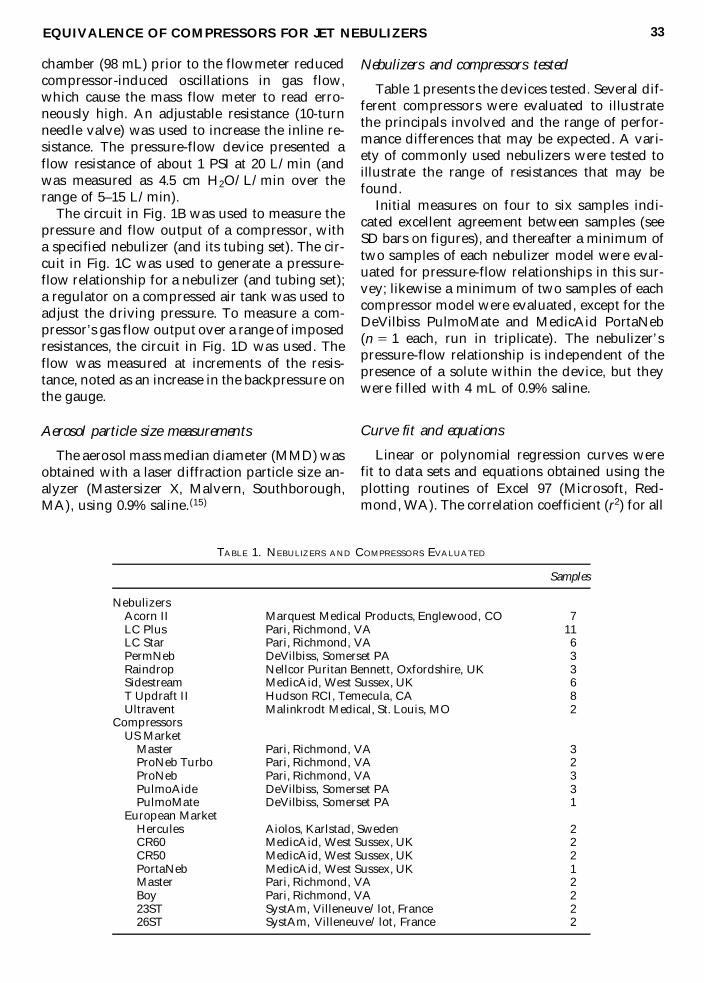
The MMD of a nebulizer’s aerosol is dictatedby the design (e.g., Pari LC Star vs. LC Plus), butthe MMD of all nebulizers decreases with an in-crease in the driving pressure or gas flow, as de-picted in Figs. 2A and 2B, respectively. A flat orshallow portion of the slope indicates less sensi-tivity to alterations in pressure or flow (Fig. 2B;MedicAid Sidestream or Pari LC Star above 4L/min). The equations for these curves and foradditional nebulizers are presented in Tables 2Aand 2B.
The flow resistance of nebulizers
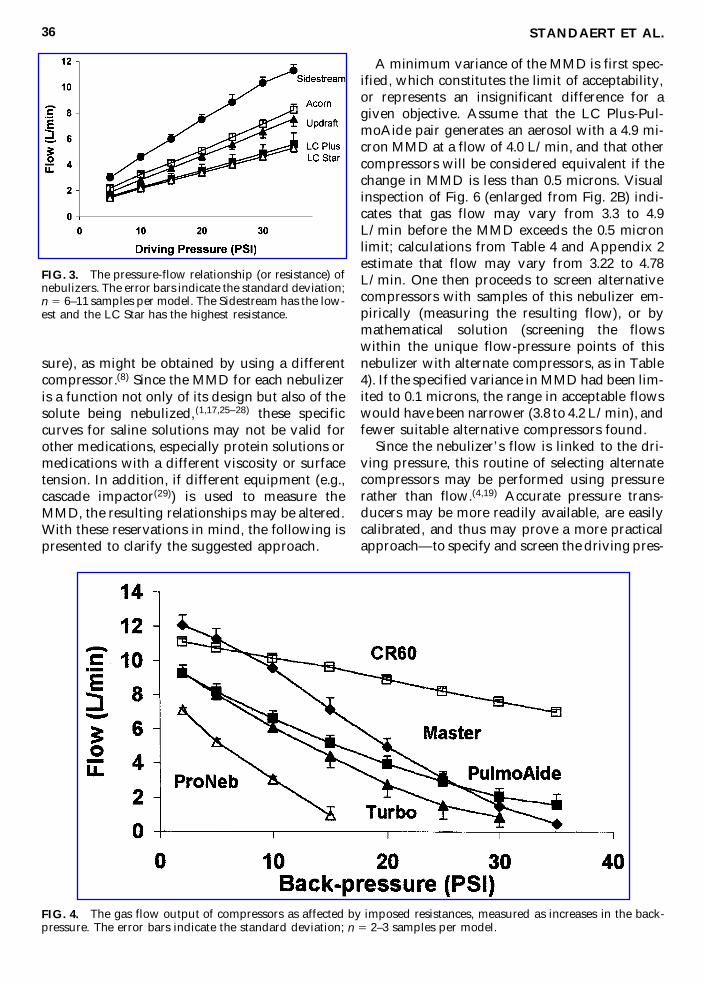
The pressure-flow relationships of five modelsof nebulizers are depicted in Fig. 3. Each nebu-lizer’s resistance (1/slope) is linear over thisrange of pressures; the LC Star has the highestand the Sidestream the lowest resistance to flow.The equations for these and additional nebuliz-ers are presented in Table 2C.
The flow output of compressors
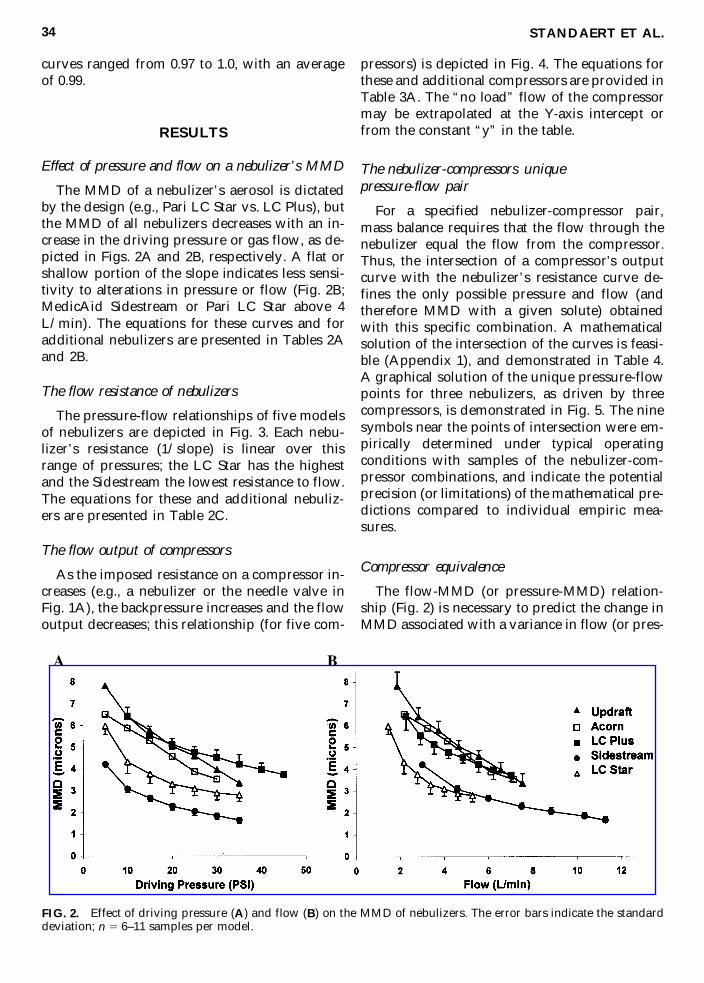
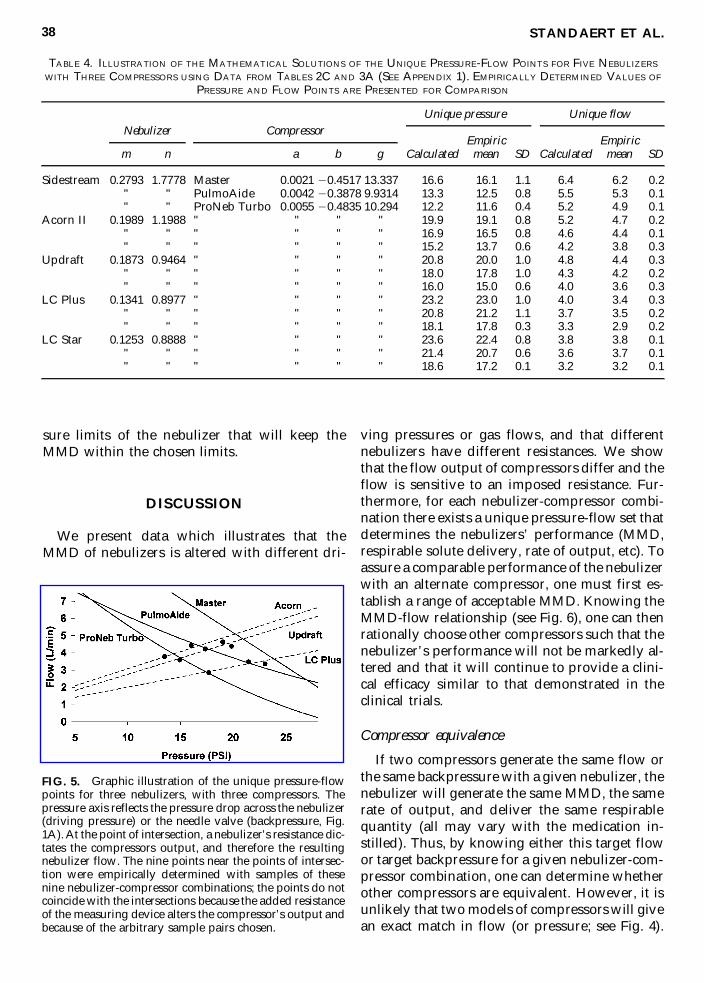
As the imposed resistance on a compressor in-creases (e.g., a nebulizer or the needle valve inFig. 1A), the backpressure increases and the flowoutput decreases; this relationship (for five com-
pressors) is depicted in Fig. 4. The equations forthese and additional compressors are provided inTable 3A. The “no load” flow of the compressormay be extrapolated at the Y-axis intercept orfrom the constant “y” in the table.
The nebulizer-compressors unique pressure-flow pair
For a specified nebulizer-compressor pair,mass balance requires that the flow through thenebulizer equal the flow from the compressor.Thus, the intersection of a compressor’s outputcurve with the nebulizer’s resistance curve de-fines the only possible pressure and flow (andtherefore MMD with a given solute) obtainedwith this specific combination. A mathematicalsolution of the intersection of the curves is feasi-ble (Appendix 1), and demonstrated in Table 4.A graphical solution of the unique pressure-flowpoints for three nebulizers, as driven by threecompressors, is demonstrated in Fig. 5. The ninesymbols near the points of intersection were em-pirically determined under typical operatingconditions with samples of the nebulizer-com-pressor combinations, and indicate the potentialprecision (or limitations) of the mathematical pre-dictions compared to individual empiric mea-sures.
Compressor equivalence
The flow-MMD (or pressure-MMD) relation-ship (Fig. 2) is necessary to predict the change inMMD associated with a variance in flow (or pres-
STANDAERT ET AL.34
FIG. 2. Effect of driving pressure (A) and flow (B) on the MMD of nebulizers. The error bars indicate the standarddeviation; n 5 6–11 samples per model.
sure), as might be obtained by using a differentcompressor.(8) Since the MMD for each nebulizeris a function not only of its design but also of thesolute being nebulized,(1,17,25–28) these specificcurves for saline solutions may not be valid forother medications, especially protein solutions ormedications with a different viscosity or surfacetension. In addition, if different equipment (e.g.,cascade impactor(29)) is used to measure theMMD, the resulting relationships may be altered.With these reservations in mind, the following ispresented to clarify the suggested approach.
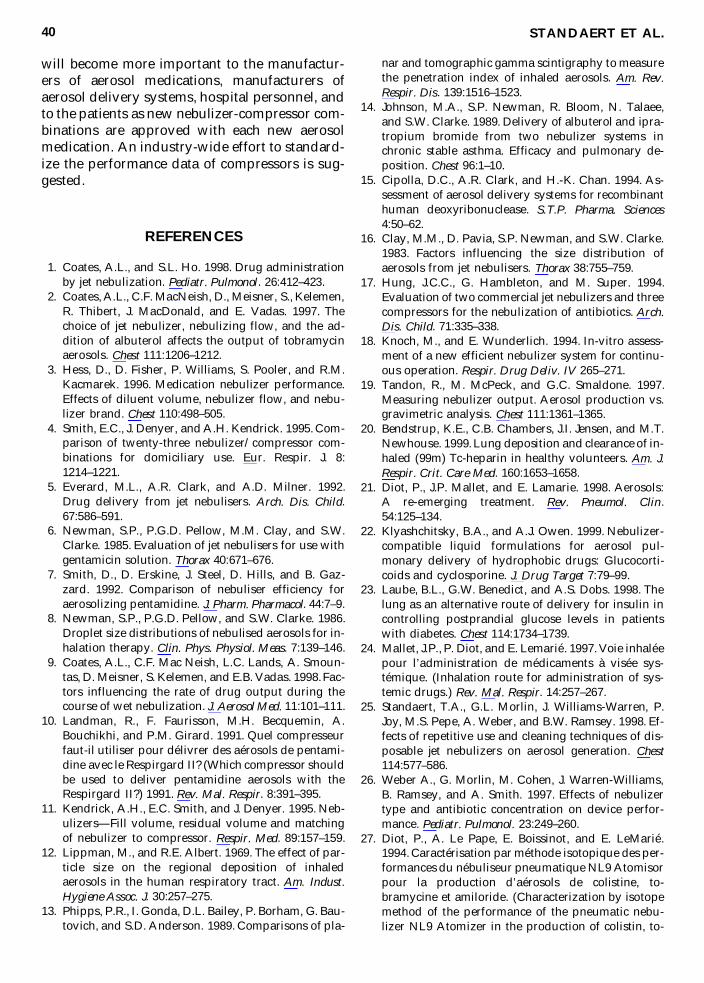
A minimum variance of the MMD is first spec-ified, which constitutes the limit of acceptability,or represents an insignificant difference for agiven objective. Assume that the LC Plus-Pul-moAide pair generates an aerosol with a 4.9 mi-cron MMD at a flow of 4.0 L/min, and that othercompressors will be considered equivalent if thechange in MMD is less than 0.5 microns. Visualinspection of Fig. 6 (enlarged from Fig. 2B) indi-cates that gas flow may vary from 3.3 to 4.9L/min before the MMD exceeds the 0.5 micronlimit; calculations from Table 4 and Appendix 2estimate that flow may vary from 3.22 to 4.78L/min. One then proceeds to screen alternativecompressors with samples of this nebulizer em-pirically (measuring the resulting flow), or bymathematical solution (screening the flowswithin the unique flow-pressure points of thisnebulizer with alternate compressors, as in Table4). If the specified variance in MMD had been lim-ited to 0.1 microns, the range in acceptable flowswould have been narrower (3.8 to 4.2 L/min), andfewer suitable alternative compressors found.
Since the nebulizer’s flow is linked to the dri-ving pressure, this routine of selecting alternatecompressors may be performed using pressurerather than flow.(4,19) Accurate pressure trans-ducers may be more readily available, are easilycalibrated, and thus may prove a more practicalapproach—to specify and screen the driving pres-
STANDAERT ET AL.36
FIG. 3. The pressure-flow relationship (or resistance) ofnebulizers. The error bars indicate the standard deviation;n 5 6–11 samples per model. The Sidestream has the low-est and the LC Star has the highest resistance.
FIG. 4. The gas flow output of compressors as affected by imposed resistances, measured as increases in the back-pressure. The error bars indicate the standard deviation; n 5 2–3 samples per model.
A.Equations of compressor output against resistive loads
B.Proposed format to evaluate compressor output equivalence
Flow (L/min)
5a(pressure)2
1b(pressure) 1
gNo load flow (L/min) and flow at three backpressures
Voltage
Hertz
ab
gBackpressure
015
2025
Com
mon
USA
Mod
els
Pari M
aster
312
060
0.00
2120.4517
13.337
Pari M
aster
13.3
7.0
5.1
3.4
Pari P
roNeb
Tur
bo2
120
600.00
5520.4835
10.294
Pari P
roNeb
Tur
bo10
.34.3
2.8
1.6
Pari P
roNeb
312
060
0.00
8820.6164
8.23
2Pari P
roNeb
8.2
1.0
(0)
(0)
DeV
ilbiss PulmoA
ide
312
060
0.00
4220.3878
9.93
1DeV
ilbiss Pu
lmoA
ide
9.9
5.1
3.9
2.9
DeV
ilbiss PulmoM
ate
112
060
0.00
3520.3100
9.11
1DeV
ilbiss Pu
lmoM
ate
9.1
5.2
4.3
3.5
Com
mon
Eur
opean Mod
els
Aiolos Hercu
les
2Sw
eden
240
500.00
0220.1063
15.423
Aiolos Hercu
les
15.4
13.9
13.4
12.9
Aiolos Hercu
les
224
060
20.00
3920.0369
17.618
Aiolos Hercu
les
17.6
16.2
15.3
14.3
Med
icAid CR60
2UK
240
5020.00
0120.1199
11.354
Med
icAid CR60
11.4
9.5
8.9
8.3
Med
icAid CR50
2UK
240
500.00
4120.4404
11.887
Med
icAid CR50
11.9
6.2
4.7
3.4
Med
icAid PortaNeb
1UK
120
600.00
7020.5897
12.853
Med
icAid PortaNeb
12.9
5.6
3.9
2.5
Pari M
aster
2German
y24
050
0.00
1620.3748
12.163
Pari M
aster
12.2
6.9
5.3
3.8
Pari M
aster
2German
y24
060
0.00
0420.3691
13.431
Pari M
aster
13.4
8.0
6.2
4.5
Pari B
oy2
German
y24
050
0.00
2320.2625
7.40
6Pari B
oy7.4
4.0
3.1
2.3
SystAm 23S
T2
Fran
ce24
050
0.00
2220.3116
7.21
2Sy
stAm 23S
T7.2
3.0
1.9
0.8
SystAm 26S
T2
Fran
ce24
050
0.00
1820.2976
8.12
9Sy
stAm 26S
T8.1
3.3
1.5
(0)
sure limits of the nebulizer that will keep theMMD within the chosen limits.
DISCUSSION
We present data which illustrates that theMMD of nebulizers is altered with different dri-
ving pressures or gas flows, and that differentnebulizers have different resistances. We showthat the flow output of compressors differ and theflow is sensitive to an imposed resistance. Fur-thermore, for each nebulizer-compressor combi-nation there exists a unique pressure-flow set thatdetermines the nebulizers’ performance (MMD,respirable solute delivery, rate of output, etc). Toassure a comparable performance of the nebulizerwith an alternate compressor, one must first es-tablish a range of acceptable MMD. Knowing theMMD-flow relationship (see Fig. 6), one can thenrationally choose other compressors such that thenebulizer’s performance will not be markedly al-tered and that it will continue to provide a clini-cal efficacy similar to that demonstrated in theclinical trials.
Compressor equivalence
If two compressors generate the same flow orthe same backpressure with a given nebulizer, thenebulizer will generate the same MMD, the samerate of output, and deliver the same respirablequantity (all may vary with the medication in-stilled). Thus, by knowing either this target flowor target backpressure for a given nebulizer-com-pressor combination, one can determine whetherother compressors are equivalent. However, it isunlikely that two models of compressors will givean exact match in flow (or pressure; see Fig. 4).
STANDAERT ET AL.38
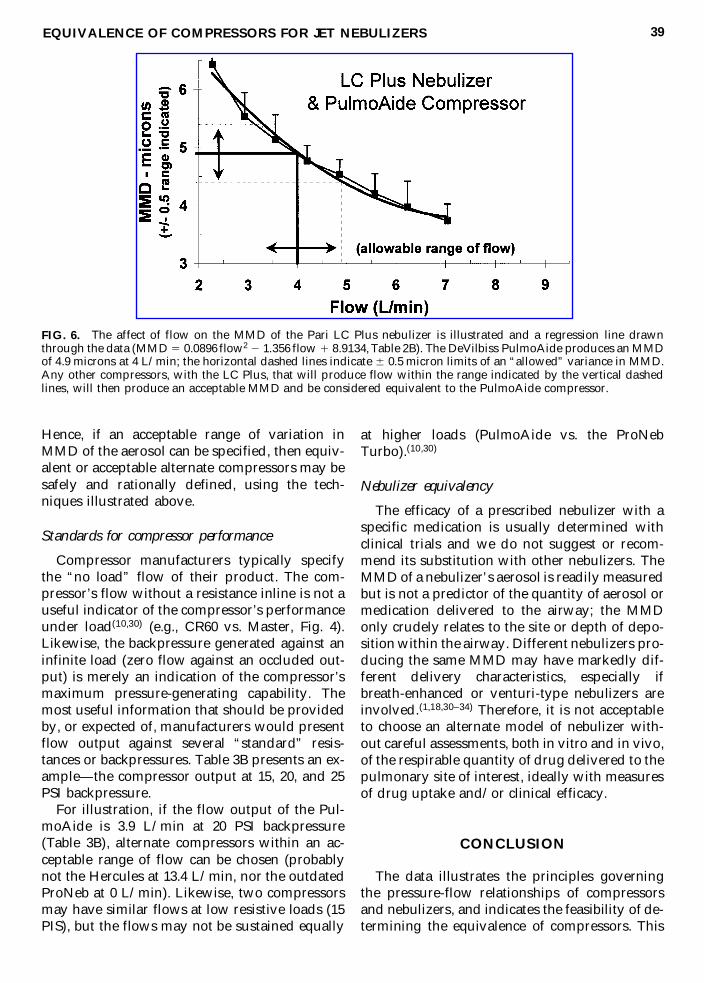
TABLE 4. ILLUSTRATION OF THE MATHEMATICAL SOLUTIONS OF THE UNIQUE PRESSURE-FLOW POINTS FOR FIVE NEBULIZERS
WITH THREE COMPRESSORS USING DATA FROM TABLES 2C AND 3A (SEE APPENDIX 1). EMPIRICALLY DETERMINED VALUES OF
PRESSURE AND FLOW POINTS ARE PRESENTED FOR COMPARISON
Unique pressure Unique flow
Empiric Empiricm n a b g Calculated mean SD Calculated mean SD
FIG. 5. Graphic illustration of the unique pressure-flowpoints for three nebulizers, with three compressors. Thepressure axis reflects the pressure drop across the nebulizer(driving pressure) or the needle valve (backpressure, Fig.1A). At the point of intersection, a nebulizer’s resistance dic-tates the compressors output, and therefore the resultingnebulizer flow. The nine points near the points of intersec-tion were empirically determined with samples of thesenine nebulizer-compressor combinations; the points do notcoincide with the intersections because the added resistanceof the measuring device alters the compressor’s output andbecause of the arbitrary sample pairs chosen.
Hence, if an acceptable range of variation inMMD of the aerosol can be specified, then equiv-alent or acceptable alternate compressors may besafely and rationally defined, using the tech-niques illustrated above.
Standards for compressor performance
Compressor manufacturers typically specifythe “no load” flow of their product. The com-pressor’s flow without a resistance inline is not auseful indicator of the compressor’s performanceunder load(10,30) (e.g., CR60 vs. Master, Fig. 4).Likewise, the backpressure generated against aninfinite load (zero flow against an occluded out-put) is merely an indication of the compressor’smaximum pressure-generating capability. Themost useful information that should be providedby, or expected of, manufacturers would presentflow output against several “standard” resis-tances or backpressures. Table 3B presents an ex-ample—the compressor output at 15, 20, and 25PSI backpressure.
For illustration, if the flow output of the Pul-moAide is 3.9 L/min at 20 PSI backpressure(Table 3B), alternate compressors within an ac-ceptable range of flow can be chosen (probablynot the Hercules at 13.4 L/min, nor the outdatedProNeb at 0 L/min). Likewise, two compressorsmay have similar flows at low resistive loads (15PIS), but the flows may not be sustained equally
at higher loads (PulmoAide vs. the ProNebTurbo).(10,30)
Nebulizer equivalency
The efficacy of a prescribed nebulizer with aspecific medication is usually determined withclinical trials and we do not suggest or recom-mend its substitution with other nebulizers. TheMMD of a nebulizer’s aerosol is readily measuredbut is not a predictor of the quantity of aerosol ormedication delivered to the airway; the MMDonly crudely relates to the site or depth of depo-sition within the airway. Different nebulizers pro-ducing the same MMD may have markedly dif-ferent delivery characteristics, especially ifbreath-enhanced or venturi-type nebulizers areinvolved.(1,18,30–34) Therefore, it is not acceptableto choose an alternate model of nebulizer with-out careful assessments, both in vitro and in vivo,of the respirable quantity of drug delivered to thepulmonary site of interest, ideally with measuresof drug uptake and/or clinical efficacy.
CONCLUSION
The data illustrates the principles governingthe pressure-flow relationships of compressorsand nebulizers, and indicates the feasibility of de-termining the equivalence of compressors. This
EQUIVALENCE OF COMPRESSORS FOR JET NEBULIZERS 39
FIG. 6. The affect of flow on the MMD of the Pari LC Plus nebulizer is illustrated and a regression line drawnthrough the data (MMD 5 0.0896 flow2 2 1.356 flow 1 8.9134, Table 2B). The DeVilbiss PulmoAide produces an MMDof 4.9 microns at 4 L/min; the horizontal dashed lines indicate 6 0.5 micron limits of an “allowed” variance in MMD.Any other compressors, with the LC Plus, that will produce flow within the range indicated by the vertical dashedlines, will then produce an acceptable MMD and be considered equivalent to the PulmoAide compressor.
will become more important to the manufactur-ers of aerosol medications, manufacturers ofaerosol delivery systems, hospital personnel, andto the patients as new nebulizer-compressor com-binations are approved with each new aerosolmedication. An industry-wide effort to standard-ize the performance data of compressors is sug-gested.
REFERENCES
1. Coates, A.L., and S.L. Ho. 1998. Drug administrationby jet nebulization. Pediatr. Pulmonol. 26:412–423.
2. Coates, A.L., C.F. MacNeish, D., Meisner, S., Kelemen,R. Thibert, J. MacDonald, and E. Vadas. 1997. Thechoice of jet nebulizer, nebulizing flow, and the ad-dition of albuterol affects the output of tobramycinaerosols. Chest 111:1206–1212.
3. Hess, D., D. Fisher, P. Williams, S. Pooler, and R.M.Kacmarek. 1996. Medication nebulizer performance.Effects of diluent volume, nebulizer flow, and nebu-lizer brand. Chest 110:498–505.
4. Smith, E.C., J. Denyer, and A.H. Kendrick. 1995. Com-parison of twenty-three nebulizer/compressor com-binations for domiciliary use. Eur. Respir. J. 8:1214–1221.
5. Everard, M.L., A.R. Clark, and A.D. Milner. 1992.Drug delivery from jet nebulisers. Arch. Dis. Child.67:586–591.
6. Newman, S.P., P.G.D. Pellow, M.M. Clay, and S.W.Clarke. 1985. Evaluation of jet nebulisers for use withgentamicin solution. Thorax 40:671–676.
7. Smith, D., D. Erskine, J. Steel, D. Hills, and B. Gaz-zard. 1992. Comparison of nebuliser efficiency foraerosolizing pentamidine. J. Pharm. Pharmacol. 44:7–9.
8. Newman, S.P., P.G.D. Pellow, and S.W. Clarke. 1986.Droplet size distributions of nebulised aerosols for in-halation therapy. Clin. Phys. Physiol. Meas. 7:139–146.
9. Coates, A.L., C.F. Mac Neish, L.C. Lands, A. Smoun-tas, D. Meisner, S. Kelemen, and E.B. Vadas. 1998. Fac-tors influencing the rate of drug output during thecourse of wet nebulization. J. Aerosol Med. 11:101–111.
10. Landman, R., F. Faurisson, M.H. Becquemin, A.Bouchikhi, and P.M. Girard. 1991. Quel compresseurfaut-il utiliser pour délivrer des aérosols de pentami-dine avec le Respirgard II? (Which compressor shouldbe used to deliver pentamidine aerosols with theRespirgard II?) 1991. Rev. Mal. Respir. 8:391–395.
11. Kendrick, A.H., E.C. Smith, and J. Denyer. 1995. Neb-ulizers—Fill volume, residual volume and matchingof nebulizer to compressor. Respir. Med. 89:157–159.
12. Lippman, M., and R.E. Albert. 1969. The effect of par-ticle size on the regional deposition of inhaledaerosols in the human respiratory tract. Am. Indust.Hygiene Assoc. J. 30:257–275.
13. Phipps, P.R., I. Gonda, D.L. Bailey, P. Borham, G. Bau-tovich, and S.D. Anderson. 1989. Comparisons of pla-
nar and tomographic gamma scintigraphy to measurethe penetration index of inhaled aerosols. Am. Rev.Respir. Dis. 139:1516–1523.
14. Johnson, M.A., S.P. Newman, R. Bloom, N. Talaee,and S.W. Clarke. 1989. Delivery of albuterol and ipra-tropium bromide from two nebulizer systems inchronic stable asthma. Efficacy and pulmonary de-position. Chest 96:1–10.
15. Cipolla, D.C., A.R. Clark, and H.-K. Chan. 1994. As-sessment of aerosol delivery systems for recombinanthuman deoxyribonuclease. S.T.P. Pharma. Sciences4:50–62.
16. Clay, M.M., D. Pavia, S.P. Newman, and S.W. Clarke.1983. Factors influencing the size distribution ofaerosols from jet nebulisers. Thorax 38:755–759.
17. Hung, J.C.C., G. Hambleton, and M. Super. 1994.Evaluation of two commercial jet nebulizers and threecompressors for the nebulization of antibiotics. Arch.Dis. Child. 71:335–338.
18. Knoch, M., and E. Wunderlich. 1994. In-vitro assess-ment of a new efficient nebulizer system for continu-ous operation. Respir. Drug Deliv. IV 265–271.
19. Tandon, R., M. McPeck, and G.C. Smaldone. 1997.Measuring nebulizer output. Aerosol production vs.gravimetric analysis. Chest 111:1361–1365.
20. Bendstrup, K.E., C.B. Chambers, J.I. Jensen, and M.T.Newhouse. 1999. Lung deposition and clearance of in-haled (99m) Tc-heparin in healthy volunteers. Am. J.Respir. Crit. Care Med. 160:1653–1658.
21. Diot, P., J.P. Mallet, and E. Lamarie. 1998. Aerosols:A re-emerging treatment. Rev. Pneumol. Clin.54:125–134.
22. Klyashchitsky, B.A., and A.J. Owen. 1999. Nebulizer-compatible liquid formulations for aerosol pul-monary delivery of hydrophobic drugs: Glucocorti-coids and cyclosporine. J. Drug Target 7:79–99.
23. Laube, B.L., G.W. Benedict, and A.S. Dobs. 1998. Thelung as an alternative route of delivery for insulin incontrolling postprandial glucose levels in patientswith diabetes. Chest 114:1734–1739.
24. Mallet, J.P., P. Diot, and E. Lemarié. 1997. Voie inhaléepour l’administration de médicaments à visée sys-témique. (Inhalation route for administration of sys-temic drugs.) Rev. Mal. Respir. 14:257–267.
25. Standaert, T.A., G.L. Morlin, J. Williams-Warren, P.Joy, M.S. Pepe, A. Weber, and B.W. Ramsey. 1998. Ef-fects of repetitive use and cleaning techniques of dis-posable jet nebulizers on aerosol generation. Chest114:577–586.
26. Weber A., G. Morlin, M. Cohen, J. Warren-Williams,B. Ramsey, and A. Smith. 1997. Effects of nebulizertype and antibiotic concentration on device perfor-mance. Pediatr. Pulmonol. 23:249–260.
27. Diot, P., A. Le Pape, E. Boissinot, and E. LeMarié.1994. Caractérisation par méthode isotopique des per-formances du nébuliseur pneumatique NL9 Atomisorpour la production d’aérosols de colistine, to-bramycine et amiloride. (Characterization by isotopemethod of the performance of the pneumatic nebu-lizer NL9 Atomizer in the production of colistin, to-
STANDAERT ET AL.40
bramycin, and amiloride aerosols.) Rev. Mal. Respir.11:573–578.
28. Orla, N., M McCallion, K.M.G. Taylor, M. Thomas,and A.J. Taylor. 1995. Nebulization of fluids of dif-ferent physiochemical properties with air-jet and ul-trasonic nebulizers. Pharm. Res. 12:1682–1688.
29. Stein, S.W., and B.A. Olson. 1997. Variability in sizedistribution measurements obtained using multipleAnderson Mark II cascade impactors. Pharm. Res.14:1718–1725.
30. Callaghan, C., and P.W. Barry. 1997. The science ofnebulised drug delivery. Thorax 52:S31–S44.
31. Shah P.L., S.F. Scott, D.M. Geddes, S. Conway, A.Watson, T. Nazir, S.B. Carr, C. Wallis, C. Marriott, andM.E. Hodson. 1997. An evaluation of two aerosol de-livery systems for rhDNase. Eur. Respir. J. 10:1261–1266.
32. Newnham D.M., and B.J. Lipworth. 1994. Nebuliserperformance, pharmacokinetics, airways and sys-temic effects of salbutamol given via a novel nebu-lizer delivery system (“Ventstream”). Thorax 49:762–770.
33. Coates, A.L., C.F. MacNeish, L.C. Lands, D. Meisner,S. Kelemen, and E.B. Vadas. 1998. A comparison ofthe availability of tobramycin for inhalation fromvented vs. unvented nebulizers. Chest 113:951–956.
34. Devadason, S.G., M.L. Everard, J.M. Linto, and P.N.LeSouef. 1997. Comparison of drug delivery fromconventional verses “Venturi” nebulizers. Eur. Respir.J. 10:2479–2483.
Article received on February 15, 2000 in final form, June 21, 2000
Reviewed by: Michael J. O’Doherty, M.D.Rajiv Dhand, M.D., F.C.C.P.
Address reprint requests to:Thomas A. Standaert
Box 356320Department of PediatricsUniversity of Washington
Health Sciences Building, Rm. RR6191959 N.E. Pacific Ave.
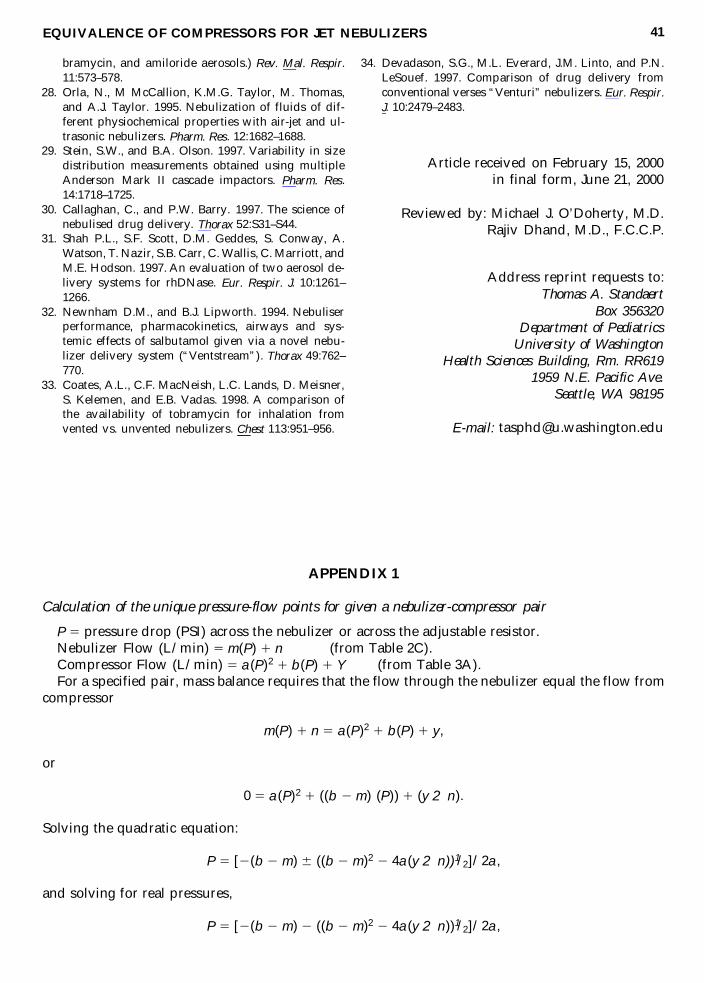
Calculation of the unique pressure-flow points for given a nebulizer-compressor pair
P 5 pressure drop (PSI) across the nebulizer or across the adjustable resistor.Nebulizer Flow (L/min) 5 m(P) 1 n (from Table 2C).Compressor Flow (L/min) 5 a(P)2 1 b(P) 1 Y (from Table 3A).For a specified pair, mass balance requires that the flow through the nebulizer equal the flow from
compressor
m(P) 1 n 5 a(P)2 1 b(P) 1 y,
or
0 5 a(P)2 1 ((b 2 m) (P)) 1 (y 2 n).
Solving the quadratic equation:
P 5 [2(b 2 m) 6 ((b 2 m)2 2 4a(y 2 n))1/2]/2a,
and solving for real pressures,
P 5 [2(b 2 m) 2 ((b 2 m)2 2 4a(y 2 n))1/2]/2a,
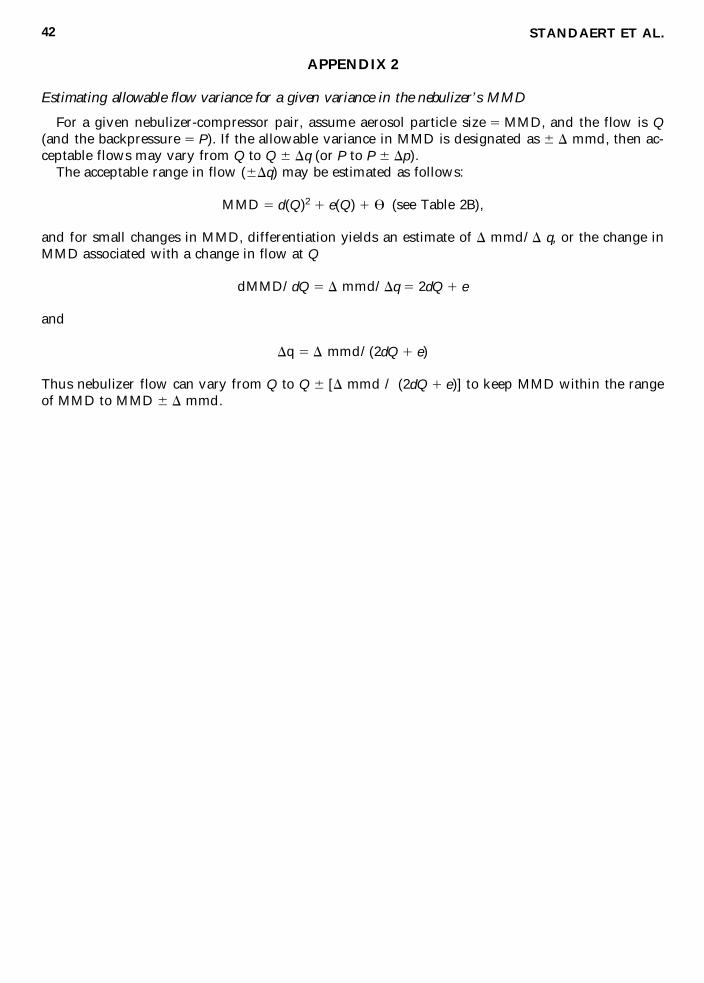
APPENDIX 2
Estimating allowable flow variance for a given variance in the nebulizer’s MMD
For a given nebulizer-compressor pair, assume aerosol particle size 5 MMD, and the flow is Q(and the backpressure 5 P). If the allowable variance in MMD is designated as 6 D mmd, then ac-ceptable flows may vary from Q to Q 6 Dq (or P to P 6 Dp).
The acceptable range in flow (6Dq) may be estimated as follows:
MMD 5 d(Q)2 1 e(Q) 1 U (see Table 2B),
and for small changes in MMD, differentiation yields an estimate of D mmd/D q, or the change inMMD associated with a change in flow at Q
dMMD/dQ 5 D mmd/Dq 5 2dQ 1 e
and
Dq 5 D mmd/(2dQ 1 e)
Thus nebulizer flow can vary from Q to Q 6 [D mmd / (2dQ 1 e)] to keep MMD within the rangeof MMD to MMD 6 D mmd.
STANDAERT ET AL.42
This article has been cited by:
1. Johannes Schulze, Martin Rosewich, Melanie Dressler, Carsten Riemer, Markus A. Rose, Stefan Zielen.2012. Bronchial Allergen Challenge Using the Medicaid Dosimeter. International Archives of Allergy andImmunology 157:1, 89-97. [CrossRef]
2. Bart L. Rottier, Cyril J.P. van Erp, Tanya S. Sluyter, Harry G.M. Heijerman, Henderik W. Frijlink, AnneH. de Boer. 2009. Changes in Performance of the Pari eFlow® Rapid and Pari LC Plus™ during 6 MonthsUse by CF Patients. Journal of Aerosol Medicine and Pulmonary Drug Delivery 22:3, 263-269. [Abstract] [FullText PDF] [Full Text PDF with Links]
3. E WESTERMAN, A DEBOER, P LEBRUN, D TOUW, A ROLDAAN, H FRIJLINK, H HEIJERMAN.2007. Dry powder inhalation of colistin in cystic fibrosis patients: A single dose pilot study☆. Journal ofCystic Fibrosis 6:4, 284-292. [CrossRef]
4. A DEBOER, P HAGEDOORN, H FRIJLINK. 2003. The choice of a compressor for the aerosolisationof tobramycin (TOBI) with the PARI LC PLUS reusable nebuliser. International Journal of Pharmaceutics268:1-2, 59-69. [CrossRef]
5. F Charles HillerTherapeutic Aerosols 20035622, . [CrossRef]6. T.E. Corcoran, J.H. Dauber, N. Chigier, A.T. Iacono. 2002. Improving Drug Delivery from Medical
Nebulizers: The Effects of Increased Nebulizer Flow Rates and Reservoirs. Journal of Aerosol Medicine 15:3,271-282. [Abstract] [Full Text PDF] [Full Text PDF with Links]