The estimation of tumor cell percentage for molecular testing by pathologists is not accurate Alexander JJ Smits 1,2 , J Alain Kummer 1 , Peter C de Bruin 1 , Mijke Bol 2 , Jan G van den Tweel 2 , Kees A Seldenrijk 1 , Stefan M Willems 2 , G Johan A Offerhaus 2 , Roel A de Weger 2 , Paul J van Diest 2 and Aryan Vink 2 1 Department of Pathology, St. Antonius Hospital, Nieuwegein, The Netherlands and 2 Department of Pathology, University Medical Center, Utrecht, The Netherlands Molecular pathology is becoming more and more important in present day pathology. A major challenge for any molecular test is its ability to reliably detect mutations in samples consisting of mixtures of tumor cells and normal cells, especially when the tumor content is low. The minimum percentage of tumor cells required to detect genetic abnormalities is a major variable. Information on tumor cell percentage is essential for a correct interpretation of the result. In daily practice, the percentage of tumor cells is estimated by pathologists on hematoxylin and eosin (H&E)-stained slides, the reliability of which has been questioned. This study aimed to determine the reliability of estimated tumor cell percentages in tissue samples by pathologists. On 47 H&E- stained slides of lung tumors a tumor area was marked. The percentage of tumor cells within this area was estimated independently by nine pathologists, using categories of 0–5%, 6–10%, 11–20%, 21–30%, and so on, until 91–100%. As gold standard, the percentage of tumor cells was counted manually. On average, the range between the lowest and the highest estimate per sample was 6.3 categories. In 33% of estimates, the deviation from the gold standard was at least three categories. The mean absolute deviation was 2.0 categories (range between observers 1.5–3.1 categories). There was a significant difference between the observers (Po0.001). If 20% of tumor cells were considered the lower limit to detect a mutation, samples with an insufficient tumor cell percentage (o20%) would have been estimated to contain enough tumor cells in 27/72 (38%) observations, possibly causing false negative results. In conclusion, estimates of tumor cell percentages on H&E-stained slides are not accurate, which could result in misinterpretation of test results. Reliability could possibly be improved by using a training set with feedback. Modern Pathology advance online publication, 26 July 2013; doi:10.1038/modpathol.2013.134 Keywords: accuracy; estimate; molecular testing; tumor cell percentage Because of the increasing possibilities of targeted therapies and personalized medicine, molecular pathology is becoming more and more important and growing numbers of tests detecting specific gene mutations or other genetic abnormalities are being developed. In the case of pulmonary oncology, for example, the majority of adenocarcinomas harboring activating mutations in the epidermal growth factor receptor (EGFR) gene show a good response to tyro- sine kinase inhibitors like gefitinib and erlotinib. 1–3 The clinical importance of these relatively new drugs is reflected by the number of diagnostic tests that have been developed to detect these mutations. 4 A major challenge for any molecular test is its ability to reliably detect mutations in samples consisting of a mixture of tumor cells and normal cells, especially when the tumor content is very low. Each molecular test has its own diagnostic sensi- tivity: the minimal percentage of mutant alleles present in the sample for the mutation to be detected by the test. The minimally required percentage of tumor cells varies widely, from as little as 0.1% tumor cells for smart amplification process under isothermal conditions and 1% tumor cells for amplification refractory mutation system, to 25% tumor cells for direct sequencing. 4 In order to Correspondence: Dr A Vink, MD, PhD, Department of Pathology, University Medical Center Utrecht, Room H04-312, PO Box 85500, 3508 GA Utrecht, The Netherlands. E-mail: [email protected]Received 26 February 2013; revised and accepted 11 June 2013; published online 26 July 2013 Modern Pathology (2013), 1–7 & 2013 USCAP, Inc. All rights reserved 0893-3952/13 $32.00 1 www.modernpathology.org
Transcript
The estimation of tumor cell percentagefor molecular testing by pathologists isnot accurateAlexander JJ Smits 1,2, J Alain Kummer1, Peter C de Bruin1, Mijke Bol2,Jan G van den Tweel2, Kees A Seldenrijk1, Stefan M Willems2, G Johan A Offerhaus2,Roel A de Weger2, Paul J van Diest2 and Aryan Vink2
1Department of Pathology, St. Antonius Hospital, Nieuwegein, The Netherlands and 2Department ofPathology, University Medical Center, Utrecht, The Netherlands
Molecular pathology is becoming more and more important in present day pathology. A major challenge for any
molecular test is its ability to reliably detect mutations in samples consisting of mixtures of tumor cells and
normal cells, especially when the tumor content is low. The minimum percentage of tumor cells required to
detect genetic abnormalities is a major variable. Information on tumor cell percentage is essential for a correct
interpretation of the result. In daily practice, the percentage of tumor cells is estimated by pathologists on
hematoxylin and eosin (H&E)-stained slides, the reliability of which has been questioned. This study aimed to
determine the reliability of estimated tumor cell percentages in tissue samples by pathologists. On 47 H&E-
stained slides of lung tumors a tumor area was marked. The percentage of tumor cells within this area was
estimated independently by nine pathologists, using categories of 0–5%, 6–10%, 11–20%, 21–30%, and so on,
until 91–100%. As gold standard, the percentage of tumor cells was counted manually. On average, the range
between the lowest and the highest estimate per sample was 6.3 categories. In 33% of estimates, the deviation
from the gold standard was at least three categories. The mean absolute deviation was 2.0 categories (range
between observers 1.5–3.1 categories). There was a significant difference between the observers (Po0.001). If
20% of tumor cells were considered the lower limit to detect a mutation, samples with an insufficient tumor cell
percentage (o20%) would have been estimated to contain enough tumor cells in 27/72 (38%) observations,
possibly causing false negative results. In conclusion, estimates of tumor cell percentages on H&E-stained
slides are not accurate, which could result in misinterpretation of test results. Reliability could possibly be
improved by using a training set with feedback.Modern Pathology advance online publication, 26 July 2013; doi:10.1038/modpathol.2013.134
Because of the increasing possibilities of targetedtherapies and personalized medicine, molecularpathology is becoming more and more importantand growing numbers of tests detecting specific genemutations or other genetic abnormalities are beingdeveloped. In the case of pulmonary oncology, forexample, the majority of adenocarcinomas harboringactivating mutations in the epidermal growth factorreceptor (EGFR) gene show a good response to tyro-sine kinase inhibitors like gefitinib and erlotinib.1–3
The clinical importance of these relatively newdrugs is reflected by the number of diagnostictests that have been developed to detect thesemutations.4
A major challenge for any molecular test is itsability to reliably detect mutations in samplesconsisting of a mixture of tumor cells and normalcells, especially when the tumor content is very low.Each molecular test has its own diagnostic sensi-tivity: the minimal percentage of mutant allelespresent in the sample for the mutation to be detectedby the test. The minimally required percentageof tumor cells varies widely, from as little as0.1% tumor cells for smart amplification processunder isothermal conditions and 1% tumor cells foramplification refractory mutation system, to 25%tumor cells for direct sequencing.4 In order to
Correspondence: Dr A Vink, MD, PhD, Department of Pathology,University Medical Center Utrecht, Room H04-312, PO Box85500, 3508 GA Utrecht, The Netherlands.E-mail: [email protected] 26 February 2013; revised and accepted 11 June 2013;published online 26 July 2013
Modern Pathology (2013), 1–7
& 2013 USCAP, Inc. All rights reserved 0893-3952/13 $32.00 1
interpret the test results correctly, one has to knowwhether the percentage of tumor DNA in the sampleis sufficient for the specific test used. Thepercentage of tumor cells is generally estimated bya pathologist, but to the best of our knowledge dataconcerning the reliability of these estimates havenever been published. The aim of the present studywas to evaluate the reliability of this estimation.
Materials and methods
Tissue Samples
Hematoxylin and eosin (H&E)-stained slides of 24transbronchial and transthoracic lung biopsies and23 lung resection specimens, all containing primarylung carcinomas, were collected from the archives ofthe Department of Pathology of the UniversityMedical Center, Utrecht, The Netherlands. Slidescontaining only questionably malignant cells wereexcluded. For each slide a specific scoring area,containing as little crushing artifacts and necrosis aspossible, was delineated. Specific approval of theethics committee was not necessary for this study, asexisting tissue slides were used anonymously.
Tumor Cell Count
To determine the exact percentage of tumor cells inthe slides, a Leica Q550MW Imaging Workstation(Leica Microsystems Imaging Solutions Ltd, Cam-bridge, UK), in combination with a Leica DM LBmicroscope, a JVC TK-C1480BE Digital Color VideoCamera (JVC, Yokohama, Japan), and Leica QProditsoftware (version 3.2) were used. This setup has theoption of demarcating a scoring area on the slide, inwhich the software selects random high powerfields (HPFs). The central areas of these HPFs wereused for visually counting tumor and non-tumorcells. These cells were marked manually andcounted using the software.
As the cell density of the slides showed a largevariation, the number of HPFs to be counted was notfixed. For the biopsy slides, counting was continueduntil a total of at least 500 cells was reached, for theresection specimens this was at least 1000 cells.
Tumor Cell Estimate
The percentage of tumor cells relative to other cells(eg, stromal cells, inflammatory infiltrate and pre-existing epithelial cells) was independently esti-mated by nine pathologists. This group consisted ofacademic pathologists (University Medical Center,Utrecht, The Netherlands) and pathologists from alarge referral hospital (St Antonius Hospital, Nieu-wegein, The Netherlands). The estimates werescored in categories of 0–5%, 6–10%, 11–20%, 21–30%, 31–40%, 41–50%, 51–60%, 61–70%, 71–80%,81–90%, and 91–100% tumor cells.
Statistical Analysis
Statistical calculations were performed using SPSSsoftware (version 20). For each estimate of a tumorcell percentage by a pathologist, the deviation wascalculated as the difference (in number of cate-gories) between the estimated and the countedtumor cell percentage. Mixed models were used todetect differences between pathologists and toinvestigate the relationship between countedtumor cell percentage and deviation. In theseanalyses the individual slides were used as subjects,the deviation as the independent variable, theobservers as the explanatory variable, and thecounted tumor cell percentage as a covarianceparameter. P-values o0.05 were considered statisti-cally significant.
Results
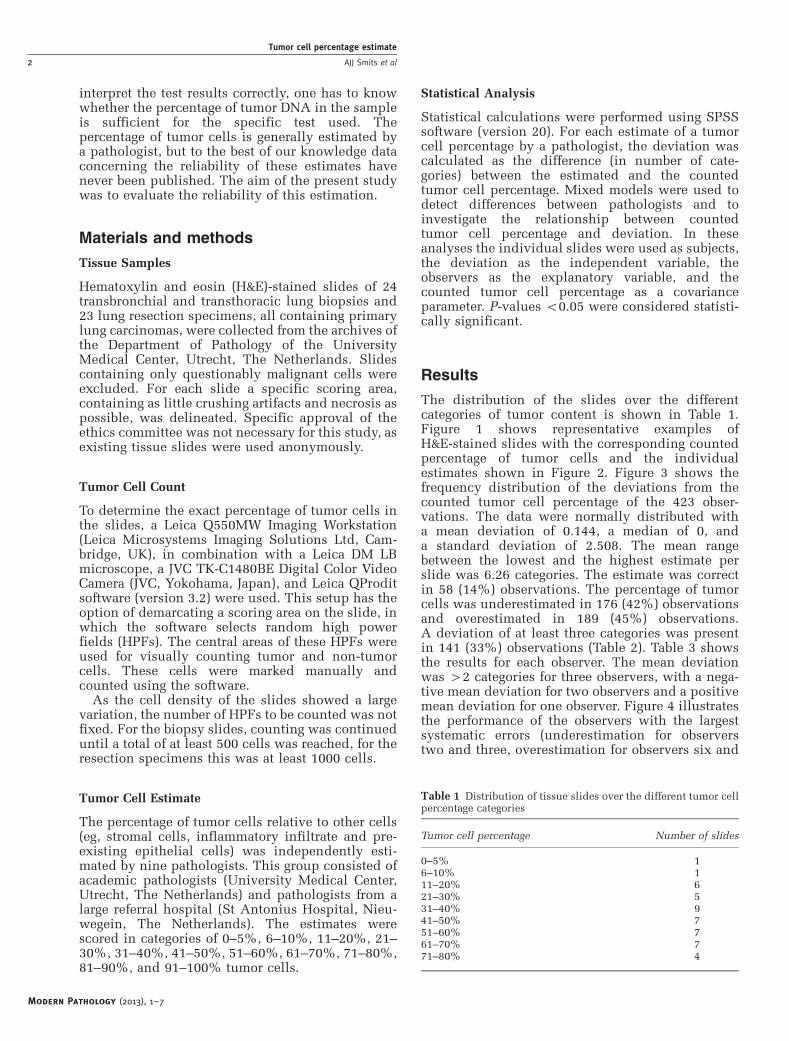
The distribution of the slides over the differentcategories of tumor content is shown in Table 1.Figure 1 shows representative examples ofH&E-stained slides with the corresponding countedpercentage of tumor cells and the individualestimates shown in Figure 2. Figure 3 shows thefrequency distribution of the deviations from thecounted tumor cell percentage of the 423 obser-vations. The data were normally distributed witha mean deviation of 0.144, a median of 0, anda standard deviation of 2.508. The mean rangebetween the lowest and the highest estimate perslide was 6.26 categories. The estimate was correctin 58 (14%) observations. The percentage of tumorcells was underestimated in 176 (42%) observationsand overestimated in 189 (45%) observations.A deviation of at least three categories was presentin 141 (33%) observations (Table 2). Table 3 showsthe results for each observer. The mean deviationwas 42 categories for three observers, with a nega-tive mean deviation for two observers and a positivemean deviation for one observer. Figure 4 illustratesthe performance of the observers with the largestsystematic errors (underestimation for observerstwo and three, overestimation for observers six and
Table 1 Distribution of tissue slides over the different tumor cellpercentage categories
seven) in the resection specimens. The mixedmodels analysis demonstrated a significant differ-ence between the observers (Po0.001) and asignificant influence of the tumor cell percentagein the slide on the observed deviation (P¼ 0.003,regression coefficient � 0.2287, ie, overestimation
in samples with low tumor content andunderestimation in samples with high tumor con-tent). If deviations of 20% between observerswere accepted, the mixed models analysis stillshowed a significant difference between the obser-vers (Po0.001).
Figure 1 Representative examples of H&E-stained slides showing the complete scoring area (a, c, e) and a higher magnification of thisarea (b, d, f).
Modern Pathology (2013), 1–7
Tumor cell percentage estimate
AJJ Smits et al 3
Samples with Low (o20%) Tumor Cell Content
As a reliable estimate of the tumor cell percentage isespecially important in tissue samples with tumorcell percentages around the diagnostic threshold ofthe molecular test, we focused on the eight slidescontaining o20% of tumor cells (close to thepercentage of tumor cells required for direct sequen-cing4,5). Twenty-seven of the 72 (38%) estimates onthese slides were 420% tumor cells. Of these 27overestimates, 26 were made by six observers,whereas only one of the three remaining observersoverestimated one of these cases (Table 4). Theobservers who systematically overestimated the
tumor cell percentage were also responsible for themajority of overestimations in the slides containingo20% tumor cells.
Samples with High (420%) Tumor Cell Content
The remaining 39 slides contained 420% tumorcells. Of the total of 351 estimates on these slides, 61(17%) were o20% tumor cells. Fifty-six of theseunderestimates were made by four observers,whereas the five remaining observers underesti-mated only one case each (Table 4). The observerswho systematically underestimated the tumor cellpercentage were responsible for the majority ofunderestimations.
Discussion
The presence of sufficient tumor DNA is crucial forthe correct interpretation of a molecular test result ofthe examined sample. When the proportion of tumorDNA is insufficient, genetic abnormalities can bemissed by the test because the signal of the aberrantDNA from the tumor cells can be overshadowed byan excess of normal DNA from non-tumor cells. Thetreating physician must be aware of this, and thepathology report or molecular test report should
Figure 2 Individual estimates per slide, corresponding to theslides shown in Figure 1 (a, c, e, respectively). Arrows in thegraphs (a–c) represent the counted percentages of tumor cells.
Figure 3 Frequency distribution of the deviation (number ofcategories, see Table 1) from the counted gold standard for ninepathologists estimating tumor cell fraction in lung cancer biopsiesand resections.
Table 2 Distribution of observed deviations (number of cate-gories, see Table 1) from counted tumor cell percentage for ninepathologists in lung cancer biopsies and resections
contain a disclaimer when the tumor content isaround or below the diagnostic threshold of a test.As far as we know, the tumor content of a sample isgenerally estimated by a pathologist on the H&E-stained slide, the accuracy of which has never beenpublished.
In the present study, we examined the accuracy oftumor cell percentage estimates by comparing theseestimates to tumor cell percentages as determineddigitally using a video overlay system. The meandeviation was small (only 0.14 categories), but thiscan be misleading, as it can be the result of largepositive and negative deviations that balance eachother out. In fact, in about one-third of the observa-tions, there was a deviation of at least threecategories and overall there was a wide mean rangeof 6.26 categories between the lowest and thehighest estimate per slide. The small mean deviationdoes not adequately reflect this inaccuracy andindeed the negative deviations largely compensatefor the positive deviations. This improves the meandeviation, but is of no use for the individualestimate. A better way to evaluate the quality ofthe estimates is therefore the mean absolute devia-tion, which had an overall magnitude of 2.04categories. This large inaccuracy of the estimates
could have serious consequences for the treatmentof patients, as argued below.
We chose a cutoff point of 20% tumor cells,which is close to the reported diagnostic thresholdfor direct sequencing,4,5 a widely used techniqueto detect mutations, to evaluate the clinicalconsequences of the estimates. Tissue slidescontaining o20% tumor cells were estimated tocontain 420% tumor cells in over one-third (38%)of observations. In case of a molecular testrequiring at least 20% tumor cell content, suchsamples could not only generate false negative testresults, but the overestimation of tumor cellcontent may also lead to unjustified securityabout the result. This observation is of greatclinical importance. In this manner, beneficialtherapies could erroneously be withheld frompatients. The reverse error can also be the case(sufficient tumor cells present in the sample, butestimated to be below the threshold value of thetest), which we observed in 61 out of 351 (17%)estimates. The clinical relevance of this, however,is somewhat smaller, as it can only lead to an
Table 3 Deviations (number of categories, see Table 1) from the counted gold standard per observer for nine pathologists estimatingtumor cell fraction in lung cancer biopsies and resections
Figure 4 Performance of the observers with the largest systematicerrors, compared with the counted percentage of tumor cells, inthe resection specimens. The results of two observers withsystematic overestimation and of two observers with systematicunderestimation are shown. The specimens were ordered accord-ing to the ascending percentage of tumor cells.
Table 4 Breakdown per observer of under- and overestimates oftumor cell fraction on lung cancer biopsies and resections inrelation to a threshold of 20% tumor cells
unjustified insecurity about the test result, but notto a false result in itself.
In the case of oncogenic point mutations, usuallyonly one of the two copies of a gene is mutated,resulting in only 25% mutated DNA in a samplecontaining 50% tumor cells. This further increasesthe need for a sufficient fraction of tumor cells,especially with the use of relatively insensitivedetection methods like Sanger sequencing. Geneticabnormalities like aneuploidy, loss of heterozygos-ity, or amplification of the mutated allele can alterthe percentage of mutated DNA, thus making itimpossible to calculate this percentage with cer-tainty, even when the percentage of tumor cells isaccurately estimated.
The implementation of next generation/massiveparallel sequencing creates new opportunities formutation analysis, as these techniques can detectmutations that are present in a very small fraction ofcells in the sample. On the one hand, this reducesthe need for an accurate estimation of tumor cellpercentage, as the diagnostic threshold of the test iseasily met. On the other hand, as these techniquescan provide rather precise estimates of the ratio ofmutated and non-mutated DNA, information con-cerning tumor cell percentage is still important inthe interpretation of this ratio, for example, toanswer questions concerning intratumoral geneticheterogeneity and genetic abnormalities like thosementioned in the previous paragraph.
The main question is how to improve theestimation skills of pathologists. A first possibilitywould be to emphasize the fact that the observersshould make the estimate based on the number ofnuclei and not on the fraction of surface area of thetumor tissue present in the slide because generallythe tumor cells tend to be larger than the inflam-matory or stromal cells. At first glance a tissuesection can consist almost completely of tumortissue, while at second glance small lymphocytescan outnumber the larger tumor cells, thus dilutingthe tumor DNA enormously and causing only arelatively small fraction of mutated DNA to bepresent in the DNA sample. Pathologists shouldalso be aware of this when designating areas oftumor for manual microdissection to isolate DNA.Another option could be the use of immunohisto-chemical stains to clarify which cells are tumorcells and non-tumor cells. This option, however,has the risk of causing overestimation of thefraction of positively stained cells compared withthe non-stained cells, as intensely stained cells ornuclei tend to stand out more. Finally, the fractionof tumor cells may be actually counted usingmethods like the one of the current study to setthe gold standard, but this is relatively timeconsuming.
Erroneous estimates can be produced either bysystematic errors (general tendency to over- orunderestimate) or by random errors. Both mechan-isms seem to have a role in this study, as both the
mean deviation and the standard deviation varyconsiderably between the observers. Three observersshowed large systematic errors of at least twocategories (systematic underestimation for two ob-servers and overestimation for one observer),whereas others showed large standard deviationsof the estimates. A large mean absolute deviation perobserver (of at least two categories for four ob-servers) can be the result of a large systematic error,a large random error, or both. Information concern-ing the type of error made by an individualpathologist could help to improve the estimates ofthis specific pathologist.
In most pathology laboratories, there never is anyfeedback on the estimates made, which implies thatpathologists who systematically overestimate orunderestimate the percentage of tumor cells willnot improve their estimates over time. It could beuseful to have a training set of slides with a known(counted) percentage of tumor cells. Pathologistscould estimate the tumor cell percentage and receivefeedback afterwards. Further, such a set of slidescould be used as a reference set to review occasion-ally. Whether any of these options could improvethe quality of estimates of tumor cell percentagewould be an interesting subject for future research,and we are exploring the possibility of designing adigital training set. In any case, it seems useful tolimit the estimation of tumor cell fraction to a fewdedicated and trained pathologists per laboratory.
In conclusion, the quality of tumor cell percentageestimates on H&E-stained slides for moleculartesting, the manner in which this is performed bypathologists in current practice, is far from optimal,possibly leading to misinterpretation of the testresults. Options for improvement include moredetailed instructions for the observers or specifictraining with feedback.
Acknowledgements
This study was supported by a grant from theOncology Center of the St Antonius Hospital,Nieuwegein, The Netherlands. The authors wouldlike to thank E Tromp and JC Kelder, St AntoniusHospital, Nieuwegein, for advice on statisticalanalysis.
Disclosure/conflict of interest
The authors declare no conflict of interest.
References
1 Paez JG, Janne PA, Lee JC, et al. EGFR mutations in lungcancer: correlation with clinical response to gefitinibtherapy. Science 2004;304:1497–1500.
Modern Pathology (2013), 1–7
Tumor cell percentage estimate
6 AJJ Smits et al
2 Lynch TJ, Bell DW, Sordella R, et al. Activatingmutations in the epidermal growth factor receptorunderlying responsiveness of non-small-cell lungcancer to gefitinib. N Engl J Med 2004;350:2129–2139.
3 Pao W, Miller V, Zakowski M, et al. EGF receptor genemutations are common in lung cancers from "neversmokers" and are associated with sensitivity of tumorsto gefitinib and erlotinib. Proc Natl Acad Sci USA2004;101:13306–13311.
4 Thunnissen E, Kerr KM, Herth FJ, et al. The challenge ofNSCLC diagnosis and predictive analysis on smallsamples. Practical approach of a working group. LungCancer 2012;76:1–18.
5 Park S, Holmes-Tisch AJ, Cho EY, et al. Discordance ofmolecular biomarkers associated with epidermal growthfactor receptor pathway between primary tumors andlymph node metastasis in non-small cell lung cancer.J Thorac Oncol 2009;4:809–815.