58
THE EUROPEAN FISHING INDUSTRY Struan Stevenson MEP President of the Fisheries Committee of the European Parliament © L Cunningham
| Date post: | 19-Jul-2018 |
| Category: |
Documents |
| Upload: | trannguyet |
| View: | 214 times |
| Download: | 0 times |
THE EUROPEAN FISHING INDUSTRY
Struan Stevenson MEP President of the Fisheries Committee
of the European Parliament
© L Cunningham

- 2 -
STRUAN STEVENSON
First elected MEP for Scotland 1999. Charmin of the European Parliament’s Fisheries Committee. Conservative Spokesman on Fisheries and Agriculture (Scotland), 1999-2001. Member: Fisheries Committee. Substitute Member: Agriculture and Rural Development Committee. Educated at Strathallan School and West of Scotland Agricultural College. Director: PS Communication Consultants Ltd, 1994-1999; J&R Stevenson Ltd, since 1968; Saferworld, 1992-1994; Demarco Gallery, 1986-1990. Parliamentary Candidate: NE Scotland, European by-election 1998; Dumfries. General Election 1997; Edinburgh South, General Election 1992; Carrick, Cumnock & Doon Valley, General Election 1987. Councillor and Group Leader: COSLA, 1986-1988; Kyle & Carrick District Council, 1974-1992; Girvan District Council, 1970-1974. Interests: contemporary art, music, theatre, opera, poetry and hill walking. Born 1948. Married, two children. European Parliament, Rue Wiertz, B-1047 Brussels, Belgium.
Tel: 00 322 284 7710 0131 247 6890 Fax: 00 322 284 9710 0131 247 6891
Email: [email protected] Website: www.scottishtorymeps.org.uk
ACKNOWLEDGEMENT Many thanks to Louise Cunningham (BSc in Biology) for researching, illustrating and writing this paper.

- 3 -
PART I 1. Introduction …………………………………………………… 4 2. World Fisheries ………………………………………………… 5 a) Nutritional value of fish b) Economic dimension of fisheries 3.The Fish Crisis ………………………………………………… 8 a) Human population growth b) State and distribution of the fish stocks c) Fishing fleets and equipment used d) Species caught e) The environmental aspects of fishing 4. Inland Capture Fisheries ……………………………………… 15 5. Recreational Fishing ……………………………………………16 6. Aquaculture ….………………………………………………..… 17 a) Benefits of fish-farming b) The perils of aquaculture 7. Common Fisheries Policy………………………………………18 a) Background b) Objectives c) Reforms d) The future 8. Sustainability ……….…………………………………………… 20 PART II 1. Inland States …………………………………………………… 22 Austria Luxembourg 2. Coastal States ……………………………………………………23 Belgium
Denmark Finland France Germany Greece Ireland Italy The Netherlands Portugal Spain Sweden United Kingdom
European Union fishing fleet overview 3. Conclusion…..…………………………………………………… 49
References …………………………………………………………. 51 Glossary ……………………………………………………………. 52 Abbreviations….…………………………………………………… 53 Appendix…………………………………………………………… 53
- 4 -
PART I
1. INTRODUCTION With the highly controversial reform of the Common Fisheries Policy well underway, the European fishing sector has been thrust into the headlines once more. Collapsing fish stocks, lost jobs, lay-offs, tie-ups and decommissioning seem to be the order of the day. As part of the CFP reform package, the European Commission proposes to introduce a dramatic reduction in fishing effort by enforcing mandatory cuts in days at sea of between 30% and 60%. They conclude that this will lead to actual (voluntary) cuts in overall EU fleet capacity of around 18% as fishermen scramble to leave the industry. However on average, the Commission expects Northern EU Member States to cut the size of their fleets by over 20%, while in the South the cuts will be nearer 10%. They argue that this is because stocks are under greater pressure in the North than they are in the South. It is easy to understand where the Commission are coming from. In the EU there are too many fishermen chasing too few fish. In the words of one senior Commission official in DG Fish – “Fish can live quite happily without fishermen, however, fishermen cannot live happily without fish!” These proposals are, needless to say, highly controversial. But the state of our fish stocks leaves little room for optimism. Drastic measures will require to be taken if we are to get catching capacity back in balance with existing resources. The main problem today is conservation and the need to achieve sustainable fisheries to ensure the survival of our fishing communities. I hope that this research paper will provide a useful background guide to the size, capacity and output of the EU fishing industry. I have designed it as a reference tool, which should be helpful to representatives from the EU fisheries sector, legislators, journalists, political commentators and interested members of the public during the coming debate. It is a snapshot of an industry at a vital crossroad in its history.
FreeFoto.Com
- 5 -
2. WORLD FISHERIES Historically there are many accounts of world fish stock collapses. In 1500 for example, fish stocks in the Baltic Sea had declined so dramatically that herring almost completely disappeared. During the 1980s catch rates declined in the North Sea and those of the Pacific were diminished by 1910. More recently, the sardine stock of California and Japan crashed in the 1940s. Technological improvements allowed the fishing sector to expand rapidly during the 1950s and 1960s, but overfishing and competition between fishing fleets for resources slowed the production of fish in the 1970s even though demand continued to grow. A new regime was therefore introduced giving nations the right to extend their jurisdiction over offshore waters out to 200 nautical miles. Despite this, substantial and rapid depletion continued to occur in many places, such as the collapse of the Peruvian anchovy fishery in 1972, and fully exploited fisheries led to quota cuts in the early 1990s. Nevertheless the sustainability of fisheries is not ensured, and as well as the biological effects of stocks collapsing, significant social impacts have occurred in the past, such as the loss of 40 000 jobs following the collapse of the Canadian cod fishery in 1992. The UN Food and Agriculture Organisation estimates that if fish populations are allowed to recover, and are managed responsibly, about 100 million metric tonnes of fish could be caught annually on a sustainable basis. Instead, in the past two decades, the world has witnessed the collapse of one fishery after the other and currently fish populations in four of the world’s 17 major fishing regions are seriously depleted, while catches in nine others are declining. Only in the Indian Ocean, where the use of modern fishing methods is just beginning, is the marine catch on the increase. a) Nutritional value of fish About one billion people rely on fish as their primary source of protein. Globally it is the fifth largest agricultural product, supplying about 20% of the world’s total supplies of animal protein. The average consumption of fishery products within the member states is shown below, ranging from 11.2 kg/head/year in Austria to 58.5 kg/head/year in Portugal. The EU average is 23.4 kg/head/year which is considerably higher than 16.1 kg/head/year, the world average. b) Economic dimension of fisheries The EU fisheries sector is characterised by economic fragility resulting from over-investment, rapidly rising costs and a shrinking resource base. This is reflected in poor profitability and steadily declining employment. Nevertheless, within the EU over 150 thousand people were employed in the fishing industry in 1997. The processing sector provides markets for fish caught by EU fishermen, which has remained relatively stable throughout the last decade. Within the EU, the value of the output of the processing industry is nearly twice the value of the production of the catching sector. Over 8 million tonnes of fish are bought, while 5 million are sold annually, bringing a large amount of income to the Member States. The Netherlands and Denmark are the only countries with balanced imports and exports, while Ireland and Sweden are unique in exporting more than they import. Within the EU, Spain and Denmark are the biggest traders.

- 6 -
European Trade 2000
0
200000
400000
600000
800000
1000000
1200000
1400000
1600000
1800000
Austri
a
Belgium
Denmark
German
y
Greece
Finlan
d
France
Irelan
dIta
ly
Luxem
bourg
Netherl
ands
Portug
alSpa
in
Sweden UK
Ton
nes l
ive
wei
ght
ImportsExports
Consumption of fishery products 1997
0 10 20 30 40 50 60 70
Austria
Germany
Netherlands
Ireland
Belgium/Lux
UK
Italy
Denmark
Sweden
Greece
France
Finland
Spain
Portugal
Supply (kg/head/year)
- 7 -
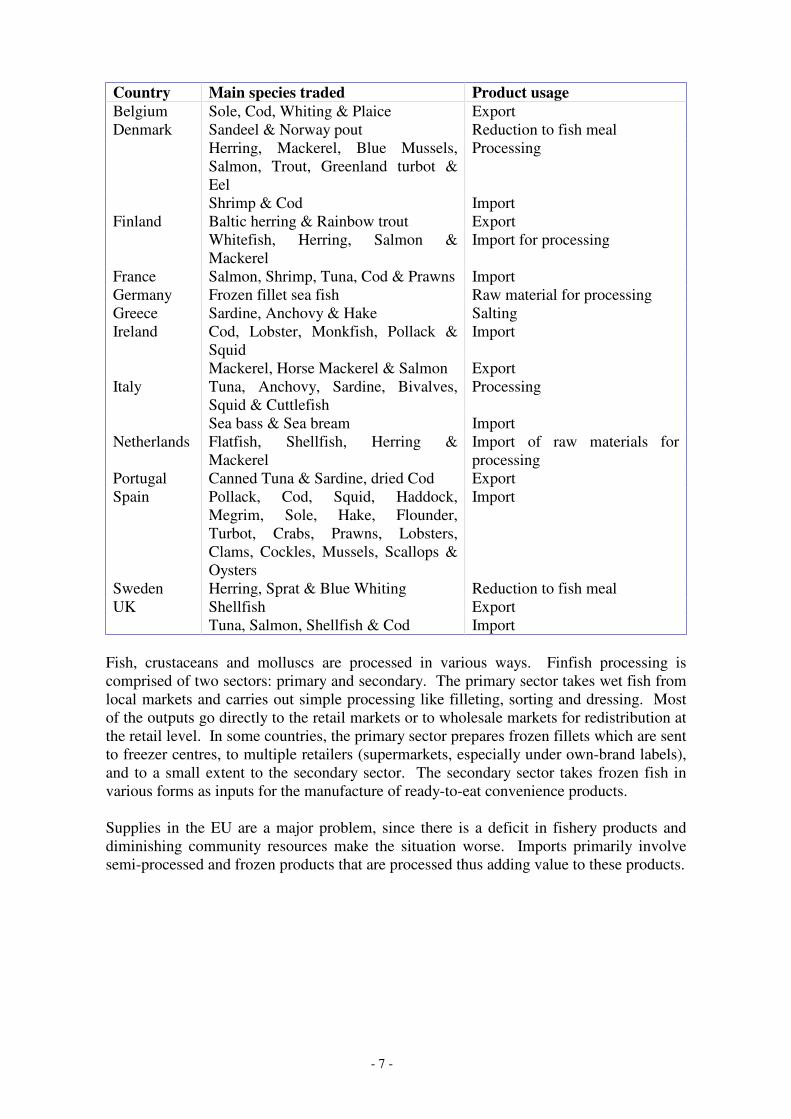
Country Main species traded Product usage Belgium Sole, Cod, Whiting & Plaice Export Denmark Sandeel & Norway pout Reduction to fish meal Herring, Mackerel, Blue Mussels,
Salmon, Trout, Greenland turbot & Eel
Processing
Shrimp & Cod Import Finland Baltic herring & Rainbow trout Export Whitefish, Herring, Salmon &
Mackerel Import for processing
France Salmon, Shrimp, Tuna, Cod & Prawns Import Germany Frozen fillet sea fish Raw material for processing Greece Sardine, Anchovy & Hake Salting Ireland Cod, Lobster, Monkfish, Pollack &
Squid Import
Mackerel, Horse Mackerel & Salmon Export Italy Tuna, Anchovy, Sardine, Bivalves,
Squid & Cuttlefish Processing
Sea bass & Sea bream Import Netherlands Flatfish, Shellfish, Herring &
Mackerel Import of raw materials for processing
Portugal Canned Tuna & Sardine, dried Cod Export Spain Pollack, Cod, Squid, Haddock,
Megrim, Sole, Hake, Flounder, Turbot, Crabs, Prawns, Lobsters, Clams, Cockles, Mussels, Scallops & Oysters
Import
Sweden Herring, Sprat & Blue Whiting Reduction to fish meal UK Shellfish Export Tuna, Salmon, Shellfish & Cod Import
Fish, crustaceans and molluscs are processed in various ways. Finfish processing is comprised of two sectors: primary and secondary. The primary sector takes wet fish from local markets and carries out simple processing like filleting, sorting and dressing. Most of the outputs go directly to the retail markets or to wholesale markets for redistribution at the retail level. In some countries, the primary sector prepares frozen fillets which are sent to freezer centres, to multiple retailers (supermarkets, especially under own-brand labels), and to a small extent to the secondary sector. The secondary sector takes frozen fish in various forms as inputs for the manufacture of ready-to-eat convenience products. Supplies in the EU are a major problem, since there is a deficit in fishery products and diminishing community resources make the situation worse. Imports primarily involve semi-processed and frozen products that are processed thus adding value to these products.

- 8 -
3. THE FISH CRISIS a) Human population growth The world population has shown a dramatic increase in recent years. Currently it is estimated that the population is growing at 1.33% per year, which means that there are annually about 80 million extra people to feed. World demand for fish, both as a source of food for human consumption and for reduction to fish meal, has grown at a steady pace, but it is not known how long fisheries will continue to satisfy demand.
b) State and distribution of the fish stocks Demand for fish and fish products has put enormous pressure on resources, and very few conventional species remain unexploited. Because fish regenerate as determined by nature and populations fluctuate naturally, attempts to increase supply may eventually be limited or seriously degrade the environment. Fish stocks have been repeatedly overfished in this way, with at least 20 major fisheries from around the world collapsing in the last decade. The world’s most prominent fish producers are China, Peru, the EU and Japan, and the fish crisis is therefore a global problem. Currently almost half the individual fish stocks are fully exploited; another 22% are overexploited, while some are at risk of complete collapse. Almost all of the catches of the EU fleet are taken in fishing regions adjacent to the European Union. The Atlantic and Mediterranean appear to have passed their thresholds of sustainability, and so are diminishing in supply, although 80% of the EU catches came from the Northeast Atlantic in 1995. The North Sea has more than 200 species of fish, but has been chronically overfished, thus threatening many commercially important species. Indeed it appears that only haddock, and to some extent saithe stocks in the North Sea have shown some improvement over the previous years, while other species seem at risk. The current situation in the Baltic, which has lower productivity than the North Atlantic due to closed water circulation, is not sustainable. In Western waters, fishing mortality rates have been rapidly increasing, thus threatening the future of this fishing area.
Wor
ld p
opul
atio
n (x
109 )
MT
Pro
duct
ion Human population
growth and fishery production. (From: Beveridge, 1996).
- 9 -
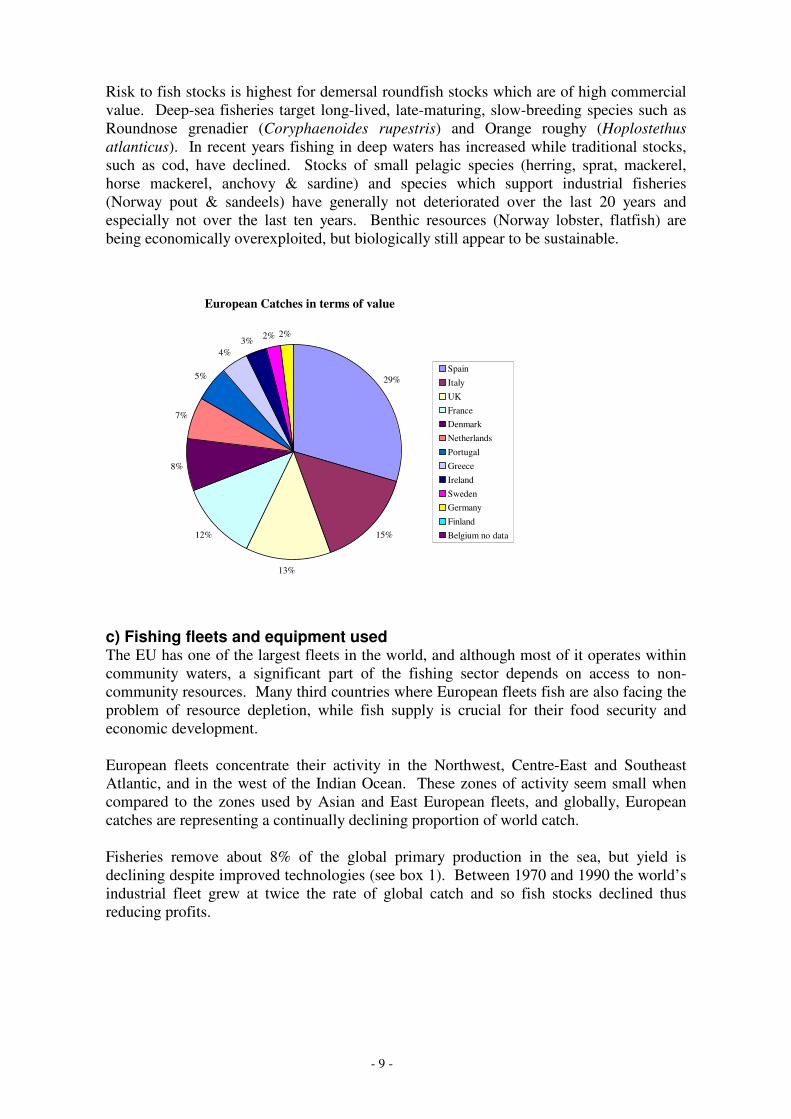
Risk to fish stocks is highest for demersal roundfish stocks which are of high commercial value. Deep-sea fisheries target long-lived, late-maturing, slow-breeding species such as Roundnose grenadier (Coryphaenoides rupestris) and Orange roughy (Hoplostethus atlanticus). In recent years fishing in deep waters has increased while traditional stocks, such as cod, have declined. Stocks of small pelagic species (herring, sprat, mackerel, horse mackerel, anchovy & sardine) and species which support industrial fisheries (Norway pout & sandeels) have generally not deteriorated over the last 20 years and especially not over the last ten years. Benthic resources (Norway lobster, flatfish) are being economically overexploited, but biologically still appear to be sustainable.
c) Fishing fleets and equipment used The EU has one of the largest fleets in the world, and although most of it operates within community waters, a significant part of the fishing sector depends on access to non-community resources. Many third countries where European fleets fish are also facing the problem of resource depletion, while fish supply is crucial for their food security and economic development. European fleets concentrate their activity in the Northwest, Centre-East and Southeast Atlantic, and in the west of the Indian Ocean. These zones of activity seem small when compared to the zones used by Asian and East European fleets, and globally, European catches are representing a continually declining proportion of world catch. Fisheries remove about 8% of the global primary production in the sea, but yield is declining despite improved technologies (see box 1). Between 1970 and 1990 the world’s industrial fleet grew at twice the rate of global catch and so fish stocks declined thus reducing profits.
European Catches in terms of value
29%
15%
13%
12%
8%
7%
5%
4%3% 2% 2%
Spain
ItalyUKFranceDenmarkNetherlands
PortugalGreeceIrelandSwedenGermany
FinlandBelgium no data
- 10 -
Improved fishing equipment Radar allows vessels to navigate and fish in dense fog; Sonar can detect schools of fish directly by their characteristic echoes; Satellite positioning enables ships to manoeuvre precisely to spots where fish are known to
congregate and breed; Spotter aeroplanes are used to track fish; New vessels remain for longer periods on fishing grounds; On-board freezing and processing enables fleets to exploit fish stocks far away from
homeports; Synthetic twines and improved gear hauling has produced bigger and more durable nets.
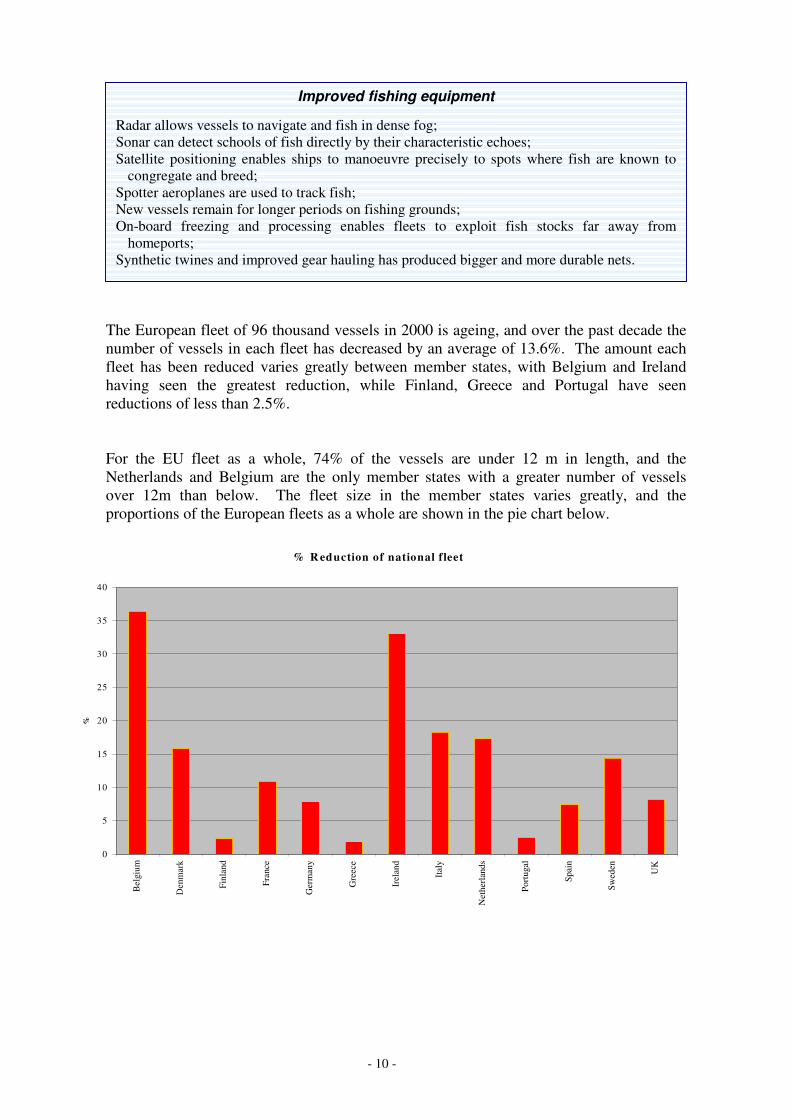
The European fleet of 96 thousand vessels in 2000 is ageing, and over the past decade the number of vessels in each fleet has decreased by an average of 13.6%. The amount each fleet has been reduced varies greatly between member states, with Belgium and Ireland having seen the greatest reduction, while Finland, Greece and Portugal have seen reductions of less than 2.5%. For the EU fleet as a whole, 74% of the vessels are under 12 m in length, and the Netherlands and Belgium are the only member states with a greater number of vessels over 12m than below. The fleet size in the member states varies greatly, and the proportions of the European fleets as a whole are shown in the pie chart below.
% R eduction of national fleet
0
5
10
15
20
25
30
35
40
Bel
gium
Den
mar
k
Finl
and
Fran
ce
Ger
man
y
Gre
ece
Irel
and
Ital
y
Net
herl
ands
Port
ugal
Spai
n
Swed
en UK
%

- 11 -
There are many different types of fishing gear, allowing a degree of specialisation in the species targeted. Gear is described as either passive, which relies on the activity of the fish, or active, which involves hunting. Some of the main types of gear are described and illustrated below. Passive gear: (i) Hook and line Hooks are one of man’s oldest tools and come in a variety of shapes while attached to a line. Long lines can reach up to 100-300m, with short branches carrying many hooks, held up by floats and kept in place by weights. Often used where bottom conditions do not permit the use of a trawl, long lines are set according to purpose, and are used primarily for catching sharks, salmon, eels, members of the cod family, halibut and Greenland halibut. (ii) Nets Nets are made of synthetic fibres, especially nylon, as their effectiveness depends on their visibility. Along the upper edge is a head rope which has floats of cork, foam, plastic or hollow spheres of glass or metal. The foot rope, along the lower edge, carries weights of lead or galvanised iron rings. Nets hang vertically in the water column and are highly selective as the size of the mesh determines the size of fish caught. Drift nets are set out in the open sea to catch pelagic fish, such as herring, saithe and salmon. Usually several nets are joined together to form a ’fleet’ which may be up to 20km long. Set nets are put along the sea floor to catch bottom-living fish (e.g. cod and flat fish). Fixed nets consist of large traps fixed to the bottom of shallow water and a long leader net which guides fish to a funnel-shaped entrance opening into a
European Fleet 2000
22%
18%
17%
11%
9%
9%
4%
4%2%
2%
1%1%
GreeceItalySpainPortugalUKFranceDenmarkFinlandGermanySwedenIrelandNetherlandsBelgiumAustriaLuxembourg
Hook Long line
Drift net

- 12 -
chamber. The chamber has sidewalls, supported by posts, which go to the water surface and is closed by netting at the bottom. Fixed nets are commonly used in coastal fisheries for the capture of herring, salmon, eel, cod, garfish, lumpsucker and mackerel during their breeding and feeding migrations towards the shore. (iii) Traps Bags of netting held open by rings or hoops of iron. The entrance to the trap is funnel-shaped, allowing the fish to enter, but preventing them from swimming out. Traps are mainly used in shallow water for the capture of eel, cod and prawns, while baits are used in basket traps for lobsters, crawfish, edible crab, cuttlefish and eels.
Active gear: (i) Purse Seines Large rectangular nets, sometimes more than 500m long and up to 150m deep, are shot in a circle round a fish shoal. Once the fish have been encircled, the purse line is tightened thus closing the net at the bottom. Very effective, seines require manoeuvrable vessels and experienced skippers, and primarily aim for shoaling species such as herring, sprat, capelin, mackerel and tuna. (ii) Bottom Trawls The trawl is a funnel-shaped sack of netting held open by a rectangular frame and towed by one or two ships. It does not necessarily have contact with the bottom, and is very popular with the Dutch for catching sole in shallow waters. (iii) Pelagic Trawls Developed in the 1950s, pelagic trawls allowed marginally exploited stocks to become available to fisheries. Towed by two ships, they are generally used for catching shoaling fishes such as herring, sprat, sand eel, mackerel, blue whiting and redfish. d) Species caught Many fisheries focus their efforts on harvesting top predators, whose removal can alter whole marine ecosystems, robbing food from marine mammals, seabirds and sharks. It is feared that fishing down a food web as top predators become scarcer may cause major changes in the structure of marine fish stocks. In the North Sea, for example, the cod caught are mainly younger than 3 years old, most of whom are immature, and therefore will not have reproduced. Current exploitation rates mean that only 4% of one-year-old fish survive to full maturity. It is generally accepted that fishing down food chains leads initially to increased catches, and then to declining yields, thus indicating the unsustainability of the process. Despite this, many fisheries have gradually changed their target from large, long-lived and
Pelagic trawl
Purse Seine

- 13 -
valuable carnivorous species to smaller, less valuable species that feed at lower trophic levels. The bulk of the world’s aquaculture production today, is of species that feed low in the food chain because increased rarity of fish at higher trophic levels makes it uneconomical to continue harvesting them. Pelagic fish such as herring, sandeels, sprat, horse mackerel, sardines and mackerel make up about 50% of total catches by the European fleet. However, species such as cod or larger pelagic fish are the economic heavy weights of the sector even though they represent less than 10% of the volume of total catches. Species such as sandeels, sprat and blue whiting are primarily intended for industrial uses such as fish meal and fish oil. The main species caught by the European fleet are shown below: Common name Latin name Fleets targeting species Anchovy Engraulis encrasicolus Es, F, P Blue Whiting Micromesistius poutassou Dk, De, Es, F, Ir, Nl, P, Sw, UK Bream Abramis brama Nl, P Cod Gadus morhua B, Dk, De, Es, Fin, F, Gr, Ir, It, Nl,
P, Sw, UK Dab Limanda limanda B, Dk, De, F, Nl, Sw, UK Eel Anguilla anguilla Nl, P, Sw European Seabass Dicentrarchus labrax P Greenland halibut Reinhardtius
hippoglossoides De, Es, P, UK
Haddock Melanogrammus aeglefinus Dk, De, F, Ir, Nl, Sw, UK Hake Merluccius merluccius B, Dk, De, Es, F, Gr, Ir, Nl, Sw, UK Herring Clupea harengus B, Dk, De, Es, Fin, F, Ir, Nl, P, Sw,
UK Horse mackerel Trachurus trachurus B, Dk, De, Es, F, Ir, Nl, P, Sw, UK Lemon sole Microstomus kitt B, Dk, De, F, Nl, Sw, UK Ling Molva molva De, Fr, UK Mackerel Scomber scombrus B, Dk, De, Es, Gr, F, Ir, Nl, P, Sw,
UK Megrim Lepidorhombus whiffiagonis B, Dk, De, Es, F, Ir, Nl, P, UK Monkfish Lophius piscatorius Es, F, Ir, Nl Norway lobster Nephrops norvegicus Dk, F, Ir, Nl, Es, Sw Norway pout Trisopterus esmarki Dk, Nl Perch Perca fluviatilis Nl Plaice Pleuronectes platessa B, DK, Ir, Nl, Es, UK Pollack Pollachius pollachius D, Nl, Es Prawn Pandalidae Dk, Fr, Nl, Sw, UK Rays & Skates Rajidae B Redfish Sebastes mentella D, Es Roundnose grenadier
Coryphaenoides rupestris De, UK
Saithe Pollachius virens F, D, Nl, Sw Salmon Salmo salar Fin, D, Sw Sandeel Ammodytes spp. Dk Sardine Sardina pilchardus P, Gr Scallops F, Ir Shellfish De, Ir, I, Nl, P, Es
- 14 -
Sole Solea solea B, Dk, F, Gr, Nl, Es Sprat Sprattus sprattus Fin, Nl, Sw Swordfish Xiphias gladius I, Es Trout Salmo trutta Nl, P Tuna Thunnus thynnus F, D, Ir, I, Es Turbot Psetta maxima P Vendace Coregonus lavaretus Sw, Fin Whiting Merlangius merlangus B, Nl, Es, UK
e) The environmental aspects of fishing All fishing activities have an impact on the ecosystem, but the severity of this impact and the time required to reverse its effects are often not known or fully understood. Fishing degrades habitats, and there is increasing concern that the removal of individuals from natural populations may also have consequences on biodiversity and/or the effective functioning of ecosystems, whether such removals are at a level which threatens species with extinction or local disappearance. The unintentional catch and discarding of juveniles or non-target species, known as bycatch, has been estimated to represent between 20% and 50% of animals caught by world commercial fisheries. Many species have their remains thrown overboard, often because they are too small to market or illegal to sell, and thus represent a large loss of income for fishermen. Many species die on board and so bycatch reduces the natural stock further.
Catches of Member States 1999
23%
19%
13%
10%
8%
6%
5%
5%
4%3%
2% 2%
DenmarkSpainUKFranceNetherlandsSwedenItalyIrelandGermanyPortugalFinlandGreeceBelgiumAustriaLuxembourg
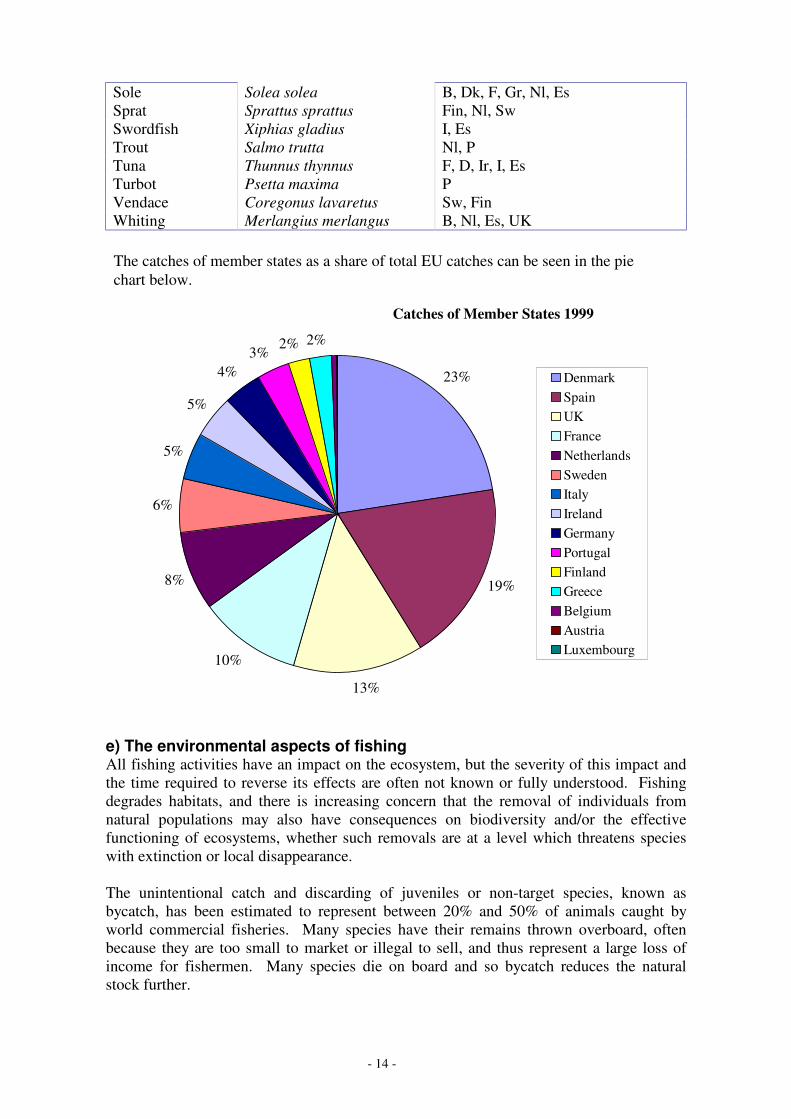
The catches of member states as a share of total EU catches can be seen in the pie chart below.

- 15 -
The impact of fishing on the environment is a global issue of growing concern. Concerns are mainly related to gear selectivity and habitat damage. For example, trawls are non-selective and can take considerable bycatch, which is often discarded. In addition, trawls sometimes interact with the bottom, leading to irreversible modifications to bottom ecosystems. Purse seines can also catch mammals and juvenile fish, while longlines and gillnets catch seabirds. Nets continue to catch and kill fish and other marine life unintentionally, often for many years after they are lost. Driftnets indiscriminately kill millions of marine creatures, while targetting for just one or two commercially valuable species. Beam trawls are designed for use on the sea bed, and in 1996 there were over 1 000 vessels in the EU utilising this type of gear, the largest of which were Dutch owned even if sailing under a German or British flag. These beam trawlers disturb an average 48% of the North Sea annually, primarily in the South, and beam trawling is also very unselective with a high percentage of bycatch. Constant sea bed disturbance results in changes in biodiversity, favouring fast breeding species such as certain small worms, which replace the long living animals. The stirring up of sediments also causes old pollutants to re-suspend. One of the most serious environmental problems affecting the marine environment, and especially the Baltic Sea, is pollution by dioxins and dioxin-like PCBs. This is primarily due to coastal industries, maritime transport and the discharge of sewage, and poses a significant potential threat to ecosystems, fish resources, the fishing industry and consumer health. Indeed, some fish and fish products contribute to the dioxin contamination of feed materials and thus enter the human food chain. The European Commission has therefore set stringent safety levels for dioxins and other contaminants in fish meal and fish oil, banning Sweden from exporting fish. Permission has, however, been granted by the Council to Finland and Sweden to continue marketing fish exceeding limits from the Baltic Sea on their own territory for local consumption until 2006. In the meantime, Scandinavian fish meal producers are looking for a decontamination method that is both effective and economically viable. 4. INLAND CAPTURE FISHERIES European inland waters have been highly modified by human activities for at least three centuries through channelisation, flood plain reclamation and, more recently, through water extraction and transfer to the point that few natural aquatic environments survive. Furthermore, many waterways are highly polluted. European inland fish stocks are utilised for two main purposes: food and recreation. Recreational fishery is the most
EU countries affected by dioxin contamination
Denmark: more than 200 000
tonnes of potentially contaminated fish. Mainly sandeel, sprat, herring and blue whiting,
Germany: 20% of the industrial herring catch,
Finland: 100 000 tonnes of sprat and herring,
Spain, Italy and Greece each have fairly significant quantities of catch with some risk of contaminated sardines,
Sweden: 90% of industrial fish, 270 000 tonnes, are threatened. Mainly sprat, herring, mackerel, sandeel and blue whiting.

- 16 -
powerful economically which means that inland rivers and small lakes are primarily managed for sport fishing, whilst commercial fisheries are a secondary objective in all but the largest lakes. The state of inland fishery resources is reflected by the state of the environment, and so where the environment is degraded, inland fisheries are managed by stocking with selected species. Unlike marine fish landings, there is no formal record of catches from inland fisheries in the European Union. However, the sector is only really of significant economic importance in a few Member States. Finland and Germany are the biggest producers, although much of this is derived from restocking from aquaculture facilities. The main species are carp, trout, eels and members of the perch family. Nevertheless, inland fish production provides significant contributions to protein supplies for other animals, providing a source of high quality and cheap animal protein. Most inland fish produce is consumed locally or marketed domestically. Increasingly, some inland fish products are also traded internationally generating additional wealth, and there is very little wastage as virtually all the fish caught are consumed.
5. RECREATIONAL FISHING There are an estimated 8 million recreational sea anglers in the European Union. Due to their collective expenditure on a whole variety of specialist fishing items, recreational anglers add substantially to the economy. The importance of recreational fishing can be seen throughout the EU, for example in the UK, recreational bass fishing is thought to be four times more valuable than commercial fishing of the same species. In Ireland angling tourism is second only to golf and worth ¼�������PLOOLRQ�DQG�������MREV���,Q�)LQODQG�WKHUH�were 550 times more recreational fishermen than professional in 1998, while in Germany an estimated 13 000 tonnes of fish are caught annually by recreational anglers. Recreational fishing may therefore have a greater socio-economic benefit to society than commercial fishing, due to accommodation costs, development of tourism and the creation of jobs.
European Inland Production 1999
35%
21%
19%
8%
5%
4%3%
2%
2% 1%
FinlandGermanyGreeceSpainItalyFranceIrelandNetherlandsUKSwedenBelgiumAustriaDenmarkLuxembourgPortugal
- 17 -
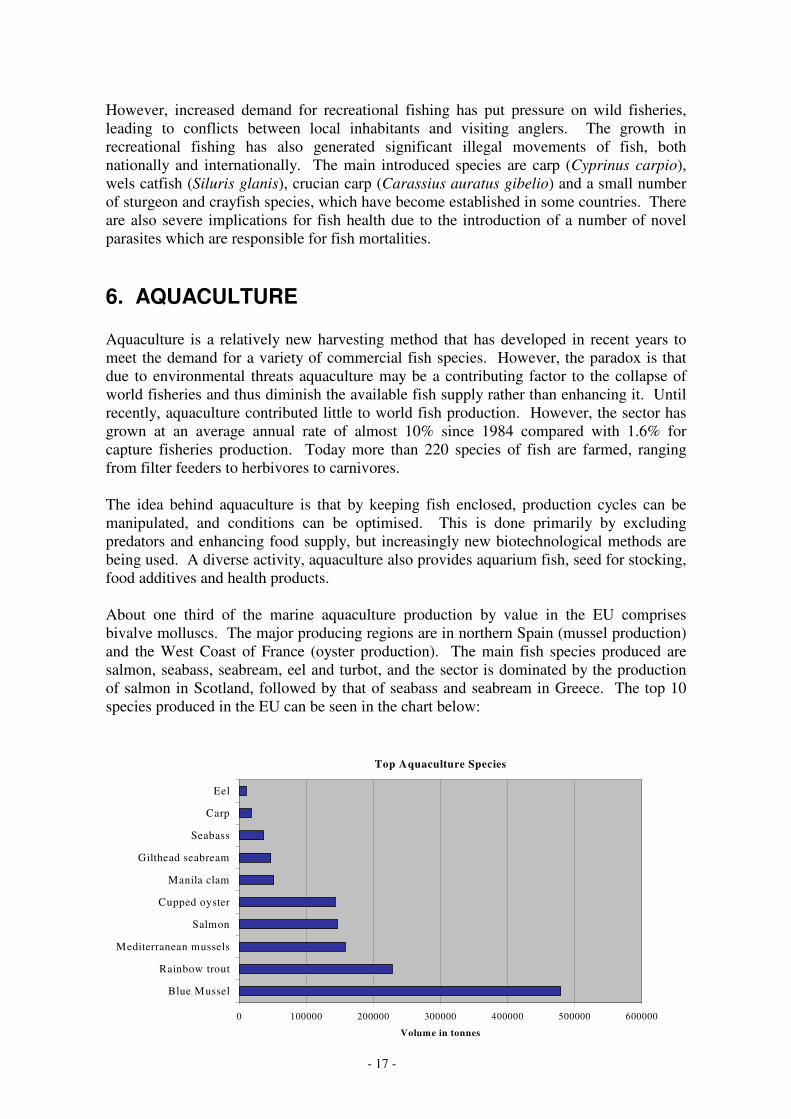
However, increased demand for recreational fishing has put pressure on wild fisheries, leading to conflicts between local inhabitants and visiting anglers. The growth in recreational fishing has also generated significant illegal movements of fish, both nationally and internationally. The main introduced species are carp (Cyprinus carpio), wels catfish (Siluris glanis), crucian carp (Carassius auratus gibelio) and a small number of sturgeon and crayfish species, which have become established in some countries. There are also severe implications for fish health due to the introduction of a number of novel parasites which are responsible for fish mortalities. 6. AQUACULTURE Aquaculture is a relatively new harvesting method that has developed in recent years to meet the demand for a variety of commercial fish species. However, the paradox is that due to environmental threats aquaculture may be a contributing factor to the collapse of world fisheries and thus diminish the available fish supply rather than enhancing it. Until recently, aquaculture contributed little to world fish production. However, the sector has grown at an average annual rate of almost 10% since 1984 compared with 1.6% for capture fisheries production. Today more than 220 species of fish are farmed, ranging from filter feeders to herbivores to carnivores. The idea behind aquaculture is that by keeping fish enclosed, production cycles can be manipulated, and conditions can be optimised. This is done primarily by excluding predators and enhancing food supply, but increasingly new biotechnological methods are being used. A diverse activity, aquaculture also provides aquarium fish, seed for stocking, food additives and health products. About one third of the marine aquaculture production by value in the EU comprises bivalve molluscs. The major producing regions are in northern Spain (mussel production) and the West Coast of France (oyster production). The main fish species produced are salmon, seabass, seabream, eel and turbot, and the sector is dominated by the production of salmon in Scotland, followed by that of seabass and seabream in Greece. The top 10 species produced in the EU can be seen in the chart below:
Top Aquaculture Species
0 100000 200000 300000 400000 500000 600000
Blue Mussel
Rainbow trout
Mediterranean mussels
Salmon
Cupped oyster
Manila clam
Gilthead seabream
Seabass
Carp
Eel
Volume in tonnes
- 18 -
a) Benefits of fish-farming Aquaculture can alleviate pressure on wild fisheries stocks either by increasing the production of popular fish, such as salmon thus reducing prices, or by farming fish such as tilapia as alternatives to ocean fish. Aquaculture in the European Union is also used for stock enhancement, using species such as carp. New technologies, such as hybridisation, have been used in a number of species to make fish more profitable by increasing growth rate, improving flesh quality, increasing disease resistance, and improving environmental tolerance. Techniques also allow sex to be controlled, and spawning to be induced. Aquaculture has also provided alternative employment in many fisheries-dependent regions. b) The perils of aquaculture Fish farming is one of the most intensive forms of animal husbandry on earth, and its products are widely believed to alleviate protein deficiency. This has led many people to believe that ocean fisheries are no longer under pressure. However, although this assumption may be valid for herbivorous species, carnivorous fish need large inputs of wild fish for feed, and the provision of this often destroys habitats where wild stocks breed. Many aquaculture systems will also use 2-5 times more fish protein to feed farmed species than is supplied by the farmed product. Aquaculture may therefore be one of the factors causing a decline of wild fish stocks. Besides being expensive, vitamin enriched pellets as well as fish faeces may build up underneath densely stocked pens if currents are weak, causing nutrient-rich sediment to overload bottom-dwelling organisms, thus depleting oxygen and so killing other fish. Aquaculture ponds are frequently constructed in mangroves, which are ideal nursery areas for young wild fish stocks and also provide coastal protection. Ponds may therefore change the aquatic flora and fauna thus altering the behaviour and distribution of local fish. High-density farms are often supported by using a greater input of commercial feed and chemicals and, when released into the environment, these wastes can cause pollution. Also the extensive use of drugs, such as antibiotics found in fish feed, may have adverse effects on the environment and the health of wild fish stocks. As much as 40% of Atlantic salmon (Salmo salar) caught by fishermen in areas of the North Atlantic Ocean are of farmed origin suggesting a high escape rate and providing a substantial possibility that released fish reproduce in the wild. 7. COMMON FISHERIES POLICY a) Background After almost 20 years, the Common Fisheries Policy (CFP) has not succeeded in ensuring the sustainable exploitation of fisheries resources, and so the reform is confronted with major challenges. Many stocks are presently outside safe biological limits with low quantities of mature fish, and yet are still being heavily exploited. Demersal fish, such as hake, cod and whiting, are particularly affected, and stock sizes and landings have declined dramatically over the last 25 years. If current trends continue many European fish stocks will collapse. The current situation of resource depletion is primarily due to annual catch limits set in excess of those proposed by the Commission on the basis of scientific advice. Also, the European fleet greatly exceeds the capacity required for sustainable harvest and poor management and enforcement of decisions has contributed to overfishing.

- 19 -
Most of the European fisheries sector also faces economic fragility, poor financial profitability and steadily declining employment. Demand for fishery products, which are becoming scarcer, has increased along with fish prices, and therefore fishermen have been sheltered against the effects of declining stocks. The forthcoming enlargement of the EU, the globalisation of the economy and the expansion of many fishing industries in developing countries also add to the challenge of reforming the CFP. b) Objectives The overall objective of fisheries policy is to ensure effective conservation, management and development of living aquatic resources with due respect for the ecosystem in order to provide a vital and permanent source of food, employment, recreation and trade. Thus the objectives of the CFP are to: 1. Establish responsible and sustainable fisheries and aquaculture activities that ensure
healthy marine ecosystems and maintain the quality, diversity and availability of marine resources and habitat.
2. Reduce the negative environmental impact of other human activities, such as maritime transport, oiling and dredging.
3. Integrate health requirements in order to protect public health and safety. 4. Bring fleet capacity into line as soon as possible with the availability and sustainability
of the resources. 5. Promote better governance by putting in place more transparent, accountable and
flexible management and decision-making processes. 6. Secure an economically viable and self-sufficient fisheries and aquaculture sector
which can be competitive in a globalised economy, and ensure the stable supply of fish at reasonable prices for the consumer.
7. Address the problems of structural adjustment that will result from a commitment to sustainable fisheries.
8. Promote the responsible and rational exploitation of fishery resources in international waters and develop partnerships with third countries.
9. Improve the quality and amount of relevant data to support decision making, and to promote multidisciplinary scientific research.
10. Ensure a fair standard of living for those who depend on fishing activities. c) Reforms In order to ensure sustainable exploitation, multiannual management plans, based on the best available scientific advice and methods, will be implemented for the conservation of commercial stocks. They will be designed to avoid the risk of stock collapse by keeping stock size and fishing mortality rates within long-term safe levels and by ensuring the safe recovery of depleted stocks. Thus while taking into account the need to conserve biodiversity and minimise the impact on habitats, they will ensure high and stable yields in subsequent years. Organic aquaculture will be promoted, and rules will be imposed to respect the welfare, biological needs and health of farmed fish. Aquatic pollution such as eutrophication due to nutrient outputs will be reduced, and measures will prevent the introduction and escape of alien species. An essential part of the multiannual management plan will be limiting fishing effort, which will therefore cause a reduction in the activity of the existing fleets. Over capacity in fishing fleets not only constitutes a risk to the survival of fish stocks, but also produces negative economic effects in the fishing industry. Public aid promotes over-supply of capital and so each subsidised fishing vessel reduces the productivity and profitability of

- 20 -
every other vessel. Thus future aid will be restricted for modernisation, renewal and export of fishing vessels. Although it is not yet possible to quantify the regional employment effects of limiting fishing effort, it is thought that a maximum of 28 000 fishermen (representing 11% of the total employment at sea) could be affected by these measures. Structural funds will therefore be reprogrammed to deal with the resulting socio-economic impacts, and the reform will establish a balance between fleet capacity and exploitation rates consistent with long-term management objectives. In order to protect the most sensitive part of the coastal zone and to preserve traditional fishing activities, access to fishing in the 6-to-12 mile zone will continue to be reserved for vessels operating out of adjacent ports and those with historical rights. This will be ensured by enforcing the CFP with uniform rules, including sanction levels and measures to prevent the continuation of serious infringements. d) The future The current poor performance of the CFP proves that many of the instruments applied over the last twenty years have reached their limits. Thus in a state of serious crisis, there is an urgent need of a major reform to the CFP. Reforming objectives, principles, priorities and instruments is therefore critical in order to ensure a sustainable future of the European fishing industry. 8. SUSTAINABILITY The future of world fisheries will be determined by whether we can manage our resources sustainably, regardless of whether traditional fisheries methods or aquaculture dominates our provision of fish. Safety issues are paramount for the perpetuity of the fishing industry, and so many European fleets have been modernised, which in some cases has directly affected the total capacity and tonnage of the fleet. Member States requiring assistance in order to ensure that satisfactory health and safety measures are implemented, apply to the Financial Instrument for Fisheries Guidance (FIFG) which operates on a co-financing principle allowing projects to be funded provided there is governmental input from the Member State concerned. The EU fisheries budget for 2000-2006 amounts to over ¼�����PLOOLRQ�DQG�LV�SUHGLFWHG�WR�be distributed as follows: 18.1% will go to decommissioning, 23.2% to renewal/modernisation of the fleet and 58.7% to aquaculture, processing, port facilities and other areas. However, the Commission’s proposals to reform the Common Fisheries Policy seek to radically alter these targets by, for example, switching aid from renewal and modernisation to scrapping. The current plans for distribution of the money received from the European Union is outlined below, and is staggered over a 7-year period.

- 21 -
Maintaining the present rate of consumption in the face of human population growth will require about 19 million additional tonnes of seafood every year from 2010. Assessments of world fishery resources suggest that production from conventional capture fisheries is unlikely to increase in the near future. One potential way to produce the extra food required is to reduce the amount of fish fed to livestock (currently about 1/3) and allow it to be consumed by humans instead. However, even in this case, fish supplies may only last for about 20 years. Many scientists therefore expect most of the increase in fish production to come from aquaculture, but some believe that because overfishing is not the only cause of decline of wild fish, aquaculture alone cannot cause a rebound in wild fish populations, but only provide the fish required for human consumption. Some suggest that capture fishery landings will remain relatively stable over the next 15 years, providing that novel fish products can be successfully marketed. High priority must be placed on making better use of existing catches, for example by reducing post-harvest losses, or retaining bycatch. In developing nations, the utilisation of the capture is almost 100%, and therefore traditional capture fisheries should be able to reduce the amount of bycatch. Better on-board preservation facilities could reduce the high levels of wastage, estimated at 10% of fish caught.
Budget for 2000-2006given to Member States
Spain45%
Greece6%
Germany6%
AustriaUK6%
Sweden2%
Belgium1% Denmark
6% Finland1%
France8%
Ireland2%
Italy10%
Luxembourg0%
Netherlands1%
Portugal6%
- 22 -
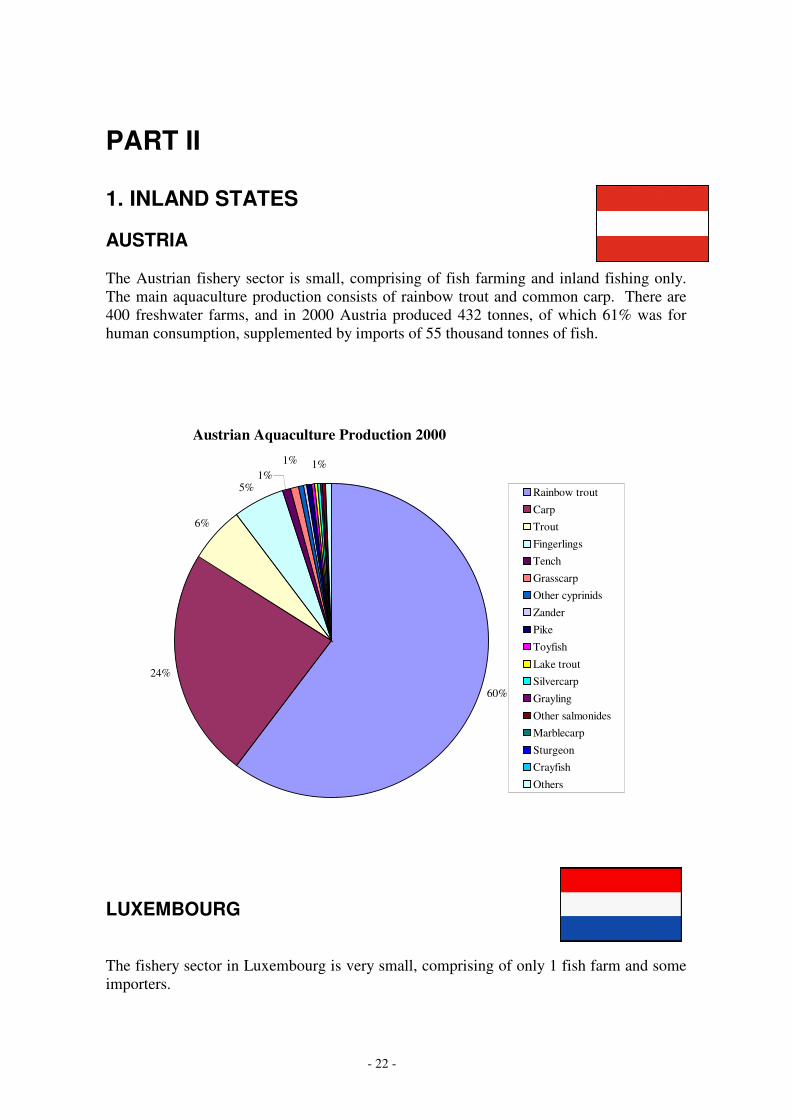
PART II 1. INLAND STATES AUSTRIA The Austrian fishery sector is small, comprising of fish farming and inland fishing only. The main aquaculture production consists of rainbow trout and common carp. There are 400 freshwater farms, and in 2000 Austria produced 432 tonnes, of which 61% was for human consumption, supplemented by imports of 55 thousand tonnes of fish.
LUXEMBOURG The fishery sector in Luxembourg is very small, comprising of only 1 fish farm and some importers.
Austrian Aquaculture Production 2000
60%
24%
6%
5%
1%1%
1%
Rainbow trout
Carp
Trout
Fingerlings
Tench
Grasscarp
Other cyprinids
Zander
Pike
Toyfish
Lake trout
Silvercarp
Grayling
Other salmonides
Marblecarp
Sturgeon
Crayfish
Others

- 23 -
Main species landed
0
2000
4000
6000
8000
10000
Plaice Cod Commonsole
Rays Skates
Ton
nes
2. COASTAL STATES BELGIUM Species Caught The total catch in 1999 by the Belgian fleet was 29 876 tonnes. Plaice catches are the most important landed species in weight, as shown below. In terms of value, sole represents about 50% of the total value of ¼� ����� PLOOLRQ� Common bycatch species include turbot, lemon sole and dogfish. Fishing grounds change throughout the year, although in 1998 the catches of the Belgian fleet were divided as follows: Southern/Central North Sea 64%, Irish Sea 8%, English Channel 11%, Celtic Sea 13%, North Sea & Bay of Biscay 4%.
Fleet The Belgian fleet has 169 vessels, most of which are beam trawlers for flatfish and shrimps, accounting for 89% of landings. The Belgian otter trawl fleet consists of 18 vessels, mostly side trawlers, which fish for Norway lobster producing 4% of the total landings in Belgium. A significant part of the fleet is under Dutch ownership, and all the vessels are over 10m in length. There are three ports in Belgium and the percentage of catch landed by the Belgian fleets in 1998 was Zeebrugge 65%, Oostende 31%, and Nieuwpoort 4%. Fleets from the Netherlands, France, Denmark and Germany also land their catches in Belgium. The Belgian fleet has seen the largest percentage of fleet reduction within the EU between 1998 and 2002, where the fleet was reduced by 36.4%.
- 24 -
Main Aquaculture Species
Trout49%
Tilapia24%
Eel15%
Carp12%
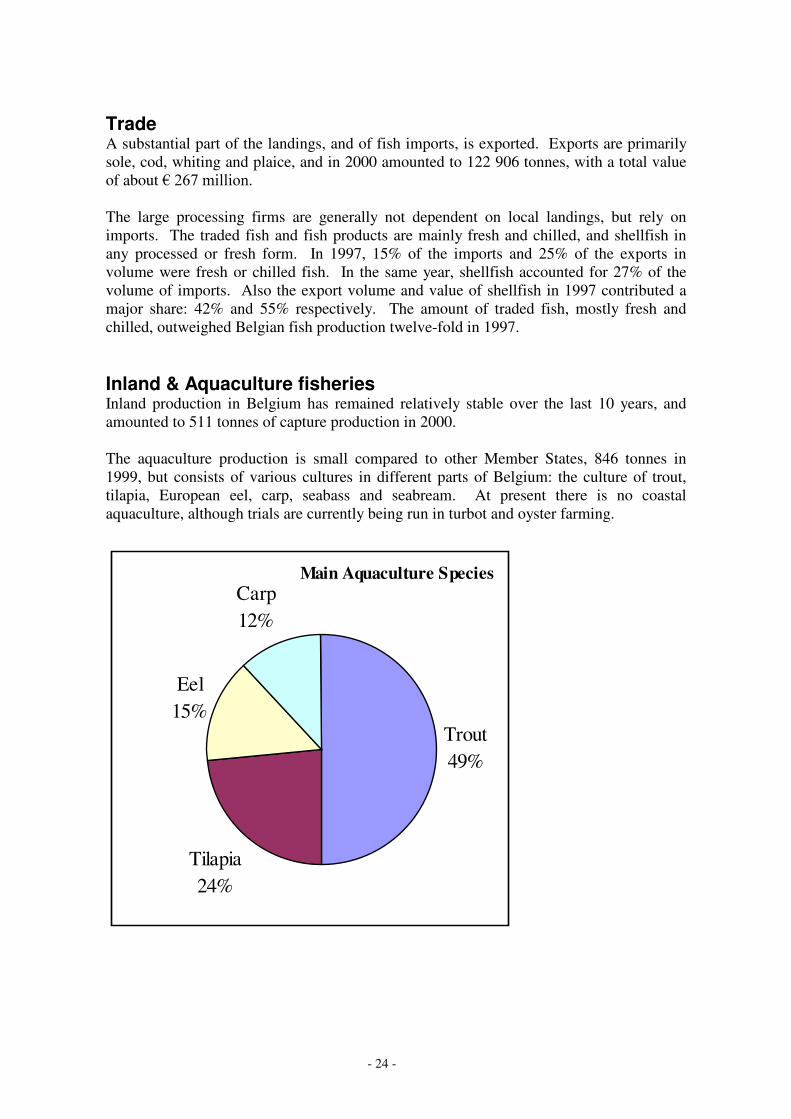
Trade A substantial part of the landings, and of fish imports, is exported. Exports are primarily sole, cod, whiting and plaice, and in 2000 amounted to 122 906 tonnes, with a total value of about ¼�����PLOOLRQ� The large processing firms are generally not dependent on local landings, but rely on imports. The traded fish and fish products are mainly fresh and chilled, and shellfish in any processed or fresh form. In 1997, 15% of the imports and 25% of the exports in volume were fresh or chilled fish. In the same year, shellfish accounted for 27% of the volume of imports. Also the export volume and value of shellfish in 1997 contributed a major share: 42% and 55% respectively. The amount of traded fish, mostly fresh and chilled, outweighed Belgian fish production twelve-fold in 1997. Inland & Aquaculture fisheries Inland production in Belgium has remained relatively stable over the last 10 years, and amounted to 511 tonnes of capture production in 2000. The aquaculture production is small compared to other Member States, 846 tonnes in 1999, but consists of various cultures in different parts of Belgium: the culture of trout, tilapia, European eel, carp, seabass and seabream. At present there is no coastal aquaculture, although trials are currently being run in turbot and oyster farming.

- 25 -
Main species landed
0
100000
200000
300000
400000
500000
600000
Sandeels Sprat Herring Bluemussels
Bluewhiting
Ton
nes
DENMARK Species Caught Denmark lands about 22% of the total EU catch by volume, most of which is used for reduction and is of relatively low unit value. Denmark exploits a large number of species in Danish waters, as long-distance fishing is not very well developed. The most important catches for human consumption are cod, plaice and herring. Species such as sole and Norway lobster are important because of their very high market price, while other important species are roundfish, flatfish and mackerel.
Fleet The Danish fleet is quite small for the EU, with 4 160 registered vessels in 2000. Of these, 74% fish in inshore waters. The Danish fishery targets single species, with the larger vessels fishing almost exclusively for herring for human consumption and sprat designed for fish meal reduction. The main Danish fishing areas are located in the North Sea, Skagerrak/Kattegat and the Baltic Sea. Fish for reduction are almost exclusively caught in the North Sea while the fisheries for Norway lobster in the Kattegat and for blue mussels in Limfjorden are of significant local importance. Most of the main fishing ports are located along the north and West Coast of Jutland, while Bornholm Island in the Baltic Sea is also a centre of landings. Foreign vessels land another 165 000 tonnes of fish for human consumption and 250 000 tonnes for reduction in Danish ports. Main contributors from the EU are Sweden, UK and Germany, while Norway and the Baltic States are the main non-EU contributors.

- 26 -
Main Aquaculture Species
Trout94%
Eel6%
Clam0%
Fishmeal exports to EU countries
39%
25%
12%
9%
2%2%4%
5%
1% 1%
GreeceItalySpainNetherlandsFinlandFranceGermanyUKBe/LuxPortugalAustriaSwedenIreland
Trade The importance of Denmark in terms of a major European producer, is almost entirely due to the reduction sector of the processing industry which targets small pelagic species like sandeel and Norway pout that are not in demand for human consumption. Fish meal is then exported throughout the EU as shown in the adjacent pie chart. There are about 140 plants making a variety of products of nearly all fish species landed, and canned products, primarily of herring, mackerel and blue mussels. There are a further 60 factories producing smoked products of salmon, trout, herring, mackerel, Greenland turbot and eel, and some cured, dressed and marinated products. The processing industry gets its raw material from both local landings and imports, although the smoking factories have a particularly high rate of imported raw material in their production. Denmark is one of few EU nations where exports approximately balance imports at around 1.2 million tonnes. More than 40% of Danish imports come from the Faeroe Islands or other Nordic countries, especially Norway. Measured in value, close to 50% of the imports consist of shrimp, mainly imported from Greenland. The second most important commodity, roughly amounting to 20%, is cod. Finally, salmon accounts for about 15%. A substantial part of the fish caught for human consumption and landed in Denmark is exported unprocessed as whole fresh fish or as fresh fillets. Inland and Aquaculture fisheries Although Denmark does not differentiate between inshore and offshore fishing activities, the production of fish in fjords, belts, coastal zones and the Southern Sea is substantial, and utilised by a large number of smaller fishing vessels with passive gear. The freshwater fish stocks, as well as eel and migratory salmonoids, present in the freshwater environment are also exploited by anglers eligible to fish with a limited range of fixed fishing gear in their own waters. Inland production in 2000 therefore amounted to 183 tonnes.
Danish freshwater aquaculture produces 32 000 tonnes of rainbow trout and eggs a year. At present 234 businesses run 433 aquaculture plants with an estimated 95% of the produce going for export, mainly other parts of Europe. About one third of the export is live fish, one third fresh whole fish and one third processed fish. The 30 eel farms produced 1 200 tonnes of eel in 1997 in land-based re-circulation systems based on imports of glass eels primarily originating from France. A substantial amount of the output is processed as kabayaki for the Japanese market.

- 27 -
Marine Catch 2001
93%
Baltic herring
Cod
Flounder
Pike
Vendace
Whitefish
Salmon
Sea trout
Rainbow trout
Smelt
Bream
Ide
Roach
Burbot
Perch
Pikeperch
Others
FINLAND Species Caught The commercial Finnish catch in the Baltic Sea fisheries in 1999 was 144 520 tonnes with a total value of about ¼�������PLOOLRQ�� �7KH�PRVW� LPSRUWDQW� VSHFLHV�FDSWXUHG�ZDV�%DOWLF�herring, which represented over 90 % of the total catch, about three-quarters of which was used for animal feed. Other valuable species were whitefish, salmon, sprat and cod.
Fleet In 2000, the fishing fleet consisted of 3 762 vessels. Bottom or pelagic trawls in the Gulf of Bothnia produces two-thirds of the Baltic herring catch, while the majority of the sprat is caught in the southern part of the Baltic and the Sea of Åland. The fleet is composed of less than 1% of bottom trawlers, 2% passive gear vessels, 5.5% pelagic trawlers and 91.5% vessels for small-scale coastal fisheries. There are 67 fishing harbours along the Finnish coast, and a further 30 harbours by the largest lakes.

- 28 -
Main Aquaculture Species
Trout
Pollan
Trade In 1997, the Finnish fish processing industry used about 39 000 tonnes of fish, of which 84% was domestic. The most important domestic species are Baltic herring and rainbow trout, but processing also occurs of whitefish, herring, salmon and mackerel. The main processing methods are filleting and smoking. Fresh fish and processed fish products are distributed to consumers by a wide network of over 200 small companies. Finland is a leading fur farming and pelt producer and as much as 70-80% of Baltic herring is used as fur animal feed. They are also fed with sprat and low value species caught in mass removal inland fisheries. Finland imports fish for human consumption and also for animal feed. Most of the 90 000 tonnes of imported fish in 2000 came from Norway, Sweden and Denmark, although some also came from Iceland, Thailand and Germany. Around half the processing companies are situated in the Province of Western Finland, and process 70% of the total amount of fish. Processing of imported raw material is primarily based on herring and salmon. Typical products include fresh, chilled or frozen salmon, whitefish, redfish, fillets of saithe, canned and preserved tuna, canned herring and Baltic herring, shrimps and other crustaceans and molluscs. Overall about half of the fish was filleted, a quarter frozen and one-sixth smoked. Some 16 300 tonnes of fish for human consumption were exported from Finland in 2000, at a value of about ¼����PLOOLRQ���:KLOH�PXFK�RI�WKLV�LV�GHVWLQHG�IRU�WKH�1RUZHJLDQ�DQG�Swedish markets, those products for the Japanese market included roe and rainbow trout at a value of ¼���PLOOLRQ� Inland & Aquaculture fisheries Finland produced 36 813 tonnes of inland fish in 2000, some 43% of the total EU inland production, although representing only 19% of the total Finnish production of fish. The most important species was vendace (Coregonus albula), one third of which was caught by winter seine under ice. Aquaculture production amounted to over 15 thousand tonnes in 1999, worth at least ¼����thousand, and consisting mainly of rainbow trout and whitefish. There are two aquaculture sectors: food fish farming, and rearing fish juveniles for restocking. Coastal aquaculture is concentrated in southwestern Finland and also consists primarily of rainbow trout.
Freshwater catch 2000
2%
54%
7%
6%
4%
18%
1%
5% 1%
2%
PikeVendaceWhitefishSalmonBrown troutSmeltBreamRoachBurbot PerchPikeperchOthers
- 29 -
Main species landed
010000200003000040000500006000070000
Skipjacktuna
Yellowfintuna
Pilchard Horsemackerel
Anchovy
Ton
nes
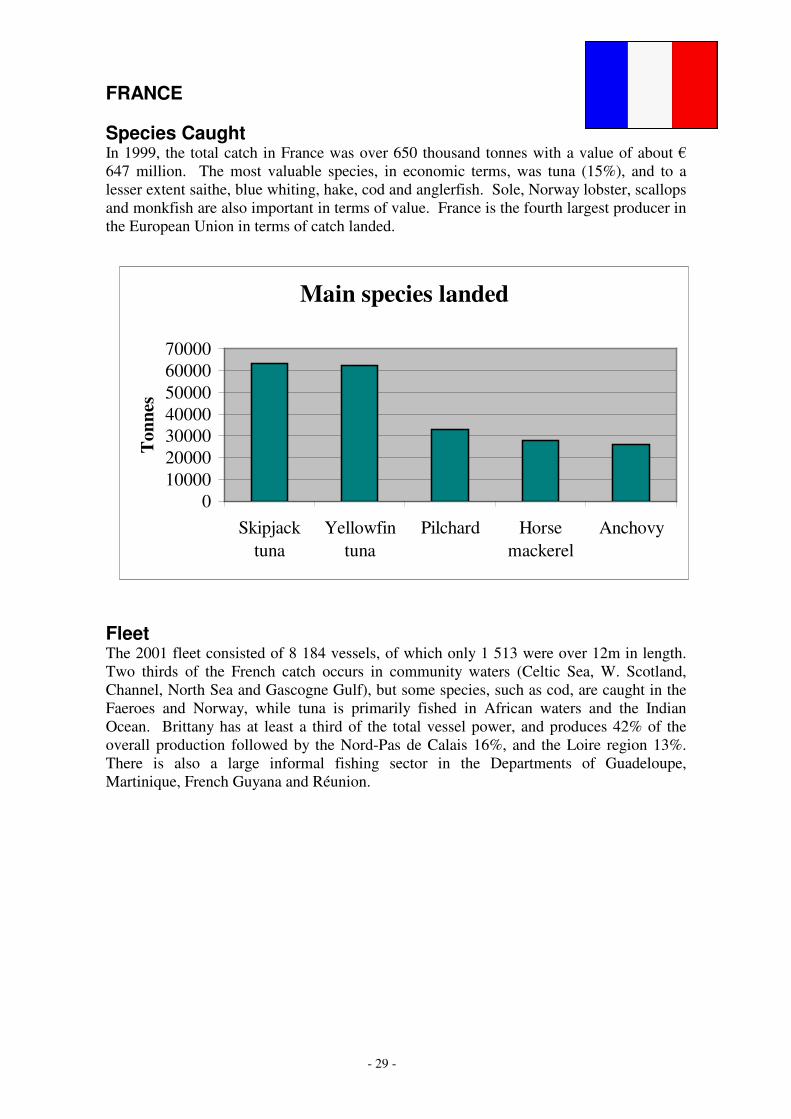
FRANCE Species Caught In 1999, the total catch in France was over 650 thousand tonnes with a value of about ¼�647 million. The most valuable species, in economic terms, was tuna (15%), and to a lesser extent saithe, blue whiting, hake, cod and anglerfish. Sole, Norway lobster, scallops and monkfish are also important in terms of value. France is the fourth largest producer in the European Union in terms of catch landed.
Fleet The 2001 fleet consisted of 8 184 vessels, of which only 1 513 were over 12m in length. Two thirds of the French catch occurs in community waters (Celtic Sea, W. Scotland, Channel, North Sea and Gascogne Gulf), but some species, such as cod, are caught in the Faeroes and Norway, while tuna is primarily fished in African waters and the Indian Ocean. Brittany has at least a third of the total vessel power, and produces 42% of the overall production followed by the Nord-Pas de Calais 16%, and the Loire region 13%. There is also a large informal fishing sector in the Departments of Guadeloupe, Martinique, French Guyana and Réunion.

- 30 -
Main Aquaculture Species
Oysters55%
Mussels24%
Trout18%
Carp2%
Seabass1%
Trade French consumption of fish is twice that of the production, therefore imports (1 million tonnes in 2000) consist of salmon, shrimp, tuna, cod, and prawns, mainly from Norway and Spain. France also exports about 480 thousand tonnes of fresh fish annually. Processing is split into primary processing and wholesaling (mareyage), and secondary processing. Inland & Aquaculture fisheries Inland production reduced by a drastic 50% in 1999, but the level has since remained stable with a production of about 2 131 tonnes a year. Aquaculture in France is third in terms of production within the European Union. Thus a total of over 267 thousand tonnes were produced in 2000, primarily oysters and mussels, but also freshwater fish such as trout and eels, and marine fish such as turbot and salmonids. Traditional extensive fish farming in French freshwater ponds, mainly of carp, is almost entirely dedicated to stock enhancement operations. Intensive farming of salmonids is, on the contrary, based on rainbow trout and used for stock enhancement of recreative fisheries.
- 31 -
Main species landed
0100002000030000400005000060000
Herring Horsemackerel
Sardines Cod Mackerel
Ton
nes
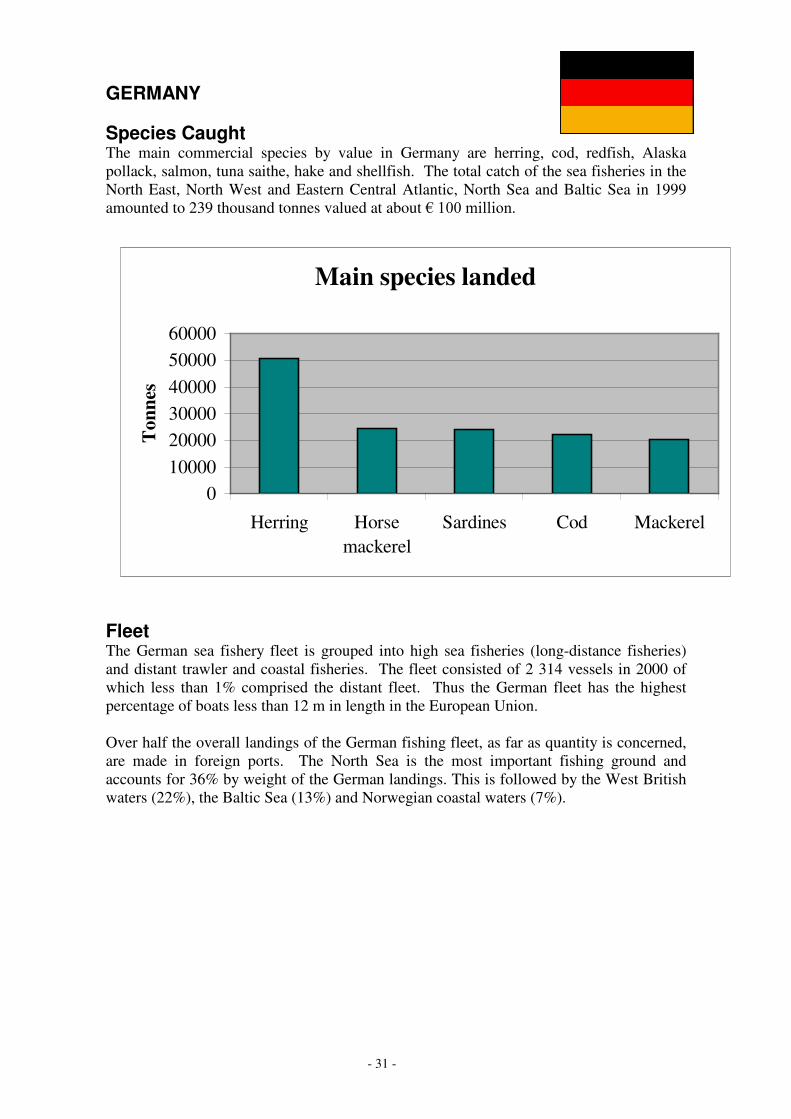
GERMANY Species Caught The main commercial species by value in Germany are herring, cod, redfish, Alaska pollack, salmon, tuna saithe, hake and shellfish. The total catch of the sea fisheries in the North East, North West and Eastern Central Atlantic, North Sea and Baltic Sea in 1999 amounted to 239 thousand tonnes valued at about ¼�����PLOOLRQ�
Fleet The German sea fishery fleet is grouped into high sea fisheries (long-distance fisheries) and distant trawler and coastal fisheries. The fleet consisted of 2 314 vessels in 2000 of which less than 1% comprised the distant fleet. Thus the German fleet has the highest percentage of boats less than 12 m in length in the European Union. Over half the overall landings of the German fishing fleet, as far as quantity is concerned, are made in foreign ports. The North Sea is the most important fishing ground and accounts for 36% by weight of the German landings. This is followed by the West British waters (22%), the Baltic Sea (13%) and Norwegian coastal waters (7%).

- 32 -
Main Aquaculture Species
Trout34%
Carp14%
Oysters
Cockles
Mussels52%
Trade Germany has a large fish processing industry that is relatively independent of the German and EU quota, relying largely on imported raw materials. The main processing centres are located on the North Sea coastline. German production is purely for human consumption with the largest part (27%) consumed as canned fish (herring, mackerel). Frozen fish accounts for 24% and fresh fish for 15% of per caput consumption, with ’trash’ fish and offal used for reduction. A recent decrease in quantity of important sea fish species has caused an increase in prices. The main imported product in Germany is therefore frozen filleted sea fish, used as raw material for the fish processing industry. This accounted for 26% by weight of the total 1.1 million tonnes of fish imported in 2000. Approximately two-thirds of German imports originate from non-EU countries such as Norway and the former Soviet Union. German exports amounted to 529 thousand tonnes in 2000, and were bought primarily by the Netherlands followed by Spain, Iceland and Denmark. Inland & Aquaculture fisheries Inland production in Germany amounted to almost 23 thousand tonnes in 2000, the second largest amount in live weight in the EU, and 26% of the total EU inland production. Species caught were primarily vendace, pike and pikeperch. The German aquaculture sector deals mainly with the traditional carp, trout and blue mussel culture.
- 33 -
Main species landed
0
2000
4000
6000
8000
10000
12000
14000
16000
18000A
ncho
vy
Med
iterr
anea
nm
usse
l
Pilc
hard
Pica
rels
Bog
ue
Ton
nes
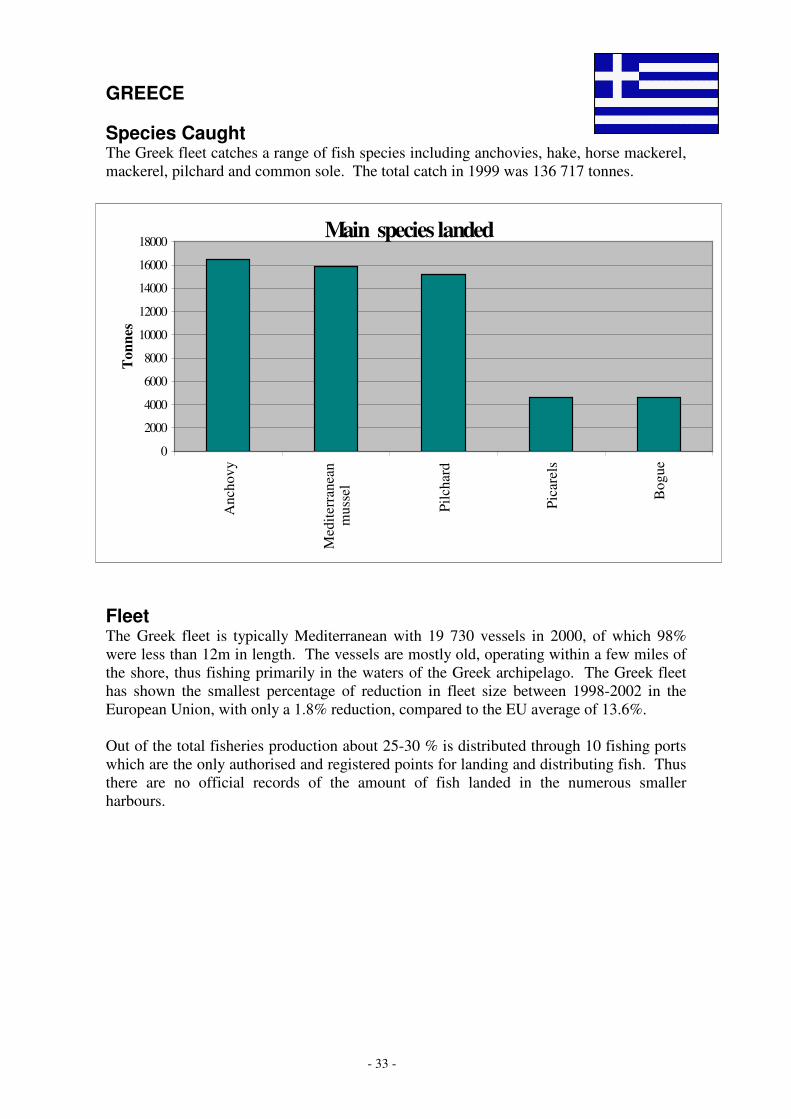
GREECE Species Caught The Greek fleet catches a range of fish species including anchovies, hake, horse mackerel, mackerel, pilchard and common sole. The total catch in 1999 was 136 717 tonnes.
Fleet The Greek fleet is typically Mediterranean with 19 730 vessels in 2000, of which 98% were less than 12m in length. The vessels are mostly old, operating within a few miles of the shore, thus fishing primarily in the waters of the Greek archipelago. The Greek fleet has shown the smallest percentage of reduction in fleet size between 1998-2002 in the European Union, with only a 1.8% reduction, compared to the EU average of 13.6%. Out of the total fisheries production about 25-30 % is distributed through 10 fishing ports which are the only authorised and registered points for landing and distributing fish. Thus there are no official records of the amount of fish landed in the numerous smaller harbours.

- 34 -
Trade Greece produces whole fresh fish, and the salting industry is particularly important especially for pelagic fish such as sardine, anchovy and hake. Total imports amount to 168 thousand tonnes, while exports are in the region of only 88 thousand tonnes annually. Inland & Aquaculture fisheries The inland production in Greece in 2000 was of 3 433 tonnes. This production has been steadily increasing over the last decade or so, and is becoming increasingly import as a supply of fish. The aquaculture sector is also expanding, and mainly produces seabass and seabream. In 1999, the production was of 79 265 tonnes. Greek hatcheries generate large revenues, as they are a major supplier of juvenile fish.
Main Aquaculture Species
Seabass31%
Mussels22%
Mullet1%
Trout3%
Seabream43%
- 35 -
Main Species landed
010000200003000040000500006000070000
Mackerel Horsemackerel
Herring Bluewhiting
Norwaylobster
Ton
nes
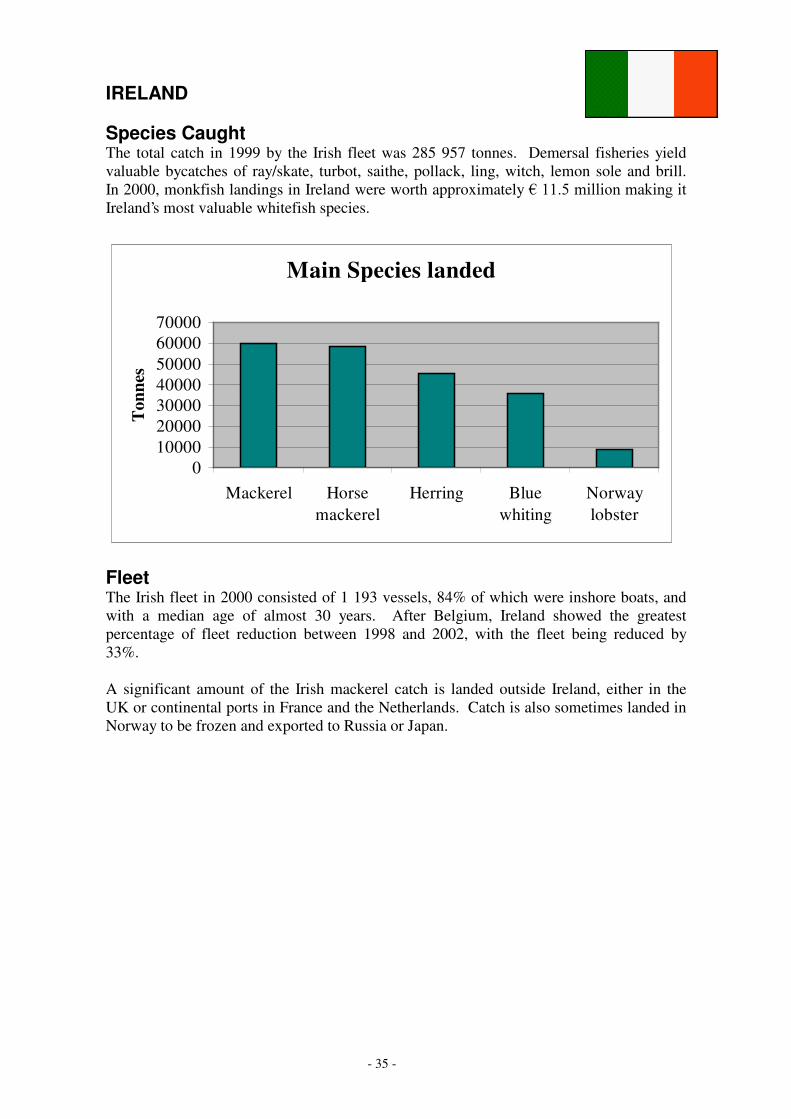
IRELAND Species Caught The total catch in 1999 by the Irish fleet was 285 957 tonnes. Demersal fisheries yield valuable bycatches of ray/skate, turbot, saithe, pollack, ling, witch, lemon sole and brill. In 2000, monkfish landings in Ireland were worth approximately ¼������PLOOLRQ�PDNLQJ�LW�Ireland’s most valuable whitefish species.
Fleet The Irish fleet in 2000 consisted of 1 193 vessels, 84% of which were inshore boats, and with a median age of almost 30 years. After Belgium, Ireland showed the greatest percentage of fleet reduction between 1998 and 2002, with the fleet being reduced by 33%. A significant amount of the Irish mackerel catch is landed outside Ireland, either in the UK or continental ports in France and the Netherlands. Catch is also sometimes landed in Norway to be frozen and exported to Russia or Japan.

- 36 -
Trade While cod landed in Ireland is normally sold in Ireland, a large part of the Norwegian lobster catch is used in the processing industry to produce ’scampi’. Catches landed at homeports are usually frozen whole or filleted and then frozen for export to a number of African and other countries in Europe and Asia. Of the fish landed in homeports 70%, about 218 thousand tonnes are exported at a value of about ¼� ���� PLOOLRQ�� � 2I� WKHVH�exported products, 25% by volume are shipped live, fresh or chilled, 61% frozen, and 14% processed. Dried, salted or brined fish and cooked crustaceans constitute the main processed products, with the remainder smoked, breaded, oil preserved or processed to fish meal. Megrim landed in Ireland is exported to Spain and France where there is good market demand. Inland & Aquaculture fisheries Neither the inland nor the aquaculture production in Ireland has reached significant levels, either on a national or a European basis. The inland production in 2000 was of 961 tonnes, while the aquaculture production in 1999 was of 44 thousand tonnes, primarily of the species shown below.
Main Aquaculture Species
Salmon41%
Mussels37%
Oysters17%
Trout5%
Clam0%

- 37 -
ITALY Species Caught With a total capture production of 299 949 tonnes in 2000, the Italian catch is composed primarily of demersal fish, crustaceans and cephalopods (64%), followed by clams (17%), small pelagic fish (17%), and swordfish and tuna (2%). Bottom trawling accounts for 47% of total capture. The catch is mainly composed of finfish of different quality, but the percentage of molluscs and crustaceans in the overall total is increasing.
Fleet The Italian fleet, widely distributed along the 8 000 km coastline, has 17 664 vessels, 98.8% of which are under 12m in length, which after Germany is the second highest proportion of inshore fleet in the EU. There are about 200 harbours where marine catches are landed, the main ones of which are located in Sicily and in the Adriatic coast, where more than half of the bottom trawling catch comes from. The main ports in terms of landings are Mazara del Vallo, Ravenna, Ancona, Bari and Palermo. Pelagic trawling is concentrated along the Adriatic coast but represents only 2% in value due to the low prices of catch. Purse seining for small pelagics also corresponds to 6% in weight, making up 3% of total value, while gillnets represent 7% in weight and 11% in value. Hydraulic dredgers concentrated in the central and northern Adriatic capture Venus clams, contributing 10% in weight and 5% in value of national landing. Purse seining fleet landings consists primarily of sardines and anchovies, about half of which go to be processed. The catch from smaller vessels is mainly for human consumption comprising a wide variety of species, which is often sold directly to local fish markets or restaurants without processing or going through wholesalers.
Main species landed
05000
10000
1500020000
2500030000
35000
4000045000
Anchovy Mediterraneanmussel
Striped venus Pilchard Hake
Ton
nes

- 38 -
Trade The fish-processing sector in Italy has been facing a difficult financial situation for some years due to high labour costs and the nessecity of importing all raw material. Tuna processing is the most important segment of the Italian industry, with production in 1995 of 83 000 tonnes with a value of ¼�����PLOOLRQ���2WKHU�LPSRUWDQW�SURFHVVHG�SURGXFWV�DUH anchovies, sardines, carpet shell clams and other bivalves, squids and cuttlefish (for a total production of about 9 000 tonnes). However, tuna canning and sardine processing are coming under pressure from cheaper third country imports. Italy imports huge quantities of seabass and seabream from Greece and other Mediterranean countries in order to supplement the domestic fish supplies of both fresh and frozen products. Considerable quantities of fish meal are also imported for animal feed, and so in 2000 imports totalled 826 767 tonnes, most of which was fresh or frozen products. Italy also exports about 140 thousand tonnes. Inland & Aquaculture fisheries The 2000 inland capture production in Italy was of 4 565 tonnes, which consists primarily of relatively small trout farms. Some carp and tench were also produced. Aquaculture has become one of the Italian fisheries main goals and so private investments have been encouraged and an increasing share of national subsidies are being devoted to developing aquaculture production. There is a current shift from concrete-built land-based basins towards off-shore cage culture systems. Total production is around 250 000 tonnes from 1 000 Italian plants, mainly located in the north of the country and operated by 1 500 workers. Production consists mainly of mussels and trout, but also seabass, seabream, mullet, carp, sturgeon, eels and clams.
Main Aquaculture Species
Mussels54%
Clams21%
Trout19%
Seabass3%
Seabream3%

- 39 -
M ain species landed
020000400006000080000
100000120000140000
Sardinellas Horsemackerel
Herring Com moncockle
Plaice
Ton
nes
THE NETHERLANDS Species Caught The 1999 catch by the Dutch fleet was the fifth biggest in the European Union, with 515 thousand tonnes. The former specialisation on (salted) herring has changed into bulk fishing of other pelagic species like mackerel and horse mackerel. The Dutch fleet now specialises in demersal species, especially flatfish, the main ones of which can be seen below.
Fleet The Dutch fleet is one of the smallest in the EU with 1 075 vessels in 2000, 22.6% of which are under 10m in length. The pelagic trawler sector consists of a small number of big trawlers, fishing both in and outside EU waters. The demersal cutter fleet fishes in the North Sea while the distant water vessels fish in both the North Sea and the Atlantic Ocean for herring and mackerel. Coastal vessels use the Wadden Sea, Zeeland (East Scheldt, West Scheldt and Grevelingen) and Voordelta mainly for molluscs and crustaceans (cockle fishery, seed mussel fishery, oyster cutters), but also plaice, cod, whiting, herring and shrimps.
- 40 -
Main Aquaculture Species
Mussels93%
Catfishes1%
Eel3%
TroutOysters
3%
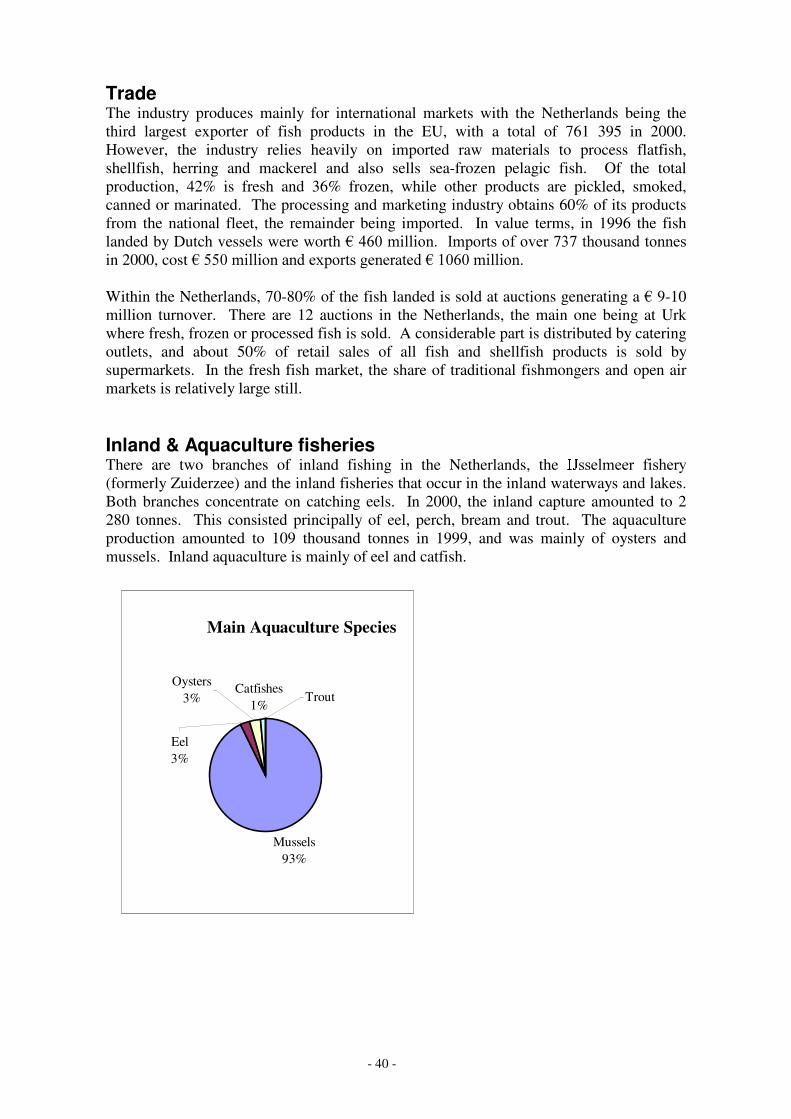
Trade The industry produces mainly for international markets with the Netherlands being the third largest exporter of fish products in the EU, with a total of 761 395 in 2000. However, the industry relies heavily on imported raw materials to process flatfish, shellfish, herring and mackerel and also sells sea-frozen pelagic fish. Of the total production, 42% is fresh and 36% frozen, while other products are pickled, smoked, canned or marinated. The processing and marketing industry obtains 60% of its products from the national fleet, the remainder being imported. In value terms, in 1996 the fish landed by Dutch vessels were worth ¼�����PLOOLRQ���,PSRUWV�RI�RYHU�����WKRXVDQG�WRQQHV�in 2000, cost ¼�����PLOOLRQ�DQG�H[SRUWV�JHQHUDWHG�¼������PLOOLRQ� Within the Netherlands, 70-80% of the fish landed is sold at auctions generating a ¼��-10 million turnover. There are 12 auctions in the Netherlands, the main one being at Urk where fresh, frozen or processed fish is sold. A considerable part is distributed by catering outlets, and about 50% of retail sales of all fish and shellfish products is sold by supermarkets. In the fresh fish market, the share of traditional fishmongers and open air markets is relatively large still. Inland & Aquaculture fisheries There are two branches of inland fishing in the Netherlands, the VVHOPHHU� ILVKHU\�(formerly Zuiderzee) and the inland fisheries that occur in the inland waterways and lakes. Both branches concentrate on catching eels. In 2000, the inland capture amounted to 2 280 tonnes. This consisted principally of eel, perch, bream and trout. The aquaculture production amounted to 109 thousand tonnes in 1999, and was mainly of oysters and mussels. Inland aquaculture is mainly of eel and catfish.

- 41 -
PORTUGAL Species Caught In 1999 the total catch landed in Portugal was 209 thousand tonnes. The most important fish caught in terms of live weight are sardines, octopus and cuttlefish while tuna is very important in the islands. Nevertheless Portugal has a very high dependency (70%) on imported fish, and three times the average EU consumption. When fishing abroad, the Portuguese fleet primarily catches Greenland halibut in Canada, while in Norway cod is the most important species.
Fleet The Portuguese fishing industry is fairly large and diversified. The local fleet is mainly composed of small traditional vessels, comprising 85% of the total fishing fleet, and bringing in 42 % of the total landings. Some vessels operate in areas farther from the coast, and these trawlers target demersal species such as horse mackerel, blue whiting, octopus and crustaceans. The long-distance fishing fleet operates in distant fishing grounds such as those in the North Atlantic (Canada, Norway, Svalbard), the Central Atlantic (Morocco, Mauritania, Guinea-Bissau, Cape Verde, Senegal) and the South Atlantic (Falklands, South Africa). The number of vessels in these fisheries are trawlers and purse-seiners for tuna and represent only 0.6% of the total 10 811 vessels registered in 2000. Portugal has already seen a 50% catch reduction since joining the EU, although the fleet size has only reduced by 2.5% in the last three years. In Portugal there are more than 90 fishing communities and about 130 fishing harbours with diversified conditions and economic importance along the continental coast alone.
Main species landed
01000020000300004000050000600007000080000
Pilchard Chubmackerel
Horsemackerel
Redfish Octopuses
Ton
nes
- 42 -
Main Aquaculture Species
Clams25%
Seabream23%
Trout21%
Oysters19%
Seabass12%
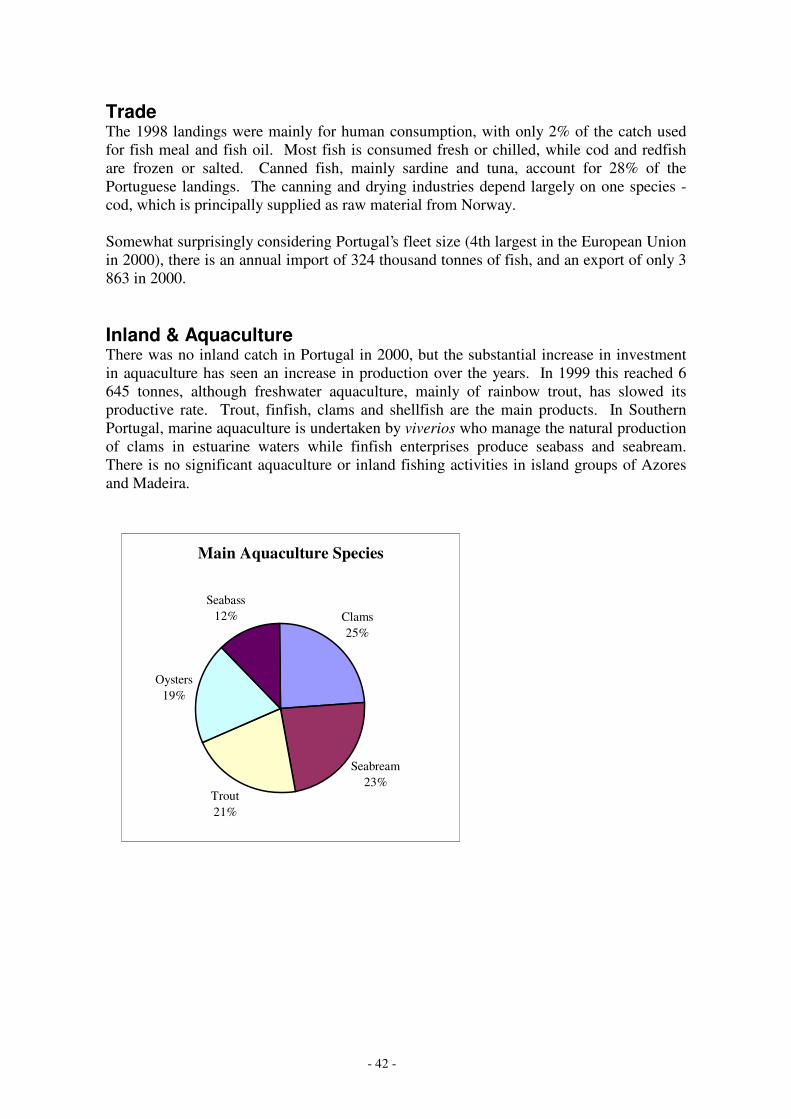
Trade The 1998 landings were mainly for human consumption, with only 2% of the catch used for fish meal and fish oil. Most fish is consumed fresh or chilled, while cod and redfish are frozen or salted. Canned fish, mainly sardine and tuna, account for 28% of the Portuguese landings. The canning and drying industries depend largely on one species - cod, which is principally supplied as raw material from Norway. Somewhat surprisingly considering Portugal’s fleet size (4th largest in the European Union in 2000), there is an annual import of 324 thousand tonnes of fish, and an export of only 3 863 in 2000. Inland & Aquaculture There was no inland catch in Portugal in 2000, but the substantial increase in investment in aquaculture has seen an increase in production over the years. In 1999 this reached 6 645 tonnes, although freshwater aquaculture, mainly of rainbow trout, has slowed its productive rate. Trout, finfish, clams and shellfish are the main products. In Southern Portugal, marine aquaculture is undertaken by viverios who manage the natural production of clams in estuarine waters while finfish enterprises produce seabass and seabream. There is no significant aquaculture or inland fishing activities in island groups of Azores and Madeira.

- 43 -
SPAIN Species Caught Spain has the second highest catch of marine fish in the European Union, with 976 910 tonnes in 2000. Catches are characterised by a wide range of species, reflecting the global reach of the Spanish fleet.
Fleet There were 16 676 vessels registered in the Spanish fleet in 2000. This is the third biggest fleet in the European Union, and Spain therefore owns 17.4% of the European fleet. There are about 150 harbours in Spain where marine catches are landed, although the main centres are Galicia, Huelva, Cadiz and the Canary Islands.
Main species landed
020000400006000080000
100000120000140000160000180000
Skip
jack
tuna
Pilc
hard
Yel
low
fin
tuna
Hor
sem
acke
rel
Big
eye
tuna
Ton
nes
- 44 -
Main Aquaculture species
Mussels86%
Oysters1%
Trout10%
Cockles1%
Seabream2%
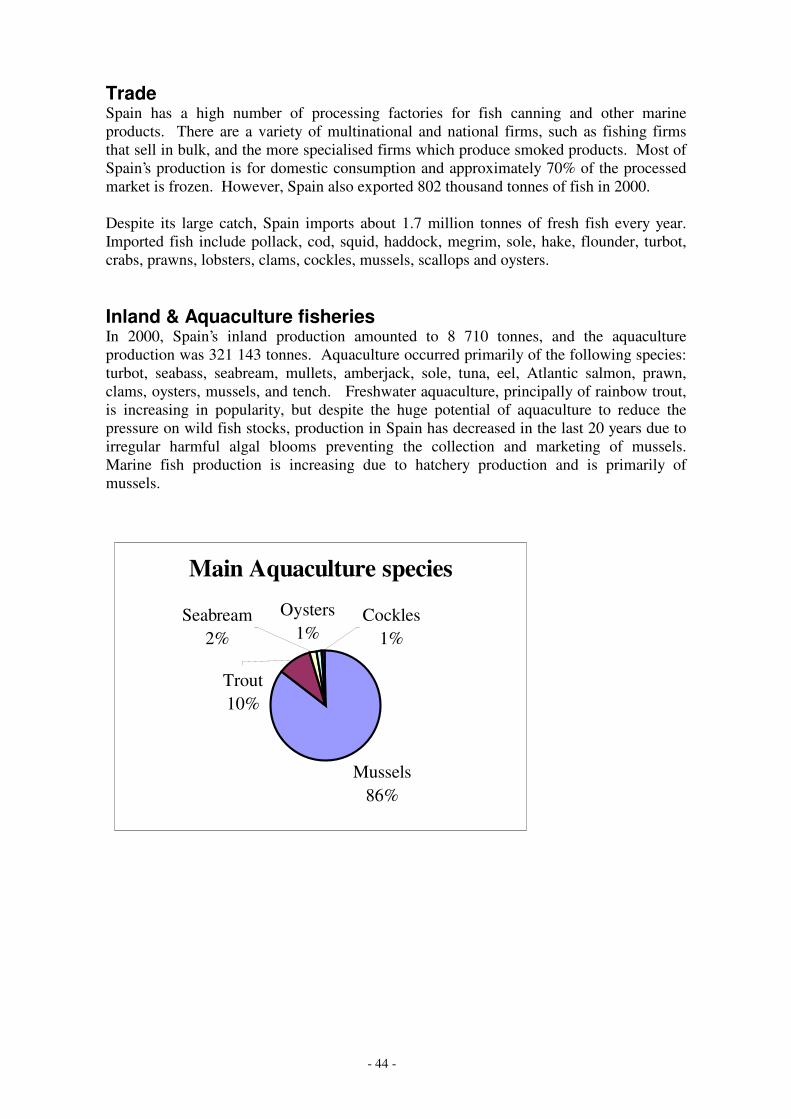
Trade Spain has a high number of processing factories for fish canning and other marine products. There are a variety of multinational and national firms, such as fishing firms that sell in bulk, and the more specialised firms which produce smoked products. Most of Spain’s production is for domestic consumption and approximately 70% of the processed market is frozen. However, Spain also exported 802 thousand tonnes of fish in 2000. Despite its large catch, Spain imports about 1.7 million tonnes of fresh fish every year. Imported fish include pollack, cod, squid, haddock, megrim, sole, hake, flounder, turbot, crabs, prawns, lobsters, clams, cockles, mussels, scallops and oysters. Inland & Aquaculture fisheries In 2000, Spain’s inland production amounted to 8 710 tonnes, and the aquaculture production was 321 143 tonnes. Aquaculture occurred primarily of the following species: turbot, seabass, seabream, mullets, amberjack, sole, tuna, eel, Atlantic salmon, prawn, clams, oysters, mussels, and tench. Freshwater aquaculture, principally of rainbow trout, is increasing in popularity, but despite the huge potential of aquaculture to reduce the pressure on wild fish stocks, production in Spain has decreased in the last 20 years due to irregular harmful algal blooms preventing the collection and marketing of mussels. Marine fish production is increasing due to hatchery production and is primarily of mussels.
- 45 -
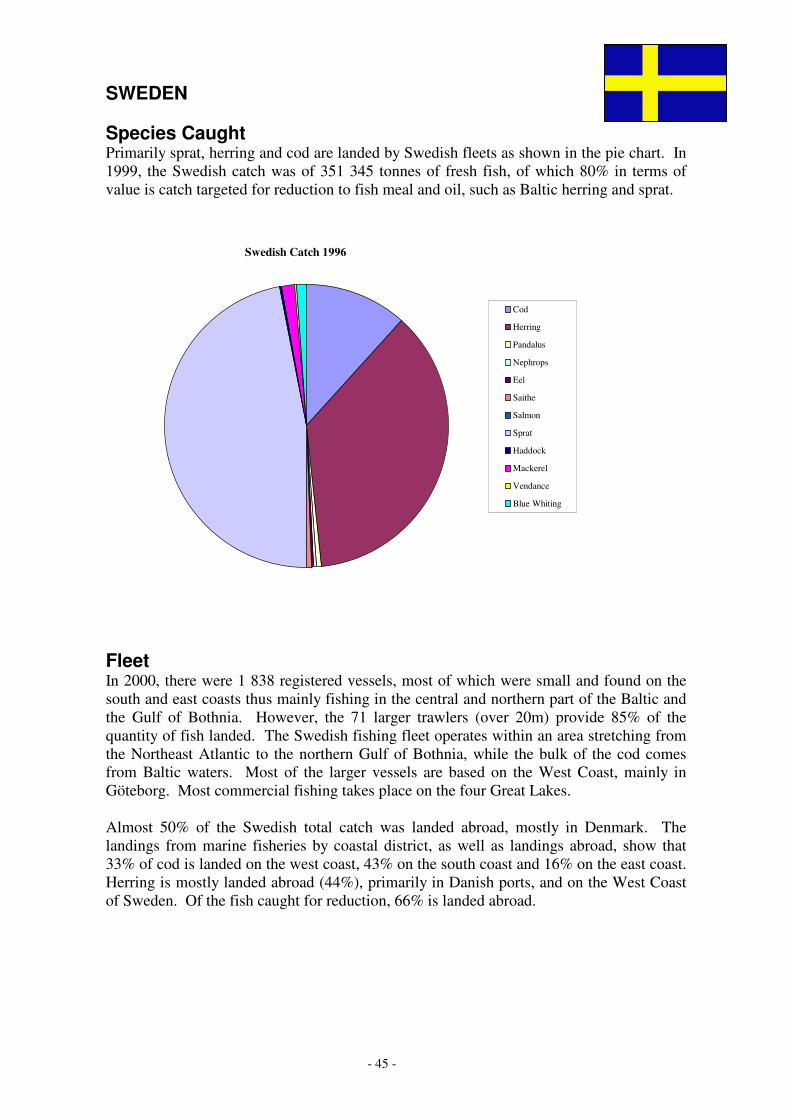
Swedish Catch 1996
Cod
Herring
Pandalus
Nephrops
Eel
Saithe
Salmon
Sprat
Haddock
Mackerel
Vendance
Blue Whiting
SWEDEN Species Caught Primarily sprat, herring and cod are landed by Swedish fleets as shown in the pie chart. In 1999, the Swedish catch was of 351 345 tonnes of fresh fish, of which 80% in terms of value is catch targeted for reduction to fish meal and oil, such as Baltic herring and sprat.
Fleet In 2000, there were 1 838 registered vessels, most of which were small and found on the south and east coasts thus mainly fishing in the central and northern part of the Baltic and the Gulf of Bothnia. However, the 71 larger trawlers (over 20m) provide 85% of the quantity of fish landed. The Swedish fishing fleet operates within an area stretching from the Northeast Atlantic to the northern Gulf of Bothnia, while the bulk of the cod comes from Baltic waters. Most of the larger vessels are based on the West Coast, mainly in Göteborg. Most commercial fishing takes place on the four Great Lakes. Almost 50% of the Swedish total catch was landed abroad, mostly in Denmark. The landings from marine fisheries by coastal district, as well as landings abroad, show that 33% of cod is landed on the west coast, 43% on the south coast and 16% on the east coast. Herring is mostly landed abroad (44%), primarily in Danish ports, and on the West Coast of Sweden. Of the fish caught for reduction, 66% is landed abroad.
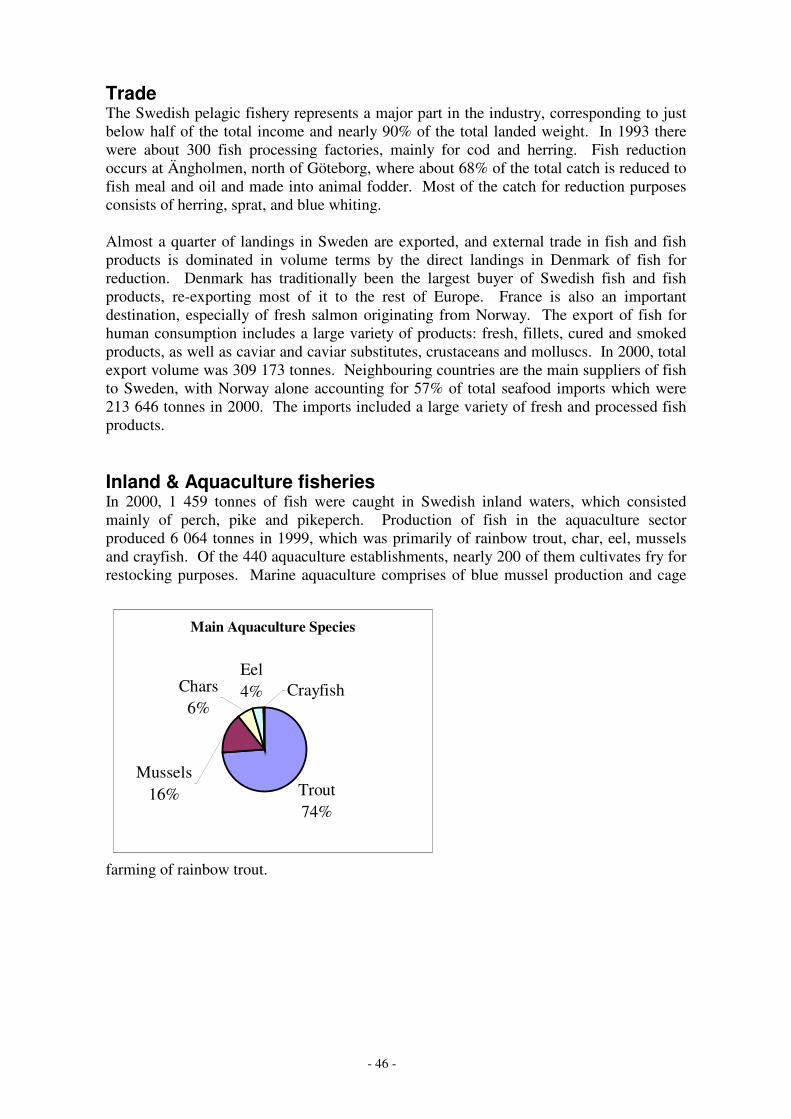
- 46 -
Trade The Swedish pelagic fishery represents a major part in the industry, corresponding to just below half of the total income and nearly 90% of the total landed weight. In 1993 there were about 300 fish processing factories, mainly for cod and herring. Fish reduction occurs at Ängholmen, north of Göteborg, where about 68% of the total catch is reduced to fish meal and oil and made into animal fodder. Most of the catch for reduction purposes consists of herring, sprat, and blue whiting. Almost a quarter of landings in Sweden are exported, and external trade in fish and fish products is dominated in volume terms by the direct landings in Denmark of fish for reduction. Denmark has traditionally been the largest buyer of Swedish fish and fish products, re-exporting most of it to the rest of Europe. France is also an important destination, especially of fresh salmon originating from Norway. The export of fish for human consumption includes a large variety of products: fresh, fillets, cured and smoked products, as well as caviar and caviar substitutes, crustaceans and molluscs. In 2000, total export volume was 309 173 tonnes. Neighbouring countries are the main suppliers of fish to Sweden, with Norway alone accounting for 57% of total seafood imports which were 213 646 tonnes in 2000. The imports included a large variety of fresh and processed fish products. Inland & Aquaculture fisheries In 2000, 1 459 tonnes of fish were caught in Swedish inland waters, which consisted mainly of perch, pike and pikeperch. Production of fish in the aquaculture sector produced 6 064 tonnes in 1999, which was primarily of rainbow trout, char, eel, mussels and crayfish. Of the 440 aquaculture establishments, nearly 200 of them cultivates fry for restocking purposes. Marine aquaculture comprises of blue mussel production and cage
farming of rainbow trout.
Main Aquaculture Species
Trout74%
Eel4% CrayfishChars
6%
Mussels16%

- 47 -
UK Catch 2000
0,00
10,00
20,00
30,00
40,00
50,00
60,00
70,00
Demersal Pelagic Shellfish
Type of fish
Perc
enta
ge
Catch
Value
UNITED KINGDOM Species caught In the year 1999 some 838 thousand tonnes of sea fish were landed by the UK fleet with a total value of over ¼� ����million. Of this catch, 62% was landed in the UK, the remainder being landed in foreign ports. Over 100 species of shellfish, demersal and pelagic fish are landed in Scotland. Haddock cod, whiting and plaice accounted for 52% of the demersal species landed by UK vessels. Of pelagic species, herring and mackerel are the two main species, while crabs (20%) and nephrops (21%) are the main species of shellfish landed.
Fleet In 2000, the UK had 8 517 registered vessels in the fleet, of which almost 75% were less than 10m in length, although there is currently a trend towards capacity aggregation. Most of the UK’s landings are from the North Sea, Norwegian Coast or West of Scotland area. In terms of the significance of landing ports, Peterhead, with landings worth ¼�����PLOOLRQ�is the most important. Nearly half of all Scottish fish and shellfish landings are into Highland and Island ports, and the entire UK output of farmed salmon originates in the Highlands and Islands. A 100% increase in fuel costs between 1998-2000 in the UK has resulted in a severe impact on viability of the fleet and causing an average fall in income ranging from 1% in English channel to 47% in the North Sea and West of Scotland. Thus with a large reduction in earnings across all sectors of UK fleet except the pelagic, there has been a reduction in crew numbers and a cutting back on non-essential vessel repairs and maintenance.
M ain species landed
0
20000
40000
60000
80000
100000
120000
140000
160000
180000
Mac
kere
l
Blu
ew
hitin
g
Her
ring
Had
dock
Cod
Ton
nes

- 48 -
Trade A small proportion of the catch is used to make fish oils and animal feeds, while the main processing is the primary processing of white fish and shellfish. Salmon processing is also a significant activity in Western Scotland. However, some of the species caught by UK fishing vessels find a better market abroad and these species are usually exported or landed directly abroad. In 2000, UK vessels landed 284 thousand tonnes of sea fish with a value of ¼�����PLOOLRQ�GLUHFWO\�LQWR�QRQ-UK ports, while 396 thousand tonnes of fish and fish products to the value of ¼������PLOOLRQ�ZHUH�H[SRUWHG���2I�WKLV��GHPHUVDO�DQG�SHODJLF�fish accounted for approximately 76% by weight, made up primarily of frozen products (58%), as well as fresh, including chilled fish (32%), and prepared and preserved products (7%). The UK also exported 27 thousand tonnes of shellfish and shellfish preparations to France and 21 thousand tonnes to Spain in 2000. In addition the UK imported some ¼� ����� PLOOLRQ� RI� ILVK�� RU� ���� WKRXVDQG� WRQQHV���Demersal and pelagic fish and fish products accounted for approximately 83% of total imports by weight in 2000, while prepared and preserved fish accounted for 36% and frozen fillets for 30%. Most of the imported fish into the UK consists of tuna, salmon, shellfish and cod, and originates primarily from Iceland, Norway, Denmark, Thailand, USA, and Canada. Inland & Aquaculture fisheries British inland production amounted to 1 676 tonnes of fish in 2000. Inland aquaculture is mainly of trout, while freshwater aquaculture in Scotland consists of both trout production and salmon smolt production, although the Dutch own many of the aquaculture sectors. The aquaculture sector produced 155 thousand tonnes in 1999, which is over 6% of the European Union production. The main marine aquaculture production is salmon farming in Western Scotland and the Shetland Islands, although there is also some mussel production in England and Wales.
Main Aquaculture Species
Salmon82%
Mussels6%
Oysters1%
Trout11%
Scallops0%

- 49 -
European Union fishing fleet overview Tonnes in live weight % % Budget N° Inshore Fleet Catch Value ¼ Employ- ¼ vessels Fleet reduction Tonnes thousand ment Year of data 2000-2006 2000 2000 ’98-’02 1999 2000 1999 Spain 1721200000 16676 80.53 7.4 1179734 1601712 9068 Italy 390312000 17664 98.76 18.3 294160 823461 40224 France 284581432 8173 73.98 10.9 650269 647476 21018 Germany 221218000 2314 99.4 7.8 238922 101158 4363 UK 221177700 8517 74.55 8.2 837763 692912 11923* Portugal 217694000 10811 85 2.5 209311 281072 26660 Denmark 213300000 4160 74 15.8 1404917 422763 6695 Greece 211100000 19730 97.81 1.8 136717 236379 18007 Sweden 76767380 1838 73.61 14.4 351345 112167 2880 Ireland 70500000 1193 83.57 33 285957 169106 8478 Finland 40353000 3762 93.94 2.3 144520 28390 5928 Netherlands 39500000 1075 22.6 17.3 514615 357135 3748 Belgium 38535254 169 0 36.4 29876 79300 564 Austria 5325563 0 432 2300 Luxembourg 0 0 0 35 Total EU 15 3751564329 96082 6278538 5553031 161891 Average (14) 267968881 6863 73.67 13.55 448467 427156.2 11561.1
* 2001 data 3. CONCLUSION Fishing is a highly diverse industry, thus leading to inevitable difficulties in implementing and reforming the Common Fisheries Policy within the European Union. The composition of the fishing fleets ranges from a large number of small vessels to a small number of large vessels, and each Member State targets a variety of different species. This has led to a substantial amount of trade both within and outside the European Union. The relatively recent increase in aquaculture and inland fisheries has also changed the overall production, and it is interesting to compare total national fish production with the amount of money each Member State receives from the EU fisheries budget.

- 50 -
¼ ¼ Building Imports Exports scrapping new vessels Aqua- Total Tonnes Tonnes EU State EU State Inland culture Production 2000 2000 ’00-’06 ’00-’06 ’00-’06 ’00-’06 2000 1999 99-00
1688005 802191 329540 203170 293810 69150 8710 321143 1509587 826767 140895 41050 32480 18960 5840 4564 249368 548092
1015708 479983 19800 19170 19390 17930 2131 267638 920038 1124025 529272 3510 2610 21790 8870 22868 73567 335357
866870 396073 35380 32000 9440 5020 1676 154800 994239 323775 3863 36710 12090 45230 9280 0 6645 215956
1216398 1212086 21790 20720 22740 4560 183 42653 1447753 168456 88275 39210 11910 5760 2470 3433 79265 219415 213646 309173 2260 2260 10120 2980 1459 6064 358868 62899 218189 1530 510 5260 1200 961 43856 330774 89969 16300 2130 2130 2240 1010 36813 15449 196782
736695 761395 7360 10720 0 0 2280 108785 625680 301165 122906 2030 2030 4540 5910 511 846 31233 54760 3863 0 0 0 0 859 3070 4361
0 0 0 0 0 0 0
8689138 5084464 542300 351800 459280 134220 86448 1373149 7738135 620653 363176 38736 25129 32805.7 9587.143 6174.9 98082.1 552723.93
Despite the differences found throughout the European fishing industry, the drastic decline in fish stocks is a common factor in our waters. Indeed, ensuring that existing resources recover is the necessity that requires co-operation between Member States. Policies must therefore be based on sound scientific advice to prevent the complete collapse of stocks, as already seen many times in the past, while meeting the individual requirements of each Member State. Reforming the CFP will inevitably have a huge impact on the livelihood of thousands of Europeans, both in the fishing and processing sectors. But unless policies are strongly implemented, the consequences of allowing fishing to remain at current unsustainable levels could be both disastrous and irreversible.
- 51 -
REFERENCES Alam, M.F., & Thomson, K.J. 2001. Current constraints and future possibilities for Bangladesh
fisheries. Food Policy. 26: 297-313. Agricultural Economics Research Institute Fisheries Division. http://www.lei.nl Bartley, D.N., Rana, K., & Immink, A.J. 2001. The use of inter-specific hybrids in aquaculture and
fisheries. Rev. Fish Biol. Fish. 10: 325-337. Beveridge, M.C.M. 1996. Cage Aquaculture. 2nd edition. Fishing News Books. Oxford. Botsford, L.W., Castilla, J.C., & Peterson, C.M. 1997. The Management of Fisheries and Marine
Ecosystems. Science. 277: 509-515. Boyd, C.C., & Clay, J.W. 1998. Giant questions about shrimp. Scientific American Presents the
Oceans. 9(3): 64-67. Cook, R.M., Sinclair, A., & Stefánsson, G. 1997. Potential collapse of North Sea cod stocks.
Nature. 385:521-522. DEFRA. Department for Environment, Food & Rural Affairs- Fisheries.
http://www.defra.gov.uk/fish/fishindx.htm European Commission. 2001. Environment 2010: our future our choice- the 6th environment
action programme 2001-2010. pp 32-37. European Commission. 2000. Fisheries Research organisations and research programmes in the
European Union, Iceland, Israel and Norway. http://europa.eu.int/comm/fisheries/doc_et_publ/liste_publi/orgres.pdf
European Parliament. 2001. Working Paper: Effects on the Fisheries Industry of the Commission Proposals on Dioxin Content of Fish, Fish Oil and Fish Meal as Part of Animal Feed Regulations. STOA 101 EN. Luxembourg.
Eurostat. http://europa.eu.int/comm/eurostat/ FAO (Food and Agriculture Organisation of the United Nations). Fisheries Department. 2001.
http://www.fao.org Finnish Fisheries Statistics 2000 Finnish Game and Fisheries Research Institute. http://www.rktl.fi/tilasto/taskutilasto.pdf Green Paper on the future of the Common Fisheries Policy. EC. 2001 see
http://europa.eu.int/comm/fisheries/greenpaper/green1_en.htm#volume1 Greenpeace. 2001. http://www.greenpeace.org.uk Halvorson, H.O. & Quezada, F. 1999. Increasing public involvement in enriching our fish stocks
through genetic enhancement. Genetic Analysis: Biomolecular Engineering. 15: 75-84. Hindar, K., Ryman. N., & Utter, F. 1991. Genetic Effects of Cultured Fish on Natural Fish
Populations. Can. J. Fish. Aquat. Sci. 48:945-957. Institut francais de la mer. http://ifm.free.fr Irish Sea Fisheries Board. http://www.bim.ie/ Lee, D. (ed). UK Sea Fishery Statistics 1999-2000. Department for Environment, Food and Rural
Affairs. London. MacKenzie, D. 2000. Call of the wild: Do escaped farm salmon jeopardize native populations?
New Scientist. 165: 12. Marine Institute. http://www.marine.ie McKinsey, K. 1998. Struggles with Salmon. Scientific American Presents the Oceans. 9(3): 68-69. Ministere de l'agriculture, de l'alimentation de la peche et des affaires rurales.
http://www.agriculture.gouv.fr Ministero delle Politiche Agricole e Forestali. http://www.politicheagricole.it Ministry of Agriculture, Nature Management and Fisheries. http://www.minliv.nl/international National Board of Fisheries. http://www.fiskeriverket.se Naylor, R.L., Goldburg, R.J., Mooney, H., Beveridge, M., Clay, J., Folke, C., Kautsky, N.,
Lubchenco, J., Primavera, J.H., & Williams, M. 1998. Nature’s subsidies to shrimp and salmon farming. Science. 282: 883-884.
Naylor, R.L., Goldburg, R.J., Primavera, J.H., Kautsky, N., Beveridge, M.C., Clay, J., Folke, C., Lubchenco, J., Mooney, H., & Troell, M. 2000. Effect of aquaculture on world fish supplies. Nature. 405: 1017-1023.
Nightingale, J. 2001. Shark-fin soup attack. BBC Wildlife. 19(8): 35-36.

- 52 -
O’Brien, C.M., Fox, C.J., Planque, B., & Casey, J. 2000. Climate variability and North Sea cod. Nature. 404: 142.
Pauly, D., Christensen, V., Dalsgaard, J., Froses, R., & Torres, F. Jr. 1998. Fishing Down Marine Food Webs. Science. 279: 860-863.
Pérez, J.E., Nirchio, M., & Gomez, J.A. 2000. Aquaculture part of the problem, not a solution. Nature. 408: 514.
Rana, K. & Immink, A. 1997. Trends in Global Aquaculture Production: 1984-1996 in Review of the State of World Aquaculture. Food and Agriculture Organisation. Rome.
Safina, C. 1998. The World’s Imperilled Fish. Scientific American Presents the Oceans. 9(3): 58-63.
Schmidt, K.F. 1997. ‘No-Take’ Zones Spark Fisheries Debate. Science. 277:489-491. Setälä, Honkanen, Vihervuori, Nylander, Söderkultalahti, Tuunainen. 1999. Review of the fish
market in Finland. Boreal Environment Research. 3: 361-370. United Nations. 1998. Population Division- department of economic and social affairs. Revision of
the World Population estimates and projections. http://www.popin.org/pop1998/ Vitousek, P.M., Mooney, H.A., Lubchenco, J. & Melillo, J.M. 1997. Human Domination of
Earth’s Ecosystems. Science. 277: 494-499. Watson, J. & Martin, A. 2001. Economic Survey of the UK Fishing Fleet. http://www.seafish.co.uk Williams, M.J., Bell, J.D., Gupta, M.V., Dey, M., Ahmed, M., Prein, M., Child, S., Cardiner, P.R.,
Brummett, R., & Jamu, R. 2000. Responsible aquaculture can aid food problems. Nature. 406: 673.
WWF. 2001. http://www.panda.org GLOSSARY Aquaculture: The farming of aquatic organisms, including fish, molluscs, crustaceans and
aquatic plants. Farming implies some sort of intervention in the rearing process to enhance production, such as regular stocking, feeding or protection from predators.
Benthic: Animals occuring at the bottom of a body of water. Capture fisheries: The removal of aquatic organisms from natural or enhanced inland waters. Catch: Total production by capture fishery vessels, but without those products which are caught
but not landed (i.e. fish which are discarded or consumed on the vessel). Demersal: Animals living on, or near the bottom of the sea. Dioxins: Polychlorinated aromatic compounds which are encountered widely, and are chemically
relatively resistant. They are formed as a by-product of chemical processes such as manufacturing pesticides, or from exhaust emissions and incineration. They accumulate in fat tissues, and even very small concentrations can cause adverse environmental and health effects.
Employment: Figures quoted represent the total number of full-time fishermen, but not those working in the processing or aquaculture sectors.
Fish meal: High protein animal feed ingredient, produced from food fish trimmings and fish species for which human consumption is very limited or non-existant.
Inland fisheries: Activity conducted to extract fish and other aquatic organisms from inland water.
Inshore Fleet: This refers to vessels which are less than 10 or 12 metres in length. Pelagic: Fish living and feeding in the open sea; associated with the surface or middle depths of
a body of water (i.e. 0-200m in depth) and often feeding on plankton. PCBs: Polychlorinated biphenyls are chlorinated aromatic hydrocarbons which are synthesised by
direct chlorination of biphenyls. Some PCB compounds have toxicological properties that are similar to dioxins.

- 53 -
ABBREVIATIONS
Aus Austria B Belgium De Germany Dk Denmark Es Spain EU European Union F France Fin Finland Gr Greece It Italy Ir Ireland Lux Luxembourg P Portugal Sw Sweden Nl The Netherlands UK United Kingdom of Great Britain
APPENDIX 1. Species Stocks for which scientific advice recommends recovery plans: ��Blue whiting (combined stock, I-IX, XII & XIV) ��Cod in Kattegat, North Western waters (Vb, VI, XII, XIV), Western waters (VIIb-k,
VIII, IX, X, CECAF), the Irish Sea (VIIa) ��Northern hake in the North Sea, Skagerrak & Kattegat, Western waters (Vb, VI, XII,
XIV) ��Whitting in the Irish Sea (VIIa) ��Norway lobster in the Cantabrian Sea (VIIIc), the Western Iberian region (IX, X
CECAF), the Bay of Biscay (VIIIabde) ��Sole in the Northern part of the Bay of Biscay (VIIIab) ��Haddock in the Irish Sea (VIIa) Other stocks outside safe biological limits ��Anglerfish in Norwegian Sea and North Sea (IIa, North Sea), the Iberian region (VIIIc,
IX, X, CECAF), western waters (Vb, VI, XII, XIV), the West of Ireland (VII), the Bay of Biscay (VIIIabde);
��Horse mackerel in the western Iberian region (VIIIc, IX), in the West of Scotland; West of Ireland and Bay of Biscay (Vb, VI, VII, VIIIabde)
��Megrims in the Bay of Biscay (VIIIabde) ��Sole in teh Western English Channel (VIIe), the Norwegian Sea and the North Sea (II,
North Sea), the Celtic Sea (VIIfg) ��Plaice in the Celtic Sea (VIIfg).

- 54 -
2. Fleet Belgium Mariager Joensuu Veitsiluoto Zeebrugge Marstal Joutseno Vuoksen terminal Oostende Middlefart Jurmo Nieuwpoort Naestved Karingsund France
Nakskov Kaskinen Ajaccio Denmark Nekso Kasnas Antibes Aabenraa Nybord Kaukas Arcachom Aalborg Nykobing (Mors) Kemi Bastia Aarhus Odense Klobbskat Bayonne Aeroskobing Orehoved Kokkola Bonifacio Allinge Randers Korrvik Bordeaux Asnaesvaerts Havn
Ringkobing Kotka Boulogne-sur-mer
Assens Rodbyhavn Koverhar Brest Bandholm Rodvig Kristinestad Calais Copenhagen Ronne Kumlinge Calvi Ebeltoft Rudkobing Kumpusalmi Camaret Elsinore Saksobing Kustavi Cancale Ensted Samso Island Lappeenranta Cannes Esbjerg Skaelskor Laupunen Cherbour Faaborg Skaerbaek Loviisa Concarneau Fakse Ladeplads Skagen Mariehamn Deauville Frederica Skive Merikarvia Diepe Frederikshavn Sonderborg Mustola Fecamp Frederiksvaerk Stege Naantali Granville Honfleur Frederkssund Stigsnaesvaerketshav
n Oulu Gravelines
Gedser Strandby Pargas Ile Rousse Gilleleje Struer Pateniemi Izon Graastern Stubbekobing Pori Germany Grena Studstrup Porvoo Brake Gulfhavn Svaneke Puhos Bremen Haderslev Svendborg Raahe Bremerhaven Hadsund Thisted Rahja Brunsbuttel Hammerhavn Thyboron Rauma Buesum Hanstholm Tuborg Reposaari Butzfleth Hasle Vejle Ristiina Cologne Havnekontoret Vordingborg Saimaa Canal Cuxhaven Hirtshals Savonlinna Duisburg Holbaek Finland Siilinjarvi Dusseldorf Horbro Ekenas Sommaro Eckernforde Hvide Sande Hamina Tolkkinen Tolkis Elsfleth Kalundborg Hamnsundet Tornio Emden Kerteminde Hanko Tornoi Flensburg Koge Haukipudas Tuomarainen Frankfort Kolding Helsinki Turku Gluckstadt Korsoer Imatra Uusikaupunki Hamburg Kyndby Inkoo Vaasa Heiligenhafen Lemvig Jakobstad Varkaus Harbours Holtenau

- 55 -
Husum Chalkida Chalkis
Bari Cagliari
Huelva La Coruna
Kinlochbervie Kyle of
Itzehoe Chios Chioggia Las Palmas Lochalsh Kappeln Corfu Civitanova Malaga Lerwick Karlshagen Corinth Canal Fano Ondarroa Lochinver Karlsruhe Elefsis La Spezia Pasajes Lowestoft Kehl Gythion Manfredonia Riberia Macduff Kiel Igoumenitsa Marche San Carles de la
Rapita Mallaig
Koblenz Iraklion Mazara del Vallo Santa Cruz de Tenerife
Milford Haven
Krefeld Isthmia Molfetta Tarragona Newlyn Leer Itea Monfalcone Vigo North Shields Lubeck Kalamata Palermo Oban Lubeck Kali Limenes Pescara Sweden Padstow Ludwigshafen Am Rhein
Kalymnos Porto Santo Stefano Ängholmen Peterhead Pittenweem
Mainz Katakolon Ravenna Bua Plymouth Mannheim Kavalla Savona Ellös Portavogie Neuhaus Kos Trapani Göteborg Scalloway Neuss Kymasssi Viareggio Karlskrona Scarborough Neustadt Lavrion Kungshamn Scrabster Nordenham Messolongi Netherlands Mollösund Shoreham Oldenburg Mitylene Den Helder Nogersund Stornoway Orth Mykonos Island Goedereede Öckerö Troon Papenburg Nauplia Harlingen Oxelösund Ullapool Rendsburg Patras Ijmuiden Rönnäng Whitby Rostock-Warnemuende
Piraeus Scheveningen Saltö Whitehaven
Sasznitz Preveza Urk Simrishamn Wick Schleswig Thessaloniki Vlissingen Smögen Schulau Yerseke Strömstad Schwarzenhutten Ireland Träslövsläge Stade Baltimore Portugal Trelleborg Stadersand Burtonport Aveiro Västervik Stralsund Castletownbere Figueira da Foz Toenning Cork Matosinhos UK Travemunde Dingle Olhao Aberdeen Uetersen Dunmore East Peniche Ardglass Wilhelmshaven Greencastle Portimäo Ardveenich/Northbay Wismar Howth Sesimbra Bridlington Greece Killybegs Brixham Achladi Kilmore quay Spain Buckie Agia Trias Kinsale Algeciras Campbeltown Agio Theodoroi Rossaveal Alicante Douglas/Peel Aleandroupolis Schull Almeria Eyemouth Aspropyrgos Union Hall Arrecife Fleetwood Astakos Aviles Fraserburgh Ayios Nikolaos Italy Barcelona Grimsby Canea Ancona Cadiz Hull Cephalonia Anzio Castellon Kilkeel

- 56 -
Percentage Inshore fishing fleet(less than 10/12m in length)
0,00
20,00
40,00
60,00
80,00
100,00
120,00
Austri
a
Belgium
Denmark
German
y
Greece
Finlan
d
France
Irelan
dIta
ly
Luxem
bourg
Netherl
ands
Portug
alSpa
in
Sweden UK
%
European Fishing Fleet
93000
94000
95000
96000
97000
98000
99000
100000
101000
102000
103000
1991 1992 1993 1994 1995 1996 1997 1998 1999 2000
Year
Num
ber
of v
esse
ls

- 57 -
3. Production Catches- all regions (except bycatch) Tonnes live weight
1991 1992 1993 1994 1995 1996 1997 1998 1999 Austria 500 479 420 388 404 450 465 451 432 Belgium 39889 37119 36099 34256 35614 30823 30500 30836 29876 Denmark 1751148 1953813 1492285 1843735 1998908 1681186 1826854 1557330 1404917 Germany 232428 216889 253012 228215 238778 237235 259769 266668 238922 Greece 144207 159250 166917 190966 165779 163027 170498 127542 136717 Finland 109356 130544 135086 151312 154529 164213 165237 155637 144520 France 648850 655222 636151 651089 676862 636488 631258 589189 650269 Ireland 233161 248113 278044 290624 389625 332639 293006 324761 285957 Italy 405383 396038 395912 397270 396307 365105 342610 317098 294160 Luxembourg 0 0 0 0 0 0 0 0 0 Netherlands 405196 431697 461596 419919 438102 410800 451799 536627 514615 Portugal 318273 290897 287916 262623 259329 259364 219566 223865 209311 Spain 1067109 1075069 1080904 1092374 1168779 1162652 1183571 1244789 1179734 Sweden 237016 307533 341891 386814 404590 370893 357406 510886 351345 UK 790549 813085 860202 877947 909904 867633 891700 920397 837763
EU total 6383065 6715748 6426435 6827532 7237510 6682508 6824239 6806076 6278538
L Cunningham

- 58 -
4. EU Fisheries Budget
Breakdown of co financing by Member States of fisheries budget
2000 2001 2002 2003 2004 2005 2006 Total Austria 715762 718808 721854 721854 812715 815762 818808 5325563
Belgium 5111044 5281393 5528291 5604842 5657943 5587595 5764146 38535254
Denmark 28700000 29200000 29900000 30500000 30900000 31700000 32400000 213300000
Finland 5479000 5579000 5679000 5779000 5779000 5979000 6079000 40353000
France 38652950 39334247 39387721 39942544 41550960 42386252 43326758 284581432
Germany 31947100 48010200 41253500 31935700 22232800 22666200 23132200 221177700
Greece 0 26500000 33464000 36674000 38672000 38450000 37340000 211100000
Ireland 2520000 11480000 11900000 14970000 12350000 9250000 8030000 70500000
Italy 52565000 53276000 54186000 59676000 55911000 57215000 57483000 390312000
Luxembourg 0 0 0 0 0 0 0 0
Netherlands 1500000 6100000 6200000 6300000 6300000 6500000 6600000 39500000
Portugal 36327000 35134000 33914000 33101000 25718000 26341000 27159000 217694000
Spain 241800000 246000000 250400000 254800000 237800000 242600000 247800000 1721200000
Sweden 10350448 10582805 10813933 11064581 11121131 11251674 11582808 76767380
UK 29078000 29503000 33463000 33456000 32145000 32051000 31522000 221218000
EU 15 484746304 546699453 556811299 564525521 526950549 532793483 539037720 3751564329
L Cunningham


