217
The European Market for Organic Products: Growth and Development Organic Farming in Europe: Economics and Policy Volume 7 Johannes Michelsen Ulrich Hamm Els Wynen Eva Roth
The European Market for Organic Products: Growth and Development
Organic Farming in Europe: Economics and Policy Volume 7
Johannes Michelsen Ulrich Hamm Els Wynen Eva Roth
1
The individual contributions in this publication remain the responsibility of the authors. The European market for organic products: growth and development / Johannes Michelsen, Ulrich Hamm, Els Wynen and Eva Roth.- Stuttgart-Hohenheim: 1999 (Organic Farming in Europe: Economics and Policy; 7) ISBN 3-933403-06-5 ISSN 1437-6512 Edited by Prof Dr Stephan Dabbert
Department of Farm Economics, University of Hohenheim, Germany Dr Nicolas Lampkin Welsh Institute of Rural Studies, University of Wales, Aberystwyth, United Kingdom Dr Johannes Michelsen Department of Policy Studies, University of Southern Denmark, Esbjerg, Denmark Dr Hiltrud Nieberg Institute of Farm Economics and Rural Studies, Federal Agricultural Research Centre Braunschweig-Völkenrode (FAL), Germany Prof Dr Raffaele Zanoli Dipartimento di Biotecnologie Agrarie ed Ambientali, University of Ancona, Italy
Technical editor: Dr Matthias Stolze Published by: Universität Hohenheim Institut für Landwirtschaftliche Betriebslehre 410A D-70593 Stuttgart Germany Tel: +49 (0)711 459-2543 Fax: +49 (0)711 459-2555 E-mail: [email protected] http://www.uni-hohenheim.de/~i410a/ofeurope/ © Universität Hohenheim/Institut für Landwirtschaftliche Betriebslehre 410A, 1999. All rights reserved. No part of this publication may be reproduced, stored in a retrieval system, or transmitted, in any form or by any means, electronically, mechanically, by photocopying, recording or otherwise, without the prior permission of the copyright owners. Cover design and layout by walter + von schickh, Ettlingen, Germany Printed and bound in Germany by Hago Druck & Medien, Karlsbad-Ittersbach
2
The authors gratefully acknowledge financial support from the Commission of the European Communities, Agriculture and Fisheries (FAIR) specific RTD programme, FAIR3-CT96-1794, „Effects of the CAP-reform and possible further development on organic farming in the EU“.
Johannes Michelsen, Ulrich Hamm*, Els Wynen and Eva Roth
University of Southern Denmark Department of Policy Studies Niels Bohrs Vej 9 DK-6700 Esbjerg Denmark Tel: +45 65 50 41 61 Fax: +45 65 50 10 91 E-mail: [email protected] http://www.sdu.dk/indexE.html *University of Applied Sciences Neubrandenburg Faculty of Agriculture and Landscape Architecture Brodaer Strasse 2 D-17033 Neubrandenburg Germany
Tel: +49 395 5693 209 Fax: +49 395 5693 299 E-mail: [email protected] ____________________________
This publication does not necessarily reflect the European Commission’s views and in no way anticipates the Commission’s future policy in this area. Its content is the sole responsibility of the authors. The information contained herein, including any expression of opinion and any projection or forecast, has been obtained from or is based upon sources believed by the authors to be reliable but is not guaranteed as to accuracy or completeness. The information is supplied without obligation and on the understanding that any person who acts upon it or otherwise changes his/her position in reliance thereon does so entirely at his/her own risk.
3

4
Executive summary During the 1990s, organic farming has gained prominence in Europe - among EU member states as well as non-member states. This is to some extent caused by political support for organic farming as a type of environmentally friendly agriculture. The EC Reg. 2078/92, which includes the measures accompanying the 1992 CAP Reform, is one example of political support. The growth of organic farming has direct implications for the development of markets for organic products. Hence, the main objective of this report is to give an up-to-date overview on market growth and development for organic products in 18 European countries (all EU-member states plus Norway, Switzerland and the Czech Republic).
The report is about market impacts of policies and the contribution of organic food and feed markets to the general policy objectives of the CAP. Agriculture policies work, largely, through direct influence on the production - and hence supply - of food products, whereas consumer demand and consumption are influenced indirectly. Therefore, the analysis focuses on market supply rather than on consumer demand. This approach is justified in an overview of national and international market studies. It shows that adaptation of supply to demand represents a larger problem for the development of organic food markets than does the development of sufficient demand.
Data are very scarce within the field of markets for organic products. To obtain a full coverage of recent developments in all countries, this review is therefore conducted mainly on the basis of data collected by national experts by contacting the most significant marketing agents in each country. Collection of data aiming at describing the market situation in each country has thus been a major issue in preparing this report. The information provided covers the situation in 1997 but is, however, far from complete. It is, nevertheless, at present one of the most serious attempts to give an overview of the market situation for organic products in Europe.
General characteristics of national markets for organic food
Organic farming only covers a marginal share of the total agriculture area in the 18 countries studied here, and this influences the general characteristics of the national markets, as a minimum domestic production seems a necessary prerequisite for market development. Some minimum requirements for the proper functioning of a market are met in most countries, but major problems are found regarding the setting of prices, the free flow of goods within countries as well as market transparency in general. The problems vary strongly between countries.
Across all countries, five product groups appear clearly more important than others. They include vegetables, cereals, milk products, potatoes and fruits. Each of these was ranked among the five most important organic products
i

in 12 to 16 countries, but variations in the ranking occur between countries for each product group. Market shares vary from less than 1 percent for many products in many countries to up to about 10 percent for milk products and vegetables in a few countries. Market growth varies from stagnation in the Netherlands to annual growth rates above 70 to 100 percent in Austria, Denmark and Sweden.
The large variation between national markets suggests that major market potentials are at hand for a further development of organic farming, not least in countries with very small organic food markets.
Place – sales channels
Three main types of sales channels are used for marketing organic food. Direct sales from producer to consumer via farm shops or weekly markets is one, while specialised shops is another. These two channels traditionally provided a market more or less separate from conventionally grown products and allowed to differentiate products on the grounds of other characteristics than organic vs non-organic. Ordinary general stores – usually supermarkets – form the third type of sales channel, which has developed since the 1980s. In most countries, organic food is sold through a combination of all three channels. Germany and the Netherlands are examples of countries where most of the trade goes via specialised shops, while in Scandinavian countries and Austria supermarkets are the most dominant sales channel.
All product groups are traded internationally, but for meat, international trade is on a very low level. The introduction of common livestock standards would possibly increase meat trade as well. Some products, such as grains, are traded mainly with neighbouring countries, while other products, such as vegetables and fruits, move mainly from south to north, presumably for climate reasons. A large potential for international trade in organic products seems at hand provided standards are harmonised, production expanded and distribution is promoted (or at least not hampered) by national organic movements and by agriculture and trade policies.
ii
Product characteristics
Three aspects of product definitions are described. One aspect is defining products via certification. Common EU standards for organic plant production have been enforced by public agencies in EU member states and Norway since the middle of the 1990s. Livestock standards are still only defined by private organisations. These are, however, in most countries participating in certifying producers and traders according to the EU plant production standards. A common label signifying compliance with EU standards was introduced in 1999, so up to then EU standards were included in national certification labels. However, national certification labels often presuppose compliance with standards additional to those of the EU and this poses a potential trade barrier for products from other countries - against the idea of the single EU market.
In a few countries, food companies have introduced commercial labels of their own in order to be able to differentiate their products from the organic products of other suppliers.
Another aspect of product definition is compliance with the quality standards of the main food market. Here, the main disadvantage of organic food is physical appearance. Negative evaluations of physical appearance, however, are not common in countries with large market shares. In other quality aspects, organic food do not differ substantially from other food.
The ability to present a wide range of products is a third important aspect of product definition when attempting to enter and develop positions in the mass food market. As far as product range is related to a high degree of processing, organic food does not comply with market demands and the efforts made so far in this direction only seem modest.
Promotion of organic food
Promotion of organic farming may take different forms. One is the purely accidental and indirect form of reports and debates in the mass media comparing organic with non-organic food. A more direct type of promotion is to promote the certification labels and thus improve consumers’ knowledge of the existence of organic food products. A third form of promotion is systematic and professional promotion of organic food based on deliberate effort by the actors in the organic food market. The use of two elements of the third type are described here, retailers’ sales arguments and the systematic use of professional promotion.
Across countries, retailers currently promote organic food mainly by using arguments about food safety/health or environment protection – with health arguments legally not allowed in some countries. Nature conservation and taste are other important components in promoting organic food, while animal welfare issues are mainly found at the bottom of the list of arguments, although for eggs, the argument is used extensively.
iii

Systematic and professional promotion efforts are in general few and small, although recent examples of systematic promotion – mainly on a national basis – are found in all but six countries. Private firms are the main initiators and financiers, especially in countries with large organic sectors and sales mainly channelled through supermarkets. Initiatives by organic farming associations are mainly important in countries where firms were not very active.
Prices of organic food
Across countries, most organic products are sold as organic and at a price premium. Milk and beef in general have lower shares sold in the organic market when compared with the other main products.
Producer price premiums vary from 0 to 100 percent both within and among countries. In general, premiums as a percentage of the conventional price for milk and beef are low, compared with those of the other products. Especially cereals and potatoes command high premiums as a reflection of high demand in some countries. Relative production costs are likely to be of importance in explaining the high premiums paid for pork, poultry and eggs.
Consumer premiums also vary a great deal and largely follow the same pattern as producer premiums. Consumer price premiums for major products such as vegetables, potatoes and fruits are high as well as for minor products such as pork, chicken and eggs. There is some correlation between the level of consumer price premiums on the one hand and market shares and distribution channels on the other. Distribution costs - and hence consumer prices - are lower in countries with large market shares and high distribution through supermarkets. In countries with lower market shares and less supermarket distribution, the consumer prices are quite high due to higher distribution costs. The correlation between producer price premiums and distribution of products seems less clear.
Markets for livestock feed
A brief overview of national markets for organic livestock feed and the international trade of feed crops indicate that markets are very small even when compared with the small markets of organic food. The total market for livestock feed is so small that it was impossible to obtain reliable information as to absolute size. Small size in itself disturbs the proper functioning of organic feed markets. It was further disturbed by the absence of a common definition of organic livestock production of an authority similar to the EC Reg. 2092/91 on plant production. Such a definition was decided by the EU agriculture ministers in June 1999. Functioning markets for feed crops are only found in 7 to 8 countries and it is in the same countries that the only – and often modest – examples of commercial production of feed crops are found. Hence, domestic supplies of feed depend to a major extent on more
iv

or less accidental surplus production or direct exchange of feed and fertiliser between farmers emphasising plant and animal production respectively.
Imports are a supplementary source of feed crops. The available information on international feed grain trade indicates that this is of special importance in France, Denmark and Switzerland. Major German exports result from marketing difficulties in the domestic market, especially in the eastern part of Germany where grain production up to now has been much higher than demand.
Long-term development of organic food markets
Five aspects of market development are discussed in this report. In spite of the fast development of markets, professional marketing of organic food has been limited in the last decade. Long term professional marketing efforts directed at supermarkets seem an important prerequisite for expanding organic food markets.
Public regulation is another way of influencing the organic food market. EU regulations now appear the main source of regulatory support for the development of organic food markets in all member states. Regulatory impacts up to now have been mainly on supply. Support paid to farmers has an important impact on supply. It seems, furthermore, as if EU certification is having an increasing impact on consumer demand, as EU standards now form the basis for introducing still more organic products.
Some actors are needed to work in favour of market developments. In the general development of the national markets of organic food, organic farmers’ associations up to now have been the most active type of actor on the supply side, while commercial firms – not least supermarket chains – have been most active on the demand side. Neither organic farming movements nor certification bodies have up to now had a clear role in developing markets.
For market development a steady (anonymous) consumer demand is paramount. However, demand was not the only driving force in the market. Interplay between demand, supply and subsidies characterise all countries with a large organic sector and hence seem necessary for successful market development. However, no universal type of this interplay was identified.
Bottlenecks hampering market development can be found in all links in the distribution network from farmer to consumer. A limited size of supply seems, however, a decisive factor, which hampered market development up to now. Economies of scale seem an important issue in all links of the distribution network – especially when targeting supermarkets.
Perspectives for developing organic food markets
The organic food markets are in general very small; they are structured quite differently between countries, and they are developing along different
v
paths. However, markets have grown steadily in recent years and absolute limits to demand seem yet far from being reached in most countries. It thus clearly seems possible - from a market perspective
to expand supply well beyond the 1 percent of total agriculture in most countries and in the EU as a whole;
to expand the range of products well beyond vegetables, cereals, milk products, potatoes and fruits. Not least, meat products seem an area of potential expansion.
Supermarkets are to be important partners in developing sales as they represent the entrance to the mass market. Supermarket chains also have the capacity
to provoke domestic production by securing large sales;
to participate in defining new products in terms of range and degree of processing;
to increase and target marketing efforts and – via economies of scale;
to keep consumer prices low relative to producer prices.
Supermarket sales thus seem an important vehicle for consolidating organic food markets.
A European dimension emerges from the analysis. European policies gained increasing effects on market development all over Europe during the 1990s and still seem to have major potentials for driving the organic food markets. In order to release these potentials
EU certification needs to be expanded to livestock production, and international trade needs common international certification labels rather than national ones.
EU support should include market perspectives in the support of organic farmers.
The report is concluded with a few suggestions focusing on needs to
develop marketing plans in which place, products, promotion and price are combined into different strategies and
establish transparent market relations by producing serious and reliable market information on a regular basis via official statistics for organic food in all countries and in the EU.
Annex
Annexed to the report are three types of supplementary information. They are meant as help to the reader to get a deeper insight into the results mentioned in the report.
Country specific reviews of national markets for the five most important groups of organic food products in 1997. These tables help
vi

the reader to get an overview for specific countries, whereas the report presents data on all 18 European countries.
The questions from the questionnaire, completed by national experts after collection of information from key informants in the national markets for organic products. The exact wording of the questions is essential for the full understanding of the information presented in the report.
Tables including information from the questionnaires in addition to the information presented in the tables of the report.
vii
Table of Contents Executive summary i
List of Tables x
Country Abbreviations xiv
1 Introduction 1
1.1 Markets for organic products – theoretical considerations 1
1.1.1 Generic products and niche marketing 3
1.1.2 A marketing mix approach 4
1.2 Methodology and data quality 6
1.3 Other studies 8
1.4 Structure of the report 10
2 General characteristics of national markets for organic food 12
2.1 The national markets for organic food 12
2.2 The most important certified organic food products 16
2.3 Market shares and organic sector size 24
2.4 Summary 27
3 Place – Sales channels for organic food 28
3.1 Market structure 28
3.2 Domestic sales channels 30
3.3 International trade in organic food products 33
3.4 Summary 38
4 Product – Characteristics of organic food 39
4.1 Certification and labelling 40
4.1.1 Certification labels 40
4.1.2 Commercial labels 42
4.1.3 Importance of certification and commercial labels 43
4.2 Quality assessment of organic food 46
4.3 Degree of processing 49
4.4 Summary 51
5 Promotion of organic food 53
5.1 Retailers’ sales arguments 53
5.2 Systematic promotion since 1993 56
5.3 Summary 58
viii

6 Prices of organic food 59
6.1 Products sold as organic/non-organic 60
6.2 Price premiums to farmers 63
6.3 Price premiums paid by consumers 67
6.4 Summary 72
7 Markets for organic feed crops 73
7.1 Domestic markets 73
7.2 International feed trade 77
7.3 Summary 80
8 The long-term development of organic food markets 81
8.1 Professional marketing of organic food 82
8.2 Impact of EU and national regulations on supply and demand of organic food 85
8.2.1 Influence of EC Reg. 2092/91 (certification) 86
8.2.2 Influence of EC Reg. 2078/92 (support for environmentally friendly farming) 90
8.2.3 Summing up influence of regulations on market development 91
8.3 Actors supporting the development of the organic food market 93
8.4 Driving forces in the national organic food markets 99
8.5 Bottlenecks in developing markets 100
8.6 Summary 106
9 Perspectives for developing organic food markets 108
9.1 Conditions for consolidating organic food markets 108
9.2 The European dimension 111
9.3 Some suggestions for developing organic food markets 113
10 References 116
11 Contributors – National experts 120
12 Key informants 121
13 Annex 124
a) Country specific reviews of national markets for the five most important organic food products in 19971 125
b) Questions from the questionnaire completed by national experts 134
c) Supplementary tables 148
ix
List of Tables Table 2-1: Market characteristics for organic agriculture products 13
Table 2-2: National rankings of the five most important among thirteen organic food product groups. Rank number 17
Table 2-3: Organic vegetables. Importance and growth in national markets 19
Table 2-4: Organic cereals. Importance and growth in national markets 20
Table 2-5: Organic milk products. Importance and growth in national markets 21
Table 2-6: Organic potatoes. Importance and growth in national markets 22
Table 2-7: Organic fruits. Importance and growth in national markets 23
Table 2-8: Organic farming: share of total farming and market shares for most important products. Percentages 26
Table 3-1: Sales hannels, most important organic product groups 31
Table 3-2: Imports of organic food products. Share of domestic organic markets. Percentages 35
Table 3-3: Exports of organic food products. Share of domestic organic production. Percentages 36
Table 4-1: Promoting organic food. Market shares of certification labels and commercial labels. Percentages 44
Table 4-2: Quality assessment of organic food in Europe. Three aspects of importance in the food market. Number of country assessments 48
Table 4-3: Highly processed organic food as percentages of all certified organic food. Most important products 50
Table 5-1: Ranking retailers’ arguments when marketing organic food. Rank 55
Table 5-2: Use of any systematic and professional promotion of organic food after 1993 57
Table 6-1: Percentage of organic produce sold as organic: main products about 1997-98 62
Table 6-2: Percentage of organic produce sold as organic: minor products about 1997-98 65
Table 6-3: Price premiums for organic producers: main products about 1997-98. Percentage above prices of conventional producers 66
Table 6-4: Price premiums for organic producers: minor products about 1997-98. Percentage above prices of conventional producers 68
Table 6-5: Premiums paid by consumers of organic produce: main products about 1997-98. Percentage above prices of conventional produce 70
Table 6-6: Premiums paid by consumers of organic produce: minor products about 1997-98. Percentages above prices of conventional produce 71
Table 7-1: Characteristics of the national market for organic livestock feed. Countries 75
Table 7-2: Organically grown fodder crops: Countries distributed according to production for commercial sales or not 77
Table 7-3: Estimated imports of organically grown fodder cereals about 1997-98 78
Table 7-4: Import/export relations regarding fodder cereals about 1997-98 79
Table 8-1: Year when professional marketing of organic products began in different types of outlets 84
x
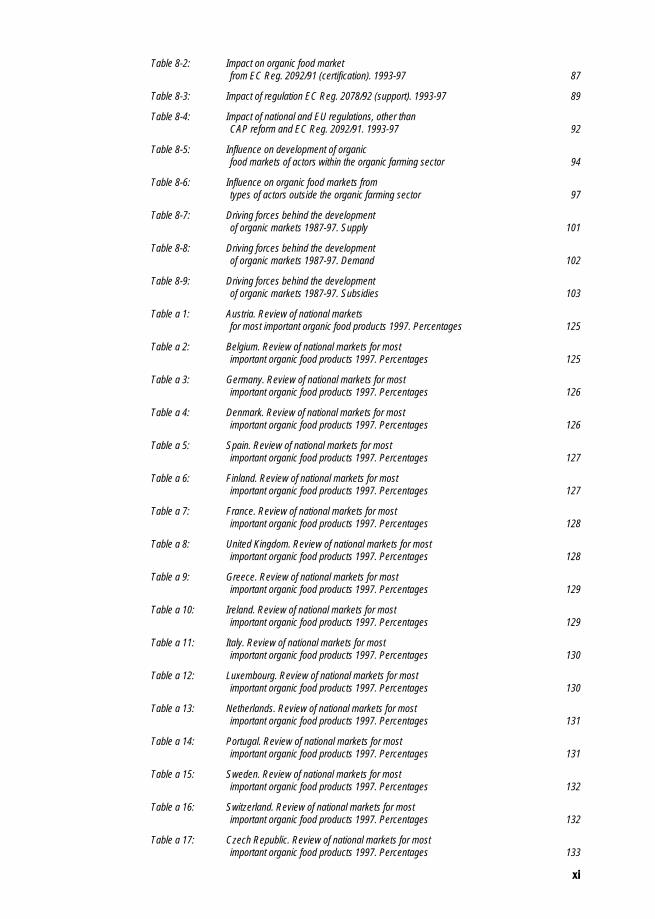
Table 8-2: Impact on organic food market from EC Reg. 2092/91 (certification). 1993-97 87
Table 8-3: Impact of regulation EC Reg. 2078/92 (support). 1993-97 89
Table 8-4: Impact of national and EU regulations, other than CAP reform and EC Reg. 2092/91. 1993-97 92
Table 8-5: Influence on development of organic food markets of actors within the organic farming sector 94
Table 8-6: Influence on organic food markets from types of actors outside the organic farming sector 97
Table 8-7: Driving forces behind the development of organic markets 1987-97. Supply 101
Table 8-8: Driving forces behind the development of organic markets 1987-97. Demand 102
Table 8-9: Driving forces behind the development of organic markets 1987-97. Subsidies 103
Table a 1: Austria. Review of national markets for most important organic food products 1997. Percentages 125
Table a 2: Belgium. Review of national markets for most important organic food products 1997. Percentages 125
Table a 3: Germany. Review of national markets for most important organic food products 1997. Percentages 126
Table a 4: Denmark. Review of national markets for most important organic food products 1997. Percentages 126
Table a 5: Spain. Review of national markets for most important organic food products 1997. Percentages 127
Table a 6: Finland. Review of national markets for most important organic food products 1997. Percentages 127
Table a 7: France. Review of national markets for most important organic food products 1997. Percentages 128
Table a 8: United Kingdom. Review of national markets for most important organic food products 1997. Percentages 128
Table a 9: Greece. Review of national markets for most important organic food products 1997. Percentages 129
Table a 10: Ireland. Review of national markets for most important organic food products 1997. Percentages 129
Table a 11: Italy. Review of national markets for most important organic food products 1997. Percentages 130
Table a 12: Luxembourg. Review of national markets for most important organic food products 1997. Percentages 130
Table a 13: Netherlands. Review of national markets for most important organic food products 1997. Percentages 131
Table a 14: Portugal. Review of national markets for most important organic food products 1997. Percentages 131
Table a 15: Sweden. Review of national markets for most important organic food products 1997. Percentages 132
Table a 16: Switzerland. Review of national markets for most important organic food products 1997. Percentages 132
Table a 17: Czech Republic. Review of national markets for most important organic food products 1997. Percentages 133
xi
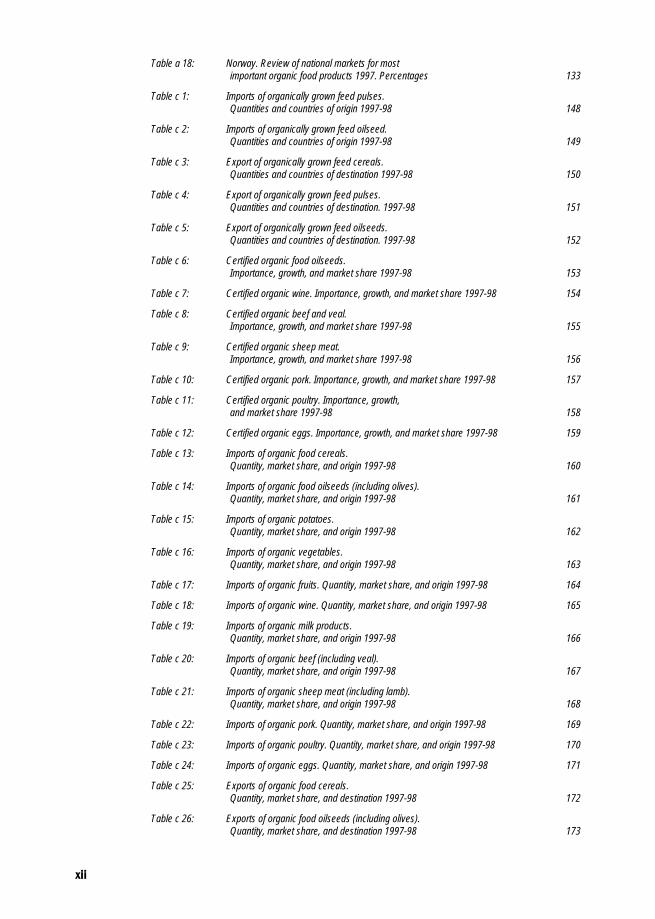
Table a 18: Norway. Review of national markets for most important organic food products 1997. Percentages 133
Table c 1: Imports of organically grown feed pulses. Quantities and countries of origin 1997-98 148
Table c 2: Imports of organically grown feed oilseed. Quantities and countries of origin 1997-98 149
Table c 3: Export of organically grown feed cereals. Quantities and countries of destination 1997-98 150
Table c 4: Export of organically grown feed pulses. Quantities and countries of destination. 1997-98 151
Table c 5: Export of organically grown feed oilseeds. Quantities and countries of destination. 1997-98 152
Table c 6: Certified organic food oilseeds. Importance, growth, and market share 1997-98 153
Table c 7: Certified organic wine. Importance, growth, and market share 1997-98 154
Table c 8: Certified organic beef and veal. Importance, growth, and market share 1997-98 155
Table c 9: Certified organic sheep meat. Importance, growth, and market share 1997-98 156
Table c 10: Certified organic pork. Importance, growth, and market share 1997-98 157
Table c 11: Certified organic poultry. Importance, growth, and market share 1997-98 158
Table c 12: Certified organic eggs. Importance, growth, and market share 1997-98 159
Table c 13: Imports of organic food cereals. Quantity, market share, and origin 1997-98 160
Table c 14: Imports of organic food oilseeds (including olives). Quantity, market share, and origin 1997-98 161
Table c 15: Imports of organic potatoes. Quantity, market share, and origin 1997-98 162
Table c 16: Imports of organic vegetables. Quantity, market share, and origin 1997-98 163
Table c 17: Imports of organic fruits. Quantity, market share, and origin 1997-98 164
Table c 18: Imports of organic wine. Quantity, market share, and origin 1997-98 165
Table c 19: Imports of organic milk products. Quantity, market share, and origin 1997-98 166
Table c 20: Imports of organic beef (including veal). Quantity, market share, and origin 1997-98 167
Table c 21: Imports of organic sheep meat (including lamb). Quantity, market share, and origin 1997-98 168
Table c 22: Imports of organic pork. Quantity, market share, and origin 1997-98 169
Table c 23: Imports of organic poultry. Quantity, market share, and origin 1997-98 170
Table c 24: Imports of organic eggs. Quantity, market share, and origin 1997-98 171
Table c 25: Exports of organic food cereals. Quantity, market share, and destination 1997-98 172
Table c 26: Exports of organic food oilseeds (including olives). Quantity, market share, and destination 1997-98 173
xii

Table c 27: Exports of organic potatoes. Quantity, market share, and destination 1997-98 174
Table c 28: Exports of organic vegetables. Quantity, market share, and destination 1997-98 175
Table c 29: Exports of organic fruits. Quantity, market share, and destination 1997-98 176
Table c 30: Exports of organic wine. Quantity, market share, and destination 1997-98 177
Table c 31: Exports of organic milk products. Quantity, market share, and destination 1997-98 178
Table c 32: Exports of organic beef (including veal). Quantity, market share, and destination 1997-98 179
Table c 33: Exports of organic sheep meat (including lamb). Quantity, market share, and destination 1997-98 180
Table c 34: Exports of organic pork. Quantity, market share, and destination 1997-98 181
Table c 35: Exports of organic poultry. Quantity, market share, and destination 1997-98 182
Table c 36: Exports of organic eggs. Quantity, market share, and destination 1997-98 183
Table c 37: Highly processed, certified organic food. Minor products. Percentages of all certified organic food products 184
Table c 38: Sales channels for organic food cereals. Percentages of total sales in each sales channel 1997-98 185
Table c 39: Sales channels. Organic food oilseeds including olives. Percentages of total sales in each sales channel 1997-98 186
Table c 40: Sales channels for organic potatoes. Percentages of total sales in each sales channel 1997-98 187
Table c 41: Sales channels for organic vegetables. Percentages of total sales in each sales channel 1997-98 188
Table c 42: Sales channels for organic fruits (including nuts). Percentages of total sales in each sales channel 1997-98 189
Table c 43: Sales channels for organic wine. Percentages of total sales in each sales channel 1997-98 190
Table c 44: Sales channels for organic milk products. Percentages of total sales in each sales channel 1997-98 191
Table c 45: Sales channels for organic beef and veal. Percentages of total sales in each sales channel 1997-98 192
Table c 46: Sales channels for organic sheep meat. Percentages of total sales in each sales channel 1997-98 193
Table c 47: Sales channels for organic pork. Percentages of total sales in each sales channel 1997-98 194
Table c 48: Sales channels for organic poultry. Percentages of total sales in each sales channel 1997-98 195
Table c 49: Sales channels for organic eggs. Percentages of total sales in each sales channel 1997-98 196
Table c 50: Impact of the EC CAP reform of 1992 on organic market supply and demand. 1993-97 197
xiii
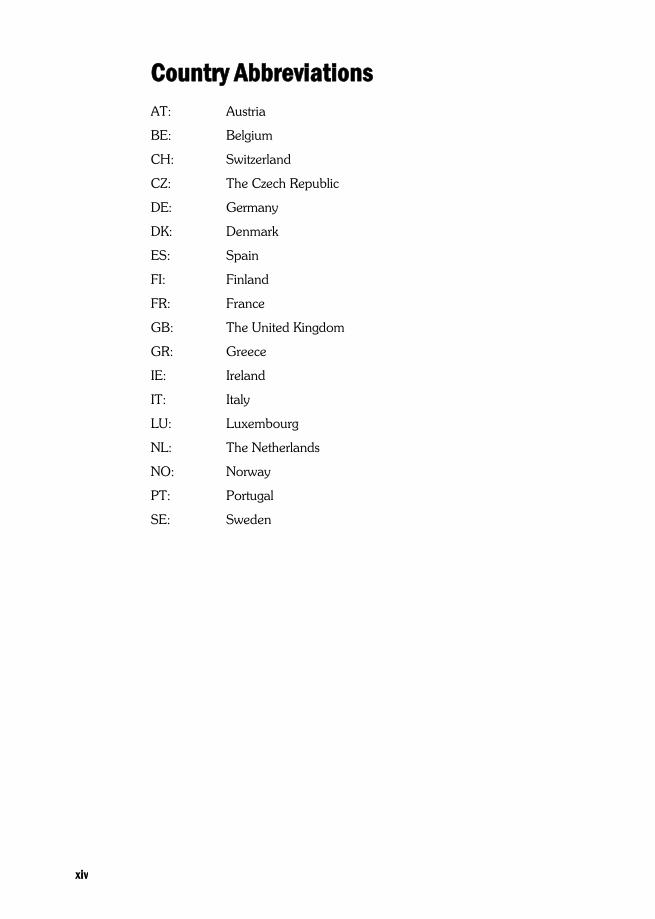
Country Abbreviations AT: Austria
BE: Belgium
CH: Switzerland
CZ: The Czech Republic
DE: Germany
DK: Denmark
ES: Spain
FI: Finland
FR: France
GB: The United Kingdom
GR: Greece
IE: Ireland
IT: Italy
LU: Luxembourg
NL: The Netherlands
NO: Norway
PT: Portugal
SE: Sweden
xiv

xv


1 Introduction The purpose of this report is to give an up-to-date overview on market growth and development for organic products in all EU member-countries plus 3 non-members of the EU. The background is the recent political interest in promoting organic farming, not least as part of EU agri-environmental policies which were introduced as part of the CAP Reform in 1992. This report is thus one of five aiming at the general objective to assess ex post i) the impact on organic farming of different policies: the mainstream and additional CAP Reform measures as well as regulations defining and controlling trade in organic products and other relevant policies; and ii) the contribution of organic farming to current agricultural and environmental policy objectives.
In this report the focus is on market impacts of policies and the contribution of organic food and feed markets to the general policy objectives. Agricultural policy works, to a large extent, through influencing the financial position of farmers. This has a direct impact on the supply of food products, whereas consumer demand and consumption are influenced less directly by such policies. Therefore, this analysis focuses more on market development as a response to the development in farmers’ production – and hence in supply – than on the market potentials in terms of consumer demand.
To obtain a full coverage of recent developments in all countries, this review is conducted mainly on the basis of interviews carried out by national experts with – as far as possible – the most significant marketing agents in each country. Collection of data aiming at describing the market situation in each country has thus been a major issue in preparing this report. Data are scarce in the field of organic markets, so the report has been very dependant on many national experts and researchers who willingly placed their time and knowledge at the project’s disposal. It needs to be emphasised that, without their input, few data would have been available for analysis.
In the rest of this chapter some methodological and theoretical considerations will be presented as basis for the overview of the current market situation presented in chapters 2 to 7. Chapters 8 and 9 provide an overview of developmental trends in all countries and draw attention to the current situation in the EU, with some emphasis on the effects of past EU policies and those which are considered desirable in the future.
1.1 Markets for organic products – theoretical considerations
When product supply is the primary focus of the analysis on market development, the situation is in many aspects similar to considering a firm preparing to introduce a new product (an innovation) in the market (Abrahamsen and Ingemann 1998). On the other hand, organic food was historically introduced to the food market in quite another way than
1

ordinary food innovations. That is, organic food products were not developed by a major food company in the globalised food sector and implanted into the food market as a new product. Rather, they were developed ‘from below’, that is, by innovating individuals who were recruited from amongst groups other than ordinary food producers and developers. These included pioneering farmers, consumers and scientists who invented the concept of organic farming. The concept was transformed into food products and traded by farmers in co-operation with processing firms and retailers, often also recruited from outside the ordinary food market.
In all countries the distribution of organic food thus developed from a small basis at the margin of the food market, under conditions which can hardly be characterised with market concepts (Hamm and Michelsen 1996). The lack of real markets for organic food relates – to some extent – to the idea of proximity between farmer and consumer, which gives organic farming high affinity to direct marketing. In some instances, however, organic products have more recently experienced a break-through in terms of reaching a genuine market – or at least market-like – situation, where organic food has become more or less an integral part of the food market. The concept that ‘Consumers should have the freedom of choice between organic and non-organic/conventional varieties of the same product’ is espoused by some food retailers in these situations (cf. Hamm and Michelsen 1996).
Against this background, an analysis of the development of markets for organic food encounters many fundamental problems stemming from the special circumstances surrounding the concept of organic food products. These problems also relate to the very essence of organic farming and hence organic food. The first issue is that organic food not only represents a group of new products as does, for instance, the introduction of new varieties of fruits or vegetables or soft drinks. Organic food in principle introduces a full range of separate products. Organic products are seen not only as competing with other varieties of fruits, vegetables, soft drinks etc., but as competing simultaneously with all products produced under non-organic conditions.
A second important issue for organic producers, as compared with their conventional colleagues, is that organic products need to be labelled in order to convey the message of their organic origin. Labelling implies certification of both farmers’ primary production and of any processing as well. Labelling of organic food thus establishes a separate regulatory regime including all steps of production. From this it follows that any attempt to process organic food not only includes the need to find suitable partners willing to do the job but also the need to solve many technical problems. Another difficulty is that a label of organic products is neither just a product name nor a brand backed by a firm which uses the label as part of a marketing strategy. The organic certification label is a prerequisite for promoting products as organic. At the same time it is a so-called club good in the sense that one single producer cannot prevent other producers from getting the same label if they fulfil the certification requirements (join the club) (Cornes and Sandler 1996). Hence, although all firms selling organic
2
food can benefit from a general advertising of organic products, one single firm cannot appropriate the full value of using the label in the promotion of its own products – other firms get part of the marketing effect for free.
A third issue is that supply cannot react quickly in response to changes in demand, because of the conversion period associated with organic farming. These and related problems make markets for organic products differ substantially from most other types of markets. The situation becomes even more complex as the food markets, and hence the developmental conditions for organic food markets as a whole, in different countries differ according to national specialities, an important point in particular when the markets are still small. Thus, any international study of markets for organic products must be considered in the light of considerable variations across countries.
1.1.1 Generic products and niche marketing
In order to clarify some general consequences for market development of the fundamental problems in developing markets for organic food, two issues from the marketing literature will be discussed here. The first issue is whether organic products are generic products and the second whether organic food markets are niche markets.
The question about generic products concerns the way a product is branded. Brands are used by firms to obtain a special preference for a product that is distinguished from other products of the same type only by the brand. The brand is supported strongly by promotion. Most often a branded product is promoted by the manufacturer (main example Coca Cola), but retailers may also develop and promote branded products. Generic products are identical to branded products but are not distinguished from competing products by a brand. Instead, the generic product only bears the general designation of the product – for instance a generic competitor to Coca Cola is just called ‘Cola’. Similarly, generic advertising concerns a type of product (Cola) rather than a distinct branded product (Coca Cola). According to the business dictionaries (For instance: A Concise Dictionary of Business 1990; cf. Kotler and Armstrong 1994) consumer prices for generic products are lower than for branded ones because of the lack of promotion efforts.
In the analysis of organic food markets, the question of generic products concerns the nature of the certification label of organic products. It is not a brand, as it is only a guarantee that production has followed the specified rules of organic farming. Anyone may use the organic label if it is certified that the relevant person or firm comply with the rules. Furthermore, the label ‘organic’ is not reserved for any specific product category but in principle may be used in relation to all kinds of food. Usually, organic food is more expensive than so-called conventional products, but that is not mainly due to promotion efforts. Rather, it is perceived as a function of the rules concerning cultivation and handling of products that lie behind the label and which secure the distinction of products from non-organic,
3
competing, products. Not many single firms promote the certification label itself. Rather, when organic certification is obtained, any firm may brand its organic products and support them with heavy promotion which leaves the organic label as only one – and perhaps less visible – distinctive feature related to the brand. In this case organic products which are not branded will probably be sold at lower prices than branded organic products, and hence the organic label appears as a way of characterising the whole class of organic products – in other words a generic label relating to general production standards rather than to the individual product.
The question of niche marketing concerns the scope of organic food markets. Niche marketing implies that a segment of a market is identified which, on the one hand, demands special qualifications of the supplier but, on the other hand, is so small that large firms find it uninteresting to exploit (A Concise Dictionary of Business 1990; Poulsen 1988). The interrelationship between customers and supplier may become so intense that the abilities of the supplier result in a monopoly in this particular field. Organic products clearly fulfil one of these provisions: suppliers of organic products must comply with the demands of the organic certification label and hence obtain a special competence. On the other hand, it is beyond any doubt that organic food consumers – at least in countries like Denmark and Sweden and seemingly also in France and the Netherlands – represent a segment of the general food market with so large potentials that they are met with growing interest from very large food firms.
As long as organic food is primarily traded in specialised organic food shops or in very small quantities in general stores, one may speak of a niche market. When general stores and supermarkets appear as the major distribution channel and the quantities sold grow beyond negligible shares of their turnover, it becomes however more problematic to speak of niche marketing. When large groups of consumers begin to demand and buy organic food regularly, although not always – as has been the case for some years in, for instance, Germany, Austria and Denmark – the term niche marketing appears misleading. Hence, under existing conditions organic products should no longer be seen as subject to niche marketing only. Larger market potentials have appeared in various countries. Existing networks of small, purely organic firms with a dominant position in small and demarcated (niche) markets for organic products show signs of breaking up in, for instance, Denmark and Austria. Larger firms with experience only in the general food market have begun to market organic food and thus supplemented – or, in many instances, replaced – the smaller firms (cf. Hamm and Michelsen 1996). This clearly implies a change from niche marketing to mass marketing and thus imposes new challenges to those firms which developed in the niche market.
1.1.2 A marketing mix approach
The special issues and problems of organic food markets are described in this study by structuring the report according to the concept of marketing mix as defined in a standard textbook on marketing strategy (Kotler and
4
Armstrong 1994). This choice implies that data are collected and analysed with the purpose of describing aspects of organic food markets as if they were key elements in a conscious marketing strategy. Even though this is far from being reality and the objective of this study is not to develop marketing strategies for organic farming, the marketing mix approach helps to structure data. Problems in market development become apparent in a way that sets the stage for finding solutions in terms of marketing strategies. And it is obvious that EU policies might contribute substantially to solving many types of problems for the development of any food market and hence for the organic food market too, not least if they are perceived within a framework of marketing strategy.
The choice of theoretical approach indicates that the description of the national organic food markets is guided by an assessment of the problems and potentials in the current situation as a basis for policy proposals. Other studies of organic food markets are directed more at collecting data as part of detecting market potentials to be exploited by individual firms (Tate 1991). Some of these focus mainly on studies of consumer behaviour in an attempt to detect what kind of demand organic food is to meet. This approach is not followed here. This study is different from studies of consumer demand because supply of organic food has been so scarce in the past that, up until now, a very important issue has been to establish organic food in the food market at all, and hence develop organic production under market conditions (Thimm et al. 1991). This is one consequence of the above-mentioned special problems relating to organic food production – not least of which is the two year conversion period that makes it impossible to react to increasing demand in the short term. This study also deviates from other market studies of organic farming as the main aim is not to calculate the current size or potentials of any specific product market, but rather to provide a general overview with focus on main product groups, in order to detect a range of developmental conditions for organic food markets and hence to present a basis for detecting general market potentials on a European scale.
The marketing mix approach used here is based on the four Ps introduced by (Kotler and Armstrong 1994) Place, Product, Promotion, and Price. The theory is not fully applied, as the organic sector of a country cannot meaningfully be treated like a firm. But the four Ps represent important aspects of marketing in general – not least aspects relevant in international comparisons.
For organic products, place has appeared a very decisive aspect. Sales channels for organic products include larger sales taking place outside the main channels for food in general, and this has consequences for all the other Ps: how products are defined, promoted, and priced. The importance of place is that through different channels different consumer segments are reached, as each channel attracts some consumer groups at the expense of others. Taking organic farming as a whole, a combination of different places may result in optimal earnings and optimal coverage of the consumer demand, but it may also be completely the reverse, if some channels are not available for organic products. ‘Place’ in any country focuses attention on
5

the composition of sales channels and their consequences in terms of services demanded from the organic food producers regarding product range transport, inventory and assortment.
Product is the definition of organic products/food as presented to consumers in the form of commodities. Product includes, among other aspects, the product variety, quality, design, packaging and brand name. It is under this heading that the definition of organic food through standards and certification is treated. Quality might only mean organic origin, as some customers may accept this as the main quality, but in other circumstances additional qualities may be demanded, for instance regarding design and packaging. It even seems that for a small production like organic farming, the available quantity is part of the quality of the product, not least because supplies are more vulnerable to variations in climatic and other natural conditions.
Promotion is communication with consumers. Information is needed to make consumers buy products. Publicity can be arranged by sellers or by the general public, as when political discussions on environment and animal welfare in some instances have given positive publicity to organic farming. Furthermore, information to sales personnel on the features that distinguish organic from non-organic products might also be important, in addition to general sales promotion.
Price is sometimes seen – not least among organic producers – as a simple derivative of costs plus reasonable profits. However, it is obvious that different choices concerning the product – even in agriculture – lead to different costs. And it is equally obvious that price not only represent an income to producers, but also a cost to customers. Different prices inevitably lead to different sales and earnings. But before reaching the consumer there are prices to processors and retailers which might vary because of discounts, allowances, credit terms etc. Thus price is not given from costs but is a variable to be negotiated and decided upon. Today it is generally accepted that consumers have to pay a price premium for organic food relative to non-organic food, but the level of the price premium may differ and there might be room for differences in the price setting on the basis of the different costs following decisions within the other Ps. It is not clear how much of the price premium is for extra costs to the farmer, the processor or the distributor or just for the special features relating to organic products.
The four Ps thus cover the main aspects of market developments in general and appear relevant for the development of organic food markets as well. In chapters 3 to 6, relevant information concerning each P is described and discussed.
1.2 Methodology and data quality
The quantity of organically grown products is small as a percentage of the total food market in all the countries included in this study, but the range of organic products is large. It is, therefore, a complex task to collect
6
information on organic food markets. The work is complicated by the fact that no clear distinction is made between organic and other types of food products in any official statistical accounts. Thus, information on the organic food market is scarce and is only available from some private organic organisations and/or private firms working in the market. These potential sources of information have different policies concerning willingness to provide information about market prices and quantities marketed. Information on market structure etc. appears even more difficult to obtain. Considering these aspects of data collection, the methodology used in this report is based on questionnaires sent to national experts in each of the 18 countries included in the project – 15 EU countries plus Switzerland, the Czech Republic, and Norway.
National experts summarised literature on their national markets and answered questions about the current situation for different organic products and the developmental trends. The basis for the answers were interviews with key informants in each country who, on a professional basis, follow the market and/or otherwise have an overview of the national situation. Using this technique made it possible to obtain estimates or informed guesses provided by national experts, as otherwise no information would have been available. Another feature of the questionnaire was that national experts were helped in focussing their attention on situations where information was scarce and thus efforts to obtain answers to each part would be large. Collection of information is concentrated on the product groups of highest importance in the national markets. Thus, national experts were requested to choose at least the five most important organic products in the national market, and collect as much information as possible about them. In the annex, tables including key information for the five most important products in each country can be found.
The questionnaires were completed by the national experts in the first half of 1998, on the basis of the latest information available. This usually covers the situation in the year 1997. In some cases (single products in single countries), more recent information is included, as the final adjustment of data was completed by the end of 1998.
With aspirations to include a general overview of the organic market in this study, it must be admitted that the statistical information received under these difficult conditions is incomplete and uncertain for most countries. Furthermore, some problems were encountered with consistency within each country, because data are based on estimations given by different persons working under different conditions. The same applies to international comparisons. Therefore, there seems to be no good basis for drawing up supply balance sheets for each country. In some cases the authors of this report were able to obtain supplementary information from other sources. In these instances, the national experts were asked to confirm the information and the data presented below is the full result of this dialogue.
It is thus clear that the information provided in this report is far from complete. On the other hand, the information obtained is, at present, one of the most serious attempts to give an overview of the market situation in the
7
15 EU member states and three non-EU member states. As the organic markets in all countries are growing quickly, and serious and reliable market information is becoming still more important for all actors in and around the market (including political authorities), there is an urgent need to build up official statistics for organic food in all countries and in the EU.
1.3 Other studies
The focus in this study on supply and marketing aspects of the development of the organic food market is, to some extent, based on experience from other studies. Only few studies on a comparative basis are available. One of the first and most cited is Tate (1991) who suggested a 25 percent annual growth rate as a conservative and realistic expectation for both production and consumption in Europe from 1990 to 1995. The basis for this was the best available data at the time, which, when compared to Foster and Lampkin (1999), appear very imprecise. To this was added qualitative evaluations based on interviews with key actors similar to those used in this study. In spite of the poor information base, the 25 percent annual growth rate estimate holds for EU and EFTA countries for the years 1991-96 (Lampkin 1999). Furthermore, Tate (1991) maintains that the rate of increase in consumption will be a function of the increase in production – that is, the conversion of farms – in the long run. The argument given is that significantly greater output will lead to lower prices, which in turn will encourage consumption. Thus, the strategic option for Tate was to increase supply whereas demand did not seem to be a critical issue. In the years after Tate’s report, supply has grown as expected but demand has not been influenced by the pricing mechanism in quite the way Tate expected. Price premiums persist and this confirms that demand did not become a critical issue during the 1990s in spite of the major increases in supplies. Demand increased without major price reductions.
A more ambiguous (and short-run) view appears in Hecq and Vaessen (eds.) (1994). This work is a collection of national reports that indicate various problems in organic production leading to major difficulties in fulfilling consumer demand. According to this report, only in Denmark were organic food producers able to increase sales after having adapted to the demands of supermarket chains. Farmers adapted production in response to a clear crisis in sales.
Taken together, the two reports reflect that acceptable descriptions of organic market development can be made on the basis of qualitative data and that the focus on supply and on organising the organic food chain from farmer to consumer is the critical issue. This is further illuminated by results from national studies of the organic food market as mentioned in the responses from the national experts to the survey which form the basis for this report.
The responses received from each country in the course of the present study include information on national studies of the domestic organic food market. All countries, except Greece and Sweden, reported recent studies,
8

in particular Italy, Switzerland, Spain, Germany and Finland – mainly countries in which organic farming has been developing for some time. On the other hand, only few studies are reported from the country with the largest organic sector, Austria.
The literature mentioned by national experts covers all parts of the marketing chain: primary producers (farmers), wholesalers and manufacturers, retailers (shops/chains) and consumers. The bulk of the studies, however, is focused on consumer demand. Some studies cover more than one part of the marketing chain and in several instances the main issue of a study is to describe the functioning of parts of, or the full network linking farmers with consumers. Often these studies conclude in institutional recommendations for improving market performance. Examples of recommendations are improvements of consumer knowledge of products, co-ordination of supplies and manufacturing, rather than more simple recommendations related to, for instance, the level of costs in production or distribution, of prices and of product qualities. This may be one among several signs of a general impression that the organic food market is immature – that is, it has not yet found a stable institutional framework and thus has a large development potential. However, the institutional recommendations also reflect that the limitations put on supply by the two year conversion period necessitate special institutional arrangements in order to secure a positive market development. Supply cannot react immediately to changes in demand and therefore this may lead to large changes in prices that can only be met with institutional arrangements aiming at balancing supply and demand both in the short and the long run.
The studies reported on primary producers’ focus on the composition of supply, attempts to explain farmers’ conversion behaviour by focusing on general market issues (such as the EU affiliation in Austria) (Zittmayr 1996) on the effects of subsidies (Hagner 1996), on farmers’ attitudes towards organic farming (Michelsen and Jaeger 1999; Michelsen and Zakora 1999; CEMASE 1996), or on which marketing channels farmers actually use (Hagner 1996; Kuhnert and Wirthgen 1997; Miele 1995). Many studies on wholesalers and manufacturers are mainly descriptive. In Germany and Belgium (Biofach-Magazin 12/1997; CRABE 1993) qualitative studies emphasise problems for wholesalers and manufacturers which include supply shortages, unclear sales channels and deepening price competition in situations where co-operation on distribution and logistics seem more needed in order to cover an unsatisfied consumer demand. In Belgium these problems led to increased import of organic food which again has led to lower prices and hence appear a barrier to national farmers’ conversion to organic farming. A study on the relative success of organic products in Austria confirms that organisation in the wholesaling and processing industries seems an important prerequisite for a break through in the food market (Zittmayr 1996).
Only few studies focus on retailers. They seem, however, indispensable for the successful market development in Denmark (Michelsen 1996) and are important for the result of Italian studies, for instance the one done by Albonetti (1995). Consumer studies focus on motivation to buy or avoid
9
buying organic produce. Motivation for buying organic food most often includes taking care of consumers’ own health (increasingly so after the BSE-crisis for beef) or – more altruistically – concern for the environment. Reasons for not buying organic food often include discussions of the price premium, but also institutional issues are of importance. They include consumers’ mistrust of, or confusion about, the implications of labelling organic products and what organic farming means as well as the non-availability of products in conventional food shops (Kissinger (unpubl.); CMA 1996; Forsa-Institut 1997; Hamm and Hinderer 1994; Albardiaz 1997; Väisänen 1995; Stroem 1995; Wier and Calverley 1999). In summarising the international consumer studies on organic food, Wier and Calverley (1999) point at five aspects of the organic food markets, which lead them to characterise these as immature:
in many countries, organic food has only recently become available in ordinary food shops such as supermarkets;
several analyses point at excess or ‘unsatisfied’ consumer demand in national markets;
high distribution costs prevail caused by small quantities;
amateurism characterises marketing efforts done by primary producers as well as processing and trading firms;
unclear labelling of organic food.
Consumer studies include several attempts to calculate price elasticities of the demand for organic food. How to manage the problems involved when modelling with only limited data available – let alone the different situations in different countries and even different regions of countries – seems unresolved, as it appears from several regionally-based market studies.
1.4 Structure of the report
The main purpose of this report is to give an up-to-date overview on market growth and the development of organic products in all EU member countries plus Switzerland, Norway, and the Czech Republic representing non-member states of the EU.
In chapters 2 to 7 an (static) overview of the current situation is given whereas developmental trends are discussed in chapter 8. Chapter 2 includes a general characterisation of the national markets for organic food, focusing on the most important products in each country and in the countries as a whole. An important question is whether national markets exist at all or whether, in some countries, the organic sector is so small and closed that market conditions do not exist. Then follow four chapters focusing on each of the Ps included in the marketing mix approach described in section 1.2 above: place, product, promotion, and price. Among these, place seems the most decisive for understanding the organic food market as place poses clear limitations to the potential effects of the other Ps. Place is therefore the theme of chapter 3. Issues included are the
10
domestic and international sales channels in each country for the most important products. Product is the theme of chapter 4, emphasising labelling together with two physical aspects of organic food: quality and degree of processing, which seem of special importance when compared with other food. In chapter 5 the focus is on the way organic food is promoted. Finally, in chapter 6, price relations of organic food are highlighted. A special market of importance for the production of organic animal products is the livestock feed market, and chapter 7 includes a description of the national markets. In this way the main focus of the report is on supply, which in the past appeared the most problematic part of market development.
This is partly due to the long reaction time to changes in demand caused by the conversion period. Furthermore, focus is on producing a general overview of the markets for organic products, rather than attempting to calculate the size or potential of any specific market.
The analysis of developmental aspects of organic food markets is made in chapter 8. Here focus is on both national and international influences on the development, and the perceived contribution of EU regulations to market development is discussed.
Chapter 9 concludes the report with perspectives on the European market for organic products. Finally, the annex includes supplementary information on the most important product groups for each country, on the questionnaire answered for each country and data collected which are summarised or not included in the tables of the main text.
11

2 General characteristics of national markets for organic food The aim of this chapter is to give a general characterisation of the national markets for organic food in the 18 countries studied here. The reason for this is that it is not clear from the outset that organic food is traded under market conditions in all countries. In the 18 countries as a whole, organically grown areas only counted for 1.3 percent of the total utilisable agricultural area (UAA) in 1996 (Foster and Lampkin 1999). Accordingly, the total European supply of organic food also accounts for only a marginal share of the products on the total European food market. The marginal position of organic food production is emphasised by the fact that in 11 of the 18 countries, the organic share of total agriculture areas was less than 1 percent. However, there is huge variation among the 18 countries, as Austria has the relatively largest organic sector, which covered 9.0 percent of the total agriculture area in 1996. These indications of organic food having a marginal position in at least some food markets makes it relevant to ask whether there is a market at all for organic products in all countries or whether products are distributed according to non-market conditions. The chapter includes a general description of the national markets for organic food. Furthermore, the five most important organic food products in each country are detected and their position in the market is described in terms at market shares and recent growth. Finally, the interrelationship between market shares and size of national organic sectors is illuminated.
2.1 The national markets for organic food
The very core of the market mechanism is that prices fluctuate freely in order to balance supply and demand. Thus, where market conditions prevail, prices tend to fall in periods of increasing supply while prices tend to increase in periods of increasing demand. The price function may be impaired in several ways. One important factor is the number of suppliers and buyers. In situations with only few suppliers or buyers, they may be able to exert monopolistic power over the other groups in the market – including consumers. Another important factor is the geographical dimension, that price differences between local markets are equalised by the flow of goods between geographical regions. Hence, in the context of this study, a minimum definition of market conditions is employed, which includes the following three conditions:
price fluctuation according to supply and demand,
the presence of several suppliers and buyers (more than three of each), and
a free flow of products between local markets.
12

Table 2-1: Market characteristics for organic agriculture products
AT BE DE DK ES FI FR GB GR IE IT LU NL PT SE CH CZ NO
Several suppliers and buyers (>3 on both sides)
3 3 3 3 3 3 3 3 3 3 3 3 3 3 3 3 3 3
Prices fluctuate according to changes in supply and demand
3 3 3 (3) 3 (3) – (3) 3 3 3 – 3 3 (3) 3 – 3
Goods flow between local markets according to price differences
3 3 3 3 3 (3) – – – 3 3 (3) – – (3) 3 – –
Source: Own data
3 = yes (3) = yes in some regions only/for some categories only – = no
13
14
In table 2-1 each of the national markets is characterised along these very simple lines. The table shows that there are more than 3 suppliers and buyers in the most important markets in all countries. Thus, formally there seem to be neither monopoly (among producers) nor monopsony (among buyers) conditions in any of the included countries. The national experts further emphasise that in no country there was a problem of having more than three buyers but less than three suppliers or vice versa. For the two other dimensions some problems are detected. Prices are not unambiguously free-moving in France, UK and the relatively small countries Denmark, Finland, Luxembourg, Sweden, and the Czech Republic. The problems are, however, varied. In France, UK, and Denmark, price fluctuations are hindered for milk products by long-term (up to several years) production contracts between farmers and industries/main distributors, with fixed prices more (Denmark) or less (UK) related to prices of conventional products. In the case where prices of organic products are related to conventional prices, organic farmers receive a premium over conventional prices. In Finland the problem is very few buyers and sellers in some products and very different price expectations on the two sides, leading to a stiffening of the market. Given the size of the country, it is no wonder that there is no regional price fluctuation in Luxembourg. In the Czech Republic, however, the organic food market is seen as so immature, that changes in production or demand do not cause price fluctuations in the market. Thus, prices for organic produce are at nearly the same level as prices for conventional products. In Spain the national expert was unable to explain why prices were very high in spite of excess supply. In Italy a similar pattern is found, and the explanation given is that some of the organic products do not appear on the markets for organic food, because it appears relatively easy for farmers to obtain subsidies for certified production while it is too difficult or too costly to market products. The supply from these organic farmers thus does not affect the organic food markets.
Finally, in the question on the regional flow of goods, several countries have experienced problems. In Greece and Norway this is caused by the very small size of production combined with the particularly difficult geographical conditions in both countries. In Finland the interregional flow of goods is limited by consumer preference for local products, while in France and Germany especially the free movement of raw milk products was hampered by long-term delivery contracts.
In 10 of the 18 countries, all three minimum requirements are met (with some reservations in three Scandinavian countries). Two countries, France and the Czech Republic, only comply with one requirement – in both instances the presence of more than three suppliers and buyers. In all remaining countries except Luxembourg, the regional flow of products is the main problem. To sum up, the market of organic products complies to a very minimum definition of market conditions in just a little more than half of the countries. Most problems relate to the regional movement of goods and to the fluctuation of prices according to supply and demand.
The issue of market condition prevalence in the national organic food markets was described more freely by national experts with special reference
14
to market transparency. The main issue of transparency is openness of prices and trading conditions. This might, however, be offset by lack of competition among producers, processing firms, wholesalers or retailers. If market transparency is hampered, it may lead to an inefficient allocation of economic resources to firms and economic sectors. The qualitative assessments done by national experts discloses even more nuances in the picture that appeared from table 2-1 and some ambiguities in the way market transparency and efficiency was obtained. In some countries the market for organic produce is judged transparent because it is dominated by a few actors who keep information on prices rather open (such as in Austria and Switzerland). In a country like Finland, however, lack of transparency is explained by few actors performing limited competition at all stages of linking producers and consumers. In other countries, openness and transparency seem to appear as the result of new entrants into the market (for example in France), while in Germany and Italy a large number of small wholesalers and manufacturers are seen as one of several causes of lack of market transparency.
These indications point to a complex interplay between market transparency and efficiency on the one hand and market dynamics on the other. In the Netherlands, a sales crisis developed in 1993 and this is seen as a vehicle for improving market efficiency because many firms in the organic sector went bankrupt and the remaining firms had to find a more efficient market structure, able to cope with lower prices. On the other hand, where the market is flourishing, market efficiency and transparency can decrease; secrecy was reported to be spreading in Denmark, for example. In most of the EU member states there is free price-setting, while in two of the non-EU member states (Switzerland and Norway) transparency is obtained by means of a more or less fixed pricing system. Farmers’ organised influence on price-setting seems a good vehicle for market transparency. This is at least mentioned in the two non-EU member states as well as in Germany up until 1990, and also currently in Ireland.
To conclude, there is a functioning market for organic produce in all countries in terms of minimum requirements with respect to the number of actors. For price fluctuation and the flow of goods problems were detected in some countries – not least France and the Czech Republic. Even more problems are associated with market transparency and market efficiency depending on the situation in each country – and on the market dynamics as well. Market transparency is perhaps a matter of the maturity and size of the market.
15

16
2.2 The most important certified organic food products
The countries selected for this study vary in most aspects including the composition of the national food markets in general, let alone of the organic food markets. Even though most products may be available in all countries, they are not considered of equal importance. For instance wines and olive oils are considered important organic food product groups in the Mediterranean countries whereas animal products like milk are considered important in Scandinavian countries. Given the major difficulties in obtaining any information on product groups, it was decided not to focus collection of information on similar products in all countries, which would have been useful to make information fully comparable between countries. Instead, focus was put on the five product groups which appeared most important in each individual country. Importance is a very qualitative concept as products may be important for different reasons. In some cases, products are judged important because they have been a long time in the market. In other cases importance relates to market share or market growth. National experts were asked to rank the importance of at least five product groups. On this basis, information on different products was collected in each country – including the most important ones in each country. This methodology makes comparisons difficult.
In table 2-2, the results of the ranking procedure is summarised. The table shows that rankings differ considerably between countries. Among the 13 product groups mentioned, only two (pork and poultry) were not ranked among the five most important ones in any country. No product group was ranked among the five most important in all countries. On the other hand it is evident that five product groups appear important in many countries – between 12 and 16. These segments are in ranked order:
1. Vegetables (16 countries).
2. Cereals (14 countries).
3. Milk products (13 countries).
4. Potatoes (12 countries (counted together with vegetables in 1 country)).
5. Fruits (12 countries (counted together with vegetables in 1 country)).
In spite of the differences in national rankings, there is relative agreement among countries in viewing these five product groups as the most important ones. First, all the five product groups are ranked high in 12 to 16 countries. Second, the priority 1 product group of all countries except Greece and Norway is included among the five. The ranking list shows that plant products in general are found more important than animal products. Among the five groups, milk products is the only one based on animal production. The relative cross national agreement of the ranking of product groups forms the basis for the general description of the markets given in tables 2-3 to 2-7 below. In most cases the information on the
ifferences in national rankings, there is relative agreement among countries in viewing these five product groups as the most important ones. First, all the five product groups are ranked high in 12 to 16 countries. Second, the priority 1 product group of all countries except Greece and Norway is included among the five. The ranking list shows that plant products in general are found more important than animal products. Among the five groups, milk products is the only one based on animal production. The relative cross national agreement of the ranking of product groups forms the basis for the general description of the markets given in tables 2-3 to 2-7 below. In most cases the information on the
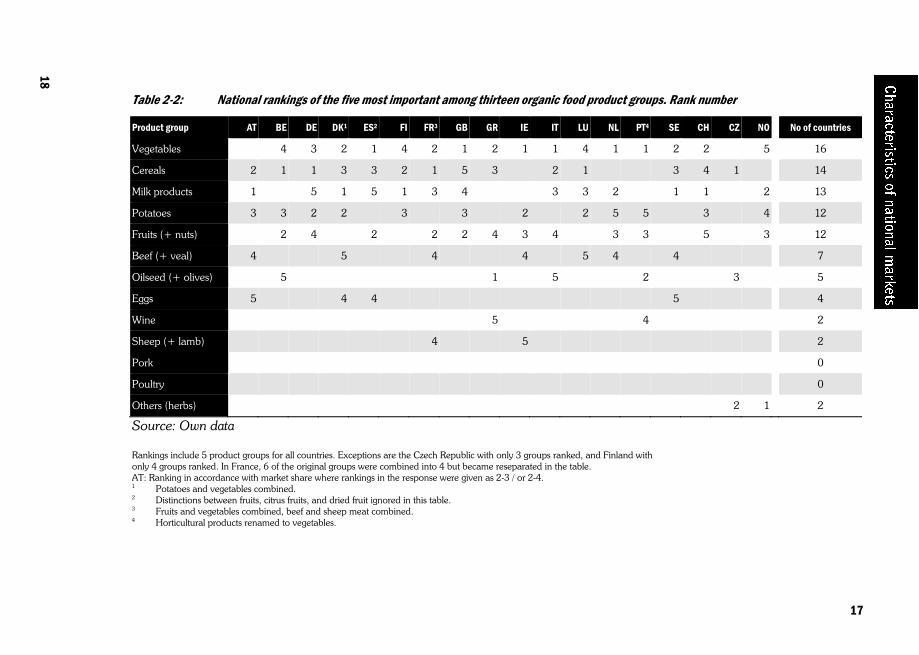
Table 2-2: National rankings of the five most important among thirteen organic food product groups. Rank number
Product group AT BE DE DK1 ES2 FI FR3 GB GR IE IT LU NL PT4 SE CH CZ NO No of countries
Vegetables 4 3 2 1 4 2 1 2 1 1 4 1 1 2 2 5 16
Cereals 2 1 1 3 3 2 1 5 3 2 1 3 4 1 14
Milk products 1 5 1 5 1 3 4 3 3 2 1 1 2 13
Potatoes 3 3 2 2 3 3 2 2 5 5 3 4 12
Fruits (+ nuts) 2 4 2 2 2 4 3 4 3 3 5 3 12
Beef (+ veal) 4 5 4 4 5 4 4 7
Oilseed (+ olives) 5 1 5 2 3 5
Eggs 5 4 4 5 4
Wine 5 4 2
Sheep (+ lamb) 4 5 2
Pork 0
Poultry 0
Others (herbs) 2 1 2
Source: Own data
Rankings include 5 product groups for all countries. Exceptions are the Czech Republic with only 3 groups ranked, and Finland with only 4 groups ranked. In France, 6 of the original groups were combined into 4 but became reseparated in the table. AT: Ranking in accordance with market share where rankings in the response were given as 2-3 / or 2-4. 1 Potatoes and vegetables combined. 2 Distinctions between fruits, citrus fruits, and dried fruit ignored in this table. 3 Fruits and vegetables combined, beef and sheep meat combined. 4 Horticultural products renamed to vegetables.
17
18
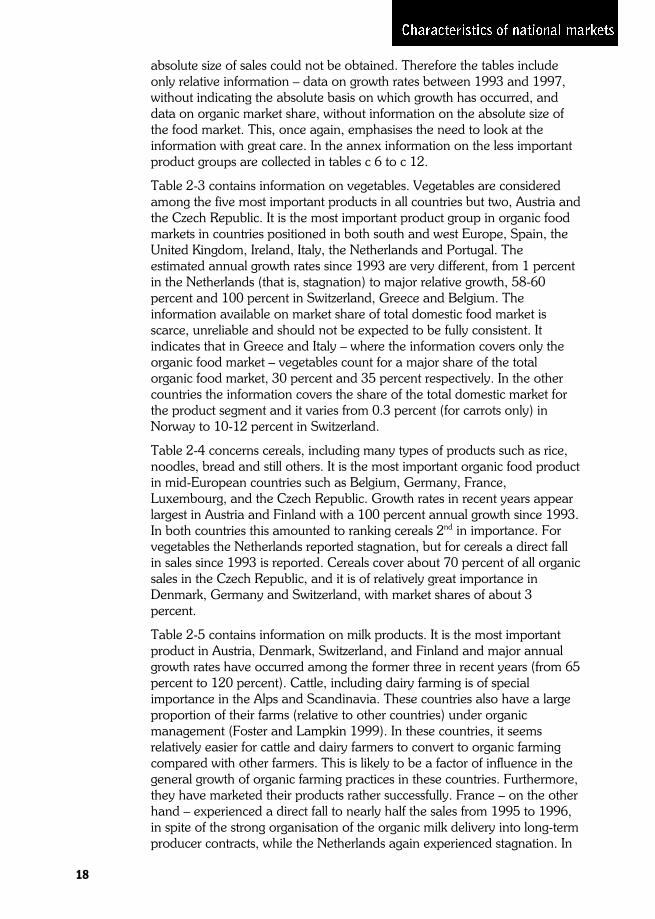
absolute size of sales could not be obtained. Therefore the tables include only relative information – data on growth rates between 1993 and 1997, without indicating the absolute basis on which growth has occurred, and data on organic market share, without information on the absolute size of the food market. This, once again, emphasises the need to look at the information with great care. In the annex information on the less important product groups are collected in tables c 6 to c 12.
Table 2-3 contains information on vegetables. Vegetables are considered among the five most important products in all countries but two, Austria and the Czech Republic. It is the most important product group in organic food markets in countries positioned in both south and west Europe, Spain, the United Kingdom, Ireland, Italy, the Netherlands and Portugal. The estimated annual growth rates since 1993 are very different, from 1 percent in the Netherlands (that is, stagnation) to major relative growth, 58-60 percent and 100 percent in Switzerland, Greece and Belgium. The information available on market share of total domestic food market is scarce, unreliable and should not be expected to be fully consistent. It indicates that in Greece and Italy – where the information covers only the organic food market – vegetables count for a major share of the total organic food market, 30 percent and 35 percent respectively. In the other countries the information covers the share of the total domestic market for the product segment and it varies from 0.3 percent (for carrots only) in Norway to 10-12 percent in Switzerland.
Table 2-4 concerns cereals, including many types of products such as rice, noodles, bread and still others. It is the most important organic food product in mid-European countries such as Belgium, Germany, France, Luxembourg, and the Czech Republic. Growth rates in recent years appear largest in Austria and Finland with a 100 percent annual growth since 1993. In both countries this amounted to ranking cereals 2nd in importance. For vegetables the Netherlands reported stagnation, but for cereals a direct fall in sales since 1993 is reported. Cereals cover about 70 percent of all organic sales in the Czech Republic, and it is of relatively great importance in Denmark, Germany and Switzerland, with market shares of about 3 percent.
Table 2-5 contains information on milk products. It is the most important product in Austria, Denmark, Switzerland, and Finland and major annual growth rates have occurred among the former three in recent years (from 65 percent to 120 percent). Cattle, including dairy farming is of special importance in the Alps and Scandinavia. These countries also have a large proportion of their farms (relative to other countries) under organic management (Foster and Lampkin 1999). In these countries, it seems relatively easier for cattle and dairy farmers to convert to organic farming compared with other farmers. This is likely to be a factor of influence in the general growth of organic farming practices in these countries. Furthermore, they have marketed their products rather successfully. France – on the other hand – experienced a direct fall to nearly half the sales from 1995 to 1996, in spite of the strong organisation of the organic milk delivery into long-term producer contracts, while the Netherlands again experienced stagnation. In
18

Denmark and Austria, milk products cover significant parts of the food market, between 8 and 14 percent. In Finland, the United Kingdom, and Germany, organic products only cover marginal shares of the total market for milk products. In Germany, supply of organic milk is much higher than demand because of marketing problems. Large quantities of organically produced milk is thus not sold as organic.
Table 2-3: Organic vegetables. Importance and growth in national markets
Importance. Rank
Approximate growth rate/year for sales, 1993-97. Percentage
Current share of total domestic food market. Percentage1
AT >5 nd nd
BE 4 100 nd
DE 3 15 1.7 (2.62)
DK 2 30-40 6-10
ES 1 nd nd
FI 4-5 20 nd
FR4 2 nd nd
GB 1 18 2.3
GR 2 60 303
IE 1 nd nd
IT 1 30 353
LU 4 40 4-52
NL 1 1 nd
PT 1 10 <0.1
SE 2 28 3-4
CH 2 58 10-12
CZ nd nd nd
NO5 5 10 0.3
Source: Own data
1 Share of quantities if no other remark. 2 Share of turnover. 3 Share or turnover of organic market only. In Italy, the turnover of organic food is estimated to cover
1.1 per cent of total food sector turnover. 4 Fruits and vegetables. 5 Carrots. >5 = Response given for the 5 most important groups, among which this product group was not included. nd = no data available
19
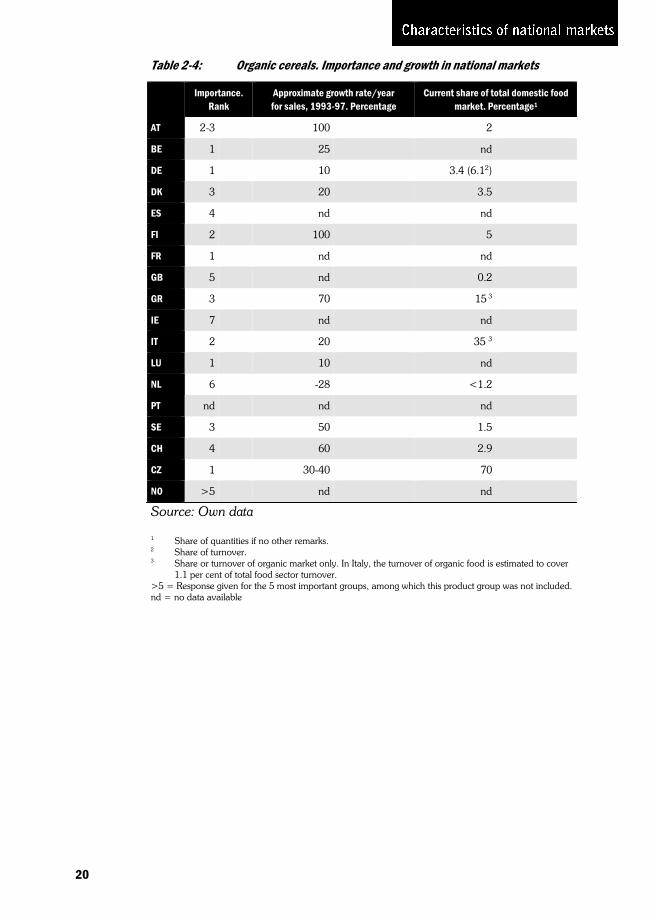
Table 2-4: Organic cereals. Importance and growth in national markets
Importance. Rank
Approximate growth rate/year for sales, 1993-97. Percentage
Current share of total domestic food market. Percentage1
AT 2-3 100 2
BE 1 25 nd
DE 1 10 3.4 (6.12)
DK 3 20 3.5
ES 4 nd nd
FI 2 100 5
FR 1 nd nd
GB 5 nd 0.2
GR 3 70 15 3
IE 7 nd nd
IT 2 20 35 3
LU 1 10 nd
NL 6 -28 <1.2
PT nd nd nd
SE 3 50 1.5
CH 4 60 2.9
CZ 1 30-40 70
NO >5 nd nd
Source: Own data
1 Share of quantities if no other remarks. 2 Share of turnover. 3 Share or turnover of organic market only. In Italy, the turnover of organic food is estimated to cover
1.1 per cent of total food sector turnover. >5 = Response given for the 5 most important groups, among which this product group was not included. nd = no data available
20
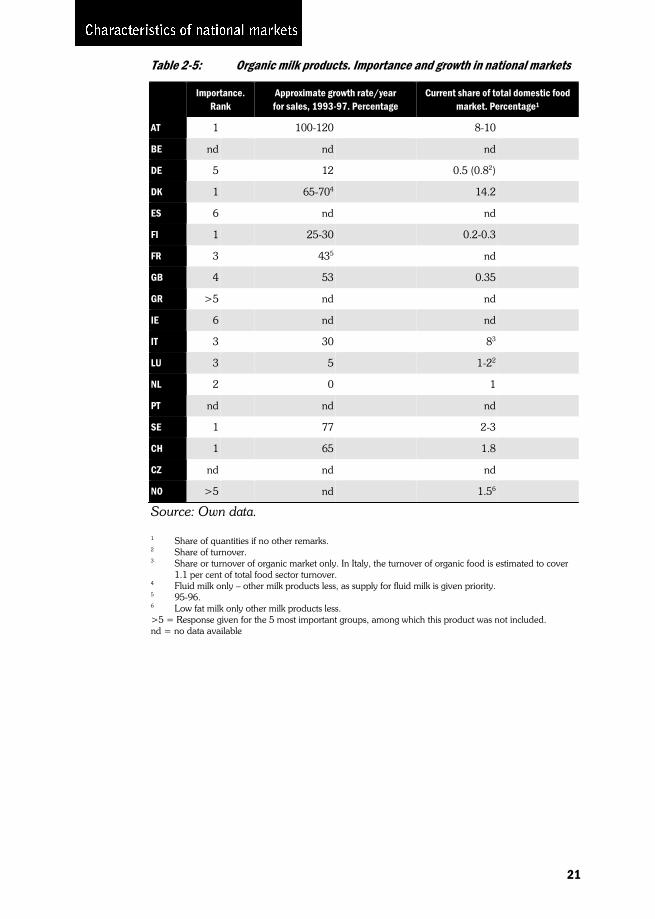
Table 2-5: Organic milk products. Importance and growth in national markets
Importance. Rank
Approximate growth rate/year for sales, 1993-97. Percentage
Current share of total domestic food market. Percentage1
AT 1 100-120 8-10
BE nd nd nd
DE 5 12 0.5 (0.82)
DK 1 65-704 14.2
ES 6 nd nd
FI 1 25-30 0.2-0.3
FR 3 435 nd
GB 4 53 0.35
GR >5 nd nd
IE 6 nd nd
IT 3 30 83
LU 3 5 1-22
NL 2 0 1
PT nd nd nd
SE 1 77 2-3
CH 1 65 1.8
CZ nd nd nd
NO >5 nd 1.56
Source: Own data.
1 Share of quantities if no other remarks. 2 Share of turnover. 3 Share or turnover of organic market only. In Italy, the turnover of organic food is estimated to cover
1.1 per cent of total food sector turnover. 4 Fluid milk only – other milk products less, as supply for fluid milk is given priority. 5 95-96. 6 Low fat milk only other milk products less. >5 = Response given for the 5 most important groups, among which this product was not included. nd = no data available
21
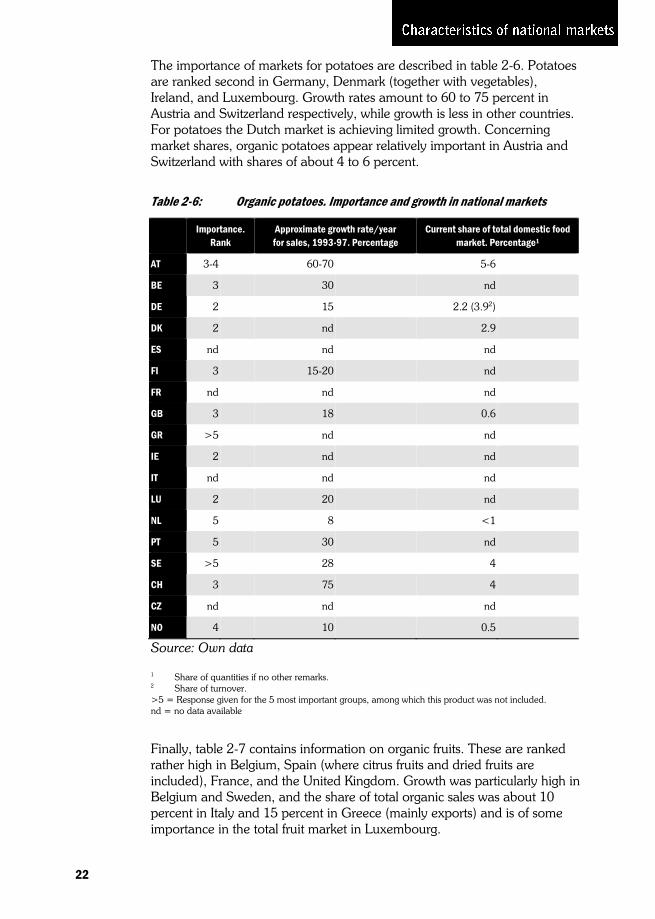
The importance of markets for potatoes are described in table 2-6. Potatoes are ranked second in Germany, Denmark (together with vegetables), Ireland, and Luxembourg. Growth rates amount to 60 to 75 percent in Austria and Switzerland respectively, while growth is less in other countries. For potatoes the Dutch market is achieving limited growth. Concerning market shares, organic potatoes appear relatively important in Austria and Switzerland with shares of about 4 to 6 percent.
Table 2-6: Organic potatoes. Importance and growth in national markets
Importance. Rank
Approximate growth rate/year for sales, 1993-97. Percentage
Current share of total domestic food market. Percentage1
AT 3-4 60-70 5-6
BE 3 30 nd
DE 2 15 2.2 (3.92)
DK 2 nd 2.9
ES nd nd nd
FI 3 15-20 nd
FR nd nd nd
GB 3 18 0.6
GR >5 nd nd
IE 2 nd nd
IT nd nd nd
LU 2 20 nd
NL 5 8 <1
PT 5 30 nd
SE >5 28 4
CH 3 75 4
CZ nd nd nd
NO 4 10 0.5
Source: Own data
1 Share of quantities if no other remarks. 2 Share of turnover. >5 = Response given for the 5 most important groups, among which this product was not included. nd = no data available
Finally, table 2-7 contains information on organic fruits. These are ranked rather high in Belgium, Spain (where citrus fruits and dried fruits are included), France, and the United Kingdom. Growth was particularly high in Belgium and Sweden, and the share of total organic sales was about 10 percent in Italy and 15 percent in Greece (mainly exports) and is of some importance in the total fruit market in Luxembourg.
22
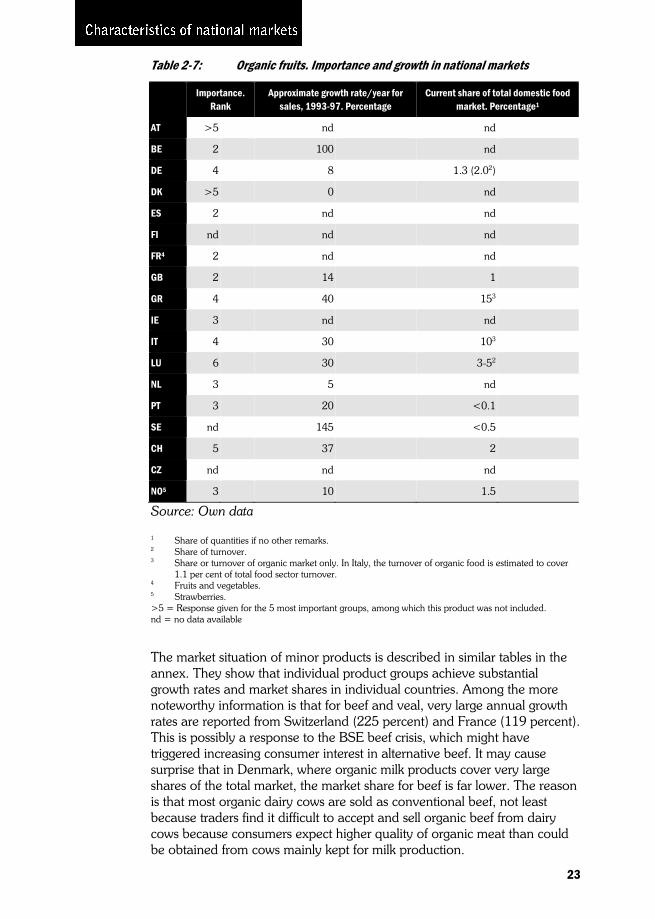
Table 2-7: Organic fruits. Importance and growth in national markets
Importance. Rank
Approximate growth rate/year for sales, 1993-97. Percentage
Current share of total domestic food market. Percentage1
AT >5 nd nd
BE 2 100 nd
DE 4 8 1.3 (2.02)
DK >5 0 nd
ES 2 nd nd
FI nd nd nd
FR4 2 nd nd
GB 2 14 1
GR 4 40 153
IE 3 nd nd
IT 4 30 103
LU 6 30 3-52
NL 3 5 nd
PT 3 20 <0.1
SE nd 145 <0.5
CH 5 37 2
CZ nd nd nd
NO5 3 10 1.5
Source: Own data
1 Share of quantities if no other remarks. 2 Share of turnover. 3 Share or turnover of organic market only. In Italy, the turnover of organic food is estimated to cover
1.1 per cent of total food sector turnover. 4 Fruits and vegetables. 5 Strawberries. >5 = Response given for the 5 most important groups, among which this product was not included. nd = no data available
The market situation of minor products is described in similar tables in the annex. They show that individual product groups achieve substantial growth rates and market shares in individual countries. Among the more noteworthy information is that for beef and veal, very large annual growth rates are reported from Switzerland (225 percent) and France (119 percent). This is possibly a response to the BSE beef crisis, which might have triggered increasing consumer interest in alternative beef. It may cause surprise that in Denmark, where organic milk products cover very large shares of the total market, the market share for beef is far lower. The reason is that most organic dairy cows are sold as conventional beef, not least because traders find it difficult to accept and sell organic beef from dairy cows because consumers expect higher quality of organic meat than could be obtained from cows mainly kept for milk production.
23

2.3 Market shares and organic sector size
In the tables above, the relative importance of organic food in the domestic markets is presented. No pattern can be discerned such as consistently high market shares of organic products in some countries and low in others. In this section, it is discussed whether there is a relationship between size of domestic production and of domestic markets. A direct relationship should not be expected, because the degree of food self-sufficiency is very different between countries. For example, Denmark and the Netherlands are in general main exporters of food, while Germany and the United Kingdom are main importers. However, keeping in mind the history of the development of organic farming, which involved consumers and others outside agriculture, this development might have occurred simultaneously with, or possibly have influenced, the development of the domestic market for organic food. Therefore, in table 2-8, a summary of the findings shown in tables 2-4 to 2-7 is compared with the size of organic farming relative to all domestic farming – the organic sector size.
The table includes information about the relative size of the organic sector in terms of the total agriculture area. It is, however, worth noting that the average size of organic and non-organic farms varies much between countries. In Austria, Finland, and Italy, organic farms appear larger than the national average while organic farms are clearly smaller than the national average in Sweden and Norway.
In the table, the countries are ordered according to the relative size of the organic sector to facilitate the search for correspondence between market shares and organic sector size. As in the case of market shares of product groups, the size of the organic sector also varies substantially between countries, from 5-9 percent of domestic agriculture in Austria and Switzerland to less than 0.5 percent in nine of the eighteen countries. Countries where the organic sector is over 1 percent of the total agricultural sector also report the largest shares in the domestic markets of the five most important product groups. Furthermore, market shares for at least one product group exceed 3 percent in all countries with organic sectors above 1 percent with the exception of Italy where no information is available.
For some products, market shares do not vary with organic sector size. For example, cereals make up between 1.5 percent and 5 percent of the total domestic market in countries with very different organic sector sizes. Market shares for some other products, such as milk products, vary considerably between countries with similar sector sizes. In countries with organic sectors above 2 percent, market shares vary from approximately 0.2 percent in Finland via 2 percent in Sweden and Switzerland to 10 percent in Austria. Denmark has the largest market share for milk products (14 percent) and a sector size less than 2 percent. A pattern similar to milk is found for vegetables with a high market share and high sector size in Switzerland and low market share combined with large sector size in Sweden and Germany. Only fruits covers small market shares in all countries.
24

The table also illustrates whether there is a correlation between market growth and sector size. It appears that market growth (which is reported more frequently than market share) of a substantial size (more than 50 percent) is concentrated among the six countries with the largest organic sector size. It points to the likelihood that, in general, a minimum domestic production is a prerequisite for market development.
To sum up table 2-8 shows some relationship – however weak – between domestic organic production of some importance on the one hand and the development of organic food markets on the other hand. Among the five main product groups, cereals appear to be a basic product group in the markets of all countries with an organic sector of some importance. For potatoes, the market share varies positively with sector size while vegetables and milk products appear important products in some countries and not in others, independent of the organic sector size. Fruits are of little importance irrespective of sector size.
25
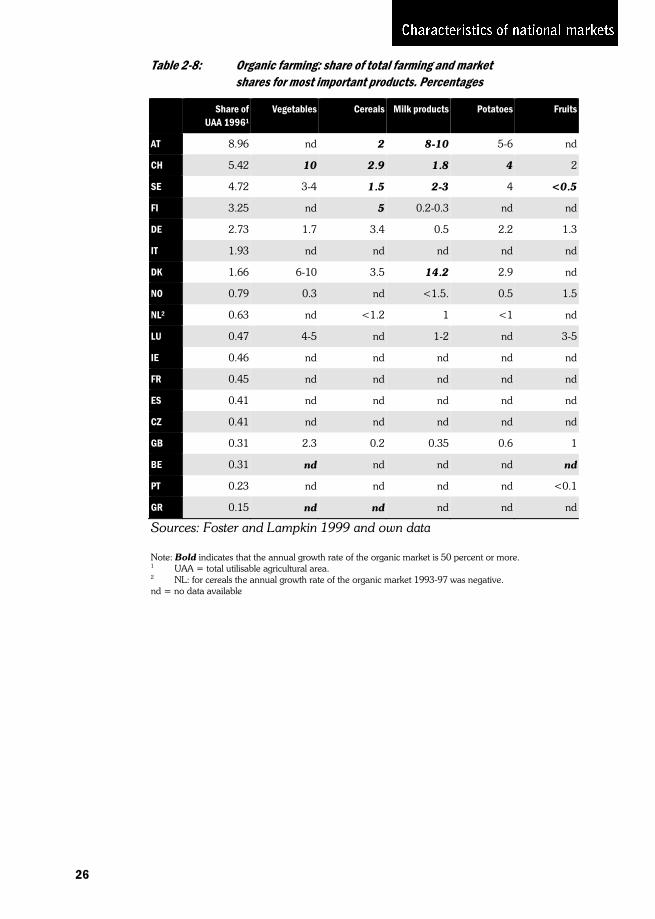
Table 2-8: Organic farming: share of total farming and market shares for most important products. Percentages
Share of UAA 19961
Vegetables Cereals Milk products Potatoes Fruits
AT 8.96 nd 2 8-10 5-6 nd
CH 5.42 10 2.9 1.8 4 2
SE 4.72 3-4 1.5 2-3 4 <0.5
FI 3.25 nd 5 0.2-0.3 nd nd
DE 2.73 1.7 3.4 0.5 2.2 1.3
IT 1.93 nd nd nd nd nd
DK 1.66 6-10 3.5 14.2 2.9 nd
NO 0.79 0.3 nd <1.5. 0.5 1.5
NL2 0.63 nd <1.2 1 <1 nd
LU 0.47 4-5 nd 1-2 nd 3-5
IE 0.46 nd nd nd nd nd
FR 0.45 nd nd nd nd nd
ES 0.41 nd nd nd nd nd
CZ 0.41 nd nd nd nd nd
GB 0.31 2.3 0.2 0.35 0.6 1
BE 0.31 nd nd nd nd nd
PT 0.23 nd nd nd nd <0.1
GR 0.15 nd nd nd nd nd
Sources: Foster and Lampkin 1999 and own data
Note: Bold indicates that the annual growth rate of the organic market is 50 percent or more. 1 UAA = total utilisable agricultural area. 2 NL: for cereals the annual growth rate of the organic market 1993-97 was negative.
nd = no data available
26
2.4 Summary
Measured against the total agriculture area in the 18 European countries studied here, organic farming covers only a marginal part. This influences the general characteristics of the markets. Minimum requirements for the proper functioning of a market are met in a majority of countries with problems associated to the free setting of prices and a corresponding flow of goods within countries. Furthermore, problems are detected concerning market transparency and market efficiency. The problems vary strongly according to the national circumstances and may be seen as a matter of both maturity and size of the market.
Across countries 5 product groups appear clearly more important than others. They are vegetables, cereals, milk products, potatoes, and fruits – i.e. four groups based on plant production and one based on animal production. These five were ranked among the five most important organic food product groups by informants in 12-16 countries and most information was available for them. The analysis in the following chapters will therefore mainly be based on them. For each product group, however, large variations occur between countries. Market shares vary from less than one percent for many products in many countries to up to about ten percent for milk products and vegetables in individual countries. Market growth also varies considerably. At the one end is the Netherlands which recently experienced decreasing markets for organic food. At the other end are several countries (Austria, Denmark, Sweden, the Czech Republic) with annual growth rates above 70-100 percent for several products.
The relationship between sector size and market development is weak. However, a minimum domestic production seems a necessary prerequisite for market development. Among the product groups, cereals appears basic in all countries with organic sectors of some importance, while vegetables and milk products are important in some countries but not in others, independent of the size of the organic sector.
The huge variation between national markets is explained by differences in national agriculture and food consumption. Nevertheless, the variation suggests that major market potentials are at hand for a further development of organic farming. In the chapters that follow, main aspects of the variation will be described and form the basis for considering the conditions under which the expansion of organic farming was integrated into the general food market.
27
3 Place – Sales channels for organic food Chapter 2 showed that the organic food market is only a small segment of the larger general food market in all countries and for all products. With small quantities produced and distributed, it becomes crucial that producers have channels which enable communication with those consumers who are most interested in the products. Hence, distribution of organic products is a central parameter in the success of organic agriculture, as mentioned in many studies (see section 1.3). Some sales channels specialise in small quantities of products – such as small and specialised shops – while others specialise in large quantities – such as supermarket chains and hypermarkets. Therefore, when only small quantities of organic food are available, distribution would be expected to occur primarily in channels designed for trading small quantities. The function of sales channels is, however, not only related to quantities. Different types of outlets address consumers with different preferences for organic food and different shopping habits.
Most consumers buy food in supermarkets. Therefore, it should be expected that organic food market expansion will take place in those sales channels. Against the expectation of high supermarket sales it should be taken into consideration that organic farming in its early phases developed only very small scale production and further, that organic farming ideology often includes a quest for proximity of production to consumption in organic movements. Hence, not all producers may be able, or willing, to follow the same distribution strategy. Consequently, a mix of different sales channels may be found in each country. A description of the sales channels in the 18 countries studied here is the topic of the first part of this chapter.
The problems of sales channels are not only relevant within countries but have an international dimension as well. However, many organic farming movements espouse proximity of producers to consumers in order to minimise transport, which influences trade. On the other hand, when demand for organic food exceeds local supply and combines with excess supply in another market, it results in trade across local, regional or even national borders. The trade across national borders is mapped and discussed in the second part of this chapter.
3.1 Market structure
In its early days, the organic food market developed outside the conventional sales channels. This was caused either by the organic movements themselves – seeking to negate what they saw as the ‘conventional’ food production and marketing concept – or by the conventional traders. Negation of ‘conventional’ food production expressed itself in close and direct trade relationships between producers and consumers. Conventional traders, on their side, often saw no gain in introducing only small quantities of products that, to them, did not appear much different from non-organic produce. For them, the main difference
28
seemed to be that organic products did not live up to any standards other than those set by the organic movements themselves, with little reference to market demand. A major exception to this picture is United Kingdom where supermarket sales developed very early.
Against this background, several specific sales channels developed in the first years of the development of organic agriculture:
direct sales from farmers to consumers became a very important option, in the form of farm shops, participation in weekly markets or consumer subscriptions, with one or a few farmers delivering vegetables and fruits to consumers on a regular basis;
sales to shops specialising in organic food products, as they in general target consumers interested in non-conventional products – whether whole food or health-food shops;
sales to conventional, specialised shops that took an interest in offering organic products along with other types of specialised products – for instance organic bread in a baker’s shop selling several other types of special bread.
Common to these three sales channels was that the trade of organic food was more or less segregated from trade of non-organic food. The quantities sold through these channels were often small, with only small segments of consumers being reached. If producers wanted to sell larger quantities, or different products than could be accommodated in these minor marketing channels, they had to approach the channels serving the larger conventional food market:
the general stores, which in most countries cover large parts of the food trade, whether through supermarkets or hyper markets.
Trading within the general stores in general implies that more aspects of trade has to be adapted than when dealing within the smaller, usually separate, organic sales channels. The general stores, especially when organised in supermarket chains, demand large quantities of a few specified products of a specified, homogeneous quality at a specified time and with a high rate of turnover. Furthermore, the price profile is clearer with consumer price premiums lower than in the other sales channels. In general, as a rule of thumb, 20 to 30 percent consumer price premium is said to be used as a maximum when general stores are considering the introduction of new products (see Infood 1998 for Denmark, but this is reported from several other countries as well). Hence, price and trading conditions are expected to be the focus of negotiations between producers of organic food and general stores. In the other three channels, focus is not so much on quantity and rate of turnover, and hence the demand for products is not as standardised. A much broader range of products may also be available in these shops, as products produced in small quantities are not excluded in advance. Furthermore, specialised shops and farm shops may focus on marketing products not found in other shops, and sell them on the basis of personal communication on their qualities and origin.
plies that more aspects of trade has to be adapted than when dealing within the smaller, usually separate, organic sales channels. The general stores, especially when organised in supermarket chains, demand large quantities of a few specified products of a specified, homogeneous quality at a specified time and with a high rate of turnover. Furthermore, the price profile is clearer with consumer price premiums lower than in the other sales channels. In general, as a rule of thumb, 20 to 30 percent consumer price premium is said to be used as a maximum when general stores are considering the introduction of new products (see Infood 1998 for Denmark, but this is reported from several other countries as well). Hence, price and trading conditions are expected to be the focus of negotiations between producers of organic food and general stores. In the other three channels, focus is not so much on quantity and rate of turnover, and hence the demand for products is not as standardised. A much broader range of products may also be available in these shops, as products produced in small quantities are not excluded in advance. Furthermore, specialised shops and farm shops may focus on marketing products not found in other shops, and sell them on the basis of personal communication on their qualities and origin.
29
30
The rest of this chapter includes an overview of the use of these sales channels in national markets.
3.2 Domestic sales channels
Details about relative importance of the three main types of sales channels for the most important products (as selected in chapter 2) are summarised in table 3-1. Direct sales from farmer to consumer and sales through specialised shops are considered important if 30 percent or more of the total domestic sales are distributed through these channels. The calculation for specialised shops include sales through both purely organic and other specialised shops. The importance limit for general stores is 50 percent.
The overall picture found in the table is that general stores are the most important sales channel in most countries for vegetables and potatoes, while specialised shops are important for channelling cereals in many countries, and both channels in combination are important in many countries as regards milk products and fruits. Direct sales are important in a number of countries as regards sales of vegetables and fruits. It is fair to say, however, that direct sales seem to be a residual sales channel, to be used when other channels appear absent for one reason or another. In the table direct sales are not a dominant sales channel in any country. Only in Greece its importance reaches the same level as one of the other channels.
The most striking feature of table 3-1 is possibly the large differences between countries in use of sale channels. This is especially the case with general stores as sales channel. For example, in three Scandinavian countries (Denmark, Finland, and Sweden), and in Austria and Portugal, general stores are the main place of sale of all organic products for which details were provided. Some, but not all, of these countries are among those with the largest organic sector (see table 2-8 above).
Specialised shops are a marketing channel of special importance in Germany and the Netherlands, where it is the main form of sales for four to five main products. It is noteworthy that the annual growth rates for sales of organic products have been much lower in these countries than in others (compare tables 2-3 to 2-7). For some countries, such as Spain, Luxembourg and Switzerland, general stores are important for half or more of the products, but other outlets are also commonly used. In other countries, such as Belgium, Greece, and Italy, a combination of direct sales and specialised shops is found.
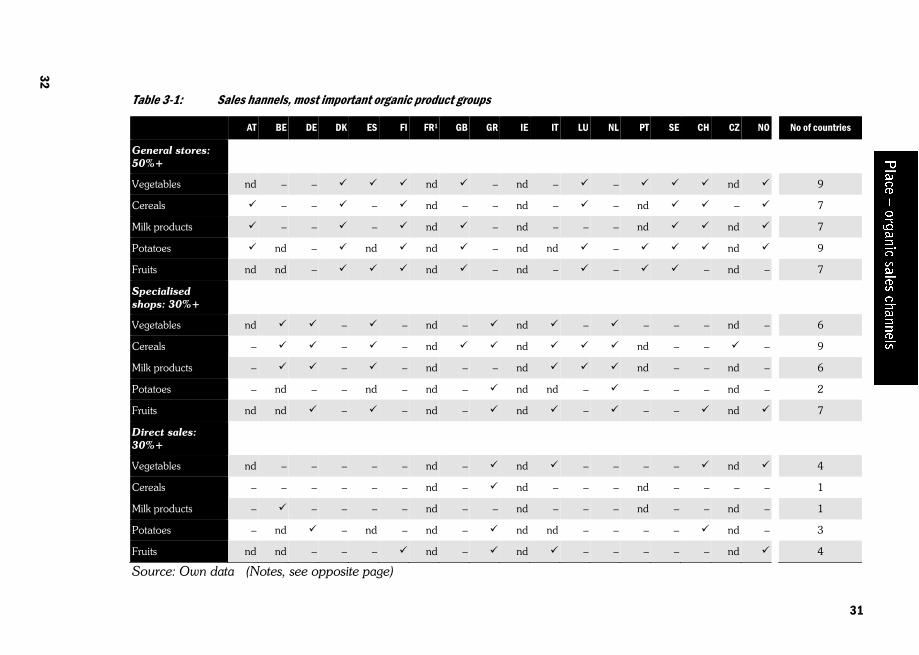
Table 3-1: Sales hannels, most important organic product groups
AT BE DE DK ES FI FR1 GB GR IE IT LU NL PT SE CH CZ NO No of countries
General stores: 50%+
Vegetables nd – – nd – nd – – nd 9
Cereals – – – nd – – nd – – nd – 7
Milk products – – – nd – nd – – – nd nd 7
Potatoes nd – nd nd – nd nd – nd 9
Fruits nd nd – nd – nd – – – nd – 7
Specialised shops: 30%+
Vegetables nd – – nd – nd – – – – nd – 6
Cereals – – – nd nd nd – – – 9
Milk products – – – nd – – nd nd – – nd – 6
Potatoes – nd – – nd – nd – nd nd – – – – nd – 2
Fruits nd nd – – nd – nd – – – nd 7
Direct sales: 30%+
Vegetables nd – – – – – nd – nd – – – – nd 4
Cereals – – – – – – nd – nd – – – nd – – – – 1
Milk products – – – – – nd – – nd – – – nd – – nd – 1
Potatoes – nd – nd – nd – nd nd – – – – nd – 3
Fruits nd nd – – – nd – nd – – – – – nd 4
Source: Own data (Notes, see opposite page)
31
32
In the category ‘specialised shops,’ most of the entries are under ‘specialised organic food shops’ (see annex, tables c 38 to c 49). However, in some countries, such as Greece and Germany, a large part of the produce marketed through that channel is via ‘other specialised shops’. In Greece, cereals, oil-seed, potatoes, vegetables, fruits and wine are sold through other specialised shops. In Germany it is mainly beef, sheep, pork and poultry – all products handled by a butcher shop. The Czech Republic also sells cereals and oil-seed through specialised shops.
To try to understand the main feature of table 3-1 – the varied use of general stores as a sales channel for organically grown products in different countries – it seems necessary to take some general knowledge of the history of organic organisational development into account. First a large and stable delivery situation is needed in order physically to be able to satisfy the demands of supermarkets. This situation is found in three Scandinavian countries and Austria, on the basis of domestic supplies. In the United Kingdom, however, supermarkets are to a major extent supplied by imported products (see section 3.1 below). Still other countries have access to large domestic supplies without supermarkets being an important sales channel. In the case of Germany, Italy and France, national organic movements are divided and competing among themselves, which up to now has made them unable to contribute to organising supplies in the way demanded by supermarkets.
Another important aspect in understanding why supermarkets are an important sales channel in some countries and not in others is the interest in organic produce found in individual conventional supermarket chains. In the initial stages of developing supermarket sales, it is important that supermarket managers expect organic products to play an important role in the general marketing profile. The most prominent example of this can be found in Denmark, where the largest national supermarket chain is a consumer co-op that covers over 30 percent of the total food market. It has consistently sought an increased supply of organic food since 1981 as part of its endeavour to acquire i) a profile in accordance with ‘soft’ demands from consumer-members, and ii) a ‘green’ profile in public opinion at a time when agri-environmental problems became of very high public interest (Michelsen 1996). In the United Kingdom, the initiative also lay in the hands of supermarket chains that seemed motivated less by public opinion on agri-environmental problems than by interest in presenting products with a green profile. In Austria and Scandinavian countries other than Denmark, organic farming organisations had to strive harder to
Notes for table 3-1 Note: Sales channels only include the domestic market: i.e. imports are included, exports excluded. 1FR: all organic products together: direct sales: 16 percent; specialised shops: 46 percent, general stores: 38
percent. = yes, sales above 30 percent/50 percent in the sales channels
– = no, sales below 30 percent/50 percent in the sales channels nd = no data available
32
obtain the attention of main food chains. In all these instances, experience showed that when a breakthrough for organic products was obtained in one supermarket chain, the effect was amplified by imitation from other food chains as part of the competition among supermarkets. Only in a few instances have government policies directly supported the development of the market in conventional sales channels. Denmark is the only example where direct payments for this objective were identified (Lampkin et al. 1999).
In spite of the lack of public support for marketing of organic food, state support for organic farming through agricultural policies has had an indirect impact on market development as it contributed to stabilising production and expansion and to giving an official acceptance of the production system. A large and stable domestic production with public recognition is more likely to convince a supermarket chain that organic agriculture is here to stay. Investment decisions in favour of developing the marketing of organic products are more likely to occur in such an environment than with low production and no prospects of expansion. Among the Scandinavian countries, Denmark was the first one with state-backed organic standards and certification infrastructure. It was developed with the aim of helping agriculture to respond to consumer demand. In Sweden, the government encouraged the development of organic agriculture through supporting the development of the certification scheme and, at a later stage, producers’ conversion process as part of a policy to restrict pesticide use. In Austria, support for organic farming was seen as an important tool, preparing national agriculture for the circumstances of EU membership. The case of Germany shows that public support of organic production is not sufficient if the organic sector appears incapable of setting up a marketing scheme directed at supermarkets. The British case – on the other hand – shows that official support for organic agriculture is not indispensable to obtain supermarket sales.
In summary, the importance of different sales channels in the marketing of organic produce varies between countries, and can be expected to be influenced by a combination of factors. The ability to obtain a continued availability of products of the right quality at the right time, and to cope with an associated risk of failure in marketing these products seems one important factor. This is influenced by the degree of cohesion in the national organic movements, the interest by managers in using organic products as part of profiling their shops, and the extent to which organic farming is given public recognition.
3.3 International trade in organic food products
In general, international food trade occurs because there is a surplus production in one country, which can be related to a demand in another country, and because products can be grown within one country at lower costs than in another country. Differences in production costs may have many causes relating to the whole structure of national agriculture, which
33
34
varies among the European countries. The importance of cost differences is highlighted in the survey by reports from Belgium and the United Kingdom, that organic producers in these countries found it difficult to compete with the lower prices paid for imported organic produce. Among other reasons for trade is climate as some products can only be grown under special climate conditions and consumers’ demand for consistent supply over the whole year despite seasonal variation of production.
International trade in organic products depends on labelling to inform the consumers as to which standards the product is grown. The topic of labelling is expanded upon in chapter 4. Here it suffices to say that in association with international trade the establishment of the EU regulation EC Reg. 2092/91, which required all EU members to comply with EU standards on plant production, in principle facilitated trade in organic products within the EU. Imports into the EU were allowed if they were guaranteed to comply with the same standards. Up until that time international trade in organic products depended for a large part on national and private certification systems which usually have the private International Federation for Organic Agricultural Movements (IFOAM) as their common source of certification.
The importance of international trade (imports and exports) in the domestic market of the 18 countries surveyed here is summarised in tables 3-2 and 3-3. The basis for these tables are found in the annex, tables c 13 to c 36.
For both trade directions, many countries could not supply data. In some cases, the quantity imported or exported was known, but as the total size of the market was not known, it was difficult to establish the relative importance of the trade. The lack of information could be caused by respondents not being informed or no major trade occurring in that particular product. Although one third of the participating countries could not provide many import or export data (such as Belgium, France, Greece, Ireland, Portugal, and the Czech Republic), it is unlikely that no trade exists for all products. In Belgium, for example, sources of imports for most products (see annex, tables c 13 to c 24) are indicated even though no quantities of imports and exports were mentioned. On the other hand, it seems likely that any mention of trade means, that it did take place. For example, although Switzerland does not report imports from Germany, the last-mentioned country mentions exports to Switzerland. Neglect to mention particular trade by some respondents (in this case in Switzerland) probably means that they were not aware of this trade occurring, not that it did not take place. Despite gaps in the data, some general trends can be gleaned from the survey results.
The most popular traded products internationally are the ones mentioned as most important in chapter 2: cereals, vegetables and fruits, milk products and potatoes. Among the minor products wine is mentioned frequently whereas mainly animal-related products were traded only by few countries.
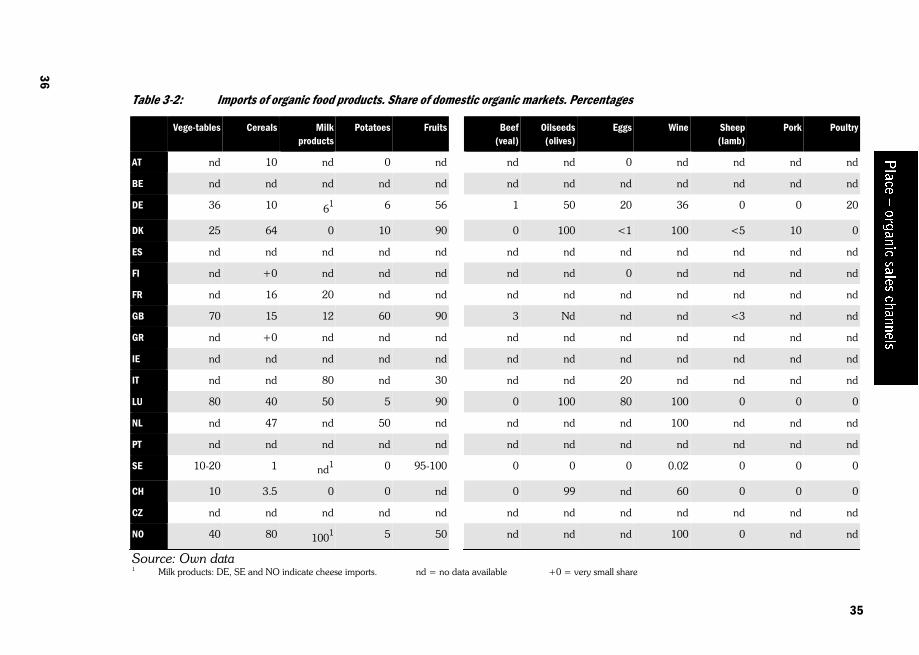
Table 3-2: Imports of organic food products. Share of domestic organic markets. Percentages
Vege-tables Cereals Milk products
Potatoes Fruits Beef (veal)
Oilseeds (olives)
Eggs Wine Sheep (lamb)
Pork Poultry
AT nd 10 nd 0 nd nd nd 0 nd nd nd nd
BE nd nd nd nd nd nd nd nd nd nd nd nd
DE 36 10 61 6 56 1 50 20 36 0 0 20
DK 25 64 0 10 90 0 100 <1 100 <5 10 0
ES nd nd nd nd nd nd nd nd nd nd nd nd
FI nd +0 nd nd nd nd nd 0 nd nd nd nd
FR nd 16 20 nd nd nd nd nd nd nd nd nd
GB 70 15 12 60 90 3 Nd nd nd <3 nd nd
GR nd +0 nd nd nd nd nd nd nd nd nd nd
IE nd nd nd nd nd nd nd nd nd nd nd nd
IT nd nd 80 nd 30 nd nd 20 nd nd nd nd
LU 80 40 50 5 90 0 100 80 100 0 0 0
NL nd 47 nd 50 nd nd nd nd 100 nd nd nd
PT nd nd nd nd nd nd nd nd nd nd nd nd
SE 10-20 1 nd1 0 95-100 0 0 0 0.02 0 0 0
CH 10 3.5 0 0 nd 0 99 nd 60 0 0 0
CZ nd nd nd nd nd nd nd nd nd nd nd nd
NO 40 80 1001 5 50 nd nd nd 100 0 nd nd
Source: Own data 1 Milk products: DE, SE and NO indicate cheese imports. nd = no data available +0 = very small share
35
36
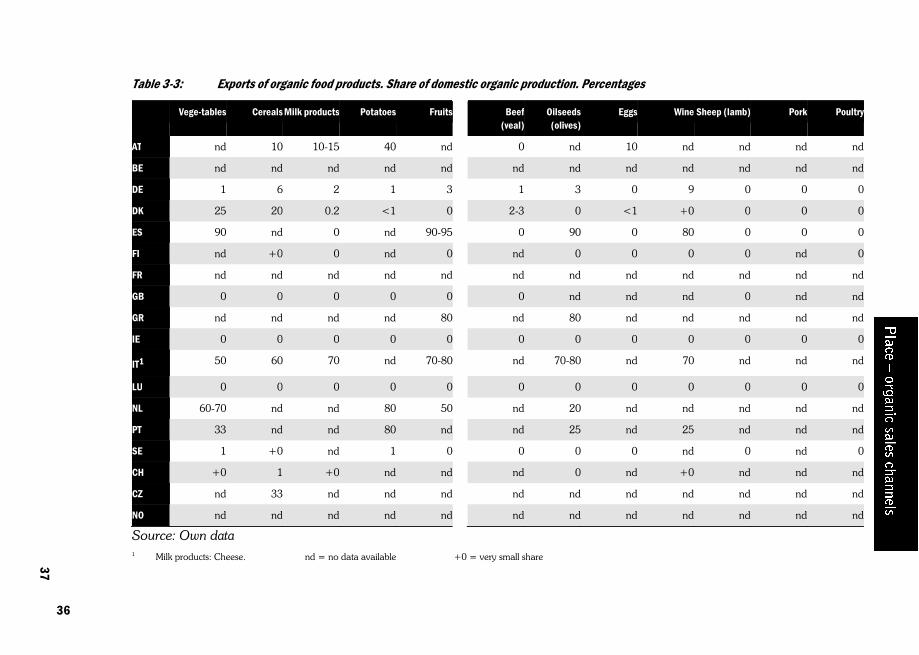
36
Table 3-3: Exports of organic food products. Share of domestic organic production. Percentages
Vege-tables Cereals Milk products Potatoes Fruits Beef (veal)
Oilseeds (olives)
Eggs Wine Sheep (lamb) Pork Poultry
AT nd 10 10-15 40 nd 0 nd 10 nd nd nd nd
BE nd nd nd nd nd nd nd nd nd nd nd nd
DE 1 6 2 1 3 1 3 0 9 0 0 0
DK 25 20 0.2 <1 0 2-3 0 <1 +0 0 0 0
ES 90 nd 0 nd 90-95 0 90 0 80 0 0 0
FI nd +0 0 nd 0 nd 0 0 0 0 nd 0
FR nd nd nd nd nd nd nd nd nd nd nd nd
GB 0 0 0 0 0 0 nd nd nd 0 nd nd
GR nd nd nd nd 80 nd 80 nd nd nd nd nd
IE 0 0 0 0 0 0 0 0 0 0 0 0
IT1 50 60 70 nd 70-80 nd 70-80 nd 70 nd nd nd
LU 0 0 0 0 0 0 0 0 0 0 0 0
NL 60-70 nd nd 80 50 nd 20 nd nd nd nd nd
PT 33 nd nd 80 nd nd 25 nd 25 nd nd nd
SE 1 +0 nd 1 0 0 0 0 nd 0 nd 0
CH +0 1 +0 nd nd nd 0 nd +0 nd nd nd
CZ nd 33 nd nd nd nd nd nd nd nd nd nd
NO nd nd nd nd nd nd nd nd nd nd nd nd
Source: Own data 1 Milk products: Cheese. nd = no data available +0 = very small share 37

The relative level of international trade for the main products was substantial in some countries. For cereals, three countries imported 40 percent or more of their domestic requirements. Imports as a percentage of the domestic market were even higher for fruits, a high value product, but lower for vegetables and potatoes. Figures for imports of milk products varies very much between countries and in some countries the share of imports is only calculated for one type of milk product (cheese in Germany, Sweden and Norway).
The groups of products which seems to attract least international trade are those of meat, especially sheep meat. The missing EU standards on livestock production seem to be one important explanation for the low trade on meat even though all countries – except Greece – have some kind of standards whether public or private, most of which comply with IFOAM standards. Among other possible explanations are that the demand for meat in general may be lower amongst consumers of organic food (cf. Brombacher and Hamm 1990 on the German case; Zanoli 1996 on Italy). Supply may also be lower because of lower quality (see chapter 2) or lower productivity when compared to non-organic farming.
For some products there seems to be a tendency for countries to trade with surrounding countries, such as with grain trade between Germany and neighbouring countries and – on a much smaller scale – cereals sold from the Czech Republic to other Eastern European countries. This is presumably because of the transport costs, important especially in low value products. For other products trade from one general region to another is apparent. For example, oilseeds and wine, and also fruits and vegetables are mainly exported from southern European countries (such as Spain, Greece, Italy and Portugal) and imported into the northern European countries. These exporting countries all have small domestic markets, as discussed in chapter 2.
Many northern European countries import more organic products than they export. Examples are Germany, Denmark, the United Kingdom, Luxembourg, Sweden, Switzerland, and Norway. The exception is the Netherlands, which both imports and exports products. This could be due to the fact that domestic demand, relative to supply, is low for some products (or varieties of some products) and high for others. In the case of potatoes, where both imports and exports are equal or higher than half of the domestic market, the difference in crop variety (including different dates of crop maturity) may be a cause of both directions of trade. Alternatively, products may be imported in order to re-export as Dutch firms are well known in international food trade.
Trade with non-European countries is mainly imports, in the form of vegetables, fruits, potatoes and oilseeds. They come mainly from areas with a different growing season than Europe, for example, Israel, Turkey, Egypt, Morocco, USA and countries in the southern hemisphere. Very few organic food products are imported from Eastern Europe. Exports from EU countries to non-European countries occur mainly from southern European countries to the USA and Japan. Products include oilseeds, cereals and wine. Switzerland sells vegetables to the USA.
37
3.4 Summary
In the past, organic products have been sold mainly through direct sales from producers to consumers or through specialised shops (those which sell a variety of only organic products or which sell one kind of product, such as bread or meat, both conventional and organic). This provided a separate market from conventionally grown products, allowing differentiation on the grounds of other characteristics, such as personal knowledge of the producer, more personal treatment by the trader etc. In most countries there is a combination of these outlets in the sale of the five main products, but in some countries, such as Germany and Holland, far most of the trade seem to be done via the specialised shops. Since the 1980s supermarkets have also been involved in the sale of organic products. In some countries (Scandinavia and Austria) these are practically the only sales channels for organic food. These trends suggest that, as the supply of organic products becomes more reliable, conventional supermarkets will play a greater role in the marketing of organic products.
Internationally, all included products were traded even though the level of meat trade was very low. The introduction of livestock standards would possibly increase the meat trade. Some products, such as grains, are traded mainly with neighbouring countries. Other products, such as vegetables and fruits, seem to move mainly from south to north, presumably for climate reasons. A large potential for international trade in organic products thus seem at hand provided standards are harmonised, production expanded and distribution is promoted (or at least not hampered) by national organic movements and by agriculture and trade policies.
38
4 Product – Characteristics of organic food The aim of this chapter is to describe some of the general characteristics of organic food as products appearing in the market. From a marketing perspective, one of the most important characteristics is that the use of the term ‘organic’ is restricted to products which comply with certain standards. As shown in chapter 1, certification of organic origin allows labelling of all products which comply with standards and hence defines organic products as generic products. In this chapter the actual use of labels is discussed in some detail followed by a description of the diffusion of different types of labels in the 18 countries studied.
Definition and labelling is, however, only one type of characteristic of organic products. In theory, organic farming includes all types of agriculture products. In practice, however, this broad scope is narrowed both in terms of a limited number of main product groups available, and in terms of the extent to which product groups are diversified into distinct food products, for instance by processing. In chapter 2, it was shown that even though organic food is represented in all major product groups on European level, only five product groups are of major importance in the food market. It was, furthermore, found in chapter 3 that organic food is sold through different channels which represent quite different types of demands to the products supplied in terms of quantities, qualities and prices.
At the one extreme, when farmers sell directly to consumers, products do not need much handling or other adaptation to specific demands other than those of the individual consumer. The trade is based on the basic assumption that the consumer accepts the products as they appear at that particular farm. At the other extreme, supermarket chains have standardised demands about large quantities of products of a quality adapted both to handling in supermarkets and attraction of mass consumers and supplied regularly at distinct places not necessarily close to the farm. The different channels thus pose different challenges to the organic products and it is worth investigating the extent to which organic food is able to live up to such demands. Two aspects were highlighted in the international survey and will be discussed below. One is a general assessment of the quality of organic food products as compared to non-organic ones. The other is a specification of the degree of processing for organic food products.
39

4.1 Certification and labelling
From an analytical point of view, labelling of organic products involves at least two aspects. One aspect is about compliance with certain general standards for organic production – the certification label aspect – another aspect is about appropriation of profits by using distinct commercial labels. In practice it is often difficult to separate the two aspects because certification labels may be used by firms as a basis for appropriating extra profits. This is especially the case when several certification labels compete in the same markets. Each of the certification labels may maintain the superiority of their standards as compared to the others.
Certification of organic food originates from the problems of distinguishing organic from non-organic food. Certification rest on certain standards of organic farming, and producers are certified if they comply with these standards. Certification is thus a necessary precondition for any producer who wishes to sell organic products. The producer is allowed to document the certification by providing products with the certification label – a logo or other symbol used by the certifying organisation. In this way the certification label is a guarantee of the organic origin to consumers and other buyers, and it is a necessary condition for obtaining any (commercial or other) advantage associated with organic products.
The commercial aspects of labelling relate to the issue of sharing the costs and advantages of promoting any given label. The success of any label depends on the degree to which it is known by consumers and other buyers, and this presupposes some kind of promotion. An important part of promoting a certification label is that producers do in fact use the label and use it in promoting the products. But producers or retailers may wish to stress the properties of their products rather than the general (generic) qualities – or they may simply wish to promote their firm more than the organic quality of products. In these instances commercial labels are established. In the more extreme case commercial labels may take the form of a genuine brand, where the manufacturer promotes the label rather than the product (as in the case of Coca Cola) (see section 1.1 above).
4.1.1 Certification labels
Certification in the 18 countries included in this study is marked by the EC Reg. 2092/91, which passed in 1991 and has been in operation since January 1993. It introduced common organic certification standards for plant production, and a framework for countries to comply with these standards within the European Community (Lampkin et al. 1999). Norway, too, developed a system which adheres to EU standards and compliance. This common regulatory framework aims at promoting consumer confidence and discourages the undermining of the market through fraudulent trading. It allows a firm to indicate that its products comply with certain international standards. Even though the standards are international, a common logo did not exist until spring 1999 and certification, inspection
40

and labelling consistently is performed on a national basis. National public authorities stand as the guarantors for compliance with the common regulation, but in many countries inspection of producers is done by private agencies – often with a background in private certification systems.
Prior to the EU regulation, six countries had national legal definitions that served a similar purpose and worked similarly. Most countries had, however, even prior to any public regulation, long established non-legal or private-sector definitions widely recognised and used by producers who gained the right to use a logo identifying the organisation and the standards. Some of these non-legal definitions were set by umbrella organisations that represented producer, consumer or other groups interested in a common definition of organic food. Where the regulations were not run by umbrella organisations, competing private certification organisations have existed but often one private body became the most prominent (like Soil Association in UK and KRAV in Sweden).
Before the EU regulatory regime, private certifying bodies thus dominated the market. By combining the functions of setting standards and devising a compliance scheme (for which licensing fees were charged), and subsequently certifying producers (for which inspection fees were charged), they run a risk of being seen as having a vested interest in accepting producers into the scheme. On the other hand, if the private certifying bodies are run by producer interests only, other potential problems are added to the suspicion of vested interest in certification for income reasons. First, standards may be set at a level such that only few members are able to qualify. Second, certified organic producers may have an interest in keeping other (not certified) producers out of the scheme, which is especially relevant when demand for their product is small.
In addition to these problems, private organisations had to rely on other instruments than legislation to obtain legitimacy and acceptance among producers and consumers – and in the market as a whole. One way of securing legitimate certification was to include other than producer interests in the organisations that run the certification system. Consumers, scientists and others without obvious business interests in the sector may be more devoted to defining organic farming systematically, rather than using a certification system mainly as a tool to sell. On the other hand, producer interests seem indispensable when defining the standards, because they may otherwise develop in directions which are impossible for farmers or other producers to adhere to. Other issues of conflict of interests can be solved by separating the inspection service per se from the regulatory part of the organisation.
The EU regulation performed the task of defining the concept of ‘organic’ by setting standards, and determining how to comply. With backing in the member countries, protecting the word ‘organic’ legally, it harmonised the certification system EU-wide. The introduction of the EU certification system did not abolish the private-sector definitions and certification schemes. They certify to their own standards, which often go beyond the EU regulation and their labels with associated logos continue in the national markets. The main effect of the EU certification system is thus to moderate competition
41

between private certification systems, at least on the basis of the level of standards. This may in turn lead to stronger interest in increasing the commercial competition by increased use of commercial labels for organic products, as producers look for other means of differentiating their products. The extent to which these potentials are fulfilled is an empirical question. It involves, among other things, the role of the non-legal and private certification systems in the national markets and the extent to which private firms have begun to develop their own commercial labels for organic food products.
4.1.2 Commercial labels
Commercial labels owned by private firms may have different forms and origins. Genuine brands are usually developed by processing firms to establish a consumer preference for the branded products while avoiding some of the influence from wholesalers and retailers in establishing the relation to consumers. Wholesalers and retailers, however, on their side may also attempt to reduce producer influence on their free choice of suppliers and have developed labels of their own, which are only used by one retailer/wholesaler (usually a major chain like Billa in Austria who developed the label “Ja, natürlich”) while products may originate from several producers.
In designing the commercial labels, the firms integrate one or more distinct organic certification label into the commercial label. Alternatively, the commercial label may replace any reference to specific organic certification labels if it is found convenient to be able to refer to more than one of these. In Denmark for instance, the main supermarket chain in organic products, FDB, decided recently to introduce a commercial label, ‘Natura’, where no reference is made to the, otherwise very famous, Danish state authorised certification logo. The background is that the Danish logo is only to be used if Danish firms are involved in production, while FDB wanted to obtain supplies directly from other countries without needing the involvement of Danish firms. On all ‘Natura’ packaging, the word ecological is used in accordance with EC Reg. 2092/91 signifying that certification has been obtained from one of the certification bodies authorised by the European Commission. By introducing the commercial ‘Natura’ label, FDB was able to promote organic products without promoting all products wearing the Danish certification label and to promote their own expertise in selecting organic products.
Commercial labels can be supported by different kinds of promotion in order to obtain a stronger consumer preference for the products of one firm than for other organic products. In this context, an important distinction is between commercial labels promoted by purely organic firms and commercial labels promoted by other firms with the former assumed to be more interested in promoting the organic qualities than the latter.
42

43
4.1.3 Importance of certification and commercial labels
Based on the distinction between certification and commercial labels, the analysis of the relative importance of different types of labels is done on the basis of the following six types of labels for organic food: three emphasising the certification aspect and two emphasising the commercial aspect, with one – the label of organic farmers associations – potentially including both aspects:
1. EU standards where a common logo was not available at the time of the survey. Its primary function being to harmonise definitions of organic agriculture in EU member states, and ease international trade. Compliance with EU standards may however be emphasised as part of promoting one of the other labels.
2. National public certification labels, developed in most countries with national logos.
3. Certification by organic agriculture movements or other private certifying bodies. Membership of movements should include more than only primary producers.
4. Organic farmers’ associations is based entirely on farmers’ membership. They may either include a certifying body, if no other certifying organisation exists, or a trading organisation needing a commercial label. In many cases such organisations have developed with the aim to secure proper promotion of farmers’ products in general or to organise products vis-à-vis main buying firms specifically.
5. Commercial labels of organic food firms whether retailers, wholesalers or processing firms, emphasising the pure organic character of the firm.
6. Commercial labels of food firms other than those dealing exclusively with organic products, emphasising the organic character of the labelled products.
Any organic product sold as organic must have at least one certification label, but all products may have more than one label signifying that the product complies with more than one certification system and/or is subject to promotion by some kind of commercial label.
The responses in the international survey to questions on the relative importance of different labels in the 18 countries are shown in table 4-1.
Notes for table 4-1 Note: For each country, percentages may add up to more than a 100 percent as each product may comply
with several standards and/or use several labels. 1 Including other private certifying bodies. 2 Very important; 3 EKO, DEMETER. nd = no data available

Table 4-1: Promoting organic food. Market shares of certification labels and commercial labels. Percentages
EU standards National public certification
Organic agriculture movements1
Organic farmers’ associations
Commercial label of organic food firms
Commercial label of other food firms
AT 0 5-15 5 20-25 0 60-70
BE 20 0 80 0 0 0
DE 2 0 60 10 25 30
DK 2 93-95 <5 <5 <2 30-40
ES 90 90 25 0 90 nd
FI 0 0 0 60+5 0 0
FR 0 95 0-5 0-5 nd2 nd2
GB 0 25 50 0 0 25
GR 0 0 90 0 0 0
IE nd nd nd nd nd nd
IT 100 0 20 50 50 5
LU 0 0 0 90 10 0
NL 100 100 nd3 0 15-20 0
PT nd nd nd nd nd nd
SE 0 0 100 0 0 0
CH 10 0 73 4 5 52
CZ 0 80 0 40 0 0
NO 0 100 100 0 nd nd
Source: Own data (Notes, see opposite page)
44
45

The information in the table should be read with some care. It seems quite obvious, that all respondents have not answered the question in the same way. Even though it was emphasised that answers should not add up to exactly 100 percent, this is the case in 5 countries. In two other cases (Finland and Greece), the information does not even reach 100 percent. In the Greek case, the reason is that about 10 percent of production is sold without labels (either as conventional products or direct to consumers).
Although certification according to EU standards is obligatory for all but the last three countries on the list (Switzerland, the Czech Republic and Norway), no label was employed at the time in any country to indicate compliance solely with those standards. No country relied on only those regulations to identify organic products in its domestic market, but some countries, Spain, Italy and Holland, indicate the importance of the regulation for (almost) all of their organic products, with labels from other organisations also being of great importance. Some other EU members (such as Belgium) also mention EU regulations as important for identification of organic produce, but the percentage of products included in that category is part of the total which is certified. For example, 20 percent of organic products in Belgium rely on EU regulations directly, while 80 percent rely on labels issued by organic agricultural or other private certifying bodies for identification. It seems, therefore, that Spain, Italy and Holland consider that the EU regulation benefited all producers in general, even though no label is used. It is noteworthy that these three countries are exporting countries, which makes it likely that the attention is attached to the functions of EU standards in international trade. For other countries it seems that their response reflect the status of products imported from EU member states.
A national public certification body is especially important (80 percent of the market or more) in over one quarter of the responding countries: Denmark, Spain, France, Holland and Switzerland. No other category is mentioned in so many countries and covering such a large part of the organic market. A second category of importance in many countries is the organic agricultural movement including other private certifying bodies. Four countries indicate this kind of institution to be of significance for 70 percent or more of the market. Not far behind are organic farmers’ associations, although only in one country, Luxembourg, does it reach a very high rating.
For half of the countries, commercial labels were at least of some importance in attempts to secure a market share in the organic market. Commercial labels of organic food firms are most prominent in Spain and Italy. In Austria and Switzerland commercial labels of food firms dealing with both organic and other products are rather important, and - to a less extent - in Denmark and Germany as well. In France both types of commercial labels are considered “very important”.
In summary, for over one quarter of the countries for which an answer is registered in this table the label of a national public certification body is of great importance. Labels of the organic agricultural movements, including private certifying bodies, and organic farmers’ associations, are important for a sizeable proportion of organic producers in a majority of countries.
45
Commercial labels, either from organic or conventional businesses, are used by one third or more of products in three countries each and hence may be gaining importance.
4.2 Quality assessment of organic food
The very notion of organic food is based on the intention of producing food of a quality distinguished from non-organic or ‘conventional’ food. However, the organic concept of food quality is different from most other food products. Production of organic food is not primarily based on reaching high scores on those quality parameters which dominate the general food market such as appearance, taste, packaging etc. Instead the intention with organic food is to introduce new quality parameters in the market. These new parameters are, however, less visible to buyers when they are facing the individual food products, as they are meant as parameters to influence agriculture’s effect on the environment, rather than the performance of products in the market.
Non-use of chemical fertiliser or pesticides, distinct crop rotation as well as recycling of nutrients etc. are core aspects of organic plant production, while in livestock production focus is on limited use of antibiotics and chemical additives to feed together with attention to animal welfare (Lampkin 1994). Stolze et al. (1999) summarised existing European analyses of food quality comparisons regarding the aspects emphasised in organic farming. In none of the analysed aspects organic products came out worse than non-organic ones, but in many aspects the results were quite similar. The risk of contamination of food with pesticides and nitrate was assumed lower in organic than in non-organic food. No significant differences could be demonstrated with respect to content of myco-toxin, heavy metals and PCB as well as radioactive contamination. Equally with respect to contents of desirable food substances such as vitamins, nutrients and aromatic compounds organic products scored equally with non-organic ones. Lack of comparative investigations of animal products was offset by existing research results on the risk associated with non-organic farming, such as the contents and effects of hormone and antibiotic residuals to humans.
From a market perspective the fundamental disadvantages of organic farming are the outer appearance of vegetables and fruits caused by the non use of pesticides, and lower content of protein in cereals. Processing may also cause some disadvantages to organic products, as usually fewer additives are used with negative consequences for the look and durability of products. Quality differences between organic and other food products are, however, a field in which only little scientific evidence is available.
As long as organic food is traded separately from non-organic food, failure to comply with general food qualities may not influence the trade. However, as soon as attempts are made to sell organic food in sales channels that also include non-organic food, deviations from traditional quality parameters become a problem. Hence, the usually different appearance of organic vegetables and fruits – and to some extent even meat – may be seen as a
46

barrier for marketing. The reason is that the traditional quality parameters form the basis for most trade in the general food market. Traditional quality parameters include many more or less objective measurements or evaluations of quality specified for each product group, and function as part of trading customs in the food market. Hence, when organic food approaches the mass food market, it is necessary to be able to cope with the quality standards developed for non-organic products. In table 4-2 an overview of the general situation is given for each product group.
The table includes three main types of quality assessments. The first is on organoleptic characteristics which cover the way the food affects the organs of sense, i.e. the taste and smell of products. The second quality assessment is the physical appearance of the individual product (size, freshness, colour etc.) and the third one is about packaging. These three quality aspects are important in the general food market while other qualities, such as nutritional value, which might be important for some producers and consumers, are not as important. The importance of packaging is even emphasised by the fact that organic products in some countries (Denmark and the United Kingdom) need to be packed as a necessary prerequisite for securing separation of certified organic products from uncertified and non-organic products.
For each of the three quality aspects it is shown whether the quality of organic products is considered better (+), the same (0) or worse (-) relative to non-organic products. For instance for vegetables it appears that organoleptical qualities are judged superior in 11 countries and not judged worse in any country, while it is nearly the opposite for physical appearance, where vegetables are only judged superior in 1 case but worse in 7.5 cases. Concerning packing, there is hardly any difference between organic and non-organic vegetables.
For the five most important products, table 4-2 shows that in the organoleptical assessment all groups except cereals are judged superior to their non-organic competitors in the majority of cases. But for the same products there are found most problems in physical appearance, while packaging in general is judged equal to non-organic products. Positive judgements of organoleptics are found for all product groups, and may – at least for those products which are used fresh (vegetables, fruits, potatoes, eggs and meat) – be seen as effects of the organic farming methods itself rather than of deliberate efforts by producers. Some of the negative judgements regarding physical appearance also relate to the organic farming methods. Vegetables and fruits are judged most negatively and they are the products for which the physical appearance is most vulnerable to events during the growth season, which in other production systems are remedied by use of artificial fertiliser and/or pesticides. On the other hand, it is also important to note the variation in judgements. It may be seen as an indication that, in some instances, it has been possible to outweigh part of the disadvantages, either by improving methods of farming or by handling products. Finally, about packing – a very important aspect in attempts to catch consumer attention in mass marketing – there is no difference neither between organic and non-organic products nor between more or less
47

important products. Across the product range, the table indicates that organic products do not perform systematically worse than non-organic ones and that organic food is thus able to compete on ordinary food markets.
The large number of problems mentioned on physical appearance among the main products may to some extent be caused by their importance in national markets. This implies higher visibility in the market than for the less important products and hence a stronger market reaction on deviations from ordinary standards. The relatively negative evaluation of physical appearance might also result from stronger prominence of the five main products in general stores and supermarket chains than other products – and hence stronger quality demands. Neither of these attempts to explain the result, however, is confirmed by a closer study of the countries which emphasise problems of physical appearance. For vegetables, the countries with the largest market share (Denmark and Switzerland – see table 2-8 above) are not found among those with problems of physical appearance. Problems are found in Germany and Finland – both countries with relatively large organic production in general – and in Belgium, Greece, the Netherlands, Czech Republic and Norway – countries with small markets and organic production. This points to a clear potential for developing the markets for these products by introducing methods to avoid problems with physical appearance of vegetables. From Germany, however, it is also emphasised that the main problem is a very low rate of turnover for organic products in many supermarkets and specialised shops. Hence, judgements of physical appearance could be improved by initiatives to increase turnover without changing anything in the organic farming system.
The superiority of vegetables and fruits in organoleptic quality is found in nearly all countries, whereas for cereals organoleptic superiority is found mainly in the Mediterranean countries Italy, Spain, and Greece – all with unknown but presumably small market shares – and Denmark and Luxembourg with large market shares (see table 2-8 above). For milk products, the organoleptic quality is evaluated positive in those countries with the largest market shares (Austria, Denmark and Luxembourg) but also in countries with low market shares. The same pattern is found for potatoes, with Austria and Switzerland evaluating organoleptics positively and having large market shares, but positive evaluations are also found among other countries. These patterns point to organoleptic quality as an important aspect of market development in countries with large market shares and hence on a potential for using this as a tool for improving market performance in all countries, provided the advantage to non-organic products can be kept in primary production, in secondary production (processing) or both.
Table 4-2: Quality assessment of organic food in Europe. Three aspects of importance in the food market. Number of country assessments
Organoleptic characteristics
Physical appearance Packaging etc.
48
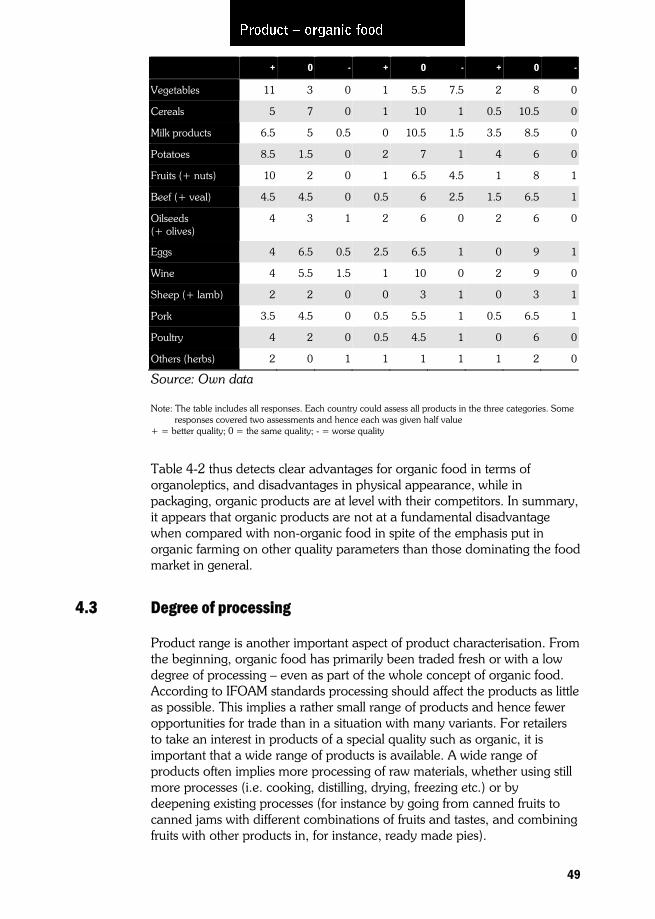
+ 0 - + 0 - + 0 -
Vegetables 11 3 0 1 5.5 7.5 2 8 0
Cereals 5 7 0 1 10 1 0.5 10.5 0
Milk products 6.5 5 0.5 0 10.5 1.5 3.5 8.5 0
Potatoes 8.5 1.5 0 2 7 1 4 6 0
Fruits (+ nuts) 10 2 0 1 6.5 4.5 1 8 1
Beef (+ veal) 4.5 4.5 0 0.5 6 2.5 1.5 6.5 1
Oilseeds (+ olives)
4 3 1 2 6 0 2 6 0
Eggs 4 6.5 0.5 2.5 6.5 1 0 9 1
Wine 4 5.5 1.5 1 10 0 2 9 0
Sheep (+ lamb) 2 2 0 0 3 1 0 3 1
Pork 3.5 4.5 0 0.5 5.5 1 0.5 6.5 1
Poultry 4 2 0 0.5 4.5 1 0 6 0
Others (herbs) 2 0 1 1 1 1 1 2 0
Source: Own data
Note: The table includes all responses. Each country could assess all products in the three categories. Some responses covered two assessments and hence each was given half value
+ = better quality; 0 = the same quality; - = worse quality
Table 4-2 thus detects clear advantages for organic food in terms of organoleptics, and disadvantages in physical appearance, while in packaging, organic products are at level with their competitors. In summary, it appears that organic products are not at a fundamental disadvantage when compared with non-organic food in spite of the emphasis put in organic farming on other quality parameters than those dominating the food market in general.
4.3 Degree of processing
Product range is another important aspect of product characterisation. From the beginning, organic food has primarily been traded fresh or with a low degree of processing – even as part of the whole concept of organic food. According to IFOAM standards processing should affect the products as little as possible. This implies a rather small range of products and hence fewer opportunities for trade than in a situation with many variants. For retailers to take an interest in products of a special quality such as organic, it is important that a wide range of products is available. A wide range of products often implies more processing of raw materials, whether using still more processes (i.e. cooking, distilling, drying, freezing etc.) or by deepening existing processes (for instance by going from canned fruits to canned jams with different combinations of fruits and tastes, and combining fruits with other products in, for instance, ready made pies).
49

Table 4-3 includes the results of the international survey regarding the share of highly processed food among the five main products. There is no clear distinction between products being processed in a high or a low degree. The distinction used in the survey was that products sold as fresh or processed for conservation were considered as having a low degree of processing, whereas highly processed food combines several more products into a third one, for instance when cereals and yeast combine into bread and beer.
It should be taken into serious consideration, when reading table 4-3, that there may be major differences in the judgements of different respondents on which products are considered highly processed and which are not. In spite of these reservations, it is clear from the table that the range of products is expanded by increasing processing for only a few products. Only for cereals and milk products are more than half the products highly processed in more than one country – and for fruits, the main part is sold highly processed in only one country. The tendency is emphasised by the fact that it is only in a few more instances that the share of highly processed food exceeds 15 percent. Under these circumstances it seems most likely that, even in the instances where large shares of products are declared highly processed, the degree of processing should not be expected to be very high. Thus, a large share of the products made by processing cereals and milk might be bread and cheese (cheese is mentioned as an important product in many countries in other parts of the questionnaire). This pattern is not affected when including the minor products because here only few cases with highly processed food are found. Pork is an exception as it is mentioned by 5 of 9 reporting countries with a high degree of processing for 20-40 percent of the market (see annex, table c 37).
Austria and Germany are the only countries in which large shares of processed food are found for more than one main product, in both instances cereals and milk are included. The rest of cases with large shares of highly processed food are dispersed and represent no systematic pattern. Thus no systematic pattern is found which links the degree of processing to the size of either the organic sector or the organic market. This cross country comparison thus indicates that some efforts are made in some countries to develop processed organic food but the efforts still seem very modest.
Table 4-3: Highly processed organic food as percentages of all certified organic food. Most important products
Vegetables Cereals Milk products Potatoes Fruits
AT nd 80-85 80-90 10-15 nd
BE 5 85 20 20 5
DE 30 60 50 20 20
DK 5 5 5 1 0
ES1 low nd low nd low
FI 10 35 10 5 10
50

FR2 nd nd nd nd nd
GB nd nd nd nd nd
GR 0 2 nd 0 15
IE nd nd nd nd nd
IT 20 10 0 0 20
LU 1 10 60 5 10
NL nd 5 1 nd 1
PT nd nd nd nd nd
SE 1-20 1 1-5 1-15 90-100
CH 15 5 1 1 5
CZ nd 40 nd nd nd
NO 5 30 nd 0 nd
Source: Own data
1 For Spain no division in shares of low/high degree of processing is given – only ‘x’ is marked in the dominant category.
2 In France while organic products are in general sold with a low degree of processing a market for processed food is developing in vegetables and fruits.
nd = no data available
4.4 Summary
Defining organic products in the market is facilitated strongly by official certification. Other requirements, for instance compliance with traditional quality standards and the level of processing, are also important in defining the extent to which organic food is able to integrate into the general food market.
Certification rest on defining organic food on the basis of production standards. Organic production standards were originally set up by private organisations who inspected compliance with the rules by themselves. In 1991, EU standards were set up and they were implemented in 1993, in order to discourage fraudulent trading and promote consumer confidence – but only for plant production. In each member state, a public agency has the responsibility for guaranteeing that organic products in their country have indeed been produced according to the standards adopted in the EU regulation. This is ascertained in each country by approving certain organisations to carry out the task of certification of producers and traders. These organisations often include the private organisations, which originally set up private certification. Labels based on logos, which indicate compliance with the EU regulation, are found on a national basis and are usually owned by private bodies. They combine EU requirements with special requirements from private organic movements or organic farmers’ associations. Hence, in spite of the common EU certification system, the use of logos signifying compliance with EU regulations in many countries also presupposes compliance with other standards. This is a potential trade barrier against the idea of the single market within the EU.
51

In a few countries, commercial labels have been introduced in the organic sector to differentiate between different suppliers of organic food. Some of the commercial labels are used by organisations that only trade organic products, while others are owned by firms who also trade non-organic food products. Commercial labels enable firms to market products of their own selection, for instance by including imported products certified by certification bodies in other countries, or by excluding products which do not comply with special quality demands of the firm.
When compared with the quality standards of the main food market, the main disadvantage of organic food is physical appearance. The disadvantage is, however, not only an effect of the production system itself but also an effect of the trading system in which organic products are not traded at the same rate of turnover as other products, and as a result the appearance of the product may suffer. This explains why negative evaluations of physical appearance are not common in countries with large market shares. It further points to a need for directing efforts both at production and distribution in attempts to counter the problems. In other quality aspects, organic food either does not differ substantially from other food, as in packaging, or has substantial advantages as in taste and smell – i.e. organoleptic qualities.
Another important prerequisite for entering and developing a position in the mass market is to present a wide range of products. As far as this is related to a high degree of processing, organic food does not comply with market demands and the efforts made so far seem only modest.
52
5 Promotion of organic food Promotion is about communication with consumers. It may take different forms, ranging from the seller’s personal communication with consumers via advertising in shops to advertising by producers and retailers in widespread media. In relation to organic food, promotion is facilitated by certification labels, as mentioned in chapter 4 above. The certification labels are the main means for consumers to distinguish organically grown products from other ones at the point of purchase. However, consumers need to know about the certification labels and the content of the standards behind them. The value of any certification label hence depends on the success of promoting it. This is one of the major activities of all certification organisations and in this way all organic food is promoted at once. However, the presence of this powerful tool of communication and of the efforts invested in promoting it may have limited the efforts made so far to promote organic foods as individual food commodities in the general food market in most countries.
Two aspects of promotion are highlighted in this chapter. The first one is which sales arguments are used by retailers in the 18 countries surveyed, to illustrate possible similarities across countries in the market perception of organic food. The second aspect is whether any systematic promotion has been used at all in recent years in spite of the small level of supply. These two aspects concern deliberate promotion efforts, which it is possible for actors in the organic food sector to influence directly by their own activities. In recent years, however, indirect promotion of alternative agriculture stemming from reports and debates in the mass media on food scares, agriculture pollution of the environment and similar issues, has been a powerful tool in broadening the public interest in and knowledge of organic food and its characteristics. This kind of indirect promotion is important for obtaining general consumer attendance to organic food, but it cannot be relied on in the process of promoting organic food as part of a deliberate strategy, as its form, scope and content is accidental and hard to direct towards the messages to buy distinct food products. The organic food sector, therefore, cannot expect that press reports consistently may be in favour of the consumption of organic food.
5.1 Retailers’ sales arguments
Arguments for buying organic food may differ among types of consumers and across countries. In some countries, the conversion to organic farming has been promoted as part of a general policy to decrease environmental impacts of agriculture. Consequently promotion of organic food may be based on the perception of products being environmentally friendly. In that case consumers are expected to attempt to improve society by the very individualistic action of buying food – in other words to base consumption on altruism. Another approach to promotion of organic food is to refer to individual preferences of the consumer, for instance concerning individual
53

health and/or food safety as indicated by organic food being sold through health-food shops (see chapter 3).
Different arguments used by retailers in attempts to convince consumers to buy organic food are detailed in table 5-1, together with the priorities given in each country. The issue of price was not included in the question but was mentioned spontaneously by only few national experts. As organic products often command a higher price than conventional products (see chapter 6), the table in reality reflects which arguments are used by retailers to convince consumers to buy organic products despite the higher price. Whereas in chapter 4 it was described how organic products complied with normal food market standards, the aim of this section is to find out which special qualities organic traders find so attractive that they expect consumers to react positively.
The arguments of food safety and health are the most important ones in 12 countries. However, in some countries, such as Germany and Denmark, it is not legal to advertise organic food with the food safety argument. For this reason sales outlets may prefer to advertise other arguments – especially the one of ‘environmental protection’ which received first priority in both cases. Even in these two cases the legal ban on health arguments has not completely excluded this type of arguments, because they are referred to indirectly as reflected in the second rank of food safety/health arguments in both cases. ‘Environmental protection’ is ranked highest in four countries but second in seven countries and thus in total is the second most important argument in the marketing of organic food across countries. The predominance of the food safety/health and environmental protection argument is, in fact, so strong that only Norway does not include food safety/health or environment protection among the two most important sales arguments. Instead the main argument in Norway is the same as the only argument mentioned by Ireland – the specialities in the way of farming.
In Denmark and Germany, the observation is made that even though retailers’ promotion emphasises environmental issues, consumers buy organic for food safety reasons. In Denmark, a developmental trend seems visible since environmental protection was the main consumer motivation in the early 1990s (Michelsen 1996). Originally, organic farming in Denmark developed on the basis of close relations to the development of agri-environmental policy, which was strongly supported by voters and consumers. In recent years, however, food safety came high on the national political agenda and – it seems – on the consumers’ agenda as well.
Overall, ‘nature conservation’ is ranked third. However, among the countries in which it is ranked first – France and Austria – only a weak distinction is drawn to the argument of environment protection. Taste is the most variable factor, with almost one half of countries putting this topic close to the top of the list, and others at the bottom. Only in the Czech Republic is taste mentioned as the most important argument, but this is also the only country in which no price premiums are obtained (see chapters 2 and 6). Animal welfare issues are overall the least used argument, although it does differ not only between countries but, possibly more so, between products within countries. In Sweden, eggs are mentioned as an example of
54

animal welfare being on the top of the list as a sales argument of an organic product, while in poultry it is taste, and in cereals the environment.
Table 5-1: Ranking retailers’ arguments when marketing organic food. Rank
Nature conservation
Environment protection
Food safety/health
Animal welfare Taste Others
AT1 1 2 4 3 5 0
BE 5 2 1 4 3 0
DE 4 1 2 5 3 0
DK 3 1 2 4 5 0
ES 4 2 1 0 3 0
FI2 3 3 1 5 2 6
FR 1 1 1 5 4 0
GB6 (2) 2 1 3 0 0
GR 4 3 1 5 2 0
IE3 nd nd nd nd nd nd
IT 3 3 1 5 2 0
LU 3 2 1 4 5 0
NL4 4 1 2 3 5 6
PT 0 0 1 0 2 0
SE5 2 5 4 3 1 6
CH6 (2) 2 1 3 4 0
CZ7 6 3 1 4 1 4
NO8 3 3 5 3 5 1
Source: Own data
Note: Ranking scores are adapted in accordance with supplementary comments from national experts 1 AT: Author’s adoption of reports of several answers in each category. 2 FI: Other argument: Domestic production. 3 IE: Main argument: What organic farming is about. 4 NL: Other argument: Price. 5 SE: Author’s adoption of reports of several answers in each category. Other argument: Quality. 6 GB and CH: Nature conservation is usually seen as part of environment protection. 7 CZ: Other argument: New product. 8 NO: Other argument: The way of farming. 1 = highest rank, 2 = second rank etc. Equal rankings accepted nd = no data available
55
In summary, there are strong similarities in the arguments used by retailers to sell organic food across the 18 countries. The food safety/health arguments are clearly the most important ones, with the environment arguments running a close second. Taste is third, and nature conservation and animal welfare are fourth and fifth, respectively.
5.2 Systematic promotion since 1993
Just as one of the main questions discussed in chapter 2 was whether there a market exists at all for organic food in all countries, it could also be asked whether promotion of organic food is found at all. Promotion is needed, but when markets are so small, any major initiatives risk resulting in demand far exceeding available supply. This happened, for instance, in Denmark in 1990. Promotion can occur at different levels. One level is individual retailers promoting products to local customers – and the opposite level is a far-reaching effort directed at consumers in general, whether region- or nation-wide. In the survey, the modest question asked was whether any systematic and professional promotion campaign – whether region- or nation-wide – had taken place since 1993, the year when the EU regulation on certification was implemented. The answers obtained are shown in table 5-2.
The table includes national and regional promotion along with an indication of who took the initiative and paid for it. In most countries some systematic professional promotion has taken place in recent years. Exceptions are found among countries with small organic sectors, such as Spain, the United Kingdom, Greece, Ireland, and the Czech Republic, but also Finland with a quite large organic sector. Most activities are found on the national level, with Portugal being the only case in which systematic promotion only happened on a regional basis. Nothing is said about the amount of promotion in the survey, but large variation is known. At the lower end, Germany mentions that systematic promotion of organic food took place since the early 1990s, but it was only done by a few firms and not for organic food in general. At the higher end of the scale, Denmark is found with several supermarket chains having nation-wide promotion of organic food as part of their general promotion several times a year.
The initiatives for systematic and professional promotion of organic food originate in three main groups. Firms within retailing, processing and wholesaling are mentioned in most countries, including 7 of the 8 countries with the largest organic sector and all those in which supermarkets are the most dominant sales channel (except for Finland) (see table 2-8 and chapter 3 above). Organic farming associations are mentioned as initiators in 6 countries, only two of which also include efforts by firms – Austria and Switzerland. Farmers’ associations are mentioned only in four countries, three of which also include systematic promotion made by firms. Hence, even though promotion activities are limited, firms are the main initiators, while organic associations only show some activity in countries where firms are not active and farmers’ associations promote parallel with firms – as in
56
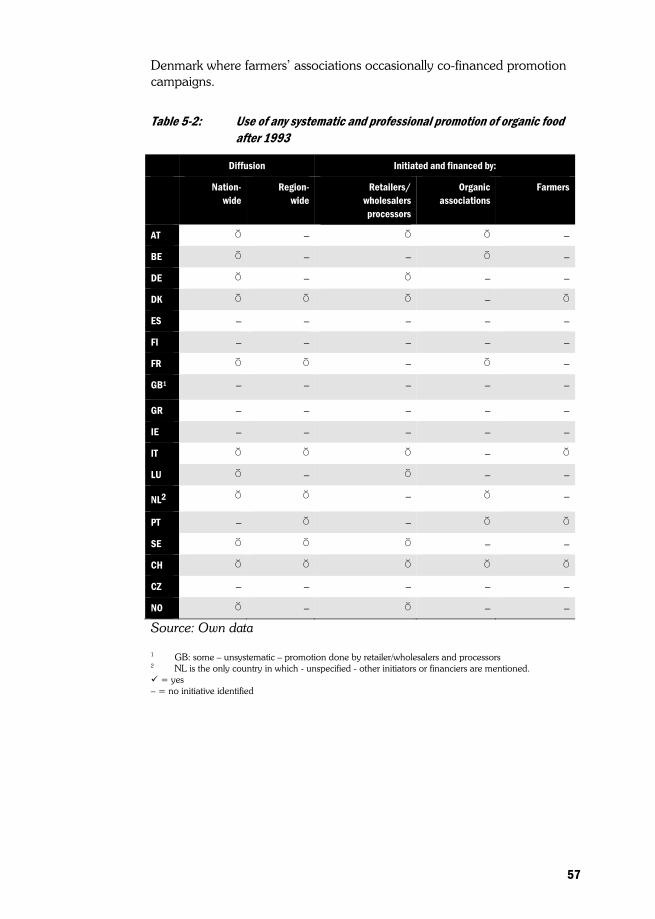
Denmark where farmers’ associations occasionally co-financed promotion campaigns.
Table 5-2: Use of any systematic and professional promotion of organic food after 1993
Diffusion Initiated and financed by:
Nation- wide
Region- wide
Retailers/ wholesalers
processors
Organic associations
Farmers
AT 3 – 3 3 –
BE 3 – – 3 –
DE 3 – 3 – –
DK 3 3 3 – 3
ES – – – – –
FI – – – – –
FR 3 3 – 3 –
GB1 – – – – –
GR – – – – –
IE – – – – –
IT 3 3 3 – 3
LU 3 – 3 – –
NL2 3 3 – 3 –
PT – 3 – 3 3
SE 3 3 3 – –
CH 3 3 3 3 3
CZ – – – – –
NO 3 – 3 – –
Source: Own data
1 GB: some – unsystematic – promotion done by retailer/wholesalers and processors 2 NL is the only country in which - unspecified - other initiators or financiers are mentioned.
= yes – = no initiative identified
57
5.3 Summary
Promotion of organic farming and organic food may take different forms. One is the purely accidental and indirect form of reports and debates in the mass media recommending (or the opposite) organic food as compared to non-organic food. Another and more direct type of promotion is to improve consumers’ knowledge of the existence of organic food products as such through promoting the certification labels. This relates to the whole class of organic food as opposed to non-organic food. A third form of promotion is systematic and professional promotion of organic food based on deliberate effort made by the actors in the organic food sector. This type of promotion approaches consumers with messages about motivations to buy distinct food products and is done every day by food retailers. A part of a deliberate promotion strategy may be to back up the daily efforts in food outlets by systematic use of professional promotion media. Here retailers’ arguments and the systematic use of professional promotion are analysed. They appear the only means available for any commercial actor in the organic food sector, and they seem important to obtain durable and systematic consumer attention to distinct products or outlets.
Retailers promote organic food mainly by using arguments regarding food safety/health or environment protection – with health arguments legally not allowed in some countries. The balance between the two arguments in a country, and the influence on consumer preferences, may also change depending on public opinion on agri-environmental matters, animal welfare and/or food production in general (including food scares). Nature conservation and taste are other important components in promoting organic food, while animal welfare issues are mainly found at the bottom of the list of arguments, even though for some products, such as eggs, the argument is used extensively.
Systematic promotion may help organic food move into larger segments of the general food market – and to stabilise the developmental trends of demands, at least by limiting the risk of stagnation and recession. However, in the countries studied here, systematic and professional promotion efforts are in general few and small. In one third of the countries, no example of systematic promotion is found in the period 1993-97. Private firms are the main initiators and financiers, especially in countries with large organic sectors and sales mainly channelled through supermarkets. The organic farming associations only took few initiatives and mainly in countries where firms were not active.
58
6 Prices of organic food Prices can be seen as the result of interaction between available supply and demand for the product. The relationship between supply and price is essentially determined by the cost of production and marketing (collecting, processing and distributing). The relationship between demand and price is determined by the preferences of buyers, which are influenced by the three P’s, discussed in the previous chapters: place (chapter 3), product characteristics (chapter 4) and promotion (chapter 5). In economic theory, price varies as a direct reaction to marginal changes in supply or demand. In practice, however, price is a parameter for actors in the market to decide on. Thus, in reality it might only be in the long run that prices reflect a clear balance of supply and demand.
Prices of organic food often include a premium over and above the price conventional products can command. This premium reflects at one and the same time differences in production costs between the two farming systems, and consumers’ willingness to pay for the difference in product bought. When producers – whether farmers or processing firms – keep themselves to the regulations of organic farming, it often implies higher costs of production and lower output (see Nieberg and Offermann 1999 on farm economics). This is especially the case where conversion to the organic production system implies large changes in farms and processing firms. On the other hand, if the new production methods offer the consumer aspects in which they are interested, such as a different quality of product or off-farm effects (see section 5.1), consumers may be willing to pay more for organic than for other products.
The costs associated with supply (mainly including costs of production and marketing) represent a lower limit for prices, and consumers’ willingness to pay represents an upper limit. The actual price level reflects the point where sellers and consumers agree on maximising their benefits. This level need not be the same in different markets. Within national markets, price premiums may differ according to sales channels, because different products or services are distributed which lead to different costs of production and marketing. Similarly, international differences in price levels may result not only from differences in national production costs, but also from different marketing costs, that is, differences in the national marketing mix (see chapter 1). Also income levels may differ between countries, which affects purchasing power and willingness to pay premiums.
However, premium prices are not the only aspect of farm returns that are worthy of consideration. If not all produce is sold for a premium price, the average product price drops. It is therefore important, when discussing prices, to include estimates of the proportion of the domestic supply of organic products being sold in the organic market, which is the topic of the first section of this chapter. In the subsequent sections, premiums for both producers and consumers are discussed. It needs to be emphasised that even though figures are mentioned in the tables there is a major element of estimate connected to most of them. The figures by no means represent a
59
quality of information similar to that of official statistical bureaus. The reason is that such information simply does not exist in most countries. Thus, information rests on estimates based on the experience of national informants. Furthermore, the tables do not refer to a standardised period. Numbers were reported in the first half of 1998 and some may refer to information covering a short period just before reporting, while others may refer to longer and earlier periods – mainly the year 1997. Finally, it should be noted that no information is available regarding the dynamics of the prices.
6.1 Products sold as organic/non-organic
Sales channels for organic food were described in chapter 3. In this section the question is whether the organic production can be sold in the organic market or whether (part of) the production has to be sold through markets for non-organic products, which have larger throughputs. When sold through conventional market channels, organic products may not realise the same price as that paid for conventionally grown products. One reason is that the organic product may not comply with quality demands in the conventional market, such as indicated in chapter 4, concerning physical appearance of the product. Especially in countries with small organic sectors one should expect problems with selling larger amounts of products in the organic market because any variation in supply or demand may disturb the intricate balance. In countries with large organic sectors, changes in supply and demand – at least in theory – do not upset market conditions to the same degree, so that sales in the conventional market are not immediately necessary. It can, furthermore, be expected that where a considerable proportion of the organic production is sold in the conventional market, this is caused either by institutional barriers for developing the organic sales or because the price premiums in the organic market are low anyway. In the last case the premium may not cover the extra cost of marketing organic products.
The proportion of organic produce sold in the organic market is shown in tables 6-1 and 6-2 for the major and minor products (as defined in chapter 2), respectively. A high percentage of the organically-grown produce, especially for the major products, is estimated as being sold in the organic market, although that is more true for some products than for others, and in some countries more than in others. For example, in many countries milk is one of the main products which seems more difficult to sell as organic. Consumers can buy organic milk in most countries, but only five of the fourteen countries reported sales of 80 percent or more of organic production on the organic milk market. For beef, as a minor product, which in most countries is closely related to milk, similar figures are recorded. A number of factors could bring about this situation.
In general, both milk and beef need some processing (via dairy factory or butcher/slaughterhouse/meat factory), which requires extra steps in the certification process, and hence extra costs. In addition, and possibly more
60

importantly, plants which are licensed to handle organic products may be few and far between, so that increased transport costs may become an issue, especially for milk. A further complication is that, in general, both milk and beef are processed into many different products before they are sold to consumers. Where organic supplies are small, it seems very costly to have a full range of products produced organically and difficult to find sales channels for them. Furthermore, both milk and beef (and meat in general) require facilities in the shops to be kept fresh which are seldom found in traditional sales channels for organic food such as health-food shops. Hence, these products are more difficult to distribute in countries where sales through general stores are low (see chapter 3). Another factor, of relevance for beef in particular, is that it is an expensive food. Because of this characteristic, consumers demand extra general qualities of taste etc. (see chapter 4), if they are to pay a further premium. Low sales figures on the organic market may therefore indicate that a high percentage of the meat offered for sale is not of the general quality for which consumers are willing to pay a premium. As mentioned earlier, this is the case of Denmark.
What is said about the difficulties of selling organic beef also holds for other meat (lamb and pork), but from the table it appears that higher shares are sold organic. It should, however, be remembered, that only the production of meat is related to the production of an other major product, milk, and hence the problems of selling other types of meat may be seen as an important explanation for the small quantities produced. An additional explanation is that early studies suggest a comparatively low demand for meat in general among consumers of organic food (cf. Brombacher and Hamm 1990).
In some countries, such as in Austria and the mountainous areas of Germany, the low percentage of milk products being sold in the organic market is, for a large part, due to high subsidies for organic agriculture. This meant that, even without price premiums, organic livestock farming (which did not need to change much in their management to become organic) was more attractive than conventional farming. Hence, there was no great push for separate marketing of organic milk. In Germany this situation is combined with a market where the many labels of different organic associations are a barrier for marketing organic produce (see chapter 4), because each association wants their own dairies with products labelled with their particular label. The result is that each dairy deals with such small quantities of organic milk, that they appear unprofitable to process.
The marketing of organic milk also has peculiarities in Denmark where 80 percent of organic milk is sold as organic, as opposed to 90 percent or more for most other products. Although low relative to the rest of the Danish market for organic products, the 80 percent marketing of Danish organic
61
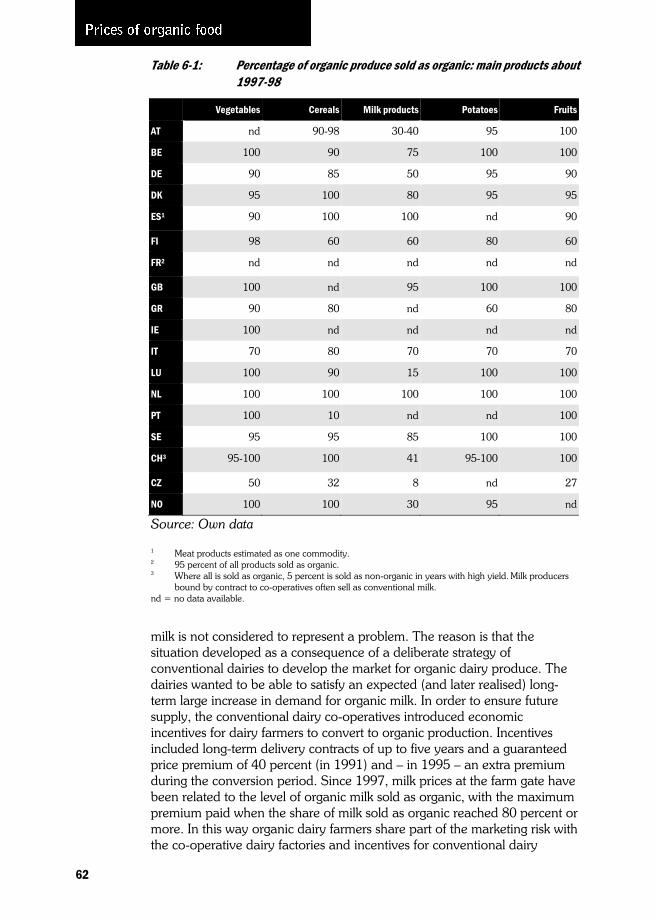
Table 6-1: Percentage of organic produce sold as organic: main products about 1997-98
Vegetables Cereals Milk products Potatoes Fruits
AT nd 90-98 30-40 95 100
BE 100 90 75 100 100
DE 90 85 50 95 90
DK 95 100 80 95 95
ES1 90 100 100 nd 90
FI 98 60 60 80 60
FR2 nd nd nd nd nd
GB 100 nd 95 100 100
GR 90 80 nd 60 80
IE 100 nd nd nd nd
IT 70 80 70 70 70
LU 100 90 15 100 100
NL 100 100 100 100 100
PT 100 10 nd nd 100
SE 95 95 85 100 100
CH3 95-100 100 41 95-100 100
CZ 50 32 8 nd 27
NO 100 100 30 95 nd
Source: Own data
1 Meat products estimated as one commodity. 2 95 percent of all products sold as organic. 3 Where all is sold as organic, 5 percent is sold as non-organic in years with high yield. Milk producers
bound by contract to co-operatives often sell as conventional milk. nd = no data available.
milk is not considered to represent a problem. The reason is that the situation developed as a consequence of a deliberate strategy of conventional dairies to develop the market for organic dairy produce. The dairies wanted to be able to satisfy an expected (and later realised) long-term large increase in demand for organic milk. In order to ensure future supply, the conventional dairy co-operatives introduced economic incentives for dairy farmers to convert to organic production. Incentives included long-term delivery contracts of up to five years and a guaranteed price premium of 40 percent (in 1991) and – in 1995 – an extra premium during the conversion period. Since 1997, milk prices at the farm gate have been related to the level of organic milk sold as organic, with the maximum premium paid when the share of milk sold as organic reached 80 percent or more. In this way organic dairy farmers share part of the marketing risk with the co-operative dairy factories and incentives for conventional dairy
62
farmers to convert increase when the marketing share is high. From some countries, such as Germany, France and Switzerland, it is reported that long-term contracts with conventional dairies that do not process organic milk products at times hampered marketing of organic milk. In the United Kingdom the marketing of organic milk shows still other peculiarities. In most countries some relationship is found between prices of organic and non-organic products – hence prices are expected to fluctuate in order to keep this relationship in the long run. A strong very recent growth in the organic milk market (1998-1999) seems to show a decoupling of the two sets of prices as a fall in prices for non-organic milk has not (yet) been duplicated for organic milk.
For the other major products, some countries display somewhat low figures for the percentage of organic produce sold as such. For example, in Finland and Italy less than three quarters of their organic produce in several categories is sold as organic. In the Czech Republic, only a small part of most of the organic products is sold in the (nearly non-existent – see chapter 2) national organic market. However, there is no pattern in the estimates, such as small markets selling a lower or higher proportion of their organic production in the organic market. This suggests fundamental differences in the marketing mix between Finland, Italy and the Czech Republic on the one hand and the other countries on the other – whether caused by small price premiums available or a weak market organisation for organic food or both.
An important difference between the major and minor products is that fewer countries supplied data for the latter, which may be expected from products that are not very important in the domestic market (see also chapter 2). The data which were supplied, though, indicated that almost all of the organic pork, poultry and – especially – eggs were sold in the organic market. A larger percentage of wine was sold as organic than of oilseeds, for which one third of the countries indicated less than 75 percent of organic production as organic sales.
6.2 Price premiums to farmers
As mentioned in the introduction to this chapter, many farmers need premiums to cover the higher costs of organic production methods. The survey’s results detailing premiums for producers are shown in tables 6-3 and 6-4, for major and minor products respectively.
The tables include, in some instances, individual figures while in other instances ranges are reported. For both organically and non-organically grown products prices can vary through the season for many reasons. Premiums shown in the tables must therefore be seen as general estimates only. The price premiums mentioned in the table are rather variable. This holds within product groups across countries and within countries where price premiums can differ across products. This can reflect differences in production conditions for similar products in different countries, and for different products within one country. For example, it is likely that organic
63
dairy production is relatively easy (low extra costs) as compared with organic management of horticultural crops in all countries, but in some countries the cost of production of sub-tropical vegetables is higher than in others (such as in Scandinavian countries as compared with Mediterranean countries). Similarly, the need for price premiums may differ across countries according to differences in support received by organic farmers (see Lampkin et al. 1999 for an overview of support levels).
Especially for cereals and potatoes, premiums received by farmers reach 50 percent or more in approximately two thirds of the countries which provided answers. Countries as diverse as Austria, Germany, France, Luxembourg, the Netherlands and Sweden mention levels of 100 percent premiums for cereals. Germany and the United Kingdom record up to 200 percent premiums for potatoes. Only in a few instances are zero premiums mentioned – found both in countries with large organic sectors such as Sweden (for vegetables and potatoes) and in countries with small sectors like Spain (for vegetables and cereals) and the Czech Republic (for all major products except cereals).
The high producer price premiums paid for cereals and potatoes seem to be influenced by strong consumer demand. At the other end of the scale, milk and beef consistently show relatively low premiums, with neither of them rising much above 40 percent in producer premium. The reasons are likely to be the same as for the low percentage of these products sold on the organic markets, that is, a combination of organic livestock production costs being lower relative to non-organic production than for other products, marketing arrangements (processing needing extra licensing, transport costs, labelling arrangements) and quality of the product (see section 6.1).
64
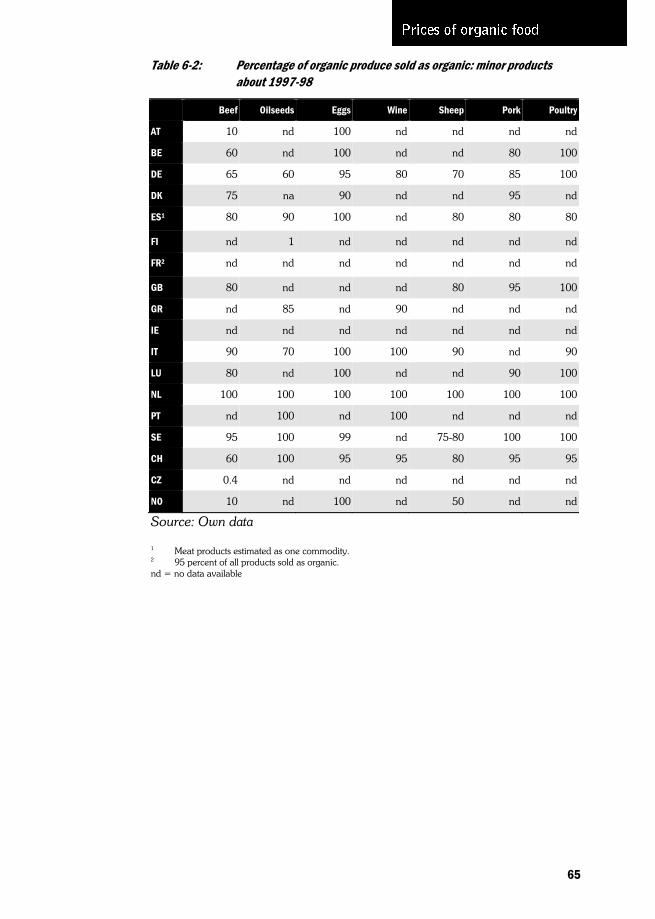
Table 6-2: Percentage of organic produce sold as organic: minor products about 1997-98
Beef Oilseeds Eggs Wine Sheep Pork Poultry
AT 10 nd 100 nd nd nd nd
BE 60 nd 100 nd nd 80 100
DE 65 60 95 80 70 85 100
DK 75 na 90 nd nd 95 nd
ES1 80 90 100 nd 80 80 80
FI nd 1 nd nd nd nd nd
FR2 nd nd nd nd nd nd nd
GB 80 nd nd nd 80 95 100
GR nd 85 nd 90 nd nd nd
IE nd nd nd nd nd nd nd
IT 90 70 100 100 90 nd 90
LU 80 nd 100 nd nd 90 100
NL 100 100 100 100 100 100 100
PT nd 100 nd 100 nd nd nd
SE 95 100 99 nd 75-80 100 100
CH 60 100 95 95 80 95 95
CZ 0.4 nd nd nd nd nd nd
NO 10 nd 100 nd 50 nd nd
Source: Own data
1 Meat products estimated as one commodity. 2 95 percent of all products sold as organic. nd = no data available
65
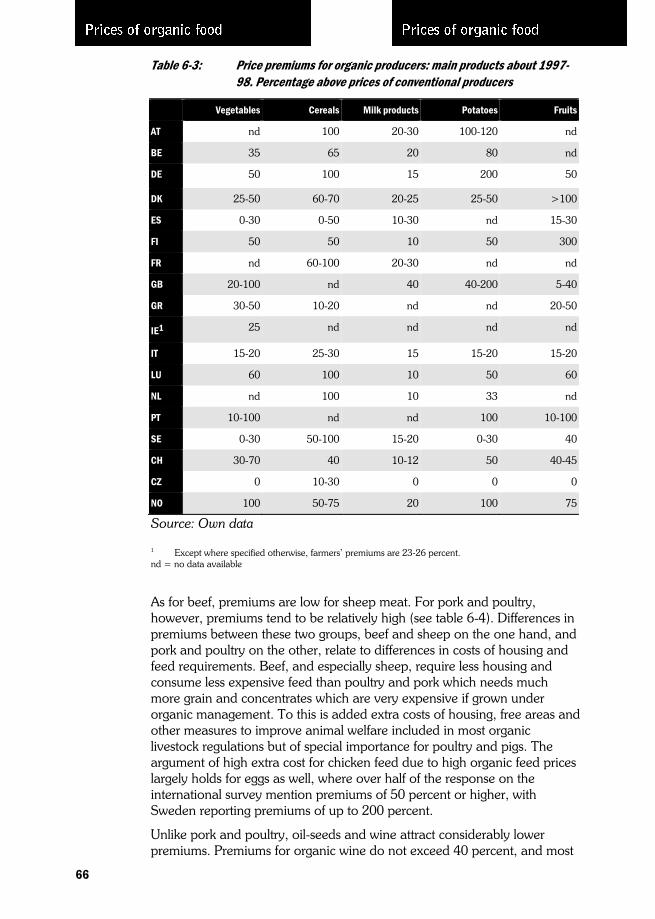
Table 6-3: Price premiums for organic producers: main products about 1997-98. Percentage above prices of conventional producers
Vegetables Cereals Milk products Potatoes Fruits
AT nd 100 20-30 100-120 nd
BE 35 65 20 80 nd
DE 50 100 15 200 50
DK 25-50 60-70 20-25 25-50 >100
ES 0-30 0-50 10-30 nd 15-30
FI 50 50 10 50 300
FR nd 60-100 20-30 nd nd
GB 20-100 nd 40 40-200 5-40
GR 30-50 10-20 nd nd 20-50
IE1 25 nd nd nd nd
IT 15-20 25-30 15 15-20 15-20
LU 60 100 10 50 60
NL nd 100 10 33 nd
PT 10-100 nd nd 100 10-100
SE 0-30 50-100 15-20 0-30 40
CH 30-70 40 10-12 50 40-45
CZ 0 10-30 0 0 0
NO 100 50-75 20 100 75
Source: Own data
1 Except where specified otherwise, farmers’ premiums are 23-26 percent. nd = no data available
As for beef, premiums are low for sheep meat. For pork and poultry, however, premiums tend to be relatively high (see table 6-4). Differences in premiums between these two groups, beef and sheep on the one hand, and pork and poultry on the other, relate to differences in costs of housing and feed requirements. Beef, and especially sheep, require less housing and consume less expensive feed than poultry and pork which needs much more grain and concentrates which are very expensive if grown under organic management. To this is added extra costs of housing, free areas and other measures to improve animal welfare included in most organic livestock regulations but of special importance for poultry and pigs. The argument of high extra cost for chicken feed due to high organic feed prices largely holds for eggs as well, where over half of the response on the international survey mention premiums of 50 percent or higher, with Sweden reporting premiums of up to 200 percent.
Unlike pork and poultry, oil-seeds and wine attract considerably lower premiums. Premiums for organic wine do not exceed 40 percent, and most
66
of the oil-seed less than 50 percent. The high price premiums of oilseeds – up to 100 percent – reported from Spain and the Czech Republic seem caused by a production of strongly demanded sunflower seeds, while in the other countries production of oilseeds include low value products such as rapeseed.
6.3 Price premiums paid by consumers
Price premiums paid to farmers are not necessarily directly related to premiums paid by consumers. This is the case because the price for the raw material is only part of the total package of costs which are charged to the consumer. Apart from the raw material, marketing costs, such as transport, packaging, handling and insurance need to be compensated.
Marketing costs are higher for organic products where producers may live far from one another relative to other farmers, and transport costs may be considerable per unit of product. Similarly costs of handling the product may be very high per unit of product. The costs of, for example, cleaning of implements between handling of non-organic and organic produce needs to be paid for. Risks are related to problems during transport and handling; and to spoilage if the product does not get sold in time. Risk of problems occurring is high when experience is limited and the product is not well-established, characteristics which were present in many organic markets in the past. With increasing numbers of organic farmers, increasing experience in the area of marketing of organic products and more stable markets, these costs are bound to decrease. Furthermore, with increasing quantities, considerable economies of scale can be realised so that costs of processing and marketing will decrease sharply per unit – and hence consumer premiums can be lowered.
67

Table 6-4: Price premiums for organic producers: minor products about 1997-98. Percentage above prices of conventional producers
Beef Oilseeds Eggs Wine Sheep meat Pork Poultry
AT 20-25 nd 30 nd nd nd nd
BE 35 nd 75 nd nd 40 nd
DE2 20 20 40 15 20 80 50-100
DK 10-30 na 10-95 nd 20 60-100 nd
ES nd 50-100 10-30 0-20 nd nd nd
FI 40 30 100 0 nd 40 0
FR nd nd nd nd nd nd nd
GB 40 nd nd nd 20 100 200
GR nd 15-50 nd 10-25 nd nd nd
IE1 20 nd nd nd 20 20 20
IT nd nd 20-100 15-20 nd nd nd
LU 40 nd 50 nd nd 40 50
NL nd nd nd nd nd nd nd
PT nd 20-30 nd 20-30 nd nd nd
SE 5-25 100 70-200 nd 0-15 20-95 nd
CH 20 33 50 30-40 20 35 25-35
CZ 0 100 0 0 0 0 0
NO 10 nd 100 nd 5 nd nd
Source: Own data
1 Except where specified otherwise, farmers’ premiums are 23-26 percent. 2 For price premiums for beef including veal a range of 10-50 percent is indicated. nd = no data available
Where the final product bought by the consumer undergoes little processing (such as with milk and potatoes) the premium paid by the consumer can be relatively close to that received by the producer. For example, on average in 1996, all Danish farmers received between 32 and 40 percent of prices paid by consumers for milk, meat and eggs (Landøkonomisk oversigt 1998). For bread, however, this figure was only 8 percent. If a producer premium of 10 percent is put on all products, in the case of milk this translates into 3 to 4 percentage points increase in consumer prices. Bread would only need an increase of 0.8 percentage points to compensate for the producers’ 10 percent premium. This price relationship was illuminated quite dramatically in autumn 1998 by a major Danish supermarket chain which converted all production of fresh bread and cake in the shops to organic while keeping consumer prices at the level previously charged for non-organic products.
Consumer prices are also influenced by the way the linkage from farmer to consumer is organised. In chapter 3 only the last part of this network was
68
described – retailing. Before the products reach retailers, most of them need to be delivered from farmers to processing or wholesaling firms and then distributed to retailers. As long as the organic sector is very small, a fully separate system of delivery from farmer to retailer is costly and lead to high consumer price premiums. The alternative is to participate in existing food delivery systems which should be less costly. But at the same time it represents a risk that the organic products cannot be promoted or otherwise profiled as distinct from other products delivered by that system. In addition, even though costs of existing large-scale food delivery systems are low, organic producers who participate in such systems should expect that owners of existing delivery systems will try to appropriate parts of the extra profits to be earned by organic producers.
The consumer premiums are shown in table 6-5 (for the main products), and table 6-6 (for the minor products) in percentage differences between conventional and organic products at the retail level. These premiums include both the extra production and marketing costs of organic products, and profits. As these prices are taken as a percentage of the retail price of conventional products (which are higher than the farm-gate price on which producer premiums are calculated), they cannot be compared directly with the producer premiums.
Although ranges for premiums are wide for most products, consumer premiums tend to be highest for vegetables, potatoes and fruits. Margins for vegetables and fruits are generally, both for organic and non-organic products, higher than for other products because of the high risk of spoilage. In general, however, the turnover of organic vegetables and fruits in shops is far lower than of non-organic products and hence the risk of spoilage is higher. This can explain the high price premiums for these products. On the other hand it can be expected that increasing trade (and hence increasing turnover) could lead to lower costs of spoilage as well as to lower costs of transports etc. per unit. Increasing volumes of sales should then be able to effect lower consumer prices without influencing farm prices. The high premiums for potatoes are mainly caused by relatively high producer premiums, which are caused by high demand (see table 6-3).
In the protein category (eggs and meat), sheep and beef seem to attract the lowest premiums. Sheep meat is in general only a small product in the food market and beef belongs to the more expensive meat categories where lower premiums in percentage of prices for conventional beef still lead to rather high consumer prices in absolute figures. The high price premiums paid for pork and chicken are explained by the high producer premiums (see table 6-4). Concerning eggs, the most likely consideration is the animal welfare aspect, as in a number of countries (notably in Denmark and Sweden) the difference in consumer prices between organically-produced eggs and other welfare oriented eggs like free-range eggs is small.
Consumer price premiums for nearly all products are relatively high in those countries where only small market shares are achieved, so that marketing costs become very high (Spain, Italy and to a lesser extent Greece and Portugal). Consumer price premiums are also relatively high in Germany, because of high marketing costs involved in using the main distribution
69
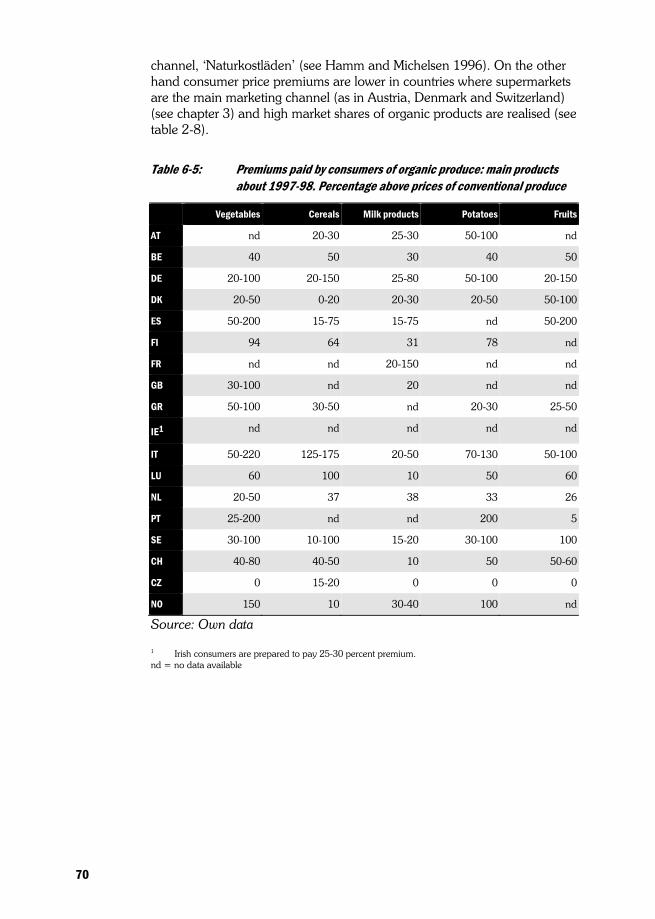
channel, ‘Naturkostläden’ (see Hamm and Michelsen 1996). On the other hand consumer price premiums are lower in countries where supermarkets are the main marketing channel (as in Austria, Denmark and Switzerland) (see chapter 3) and high market shares of organic products are realised (see table 2-8).
Table 6-5: Premiums paid by consumers of organic produce: main products about 1997-98. Percentage above prices of conventional produce
Vegetables Cereals Milk products Potatoes Fruits
AT nd 20-30 25-30 50-100 nd
BE 40 50 30 40 50
DE 20-100 20-150 25-80 50-100 20-150
DK 20-50 0-20 20-30 20-50 50-100
ES 50-200 15-75 15-75 nd 50-200
FI 94 64 31 78 nd
FR nd nd 20-150 nd nd
GB 30-100 nd 20 nd nd
GR 50-100 30-50 nd 20-30 25-50
IE1 nd nd nd nd nd
IT 50-220 125-175 20-50 70-130 50-100
LU 60 100 10 50 60
NL 20-50 37 38 33 26
PT 25-200 nd nd 200 5
SE 30-100 10-100 15-20 30-100 100
CH 40-80 40-50 10 50 50-60
CZ 0 15-20 0 0 0
NO 150 10 30-40 100 nd
Source: Own data
1 Irish consumers are prepared to pay 25-30 percent premium. nd = no data available
70

Table 6-6: Premiums paid by consumers of organic produce: minor products about 1997-98. Percentages above prices of conventional produce
Beef Oilseeds Eggs Wine Sheep meat Pork Poultry
AT 25-30 nd 25-30 nd nd nd nd
BE 35 nd 70 nd nd 40 60
DE 30-50 50 30 20 10-30 50-80 40-100
DK 20-50 nd 7-50 nd nd 30-60 50-100
ES nd 100 15-100 60 nd nd nd
FI 33 nd nd nd nd -2 nd
FR 30 nd nd nd nd nd nd
GB 20-50 nd nd nd 20-50 50-100 100+
GR nd 25-50 nd 20-60 nd nd nd
IE1 nd nd nd nd nd nd nd
IT 20-50 107 50-200 20-30 20-50 nd nd
LU 40 nd 50 nd nd 40 50
NL nd nd 43 nd nd nd nd
PT nd 30 nd 25 nd nd nd
SE 20 nd 25-115 nd 20 40 nd
CH 20 nd 50 30-40 20 35 30
CZ 0 15-50 0 0 0 0 0
NO 30 nd 100 nd 30 nd nd
Source: Own data
1 Irish consumers are prepared to pay 25-30 percent premium. nd = no data available
71
6.4 Summary
In general, most organic products are sold as organic. The issue of low shares of organic production finding its way into the organic market is not concentrated in countries with small organic sectors. The only exception to extensive sales in organic markets is the Czech Republic – one of the non-EU member states and a country that only recently developed a market economy, where low proportions of especially organic milk and meat are sold as organic. Milk and beef in general are the two products with low percentages sold in the organic market when compared with the other main products. For example, half or less of the organic milk was sold as organic in 6 of the 14 countries for which estimates were provided. This occurred both in countries with large organic sectors, such as Austria and in countries with small organic sectors. Reasons may include relative ease of dairy production to convert to organic agriculture, so that existing subsidies are sufficient to entice farmers into organic production, coupled with high delivery and transport costs to processors and others.
Producer premiums in general follow the same patterns as the share of organic products sold through organic channels. That is, premiums as a percentage of the conventional price for milk and beef are low, as compared with those of the other products. Especially cereals and potatoes command high premiums as a reflection of high demand in some countries. Relative production costs are likely to be of importance in explaining the high premiums paid for pork, poultry and eggs.
Consumer premiums follow, by and large, the same pattern as producer premiums, with premiums for vegetables, potatoes and fruits high, as well as for pork, chicken and eggs. The level of producer premiums depends, however, to some extent on market shares and distribution channels. Distribution costs – and hence consumer prices – are lower in countries with large market shares and high distribution through supermarkets, whereas in countries with lower market shares and less supermarket distribution the consumer prices are quite high due to higher distribution costs.
72
7 Markets for organic feed crops The aim of this chapter is to complete the overview of organically produced goods sold in the market. This is done by presenting available information of organic feed. A definition of organic livestock production is not yet (1999) an integral part of the EU definition of organic agriculture put forward in EC Reg. 2092/91. EU agriculture ministers agreed on the principles of a common livestock regulation in December 1998, but in practice 17 of the 18 countries in this survey – with the exception of Greece – have working national definitions of organic livestock production. In some instances – such as Denmark – livestock production standards are part of public legislation while in most others they are part of private standards. In international trade with organic animal products it is customary to comply with the standards of the International Federation of Organic Agriculture Movements (IFOAM). This implies a need for organic feed, as IFOAM standards demand animals to be fed to a great extent with organic fodder. The aim of this chapter is to investigate the extent to which, and whether, these requirements have developed into national and international markets for organic feed.
The production of organic animal products – to some extent – depends on the national (or international) demand for products of beef, sheep, pork and poultry. In chapter 2 it appeared that national markets for animal products in general are much smaller than for plant products. The major exceptions are Denmark and Austria where organic milk products cover up to 14 pct. of all domestic demand for milk products. However, for the strongly related beef products markets are far less developed in these countries, as in all other countries, reaching not above 1 percent market share. Markets for pork and poultry are the least developed markets across countries, as they were ranked lowest in table 2-2 above and achieve very small market shares. Hence markets for organic fodder should not be expected to be of any major importance in any country.
7.1 Domestic markets
The possibility of developing national markets for organic fodder mainly depends on:
1. demand and production of organic animal products in general, and for pigs and poultry specifically, as they demand more grain and concentrates than sheep and cattle.
2. regional concentration of organic production in grassland regions where organic farms need energy fodder (cereals) for their cattle
3. regional concentration of organic production in arable land areas with low frequency of livestock
4. special national regulations for feeding animals in organic farming.
73
74
In some EU countries, the concentration of organic milk or beef production in some grassland regions is so high that imports of grain for the cattle is needed from regions with more arable land. Livestock concentration is very high in parts of Austria (Salzburger Land, Tirol), Germany (parts of Bavaria, Baden-Württemberg and Mecklenburg-Vorpommern), Switzerland (in the Alps), and France (in the highlands) and hence these regions need imports of fodder from other national regions or from abroad.
On the other hand, there are also regions with surplus organic feed; these are the regions with low livestock density or non-existing markets for organic animal products. Hence
leguminosae (such as pulses) are not needed for feeding own animals and may be supplied to the market,
part of the production of grain and oil-seeds for food that is not sold on the food market appear on national or international fodder markets, to obtain some price premium,
lower quality grain and oil-seeds production, unsuitable for food, may be fed to animals.
One or more of these conditions are met in many regions throughout Europe. However, this potential is not used fully as in many of them markets for organic fodder are nearly non existent or trade with organic fodder is very limited.
The German market for organic feed is a special case, because German production standards for organic farming allow farmers to buy feed from farms under conversion and these fodder crops are dealt with as organic. Therefore, in Germany, a major part of the fodder found for sale is produced on farms during the conversion period. In many cases fully converted farms sell their organic cereals as organic food with high price premiums and buy grain and pulses from farms under conversion with smaller price premiums. However, for exports products come from fully converted farms.
In the international survey three main types of fodder crops are distinguished. They include cereals, pulses and oilseeds. The possibility for mentioning other crops is only used in 4 countries: desiccated lucerne is mentioned for Belgium, while forage, fresh silage and hay are mentioned for Finland, United Kingdom and Norway. Because of high transportation costs for these voluminous fodder crops, trade is very limited and normally does not take place over larger distances.
Information was collected on the general characterisation of markets for organic livestock feed. The results are summarised in table 7-1, where the market for each type of fodder crop is characterised on a scale from ‘well established and well functioning’ via ‘partly well and partly poorly functioning’ to ‘nearly non-existent as trade is very limited’. Not all national experts were able to give an unambiguous characterisation and therefore some countries are mentioned in two categories.
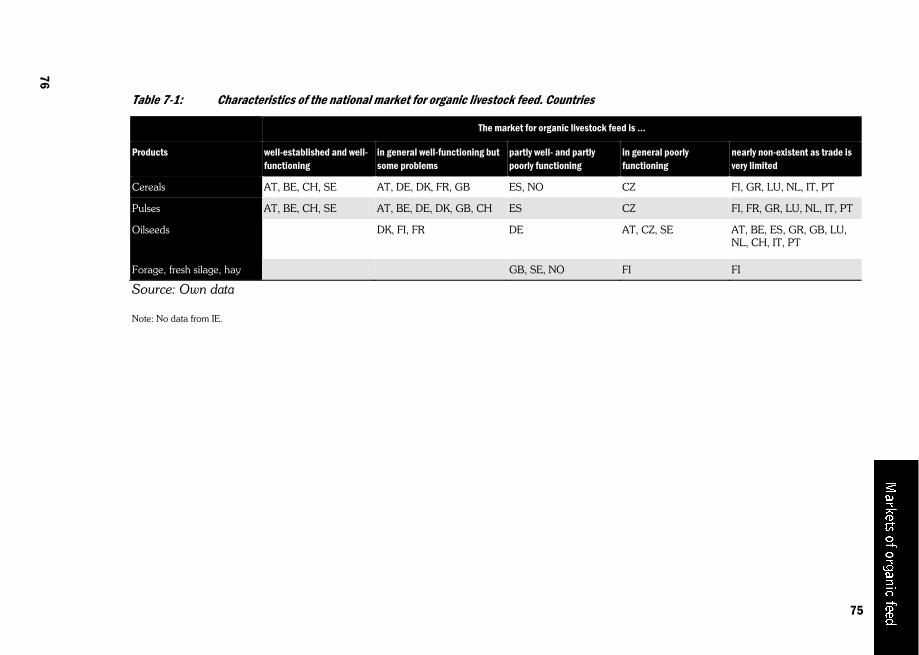
Table 7-1: Characteristics of the national market for organic livestock feed. Countries
The market for organic livestock feed is ...
Products well-established and well-functioning
in general well-functioning but some problems
partly well- and partly poorly functioning
in general poorly functioning
nearly non-existent as trade is very limited
Cereals AT, BE, CH, SE AT, DE, DK, FR, GB ES, NO CZ FI, GR, LU, NL, IT, PT
Pulses AT, BE, CH, SE AT, BE, DE, DK, GB, CH ES CZ FI, FR, GR, LU, NL, IT, PT
Oilseeds DK, FI, FR DE AT, CZ, SE AT, BE, ES, GR, GB, LU, NL, CH, IT, PT
Forage, fresh silage, hay GB, SE, NO FI FI
Source: Own data
Note: No data from IE.
75
76
The table indicates that the countries in general fall into two main categories. In one category markets are in general well functioning, even though with some problems, while in the other category markets are nearly non-existent. In between are only found few countries. The markets for cereals and pulses are judged better functioning in more countries than oil-seeds, because the production of oil-seeds is very poor in most of the countries. With the exception of France, the countries with (well) functioning markets for organic cereals are the same as those with functioning markets for pulses. These countries are Austria, Belgium, Switzerland, Germany, Denmark, United Kingdom, and Sweden. Only Denmark, Finland, and France have a functioning market for organic oil-seeds. Spain falls into the middle category with more or less poorly functioning fodder markets, while in the rest of the countries there is practically no market for or trade in fodder. Because demand for organic meat and eggs has been increasing strongly recently in some European countries, the markets for fodder are expected to develop in the near future. So, in a few countries with non existent markets, it is mentioned that one or a few factories of organic fodder are now developing (examples are Ireland, Spain, and Norway).
In several cases it is emphasised that the largest share of organic fodder trade is found as direct trade among farmers (examples are Germany, Denmark, and Ireland). From the Netherlands it is even reported, that ‘Exchange of livestock feed and manure (between arable and livestock farms) gives both farms a kind of synergy’ (insertion by the editor).
In table 7-2, domestic production in each country is characterised. Two alternatives were given. One was that some part of the national feed production is grown with the main purpose of commercial sales; the other alternative was that national feed market is composed of (more or less accidental) surplus production. These alternatives are not fully mutually exclusive, as commercial feed production need not exclude feed delivery out of surplus production. The table includes any commercial production while sales of surplus production is only indicated if no reports on commercial production was received. Against this background and taken together with table 7-1, table 7-2 illustrates that in most countries with a functioning market some fodder production is grown with the purpose of sale. Nothing is said about the amount of commercial sales. On the other hand, in countries with nearly no market for organic feed, national supplies of fodder are composed of more or less accidental surplus production. Ireland is a special case here, because commercial feed production is not permitted under the national organic support regime (REPS).
In Germany, it is emphasised that commercial fodder production for the national market mainly takes place in the conversion period because under-conversion products are allowed as feed in the national organic livestock regulations. In countries such as Spain and Finland, fodder crops are produced for commercial sales even though the feed market is poorly functioning or nearly non existent. In Finland, a systematic overproduction of livestock feed for commercial reasons is explained by the fact that producers need to sell crops in all seasons of the crop rotation. Hence there
76
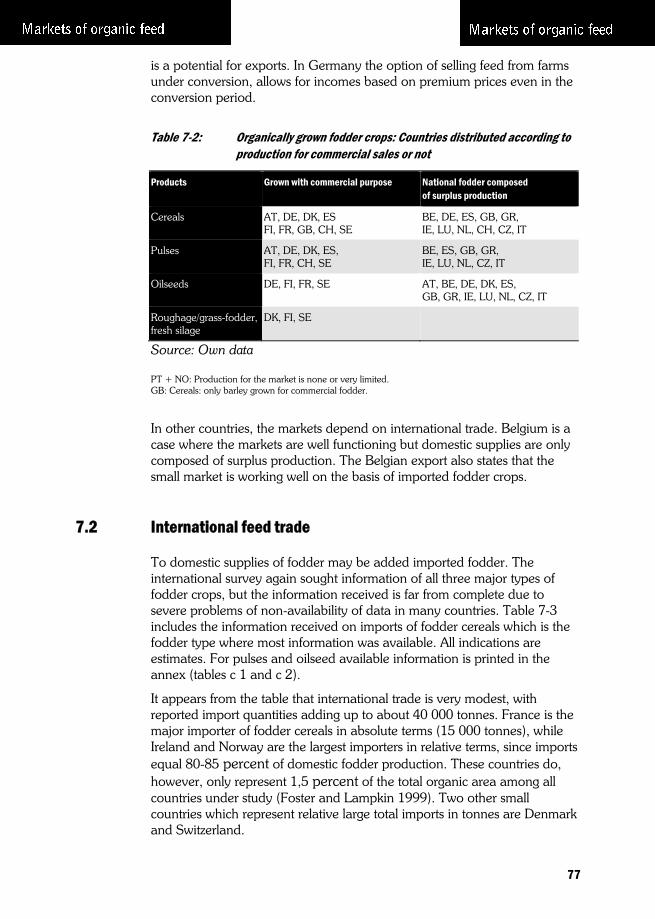
is a potential for exports. In Germany the option of selling feed from farms under conversion, allows for incomes based on premium prices even in the conversion period.
Table 7-2: Organically grown fodder crops: Countries distributed according to production for commercial sales or not
Products Grown with commercial purpose National fodder composed of surplus production
Cereals AT, DE, DK, ES FI, FR, GB, CH, SE
BE, DE, ES, GB, GR, IE, LU, NL, CH, CZ, IT
Pulses AT, DE, DK, ES, FI, FR, CH, SE
BE, ES, GB, GR, IE, LU, NL, CZ, IT
Oilseeds DE, FI, FR, SE AT, BE, DE, DK, ES, GB, GR, IE, LU, NL, CZ, IT
Roughage/grass-fodder, fresh silage
DK, FI, SE
Source: Own data
PT + NO: Production for the market is none or very limited. GB: Cereals: only barley grown for commercial fodder.
In other countries, the markets depend on international trade. Belgium is a case where the markets are well functioning but domestic supplies are only composed of surplus production. The Belgian export also states that the small market is working well on the basis of imported fodder crops.
7.2 International feed trade
To domestic supplies of fodder may be added imported fodder. The international survey again sought information of all three major types of fodder crops, but the information received is far from complete due to severe problems of non-availability of data in many countries. Table 7-3 includes the information received on imports of fodder cereals which is the fodder type where most information was available. All indications are estimates. For pulses and oilseed available information is printed in the annex (tables c 1 and c 2).
It appears from the table that international trade is very modest, with reported import quantities adding up to about 40 000 tonnes. France is the major importer of fodder cereals in absolute terms (15 000 tonnes), while Ireland and Norway are the largest importers in relative terms, since imports equal 80-85 percent of domestic fodder production. These countries do, however, only represent 1,5 percent of the total organic area among all countries under study (Foster and Lampkin 1999). Two other small countries which represent relative large total imports in tonnes are Denmark and Switzerland.
77
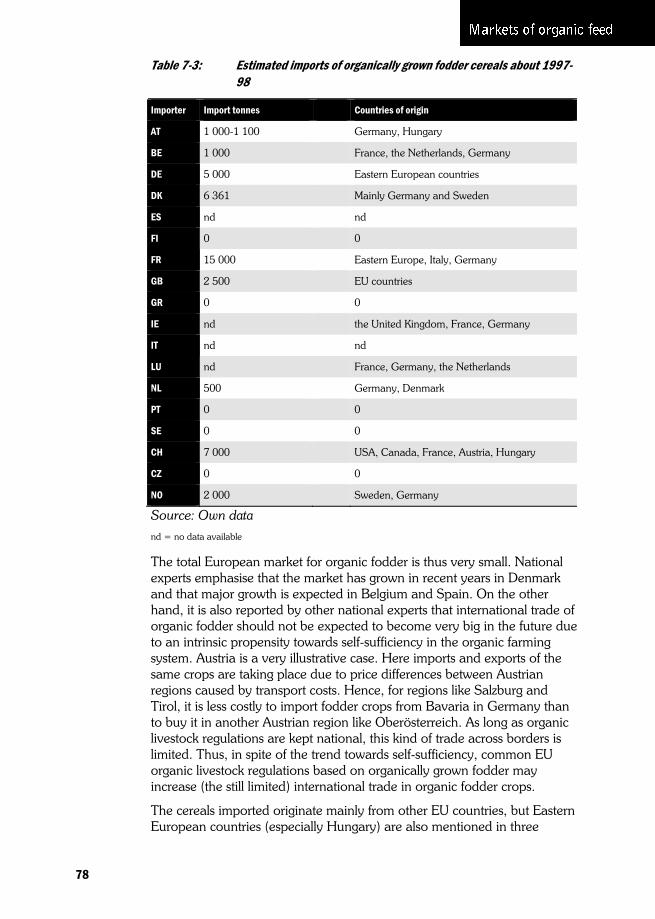
Table 7-3: Estimated imports of organically grown fodder cereals about 1997-98
Importer Import tonnes Countries of origin
AT 1 000-1 100 Germany, Hungary
BE 1 000 France, the Netherlands, Germany
DE 5 000 Eastern European countries
DK 6 361 Mainly Germany and Sweden
ES nd nd
FI 0 0
FR 15 000 Eastern Europe, Italy, Germany
GB 2 500 EU countries
GR 0 0
IE nd the United Kingdom, France, Germany
IT nd nd
LU nd France, Germany, the Netherlands
NL 500 Germany, Denmark
PT 0 0
SE 0 0
CH 7 000 USA, Canada, France, Austria, Hungary
CZ 0 0
NO 2 000 Sweden, Germany
Source: Own data
nd = no data available
The total European market for organic fodder is thus very small. National experts emphasise that the market has grown in recent years in Denmark and that major growth is expected in Belgium and Spain. On the other hand, it is also reported by other national experts that international trade of organic fodder should not be expected to become very big in the future due to an intrinsic propensity towards self-sufficiency in the organic farming system. Austria is a very illustrative case. Here imports and exports of the same crops are taking place due to price differences between Austrian regions caused by transport costs. Hence, for regions like Salzburg and Tirol, it is less costly to import fodder crops from Bavaria in Germany than to buy it in another Austrian region like Oberösterreich. As long as organic livestock regulations are kept national, this kind of trade across borders is limited. Thus, in spite of the trend towards self-sufficiency, common EU organic livestock regulations based on organically grown fodder may increase (the still limited) international trade in organic fodder crops.
The cereals imported originate mainly from other EU countries, but Eastern European countries (especially Hungary) are also mentioned in three
78

countries. Switzerland is the only country which imports feed grains from outside Europe.
The survey included information on exports, too. Here information was only received on about 12 000 tonnes of cereals, of which 10 000 tonnes were exported from Germany. These exports originate to a large extent from Eastern Germany and reflect general marketing difficulties for organic products in this part of the country. Hence production is much higher than domestic demand. A full record of collected information is annexed in tables c 3 to c 5.
Table 7-4: Import/export relations regarding fodder cereals about 1997-98
Import partners Export markets
importers’ response exporters’ response exporters’ response importers’ response
AT DE, others DE, NL DE
BE FR, NL, DE, 0 CH
DE others AT, NL AT, DK, NL, CH AT, BE, DK, FR, IE, LU, NL, NO
DK DE, SE DE 0 NL
ES nd nd
FI 0 FR
FR IT, DE, others FI 0 BE, IE, LU, CH
GB nd nd IE
GR 0 0
IE DE, FR, GB 0
IT nd nd FR
LU FR, NL, DE, nd
NL DE, DK DE AT, DE BE, LU
PT 0 Nd
SE 0 Nd DK, NO
CH AT, FR, others DE 0
CZ 0 0
NO SE, DE 0
Source: Own data
Note: It is assumed that all imports imply an export and vice versa. In the section on import partners the column ‘importers’ response’ repeat the indications from national experts while the ‘exporters’ response’ include information of countries of destination from exporting countries. The opposite holds for the section on export markets.
Others: imports from: Hungary, Eastern Europe, USA, Canada.
A simultaneous use of the information on exports and imports is used as the basis for expanding the information about international trade in table 7-4. The table combines information on countries of origin for imports and
79

countries of destination for exports. The table indicates, for instance, that Denmark imports fodder cereal from Germany and Sweden, while only German reports exports. Furthermore, Denmark reports no exports, whereas the Netherlands reports imports from Denmark.
From table 7-4 it appears that the trade among countries is much more interwoven than it seemed appeared from table 7-3. From a methodological point of view, a comparison of the two tables indicates a bias towards greater attention towards imports than exports among informants. This may to some extent be caused by differences in size of countries and organic sectors. What in one country appears a major trade and an important trading partner may only seem of marginal importance in another country.
7.3 Summary
This brief overview of national markets for organic fodder crops and the international trade of organic fodder crops indicates that markets are very small, even when compared to the small markets of organic food mentioned in earlier chapters. Consumer demand for animal products other than milk products is very limited – a fact which was discussed on several occasions in the chapters above. The small absolute size of the livestock feed markets seems to be the main explanation of the severe problems in obtaining data which made it impossible to reach any absolute account of the total production of or the total market for fodder crops. Furthermore, the proper functioning of organic fodder markets is disturbed by the absence of a common definition of organic livestock production with the same authority as the EC Reg. 2092/91 on plant production. Hence, national and other differences in the claims for use of organic fodder crops prevails. These differences – even though not documented here – may further contribute to explaining that functioning markets for fodder crops are only found in 7 to 8 countries. In the same countries, the only – and often modest – examples of commercial production of fodder crops are found. Hence, domestic supplies of fodder depend to a major extent on more or less accidental surplus production or direct exchange of fodder and fertiliser between farmers, emphasising plant and animal production respectively.
Imports are a supplementary source of fodder crops. The available information on feed grain indicates that this is of special importance in France, Denmark, and Switzerland. Countries with relatively small organic sectors, such as Norway and Ireland, import large shares of fodder relative to their own production, but quantities are small in absolute terms. Major German exports result from marketing difficulties, especially in the eastern part of Germany, where grain production up to now has been much higher than demand. The national fodder markets for pulses and oil-seeds/-cakes and imports/exports are still at a very low level in all countries, and the level of uncertainty of information about the national markets is very high.
80
8 The long-term development of organic food markets Chapters 2 to 7 include a review of the current situation in the markets for organic food and livestock feed in 18 European countries. The information covers the situation at the end of 1997 and the beginning of 1998. This situation is the result of a development over time, a long-term development that, in some countries, started in the 1930’s and in several countries gained momentum during the 1980’s, in some instances via access to national, public support. In still other countries, the development of organic food markets started recently after the passage of the EC Regulations 2092/91 on certification and 2078/92 on support. The objective of this chapter is to describe more long-term trends in the development of the organic food markets in the 18 countries with the aim of reaching tentative conclusions that can serve as a basis for considering perspectives for future development – the subject of chapter 9. The focus is on food markets only, as they appeared far more important than fodder markets in the analysis.
The basis for describing the long-term development of organic food markets in the 18 countries is evaluations obtained from the international survey. These evaluations rest to a large extent but not exclusively on the subjective views of national experts and informants from each country and are based on the knowledge available to them. National experts were encouraged to present some evaluation of the long-term development even in situations where uncertainty was very high. It is therefore inevitable that the evaluations presented rest on quite different bases, and this should be taken into consideration when reading the following analyses.
Five aspects with influence on long-term market development are discussed here. The first one is the emergence of professional and market oriented efforts to advance organic food, and combines information from previous chapters with information on the long-term development in marketing efforts. The second aspect concerns policy influence over time, as EU and national regulations have been important sources external to the market but influencing conditions for furthering of organic farming in general and the development of the organic food market specifically. The third aspect concerns the actors who took part in the long-term development of organic markets up until now, the period(s) in which they contributed and the level of their contribution. Together these three aspects represent different types of conscious attempts to develop the organic food market, and are aspects which by experience have exerted an important influence on market development. However, the three aspects need neither be sufficient nor decisive preconditions for growth of organic food markets – or at least the three aspects mentioned may neither be the only nor the main forces behind any market development found. In fact ‘the invisible hand’ is the classic metaphor for market economy, and it indicates that market development results from an interplay of numerous individual efforts, each of which is unable to dominate the market. Therefore, the fourth section of this chapter includes a general discussion on driving forces behind the
81
expansion of national markets, and the chapter is concluded by considerations as to which factors appear to be the main bottlenecks hampering organic food market expansion.
8.1 Professional marketing of organic food
The aspects of marketing organic food mentioned in chapters 3 to 6 above all serve the main purpose of furthering the position of organic products in the food market. The organic sector itself has an obvious interest in advancing their products and this activity can be highlighted by recalling part of the reasoning in previous chapters. Promotion of organic food was the topic of chapter 5. It was concluded that systematic promotion through the professional media in recent years have been few and small scale – and absent in five countries – with private firms more active than organic agriculture associations and farmers.
In chapter 3, major differences between countries in the composition of sales channels appeared. Originally, a rather clear separation of organic food from the mass food market appeared due to organic food being kept out of supermarkets. Today, the sales channels for organic food in all countries is composed of a mix of retail outlets including supermarkets. In most countries, direct sales from farmer to consumer is of some importance together with sales through specialised shops. However, in Scandinavia, Austria and UK supermarkets are clearly the dominant sales channel.
The three types of sales channels mentioned pose different challenges in terms of marketing efforts. In direct sales and sales through specialised shops, the main issue is to guarantee the origin of products and to recommend products actively to consumers. When supermarkets are included in the sales channels, a decisive change of needs for promotion and other marketing efforts occur. On the one hand supermarkets represent an option for communicating with a much larger audience and many other consumer segments than those attracted by direct sales and specialised shops. Supermarkets represent large scale and broad range. On the other hand, supermarkets represent a challenge as organic food is competing directly with non-organic products. Usually this means that organic food is only allowed a small share of the sales area – more or less corresponding to the share it represents of total sales in the outlet in question. Both aspects, the opportunity for reaching new and larger consumer segments and the direct competition for consumer attention, imply other and more professionalised demands on marketing of organic food than just presenting products and define them by means of a label. Active relations between producer/sellers and consumers are replaced by passive relations in which the products must ‘speak for themselves’ and need strong back up in terms of advertising, sales promotion, and product innovation to obtain and maintain consumer attention.
The development of supermarket sales thus implies systematically larger and other types of marketing efforts than direct sales to consumers and sales through specialised shops. Hence, any attempt to expand the organic share
82

of the food market must consider the use of resources for marketing efforts. In all kinds of sales channels, some kind of professionalisation of marketing efforts is expected to be developed over time. Professional marketing of small quantities of food – whether directed towards sales through supermarkets or other sales channels – must imply that the scarce resources are targeted at reaching well-defined and selected consumer segments and that distinct themes are emphasised in order to obtain the largest possible effect on demand. This can be achieved by combining deliberate considerations of the type and level of promotion with at least one of the three other Ps in the marketing mix mentioned in chapter 1 (place, product and price). In table 8-1 it is reported for each country when this kind of professional marketing activities began in specialised organic food shops and supermarkets respectively.
It appears from the table that in five countries, Finland, Ireland, Luxembourg, Greece and the Czech Republic, no professional marketing efforts were found at all. This is consistent with the findings in table 5-2 above. In all other countries, professional promotion has taken place through supermarkets, with Sweden and Denmark – both with large organic sectors – as the earliest countries, starting in 1986 and 1989 respectively. In Norway and Italy, professional marketing through supermarkets started latest – in 1996 – and in Belgium, Spain and France it began only one year before. Except for Italy these countries all have minor organic sectors.
It further appears from the table that professional marketing in supermarkets has not consistently developed on the basis of professional marketing experience obtained in specialised organic food shops. This holds for Sweden and Denmark, which are still characterised by the absence of professional marketing efforts directed at specialised organic food shops. In both of these countries supermarkets are the dominant sales channel. A similar lack of marketing efforts directed at specialised shops is found in two other countries where supermarkets are the predominant sales channel for organic food, Austria and UK (see chapter 3). It seems likely that marketing efforts in these countries are systematically more intensive and responsive to supermarket demands than in countries where professional efforts directed at sales through specialised shops have also been developed.
In all countries where supermarkets are less important as a sales channel, the professionalised marketing efforts for organic food started earlier in specialised shops than in supermarkets. In the table, two subgroups emerge among these countries. In Belgium, Germany, Spain, Italy and Portugal – except Germany all countries with small markets – professional marketing started in specialised organic shops three to five years before it began in supermarkets. In France, the Czech Republic and Norway – countries with small organic food markets too – the reported start of professional promotion through specialised shops dates back to the 1970s. The difference between these two groups seems artificial, due to different understandings of the meaning of professional marketing. It is likely that, in the latter group, the starting year of professional marketing efforts is equalised with the year when products first became available in specialised organic food shops. In the other countries, it seems likely that the years
83
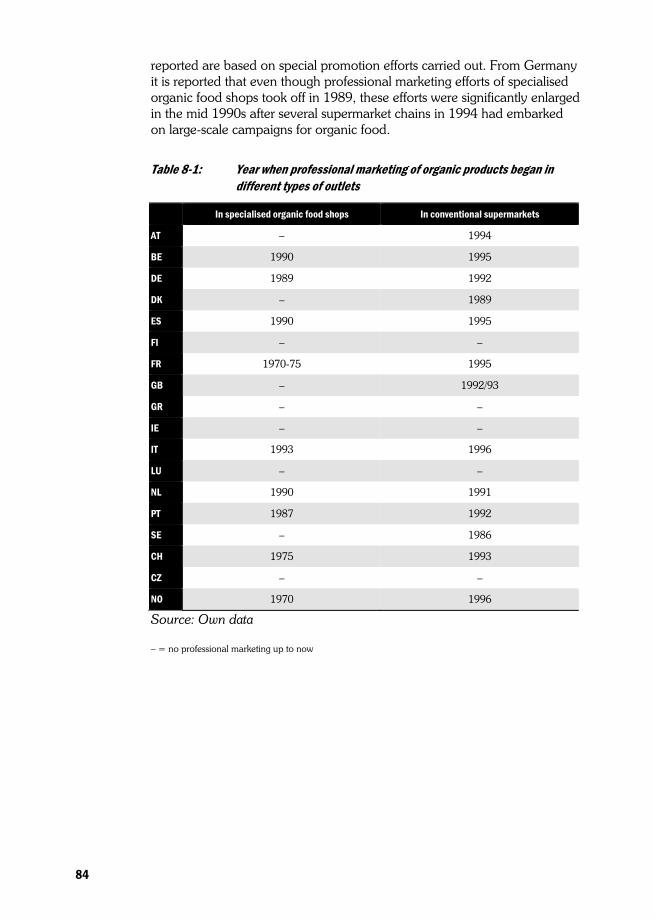
reported are based on special promotion efforts carried out. From Germany it is reported that even though professional marketing efforts of specialised organic food shops took off in 1989, these efforts were significantly enlarged in the mid 1990s after several supermarket chains in 1994 had embarked on large-scale campaigns for organic food.
Table 8-1: Year when professional marketing of organic products began in different types of outlets
In specialised organic food shops In conventional supermarkets
AT – 1994
BE 1990 1995
DE 1989 1992
DK – 1989
ES 1990 1995
FI – –
FR 1970-75 1995
GB – 1992/93
GR – –
IE – –
IT 1993 1996
LU – –
NL 1990 1991
PT 1987 1992
SE – 1986
CH 1975 1993
CZ – –
NO 1970 1996
Source: Own data
– = no professional marketing up to now
84

From a developmental point of view, it seems that mass markets have been reached with success in a few countries where the promotion efforts have focused on supermarkets. With the exception of UK, large organic market shares have been obtained in these countries. Hence long-term professional promotion directed at supermarkets seems to be an important prerequisite for expanding the organic food market, while promotion directed at specialised organic food shops seems to have less effect, not least because the market potential in these shops is much smaller. This is in accordance with the conclusion of chapter 6 on prices.
8.2 Impact of EU and national regulations on supply and demand of organic food
In all the countries under study here, the food markets are strongly influenced by EU Common Agriculture Policy (CAP). In EU member states the CAP has a direct impact on national agriculture production, and in non-member states the CAP influence is indirect via its decisive effect on European food production and trade in general. In a fundamental way the CAP thus shapes the functioning of the national food markets all over Europe, and thereby the organic food markets as well. Furthermore, national organic food markets are also affected by general national regulations on food production and consumption. Finally, the organic food markets are influenced by national and international regulations on organic farming (see Lampkin et al. 1999 for an overview of policies influencing organic farming). All policies may affect both supply and demand. Even though the main effect of subsidies paid to farmers as part of agriculture policies is on the composition of agriculture production and thereby supply, demand will clearly be affected through prices. EC Reg. 2092/91 on certification of organic food production is an example of a regulation that aims at facilitating demand by guaranteeing the origin of products for consumers but has a direct impact on supply as well, because it dictates how production shall take place. Strong regulations may hamper expansion of supply, while light regulations may facilitate it.
The influence of regulation on market development is measured qualitatively based on the judgements of national experts. It thus rather reflects the perceived influence from regulations rather than being an accurate measure of the impact of regulations. A more systematic evaluation of regulation impacts will appear in Michelsen et al. (forthcoming).
In this section the focus is on the influence of EU regulation on the long term development of organic farming. Emphasis is on the two regulations directed at organic farming: EC Reg. 2092/91 on certification of organic products and EC Reg. 2078/92 on support for organic farming as a kind of environmentally friendly agriculture (see Lampkin et al. 1999 for details on national implementation).
As EC Reg. 2078/92 includes the policy measures accompanying the larger reform of the CAP of 1992, information was also collected regarding the influence of the general CAP reform on supply and demand of organic
85
food. The results are reported in annex c, table c 50 and can be summarised as follows. As the general CAP reform includes many diverse objectives it is no wonder that in most countries no specific effect is detected on the organic food market. In Germany, Italy and Sweden the general CAP reform had a slightly positive impact on the supply of organic food (+1 or +2 on a scale from -5 to +5). From Britain is the only negative impact reported (-2). The reason given for this is that organic farmers were disadvantaged by the reform by not receiving subsidies for continuing organic practices after conversion. This type of support would be able to counter the disadvantage faced by organic farmers in the CAP area support due to organic crop rotation involving fewer areas eligible for subsidies.
8.2.1 Influence of EC Reg. 2092/91 (certification)
In table 8-2, the perceived impact of EC Reg. 2092/91 on market development is shown. The regulation was implemented all over EU in 1993. The impacts mentioned are mainly positive and cover both supply and demand. Overall the influence of EC Reg. 2092/91 seems a little higher in 1996 and 1997 than in earlier years, mainly due to still more reported impacts other than zero. Yet still, when measured in totals, the influence on supply is consistently higher than on demand, but the difference is narrowing as scores increase for demand and decrease for supply. This indicates a general developmental process starting with a major impact from EU certification on producers adapting to the regulations, while influence on consumer demand began to increase as still more certified products became available. Hence the full impact of EC Reg. 2092/91 on consumer demand is still to be seen, while the impact on supply may decrease as a common organic certification becomes an integral part of the agriculture regulatory system. Furthermore, the impacts of EU certification on demand are underestimated because the common certification functions through national labels, which often include national regulations supplementary to the EU rules.
Among the countries, Spain reports the highest impact in any year. This was in 1995 and covered supply. In conformity with the general tendency, the impact on supply decreases in the following years, while impact on demand increases. In Greece, influence on supply is also very high but remains constant. This seems to reflect that organic farming here is still a new phenomenon. In Italy, variation in impacts does not correspond to the overall pattern. This is due to local circumstances, as EC Reg. 2092/91 was implemented very quickly in 1992 but was ruled out by the constitutional court in 1993 and then re-implemented in 1996.
86

Table 8-2: Impact on organic food market from EC Reg. 2092/91 (certification). 1993-97
1993 1994 1995 1996 1997
Supply Demand Supply Demand Supply Demand Supply Demand Supply Demand
AT na na na na 0 0 0 0 0 0
BE +3 +2 +3 +2 +3 +2 +3 +3 +3 +3
DE1 0 +2 0 +2 0 +2 0 +2 0 +2
DK 0 0 +1 +1 0 +1 0 +1 0 +1
ES nd nd +4 0 +5 +2 +4 +3 +3 +3
FI na na na na +2 +1 +2 +1 +2 +1
FR1 +1 +1 +1 +1 +1 +1 +1 +1 +1 +1
GB +2 +1 +2 +1 +2 +1 +2 +1 +2 +1
GR +3 +1 +4 +1 +4 +2 +4 +2 +4 +3
IE nd nd nd nd nd nd nd nd nd nd
IT2 +3 +3 +1 +1 +1 0 +4 +1 +2 0
LU 0 0 0 0 0 0 0 0 0 0
NL3 +2 0 +1 0 0 0 +1 0 +2 +1
PT nd nd nd Nd nd nd nd nd 0 0
SE Na na na Na -3 -3 -3 -3 -3 -3
Source: Own data
Note: Scores may vary from -5 to +5 with -5 signifying very strong negative influence and +5 very strong positive influence.
1 Small influence from EC Reg. 2092/91 reported back to 1991. 2 IT reports strong influence in 1991 and 1992; 3 NL reports strong influence in 1991 and 1992. nd = no data available na = not applicable
From Sweden, the only report on negative impact from EC Reg. 2092/91 is found and it remained constant ever since Sweden joined the EU in 1995. The reason given is that the EU regulation is seen as too detailed and thereby undermining a well-functioning national certification system. The arguments mentioned are that the detailed regulation will stop or delay the marketing of new products and hence hamper market development, leaving the organic food market a very small niche.
In most other countries, the evaluation of the effects of EC Reg. 2092/91 varies between zero and limited positive. In Germany, the effect is consistently on demand only but seems rather important, since it improved demand for certified organic products by forcing so-called pseudo-organic products, which did not comply with any organic certification scheme, to leave the market. The lack of influence on supply is due to supply being pushed forward by support for farmers based on EU extensification programme between 1989 and 1992. From Denmark, a combined effect is
87
reported. On the one hand, EU certification had a positive effect on demand because a much larger product range became available via imports and it was easier to counter supply shortages. On the other hand, demand was influenced negatively, as the emergence of products from other EU countries without the well-known national Danish label provoked consumers’ suspicion as to whether these products should be considered pseudo-organic.
It seems no coincidence that all countries that report high impact from EC Reg. 2092/91 are countries with small organic sectors in the beginning of the 1990s according to Foster and Lampkin (1999). In countries with a late development of organic food production, the EU regulation may thus be seen as the trigger. However, the regulation did not have this effect in all countries immediately. Certification, whether governed nationally or by the EU, is therefore a necessary but not sufficient precondition for developing organic food markets. More specifically, the EU certification scheme has helped ruling out pseudo products (Germany) or amplifying the effect of national certification schemes (Italy and the Netherlands). In these countries immediate effects can be seen. The only noticeable exception from this pattern is Sweden, where the EU certification is seen as a threat against the market developing effects of a well functioning national system.
88
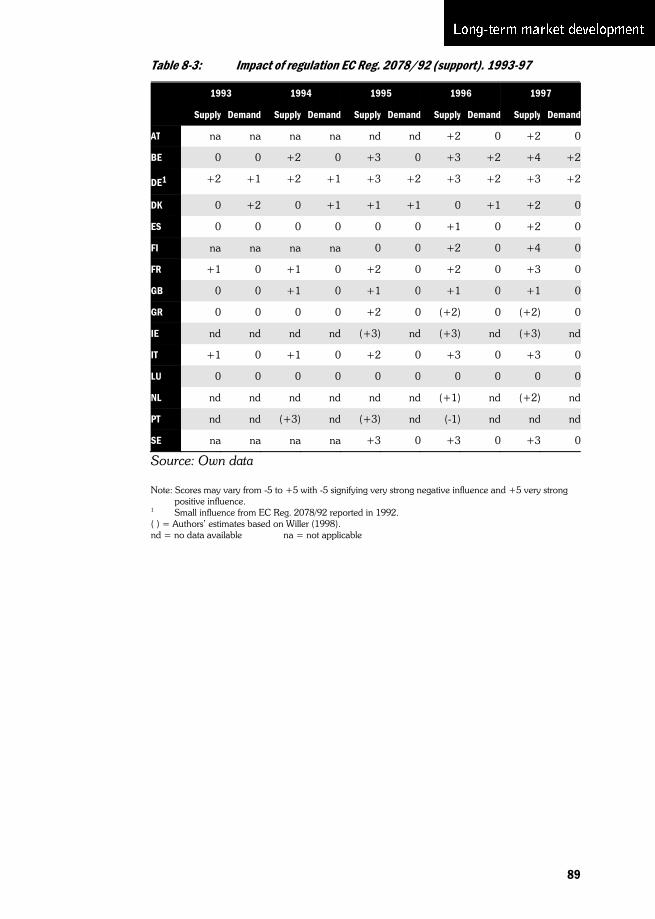
Table 8-3: Impact of regulation EC Reg. 2078/92 (support). 1993-97
1993 1994 1995 1996 1997
Supply Demand Supply Demand Supply Demand Supply Demand Supply Demand
AT na na na na nd nd +2 0 +2 0
BE 0 0 +2 0 +3 0 +3 +2 +4 +2
DE1 +2 +1 +2 +1 +3 +2 +3 +2 +3 +2
DK 0 +2 0 +1 +1 +1 0 +1 +2 0
ES 0 0 0 0 0 0 +1 0 +2 0
FI na na na na 0 0 +2 0 +4 0
FR +1 0 +1 0 +2 0 +2 0 +3 0
GB 0 0 +1 0 +1 0 +1 0 +1 0
GR 0 0 0 0 +2 0 (+2) 0 (+2) 0
IE nd nd nd nd (+3) nd (+3) nd (+3) nd
IT +1 0 +1 0 +2 0 +3 0 +3 0
LU 0 0 0 0 0 0 0 0 0 0
NL nd nd nd nd nd nd (+1) nd (+2) nd
PT nd nd (+3) nd (+3) nd (-1) nd nd nd
SE na na na na +3 0 +3 0 +3 0
Source: Own data
Note: Scores may vary from -5 to +5 with -5 signifying very strong negative influence and +5 very strong positive influence.
1 Small influence from EC Reg. 2078/92 reported in 1992. ( ) = Authors’ estimates based on Willer (1998). nd = no data available na = not applicable
89
8.2.2 Influence of EC Reg. 2078/92 (support for environmentally friendly farming)
In table 8-3, the perceived influence of EC Reg. 2078/92 is illustrated. The most important instrument of the regulation is subsidies paid to farmers, but limited support is available for information and marketing activities as well. Its influence on market development is limited and found mainly in supplies. Impacts on demand are only reported from Belgium, Germany and Denmark, with the two latter emphasising that the effects on demand are indirect. The indirect effects stem from increases in supply, which made it possible to satisfy uncovered demand and to have farmers contribute to lower consumer prices via the introduction of support for continuing organic farming after conversion.
The level of influence is in general perceived positive but quite low. As illustrated in table 8-4 below, one important reason for this is that EC Reg. 2078/92, in some countries, replaced other support schemes introduced earlier. In these countries, the autonomous effect of EC Reg. 2078/92 was only to continue the effects of the earlier support, while in other countries it also includes the initial effect of introducing a new support scheme. In table 8-3, the highest scores are found in 1997 in Belgium and Finland, which have a small and large organic sector respectively. Hence, a systematic correlation between sector size and importance of EC Reg. 2078192 cannot be confirmed.
In total, the reported influence is increasing over time. The main source of this is the subsequent implementation of the regulation by still more countries. Increasing influence on market development is, however, found in Germany, Finland, Italy, Belgium and, France – among which the three former have large organic sectors while the others have small ones. In Germany, the increasing influence after 1994 is explained specifically by the introduction of support for maintaining organic farming via EC Reg. 2078/92. Between 1989 and 1992 many farms had converted to organic farming on the basis of support from the former extensification programme (EC Reg. 4115/88), which offered support for 5 years only. Had support for maintaining organic farming not been introduced in Germany under the EC Reg. 2078/92 in 1994, Hamm et al. (1996) estimate that many of these organic farms would have been reconverted to non-organic farming for financial reasons. Portugal is the only example of a development from positive to negative impacts caused by national problems of both financing and administrating support (Firmino 1998). In other countries, the effect of the EC Reg. 2078/92 is perceived to be quite constant after its introduction. Minor shifts in Denmark are caused by changes in the national implementation scheme.
In sum, it appears from table 8-3 that EC Reg. 2078/92 is perceived to have limited, but increasing influence over time. The influence is perceived increasing in some countries only, while in most countries the influence seems stable a few years after introduction.
90

8.2.3 Summing up influence of regulations on market development
Table 8-4 shows the perceived influence from regulations other than those mentioned above, whether originating in the national or the EU context. From Austria, Denmark, Spain, Finland and France, reports were given on regulations originating in the national context, while from Germany the national regulation was derived from the EU extensification programme (EC Reg. 4115/88). The most important influence is perceived on supply with weaker and derived effects on demand. Several other types of supportive regulations are or have been available for organic farming, such as structural aids and regional development programmes, as well as market development funding (Lampkin et al. 1999). However, the impression from table 8-4 is that these are not perceived to have been very influential, neither on supply nor demand for organic food. In the context of market development it is worth emphasising the specific Danish experience. National support for organic farming was introduced in 1987. It was based on a market oriented perspective. The support was justified by a realised consumer demand for organic products which had not been fulfilled by farmers because of the costs involved during the two year conversion period. Consequently, public conversion support was paid to farmers during the conversion period. After conversion, farmers had to rely completely on their ability to obtain premium prices from consumers. To help in this direction public support was paid to develop markets, research and development etc. This approach is preserved even after the national implementation of EC Reg. 2078/92 and it may be seen as an important vehicle for obtaining large market shares in Denmark in spite of a comparatively small organic sector.
The table supports the view, that after the above mentioned EU regulations were introduced in the national contexts, they have been the main sources of regulatory influence on the development of organic food markets. Outside the EU only Switzerland reported of national regulation with effects on market development – and the effect is concentrated on supply and not very strong. In Norway support for organic farming is so strongly integrated into national agriculture policy, that initiatives with special effects on supply or demand cannot be distinguished.
Overall, it appears that the perceived influence of different types of regulation on organic market development is positive but with varying levels. EC Reg. 2092/91 on certification seems to have had the strongest impact on market development and, at the same time, this impact has changed the most in the course of time. Certification impacts cover both supply and demand sides of the markets with a decreasing influence on supply and an increasing influence on demand. This indicates that the immediate effects of certification are on producers, who shape production according to the common rules. Later, the main effect is on consumers, who gradually learn to know the certification as still more products become available. Certification has helped to define the organic products and rule out pseudo-organic products. On the other hand, in a few countries there seem to be problems when national labels which include demands additional to the EU regulation collide with products labelled in countries
91
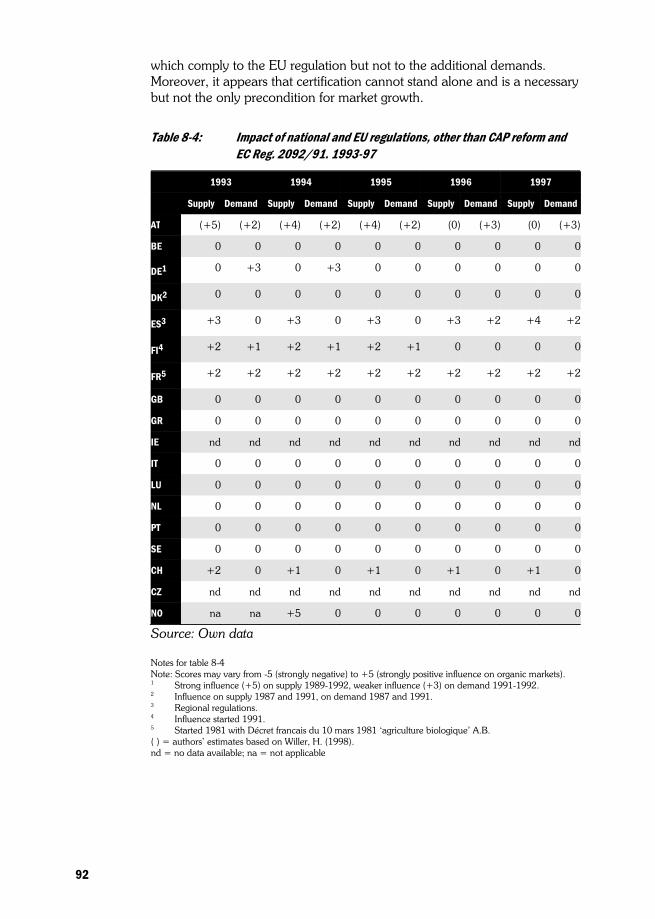
which comply to the EU regulation but not to the additional demands. Moreover, it appears that certification cannot stand alone and is a necessary but not the only precondition for market growth.
Table 8-4: Impact of national and EU regulations, other than CAP reform and EC Reg. 2092/91. 1993-97
1993 1994 1995 1996 1997
Supply Demand Supply Demand Supply Demand Supply Demand Supply Demand
AT (+5) (+2) (+4) (+2) (+4) (+2) (0) (+3) (0) (+3)
BE 0 0 0 0 0 0 0 0 0 0
DE1 0 +3 0 +3 0 0 0 0 0 0
DK2 0 0 0 0 0 0 0 0 0 0
ES3 +3 0 +3 0 +3 0 +3 +2 +4 +2
FI4 +2 +1 +2 +1 +2 +1 0 0 0 0
FR5 +2 +2 +2 +2 +2 +2 +2 +2 +2 +2
GB 0 0 0 0 0 0 0 0 0 0
GR 0 0 0 0 0 0 0 0 0 0
IE nd nd nd nd nd nd nd nd nd nd
IT 0 0 0 0 0 0 0 0 0 0
LU 0 0 0 0 0 0 0 0 0 0
NL 0 0 0 0 0 0 0 0 0 0
PT 0 0 0 0 0 0 0 0 0 0
SE 0 0 0 0 0 0 0 0 0 0
CH +2 0 +1 0 +1 0 +1 0 +1 0
CZ nd nd nd nd nd nd nd nd nd nd
NO na na +5 0 0 0 0 0 0 0
Source: Own data
Notes for table 8-4 Note: Scores may vary from -5 (strongly negative) to +5 (strongly positive influence on organic markets). 1 Strong influence (+5) on supply 1989-1992, weaker influence (+3) on demand 1991-1992. 2 Influence on supply 1987 and 1991, on demand 1987 and 1991. 3 Regional regulations. 4 Influence started 1991. 5 Started 1981 with Décret francais du 10 mars 1981 ‘agriculture biologique’ A.B. ( ) = authors’ estimates based on Willer, H. (1998). nd = no data available; na = not applicable
92

93
Other policy instruments are available in the EU CAP Reform. The main reform, which includes many different types of support for farmers in general was considered to have nearly no impact on the development of organic food markets. However, the measures accompanying the reform and included in EC Reg. 2078/92 were perceived to have widespread effects, mainly on supply. The overall impact of EC Reg. 2078/92 was perceived to increase over time, because of increasing national implementation. Finally, only few effects of other and very diverse regulations are reported, mainly national schemes employed before the above-mentioned EU regulations. Hence, at the beginning of the 1990s, national regulations in a few countries initiated market development while at the end of the decade the main regulatory effects on the organic food markets stem from EU regulations on certification and subsidising organic farmers.
8.3 Actors supporting the development of the organic food market
Marketing and regulation are two different ways to influence the development of organic food markets. However, not least important in relation to organic farming is the organisational aspect: who is actually performing the functions needed to develop promotion and regulation and to carry them out? As an emerging new sector competing with a large, existing sector, it is relevant to make a distinction between actors within the organic farming sector and outside actors. Most organisations within the organic sector must be expected to work in favour of developing organic markets, but their potentials and functions are different and hence their individual influence on the actual market development. Most organisations outside the organic sector should at the outset be expected to be more or less sceptical towards organic farming, but at the same time some of them represent potential partners for actors within organic farming in their attempts to expand markets. The aim in this section is to give an overview of which actors participated in the long term development described in the above sections.
On the basis of the international survey, table 8-5 describes influences from actors internal to the organic sector. Most of the actors listed are described in chapter 5 above. They include organic agriculture movements which are differentiated from organic farmers’ associations by including many groups interested in organic agriculture other than farmers. A new category is ‘farmers’ supply’ which signifies any initiatives to expand markets taken by organic farmers and organised outside the other types of organic

Table 8-5: Influence on development of organic food markets of actors within the organic farming sector
Organic movements Organic farmers Certification bodies Farmers’ supply Others
Supply Demand Supply Demand Supply Demand Supply Demand Supply Demand
AT 0 0 +3 - +4 +2 - +3 0 +1 +1 - +2 +1 - +2 0 0
BE 0 0 0 0 0 0 +2 0 +1 +2
DE +2 -2 +2 +2 0 0 +1 +2 0 0
DK 0 0 +1 - +2 +1 - +3 0 0 +2 - +4 0 0 0
ES 0 0 +4 +3 +4 +3 0 0 0 0
FI +4 +3 +1 0 +1 +1 +2 +1 +2 0
FR +1 0 +1 0 0 0 +2 +2 0 0
GB 0 +3 +1 0 0 0 +2 +2 +2 +2
GR +2 +3 +3 +1 +3 +2 +4 +1 0 0
IE nd nd nd nd nd nd nd nd nd nd
IT 0 +1 +5 +2 +5 0 +5 +3 +2 +5
LU +2 +2 +4 +2 0 0 0 0 0 0
NL +3 0 +3 +1 +5 +1 0 0 0 0
PT nd nd nd nd nd nd nd nd nd nd
SE +4 +3 +1 - +3 0 - +2 +2 - +3 +2 - +5 +3 - +5 +1 - +5 0 0
CH +2 - +3 0 +1 - +4 0 0 0 0 0 +1 - +3 0
CZ nd nd nd nd nd nd nd nd nd nd
NO +3 +2 +3 +2 +3 +2 0 0 +3 - +4 +1 - +2
Source: Own data (Notes, see opposite page)
94
96
agriculture organisations mentioned. The response from national experts included information on the periods in which each type of actor exerted influence on the market development. This information is omitted in the tables but included in the comments to them.
The table states that the types of actors internal to the organic farming sector contribute very differently to market development. Furthermore, the influence of all actors is perceived larger in supply than in demand. Organic farmers’ associations are the type of actor which most frequently (in 14 countries) is perceived to influence organic food markets and with the highest degree of influence. Among the countries reporting the highest influence, Italy, Spain and Switzerland mention long periods of influence from the 1980s to the present. In Austria and Luxembourg, only short periods in the late 1980s and early 1990s are mentioned. In most remaining countries, the influence mentioned includes long periods starting in the 1980s. Closely related to organic farmers’ associations are producer organisations and less organised initiatives listed under the heading of ‘farmers’ supply’. They are mentioned in ten countries and ascribed high importance for supplies in Italy, Sweden, Denmark and Greece for longer periods up until today. Among these the three first countries have large organic sectors. This is in accordance with Hamm and Michelsen (1996) who emphasise them as relevant instruments for farmers to adapt to mass markets. The impact on demand is – rather as a matter of fact – perceived to be limited.
Organic movements are not given a clear impact on market development. They are perceived to influence the organic food market in 11 countries, especially in two Scandinavian countries, Finland and Sweden, in both instances dating back to the mid-1980s. There is no agreement across countries on the effect of organic movements on supply and demand. In Finland and Sweden, the influence is almost equally positive on supply and demand. In the United Kingdom, the organic movement (e.g. the Soil Association) is perceived to have less influence on supply but more on demand – dating back to the mid 1980s too. In Germany the organic movements have exerted influence over a longer period, 1987-94, but the influence is contradictory as it is positive on supply and negative on demand. The negative impact on demand is explained by the inability of movements to enlarge demand or build effective channels to the market parallel to increasing supplies effectively.
Notes for table 8-5 Note: Scores may vary from -5 (strongly negative) to +5 (strongly positive) influence on organic markets. A
range is mentioned, when an entry concern a period with changing influence. Two values are mentioned when an entry concern more periods with different levels of influence. Organic movements include all groups interested in organic farming. ‘Organic farmers’ is an abbreviation for organic farmers’ associations, which only include farmers. ’Farmers’ supply include all other initiatives by farmers (for instance producer organisations relating to distinct firms). Others include for instance farmers’ advisory services and marketing organisations.
nd = no data available
95
96
Certification bodies are mentioned by experts in seven countries. Very high influence on supply is asserted in the Netherlands for a short period in 1991-92 and in Italy and Spain for the whole of the 1990s. In Sweden the influence on demand is perceived to reach the highest value in 1985. The general emphasis on supply is in accordance with the development described above on certification regulations – first they attract supply and then consumers get to know the products. However, in some responses it is emphasised that certifying organisations should remain neutral and neither could nor should influence supply or demand. Taken together with the very different evaluations of their influence in table 8-5, this indicates quite diverging views on the position of certification in attempts to influence markets. One view is that certification should play an active part with capacities for driving organic food markets forward. Another view is that certification should stay a neutral organisation without any driving force. Finally, among other important actors are mentioned organic advisory and extension systems, which mainly influence supply and are of special importance in Norway extension rings.
Table 8-6 includes an overview of the perceptions of the influence on organic food market development from actors external to organic agriculture. A broad range of organisations are included from commercial firms to farmers’ unions, grass roots organisations and public authorities. Anonymous consumer demand is also mentioned. Seen as a whole, the influence is strongly varying from commercial firms mainly influencing demand in many countries to agriculture authorities who mainly influence supply in a few countries and non-organic farmers’ unions who are perceived to contribute negatively to both supply and demand.
Commercial firms are mentioned by experts in 13 countries as exerting strongly positive influence on demand in periods during the 1990s. The influence is perceived to reach the two highest levels in several countries, among which are those with the largest organic sectors: Austria, Switzerland, Sweden, Germany and Denmark. In the United Kingdom as well, the highest level of perceived influence is mentioned. At the negative end of the scale is found Spain, where the market development of organic products through the 1990s has been hampered by difficulties in differentiating them from other (dietary) products. Taking information in chapters 3 and 5 into consideration, it seems that the broad term ‘commercial firms’ in these countries includes supermarket chains among other actors. In many instances it is also mentioned that commercial firms have influenced supply substantially, but it is only in France and Sweden
Notes for table 8-6 Note: Scores may vary from -5 (strongly negative) to +5 (strongly positive) influence on organic food
markets. 1 Confusion with dietary and natural products. (Commercial firms: Demand) nd = no data available
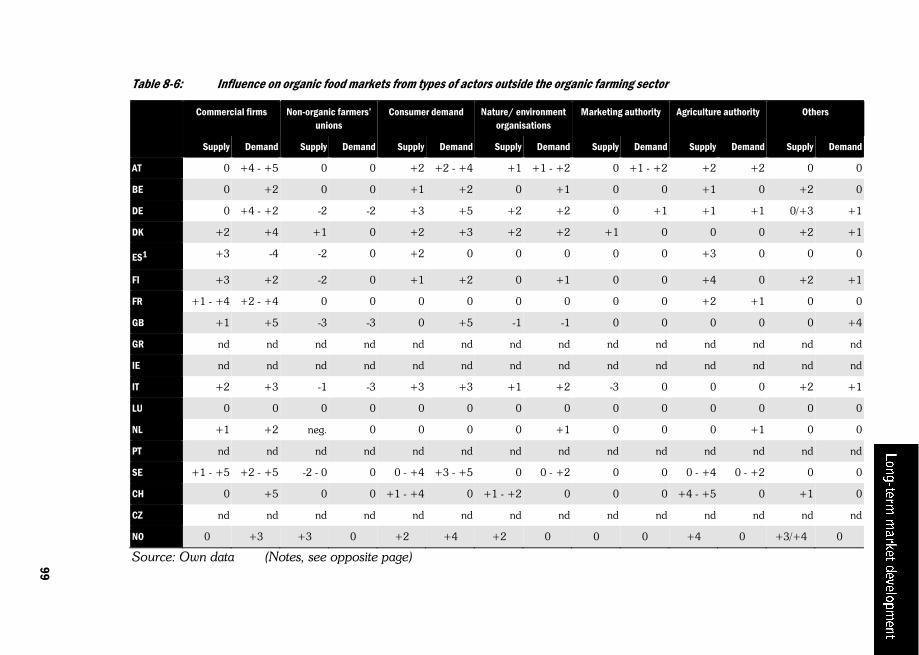
Table 8-6: Influence on organic food markets from types of actors outside the organic farming sector
Commercial firms Non-organic farmers’ unions
Consumer demand Nature/ environment organisations
Marketing authority Agriculture authority Others
Supply Demand Supply Demand Supply Demand Supply Demand Supply Demand Supply Demand Supply Demand
AT 0 +4 - +5 0 0 +2 +2 - +4 +1 +1 - +2 0 +1 - +2 +2 +2 0 0
BE 0 +2 0 0 +1 +2 0 +1 0 0 +1 0 +2 0
DE 0 +4 - +2 -2 -2 +3 +5 +2 +2 0 +1 +1 +1 0/+3 +1
DK +2 +4 +1 0 +2 +3 +2 +2 +1 0 0 0 +2 +1
ES1 +3 -4 -2 0 +2 0 0 0 0 0 +3 0 0 0
FI +3 +2 -2 0 +1 +2 0 +1 0 0 +4 0 +2 +1
FR +1 - +4 +2 - +4 0 0 0 0 0 0 0 0 +2 +1 0 0
GB +1 +5 -3 -3 0 +5 -1 -1 0 0 0 0 0 +4
GR nd nd nd nd nd nd nd nd nd nd nd nd nd nd
IE nd nd nd nd nd nd nd nd nd nd nd nd nd nd
IT +2 +3 -1 -3 +3 +3 +1 +2 -3 0 0 0 +2 +1
LU 0 0 0 0 0 0 0 0 0 0 0 0 0 0
NL +1 +2 neg. 0 0 0 0 +1 0 0 0 +1 0 0
PT nd nd nd nd nd nd nd nd nd nd nd nd nd nd
SE +1 - +5 +2 - +5 -2 - 0 0 0 - +4 +3 - +5 0 0 - +2 0 0 0 - +4 0 - +2 0 0
CH 0 +5 0 0 +1 - +4 0 +1 - +2 0 0 0 +4 - +5 0 +1 0
CZ nd nd nd nd nd nd nd nd nd nd nd nd nd nd
NO 0 +3 +3 0 +2 +4 +2 0 0 0 +4 0 +3/+4 0
Source: Own data (Notes, see opposite page)
97
99
this goes hand in hand with strong firm influence on demand. The firms’ emphasis on influencing demand is in line with the argument of Hamm and Michelsen (1996) that organic farmers’ associations and producer organisations are necessary brokers on the supply side to facilitate contacts between organic farmers and supermarkets.
The unspecified consumer demand is another important ‘actor’ mentioned in 11 countries. It is ascribed special importance in Germany and Sweden (long periods since the 1980s) and the United Kingdom (short period in the 1980s), all countries with old organic farming sectors and traditions for consumption of organic food – but with the United Kingdom placed very differently in terms of the size of the organic sector (see table 2-8 above). In Austria, the ‘consumer demand’ was influential on market demand for a short period only, and in Norway it is also mentioned as one among three very influential actors. Consumer demand has some impact on supply as well, especially in Switzerland and Sweden from 1980 and onwards. Among actors with positive influence on organic food market development, it is also worth noting that agriculture authorities are mentioned in nine country reports, mainly influencing supply. However, their perceived potential for influencing market development seems to be hampered by EU membership as it is judged especially important in Scandinavian countries who joined the EU recently (Sweden and Finland) and in countries outside the EU (Norway and Switzerland). A possible explanation is that public market support in other countries had to be designed in accordance with EU regulations.
The strongest negative impacts on organic markets are perceived to originate in non-organic farmers’ unions. Any impacts are mentioned from nine countries mainly on supplies. Only in two Scandinavian countries is the influence judged positive. Especially in the United Kingdom the negative impacts on supplies is emphasised – along with a similar effect on demand. Negative impacts are also found in Germany, Spain and Finland.
The actors most strongly influencing the recent development in organic food markets are organic farmers’ associations on the supply side, and commercial firms external to organic agriculture institutions on the demand side. They are in some cases interlinked by producer organisations serving as brokers. It is thus those actors most directly involved in marketing who influence market developments the most. Other organisations within organic farming – such as organic movements and certification bodies – have no clear role in market development in a cross country perspective. Their major role concerning markets seem to be in early phases of market development, when markets are being established. Among external actors, anonymous consumer demand is judged among the most important in influencing demand, while non-organic farmers’ unions are the only actor judged to exert some negative influence – mainly on supply – in a few countries.
98

The results of tables 8-5 and 8-6 opens for some reasoning. Continued consumer demand is a necessary prerequisite for triggering the interest in marketing organic food among both commercial firms and farmers. Organisations of nature conservation/environmental protection may influence both supply and demand of organic produce indirectly, via their influence on public opinion, but may also exert some direct influence on supply, via supportive measures. In Scandinavian countries, Austria, and Switzerland, agriculture authorities have exerted some direct influence on market development. Similar activities recently evolved in France and the Netherlands, attempting to increase domestic organic production in response to the strong market potential realised in several European countries and to profit from export opportunities. Also among non-organic farmers’ unions, the interest in supporting development of the market for organic food recently began to change in a direction more favourable to organic farming. This is a reaction to what they see as a recent breakthrough in the market for organic food.
8.4 Driving forces in the national organic food markets
The sections above include information on development in activities and actors influencing the national markets for organic food. A more structural way of looking at market development is to look for forces driving the market. When organic products are offered by producers in a situation where demand has not appeared obvious in terms of distinct products, price levels or qualities etc., supply may be said to ‘push’ market development – especially if supply is not reduced immediately in response to failures in demand. Similarly, demand may be said to ‘pull’ the market if it prevails in situations where products are not supplied at all, or not supplied in quantities, qualities or at prices which fit consumer preferences. Subsidies are a third driving force which represent an outside influence on the market and – depending on the design – shape price relations and hence the interrelationship between supply and demand.
Tables 8-7 to 8-9 include the perceived influence of the three driving forces in the period 1987 to 1997. From the lines which include the total number of countries in the three tables, it can be seen that subsidies are the force of which the influence has changed most systematically during the period. It starts in 1987 by driving the development in only one country, Denmark, and ends by being a driving force in nine countries in 1997 after steady growth. However, in six countries there are no reports of subsidies having a driving effect on development during the last decade. Demand is driving the development in a rather constant number of countries, but the countries differ during the period. In Spain the driving effect of demand is in the early years, while in Austria, Denmark and France, demand is driving in later years. In Italy, Portugal and the Czech Republic demand seems to have had no driving force up to now. The driving force of supply has some tendency to decrease after a peak reached in the middle of the period. Here, only Germany and Ireland report no influence during the last 10 years. Germany does, however, refer to the effect on supply which originate in subsidies.
99

Taken together the tables thus state a development where supply and demand were the only active forces in the early part of the period, while all three forces are driving at the end, with subsidies still having exerted no driving effect in quite a few countries.
It further appears from the tables that in two countries only one of the three forces is perceived to have had a driving market impact. In Portugal it is supply, while in Ireland it is demand – both countries with rather small organic sectors. The United Kingdom and the Netherlands are examples of countries with minor organic sectors where supply and demand have driven the development, while subsidies is perceived to have played no important role. In most countries, however, all three forces have influenced the development in some periods, but there is no clear development pattern. Among the countries with the largest organic sectors, Austria and Switzerland have long early periods driven by supply while in Sweden supply stopped driving market development in 1989. In Finland and Germany, supply had no direct driving effect at all in the early part of the period. In Germany, however, supply had been the main driving factor for the organic market up to the end of the 1970s.
Supply and demand are thus perceived the main driving forces in market development, even though (EU) subsidies have recently gained a major role. Supply of organic food is not a passive response to demand and the introduction of subsidies has neither neutralised the impact of supply nor of demand. Subsidies, on the other hand, seem to be an important precondition for all countries that have achieved an organic sector of some substance. An interplay including all three forces thus seems necessary for successful market development. It also seems that there is no universal type of interplay between the three forces, as large organic sectors were achieved by different combinations of the three over time. Rather, the response in the tables should be interpreted as a need for a dynamic interplay between the three forces in the sense that all three need to adapt to the dynamics of the general food market in each country. Actors influencing each force should thus attempt to adapt the working of supply, demand and subsidies to the changing circumstances facing organic food on the general food markets in each country.
8.5 Bottlenecks in developing markets
The starting point of this report was, that supply of organic food products was a larger problem in market development than was demand. Demand is a necessary precondition for market development, but not sufficient to secure the development of supply, especially when supply is facing so many special problems of conversion period production standards, certification procedures, scale of production and flexibility of production as is the case of organic food production. It appeared in the previous section that as a general view across all countries in the current reality demand is not the most important problem of the European markets for organic food. Demand is found in most countries and has been able to drive market development
100

for some periods in nearly all countries studied. It must be seen as rather unexpected, however, that the effect of demand has not declined during the last decade, in spite of increases in production in all countries. On the other hand, domestic supply was also found in all countries and it has exerted a driving influence on market development in most countries during the last ten years. However, organic supply seems more difficult to shape than demand, as it is much more complex in terms of potential to adapt to changes in demand and in markets of competing products.
Table 8-7: Driving forces behind the development of organic markets 1987-97. Supply
1987 1988 1989 1990 1991 1992 1993 1994 1995 1996 1997
AT 3 3 3 3 3 3 – – – – –
BE – – – – – – – – – 3 3
DE1 – – – – – – – – – – –
DK 3 3 3 3 3 3 – – – – –
ES – – – 3 3 3 3 3 3 3 3
FI – – – – 3 3 – – 3 3 3
FR 3 3 3 3 3 – – – – – –
GB 3 3 – – 3 3 3 3 – – –
GR nd nd nd nd nd nd nd nd nd nd nd
IE – – – – – – – – – – –
IT 3 3 3 3 3 3 3 – – – –
LU 3 3 3 3 3 3 3 3 3 3 3
NL 3 3 3 3 3 – – – – – –
PT 3 3 3 3 3 3 3 3 3 3 3
SE 3 3 – – – – – – – – –
CH 3 3 3 3 3 3 – – – – –
CZ – – – – – – 3 3 3 3 3
NO nd nd nd nd nd nd nd nd nd nd nd
No. of countries
9
10
8
9
11
9
6
5
5
6
6
Source: Own data
1 DE: subsidies lead to increasing supply 1989-97 = yes
– = no nd = no data available
101
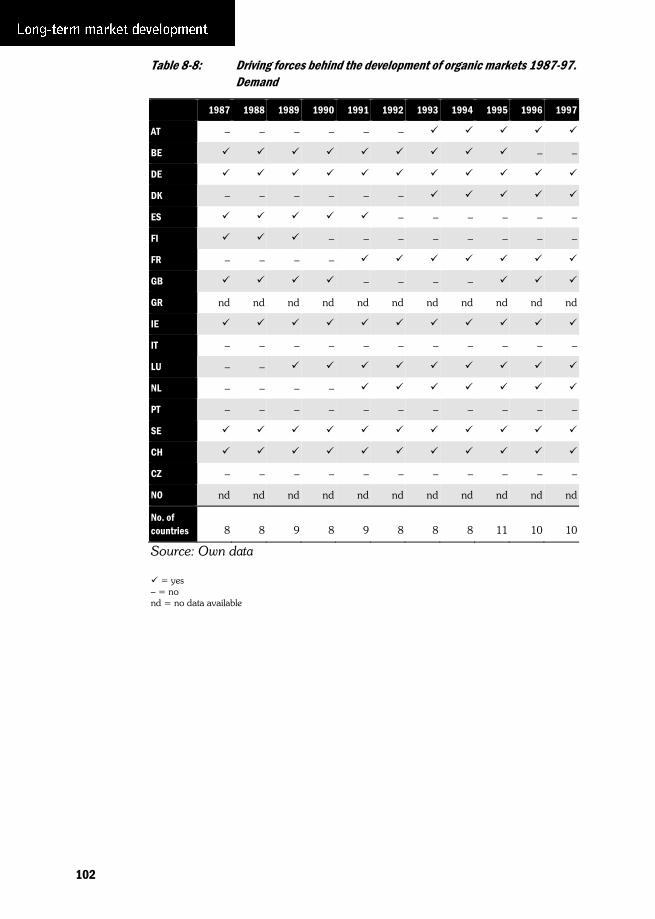
Table 8-8: Driving forces behind the development of organic markets 1987-97. Demand
1987 1988 1989 1990 1991 1992 1993 1994 1995 1996 1997
AT – – – – – –
BE – –
DE
DK – – – – – –
ES – – – – – –
FI – – – – – – – –
FR – – – –
GB – – – –
GR nd nd nd nd nd nd nd nd nd nd nd
IE
IT – – – – – – – – – – –
LU – –
NL – – – –
PT – – – – – – – – – – –
SE
CH
CZ – – – – – – – – – – –
NO nd nd nd nd nd nd nd nd nd nd nd
No. of countries
8
8
9
8
9
8
8
8
11
10
10
Source: Own data
= yes – = no nd = no data available
102
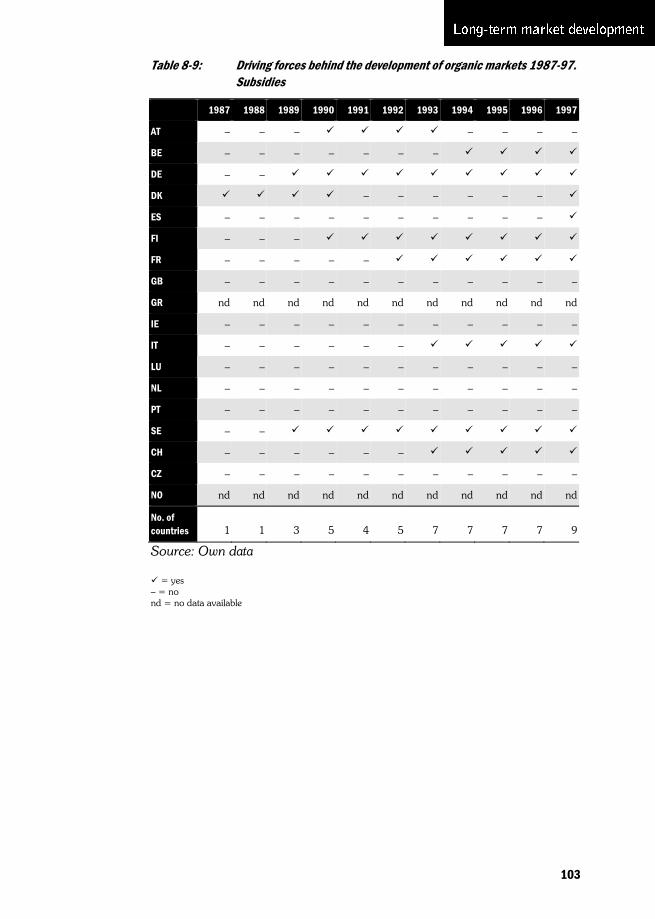
Table 8-9: Driving forces behind the development of organic markets 1987-97. Subsidies
1987 1988 1989 1990 1991 1992 1993 1994 1995 1996 1997
AT – – – – – – –
BE – – – – – – –
DE – –
DK – – – – – –
ES – – – – – – – – – –
FI – – –
FR – – – – –
GB – – – – – – – – – – –
GR nd nd nd nd nd nd nd nd nd nd nd
IE – – – – – – – – – – –
IT – – – – – –
LU – – – – – – – – – – –
NL – – – – – – – – – – –
PT – – – – – – – – – – –
SE – –
CH – – – – – –
CZ – – – – – – – – – – –
NO nd nd nd nd nd nd nd nd nd nd nd
No. of countries
1
1
3
5
4
5
7
7
7
7
9
Source: Own data
= yes – = no nd = no data available
103

The main difficulties in developing markets for organic food relate to creating interlinkages between farmers’ primary production and consumers’ demand – the distribution network.
If consumers accept products exactly as they are delivered from the farm, and the farmers immediately adapt to changes in consumer preferences, there is no problem of distribution. Direct links between producer and consumer are found in nearly all organic food markets, but they only represent marginal shares of the market. Even where direct marketing covers substantial parts of the organic food market, the total market is usually very small. Hence, a system where goods and information are transported and exchanged – a distribution system – is needed. Such a system must be able to handle so-called bottleneck problems where goods or services available are unable to satisfy demand. A general issue in the case of organic food is that, in principle, a full scale distribution system is available – that of the existing food industry, but in practice several problems have appeared when it was used for organic products. Part of the problem was, that organic products compete with non-organic ones, and another – and supplementary – part is that organic products are defined in quite other ways than non-organic products and thus pose new challenges to distributors. Hence in practice it is not clear that distribution of organic food should take place together with other food products. Main types of bottlenecks met by initiatives attempting to market organic food are listed below on the basis of the links in the distribution network from farmer to consumer. The list combines findings in this report with other types of experience found in other marketing projects (Michelsen 1993; Hamm 1986, 1991, 1992; Latacz-Lohmann and Foster 1999).
The first bottleneck for market development is the total size of farmers’ production – supply. This is even the case in countries where the organic sector has reached a substantial size – such as 10 to 15 percent of markets for individual commodities. Size is not only a matter of the total size of the organic sector, but of the volatility of production too, as organic farming is more sensitive to climatic and other physical variations. Hence, an element of size is stability in production quantity. High stability in supply is needed in any efforts to develop markets. The product mix on the organic farms is also a bottleneck. Demands for crop rotation in organic farming make it difficult to adapt fully to market demand, both for crops and for livestock production. In both types of products parts are demanded at high prices, while other parts, which cannot be omitted in production, meet hardly any demand and thus cannot obtain price premiums (see also chapters 4 and 6).
The problem of size is emphasised by the tendency that existing food distribution systems – not least in the Northern European countries where demand for organic food is largest – are built to handle very large quantities. As organic farms are spread all over each country, greater efforts are necessary in collecting organic products than in collecting equal quantities of non-organic products (see chapter 6). One way of enlarging delivery is to accept products irrespective of quality and then grade them afterwards. Another way of countering problems of small supply is to make
104

farmers comply to a set of quite narrow guidelines for quality. Up to now mainly the first type of solution is commonly used in the organic sector. In some countries the problem of the small size of the organic production versus the big size of distributors is even enlarged by the organic farmers and other actors of the organic movement themselves. In Germany, for instance, the presence of several certifying and producer organisations with different labels has intensified the problem of small scale (Hamm and Michelsen 1996).
Processing represents a third bottleneck. In chapter 4 it appeared, that the degree of processing is low in organic food. Again, one important reason is the size of production. In some instances a processing firm cannot process organic food on a full scale in one plant but has to combine it with other productions, with costly cleaning procedures in-between. Furthermore, processing organic food often requires other or supplementary professional skills than those needed for processing non-organic food. This is, for instance, the case for bakery. Related to processing is packaging. Here organic products are to be kept separate from non-organic products and packaging must be designed to live up to the demands of customers. Generally speaking, however, packaging is currently no problem for organic food (see chapter 4).
Fourth, products are to be distributed to those retailers who fit best with products, quantities and qualities delivered. It appears, in most countries, that supermarkets are willing and able to sell organic food products. Hereby, organic farmers gain access to mass markets that include many interested consumers, but supermarkets are very demanding customers and it seems a prerequisite for serving supermarkets that the organic sector is quite large – or that imports are available. Furthermore, not all supermarket chains are of interest to organic products. There needs to be some correspondence between the general profile of the supermarket and the way the organic products are profiled in order to obtain the best results. This includes products being kept in the product range of the chain even when sales do not develop as well as forecasted by the supermarket chain.
The final step in distribution includes reaching consumers most effectively. Problems of promotion were mentioned above, emphasising the current lack of systematic promotion all over Europe. Again, size and concentrated efforts seem the most important aspects. When organic food is only a marginal part of the food supply, promotion should not be directed at the general public but rather at consumer segments most interested in organic food and with the largest potential for consumption, including acceptance of price premiums.
Certification may represent a further obstacle to market development. The introduction of the EC Reg. 2092/91 clearly facilitated international trade of organic food and contributed to market growth by authorising a common certification system. On the other hand, the EU certification system is not fully developed as it does not include standards for livestock production and only recently has developed a logo of its own. EU certification is thus up to now administered and marketed by national certification bodies. The regulations of the national logos differ – not least because of the lack of
105
common livestock regulations. However, national regulations also differ in many other ways and these differences may hamper international trade. The reality of this was reflected in a workshop on export of Danish organic products, where three speakers emphasised the problems of getting access to the Swedish market because of long-winded procedures for obtaining authorisation under the national KRAV-label (Progressive tiltag 1998). Their experience fit well with the Swedish position quoted in section 8.2, in which EC Reg. 2092/91 was judged to influence markets negatively. Concerning the Danish logo, there are also special problems since it can only be obtained if a Danish producer is involved. Problems are mentioned by German producers of organic milk who wished to enter the Danish market in situations with lack of supplies in Denmark and surplus supply in Germany. Their access was denied – not by Danish certification bodies but by Danish traders, but the German traders were unable to obtain the Danish logo themselves and then had to give up to enter the market.
8.6 Summary
Organic food markets have developed rather quickly since the 1980s, most recently after the introduction of EU regulations on a common certification of plant production and on subsidies to organic farmers and activities relating to organic farming. Five aspects of market development were discussed in this chapter.
Professional marketing of organic food has been limited in the last decade. Efforts have, however, been made in a few countries with special emphasis on satisfying supermarket demands. In all but one of these countries organic food has achieved quite large market shares. Hence long term professional marketing efforts directed at supermarkets seems an important prerequisite for expanding organic food markets.
Public regulation is another way of influencing the organic food market. Early national regulations were found in a few countries, but during the 1990s EU regulations evolved and they now appear the main source of regulatory support for the organic food market in all member states. Regulatory impact up to now was mainly on supply, but it seems as if EU certification regulation is now gaining momentum in influencing consumer demand. EU standards now form the basis for the introduction of still more products. Support to farmers is also an important factor influencing supply. After implementation the effect on the organic market is judged rather constant in each country.
If marketing and regulation are to have any effect on market development, some actors are needed to work in favour of them. In the development of the national markets of organic food, organic farmers’ associations were most strongly involved on the supply side while commercial firms – not least supermarket chains – were dominating the demand side. These two may be interlinked by special producer organisations. Neither organic movements nor certification bodies had a clear role in developing markets.
106
To both main actors in the organic food market, the presence of a steady (anonymous) consumer demand is paramount. However, demand was not the only driving force in the market. Across countries, it appears that supply from time to time has pushed the market forward and that subsidies are also an important factor. An interplay between all three factors characterises all countries with a large organic sector and hence seems necessary for successful market development. However, no universal type of interplay was identified.
Bottlenecks hampering market development may be found in all links in the distribution network from farmer to consumer. A limited size of supply seems, however, to be a decisive factor which hampered market development, up to now as scale seem an important issue in all links of the distribution network – especially when targeting supermarkets. A further possible obstacle to market development is the existence of national certification systems. They own the national labels and logos which usually include supplementary requirements to those of the EU regulations. The additional requirements in national systems seem to hamper international trade with organic food and other products.
107
9 Perspectives for developing organic food markets On the basis of the description of the markets for organic products in the 18 countries in the survey, it can be concluded that markets in general are very small, they are structured quite differently and have developed along different paths. Against this background, the aim of this chapter is to draw up some perspectives for the development of the European markets for organic products. Developmental perspectives can be derived from the documented differences between countries and products. To countries with very small markets for organic products, it is possible to illustrate a potential for expanding the market by looking at how this was achieved in countries with larger markets.
The chapter falls into three sections. In the first one, focus is on summarising the findings of the report regarding factors which contribute to consolidating markets for organic products. The second section is about the European dimension of organic food markets. Finally, the chapter concludes with some suggestions for further development of markets for organic products.
9.1 Conditions for consolidating organic food markets
The focus of this report is on the supply side of the market for organic products. This was explained in chapter 1, with reference to experience of other national and international market studies indicating that demand in most cases had not appeared a major and enduring problem for the development of organic food market. On the other hand several market analyses detected supply of goods as the problematic factor. Another reason for focusing on supply is that the focus of this report is to assess possible impacts of EU policies on organic farming and of organic farming on EU policy objectives. The working of agriculture policy is based on influencing farmers’ production via farmers’ incomes – and this directly influences supply. The material presented in subsequent chapters further justified the supply focus, as only few cases were found in which demand appeared a serious problem for market development. The only example is the Czech Republic (non-EU member), where only few organic products were reported sold as organic and price premiums were not obtained for most products. Among the EU countries, similar problems, though much smaller, were identified for a few products in Portugal and the Netherlands. For the Netherlands in general and for a few products in France, short term market declines were reported, while in most other instances major market growth is reported since 1993. Thus, in general markets – and hence demand – for organic products (mainly food) have increased steadily in recent years.
The level of market shares across countries, product groups and product categories varies widely from nothing (for instance pork, where mentioned at all in country reports) to 10 to 14 percent (milk products in Austria and Denmark). This indicates that the market is still developing, and across
108
countries no absolute limit to demand for organic products has yet been identified. Conditions for developing the markets are, however, very different between countries, not least because consumer preferences vary. Thus, absolute limits to demands for organic products must exist and they should be expected to be found at different levels in different countries – but as yet they seem far from being reached.
The potential for further development of organic food markets is also emphasised by the fact that in most countries organic agriculture cover less than one percent of total domestic agriculture, while in a few countries the share is much higher – up to nine percent (Austria). Not all countries can be expected to reach the level of Austria, but it clearly seems possible to expand beyond one percent in most countries. Another aspect of the potential for expansion is that, across countries, market development so far only leads to identifying five of twelve main product groups as important in organic varieties. Vegetables, cereals, milk products, potatoes and fruits appeared among the five most important organic products in at least 12 of the 18 countries – and other products are only reported important in six countries at the most. Pork and poultry – important products in the general food markets – are thus not mentioned among the important organic products in any of the 18 countries.
Different ways of exploiting market potentials are indicated by the examples represented by the individual countries in the analysis above. A main insight reached from the analysis is that differences in the size of markets to some extent corresponds with the way marketing is organised in each country. This is indicated by the results of analysing markets on the basis of the four Ps of marketing – Place, Product, Promotion and Price. Hence, conditions for consolidating the markets for organic food as a platform for further expansion can be characterised on the basis of a summary of the analyses of each aspect.
The fundamental preconditions for marketing are fulfilled in all countries. Market conditions are found even though problems on market transparency are mentioned in some countries. Furthermore, the EU certification scheme ensures that similar certification agencies are found in all countries. From these common characteristics, however, the markets vary strongly across countries.
Sales channels differ widely regarding the use of general stores including supermarkets and hypermarkets. In Scandinavia, Austria and the United Kingdom, supermarkets are very dominant sales channels for organic produce and – apart from Britain these countries are among those with the largest organic sectors. The relationship between domestic production and supermarket sales may include several aspects. On the one hand supermarkets may provoke domestic supplies through the demand obtained from promoting organic food to a very broad range of consumers. On the other hand domestic producers need to qualify for being accepted as suppliers for supermarkets. Preference for domestic production may or may not be part of the consumer demand for organic food. Hence a balance between the qualities demanded and the qualities supplied needs to be developed. In obtaining this balance the level of both price premiums and
109
promotion efforts are important aspects. The United Kingdom is the only example where supplies to supermarkets have hitherto been based mainly on imports. The importance of supermarkets as partners in developing sales is reflected in several aspects of the subsequent analyses.
Organic products are defined uniformly by the EU standards regarding plant production, but the lack of a uniform EU label has up to now led to the use of national labels which include special rules in addition to EU standards. This tendency to fragment the markets for organic products is amplified by the lack of common livestock regulations. Hence labels are to a major extent still a national issue. Another tendency is that private firms develop their own labels in order to market their own standards and products – perhaps as a reaction against confusion among producer labels. Only among countries with large organic sectors are situations found where food firms not specialised in organic food are strongly involved in defining and using these private labels. In Sweden this takes place through close collaboration between private firms and organic associations in defining a common national label. Thus, in countries with large organic sectors, supermarkets and other private firms are strongly involved in defining the products – and usually a dialogue is taking place between organic producer organisations and private food firms. One of the results of this interplay is reflected in the problems involved in compliance of organic products with ordinary quality parameters. Major problems are only found regarding physical appearance – but the problems are not evenly distributed among countries; they are mainly found in countries with relatively low supermarket shares. The reason for this seems straight-forward. Large supermarket sales lead to high rates of product turnover and hence fewer problems with keeping products fresh. Another aspect of defining products is the degree to which they are processed, and here it is quite clear that shares of highly processed organic food of any significance are not found in any country.
As with processing, promotion of organic food is widely lacking across countries. From countries with low market shares for organic food, a few initiatives are reported, mainly originating in organic agriculture movements. Among countries with high market shares and large supermarket sales, promotion is mainly initiated and financed by private firms. On the other hand, it appears that there is no main difference in the arguments used to convince consumers to buy organic products; food safety/health arguments are mentioned by nearly all, with environmental aspects ranked second. In countries with little promotion and small market shares, such as Ireland and Norway, sales arguments relate closely to the characteristics of organic farming as opposed to other – ‘conventional’ – types of farming.
Prices of organic food vary strongly when measured as premiums above prices for ordinary food. Variation is not caused by problems in selling products as organic, since these problems are found in countries with large organic sectors as well as in countries with small sectors. Relative to conventional products, variations in prices paid to farmers largely depend on the specific production costs involved in organic production – hence price premiums for milk and beef are low, while for vegetables and pork
110
they are high. A further issue is demand, which leads to major price premiums for cereals and potatoes. Consumer prices follow a similar pattern, but to some extent they even correspond with the market share and the level of sales through supermarkets. Both large market shares and supermarket sales imply economies of scale and command low costs for processing and distribution, which again may be reflected in lower consumer price premiums and/or higher producer price premiums.
A further aspect of prices is that – generally speaking – market transparency in small markets is low. This was emphasised on the basis of the general characteristics of organic food markets. The current lack of market transparency is also reflected in this analysis, by the very fact that market information were very hard to consolidate. In many cases there also appeared wide ranges in premiums for both farmer and consumer prices. These differences are not only caused by regional variation or by variation in consumer preferences in sales channels or otherwise. They should also be taken as a clear evidence of market intransparency. The lack of precise information may lead to major disturbances in the pricing of products and hence in the economic wellbeing of the whole sector.
In summary, conditions for consolidating organic food markets seem strongly related to a high level of supermarket sales. However, sales through supermarkets pose major challenges to a small sector like organic farming. On the one hand, supermarkets demand large quantities at homogeneous qualities, delivered precisely and supported by professional promotion – conditions which are found difficult to fulfil for an emerging organic agriculture sector. On the other hand, supermarkets are the only possibility for reaching the mass market that include large consumer segments which it is impossible to contact either through direct trade from farmer to consumer or via specialised shops. The experience of countries with large supermarket sales suggests that major new consumer segments have in fact been reached. Furthermore, supermarket sales appear the most important means to counter the main problem of bottlenecks mentioned in section 8.5. The problem of small scale hampers market development as it increases costs in all links from farmer to consumer.
9.2 The European dimension
Modern organic farming was born as an innovation ‘from below’, among individuals interested in finding alternatives to ordinary agriculture. No individual firm or group of firms has thus patented organic agriculture. In fact, organic agriculture was also born internationally, as reflected in the formation of the IFOAM as the apex organisation of national movements of organic agriculture. Even though an aspect of organic production is proximity, which may hinder long distance trade, internationalism also seems an important aspect in the early stages of development, in order to exchange knowledge and views. The increasing interest in agri-environmental policies since the middle of the 1980’s amplified the political and national interests in organic farming. This paved the way for expanding
111

production and move relationships between producers and consumers of organic products from tight interpersonal relationships to more market-like conditions. The national policies again formed the basis for a common European policy on organic farming which during the 1990s had growing effects on market development and still seems to have potential for driving market development even further.
When economic and organisational interests in organic farming are very dispersed, it is quite rational of the EU, as an organisation aiming at facilitating international trade, to develop a common definition of organic agriculture as in EC Reg. 2092/91. However, the definition was not complete, as it only included plant products up until 1999. In practice, the implementation in member countries involves possibilities for hampering international trade by using national labels with additional demands marketed nationally and difficult to obtain for foreign producers.
During the 1990s, European trade of organic products has, however, developed within the EU certification framework. Trade is still not very large because, in most countries with high market shares of organic food, supply is based on domestic production. However, international trade does occur among the 18 countries in this study, and all the twelve product groups considered are traded internationally. Cereals – whether for food or livestock feed – are traded mainly among neighbouring countries, while vegetables and fruits are exported from the countries of southern Europe to northern Europe. The fact that some countries export and import products within the same product category indicates that re-exporting activities are developing. Hence, a major potential for developing international trade of organic food seems at hand, provided that common production standards are developed and enforced.
The other European aspect of developing organic farming is support to organic farming – mainly through EC Reg. 2078/92 (see Lampkin et al. 1999). The European support has increasingly replaced national support. It is based on the view that organic agriculture is an environmentally friendly type of farming. The major effect of the regulation has been support to farmers converting to organic farming and continuing organic practices, in order to reduce agri-environmental problems. This leads to increased supplies. However, the implementation of the regulation seldom included considerations regarding its effects on the market. In some instances support reached such a level that farmers did not need to sell their produce at premium prices and hence felt no need to contribute to market development. One example is from Sweden where farmers may receive support for organic farming under EC Reg. 2078/92 without having to comply with national certification standards (Foster and Lampkin 1999). Another example is from Eastern Germany, where organic farmers found it less profitable to try to sell products as organic, because it would incur major costs to establish sales channels. An example is known from the early German support scheme, where high support during some years led to high increases in supply, which undermined the price structure of the hitherto very small market (Hamm and Michelsen 1996).
112
In Lampkin et al. (1999) it is emphasised that support for marketing organic products was only found in a few countries – among them Denmark. From the introduction of national support in 1987 it was based on a market oriented view. This was reflected in the support for farmers who only should cover conversion costs while consumers were to pay price premiums when buying organic products. Market orientation, however, in this case also implied major subsidies paid to develop markets by informing consumers and support marketing as well as research and development. This approach to organic farming support is preserved after the implementation of EC Reg. 2078/92 in Denmark. The relative success of organic food in the Danish market seems a good recommendation for adapting to similar views on the European level of regulating organic farming.
9.3 Some suggestions for developing organic food markets
On the basis of the analyses performed above, it seems clear that there are major market potentials for organic food. Many efforts have been made in the past to reach this positive position, but still more are needed in order to be able to transform the market potentials to market realities. As in the past, the main scope of these efforts should be to increase supply – as no absolute limits to market demand are yet in sight. Furthermore, increasing supplies in general will help to reduce the bottlenecks in all links of the marketing chain from farmer to consumer, not least by reducing costs as an effect of economies of scale. However, supply need not grow blindly. Supply needs to adapt to demand. In large and well-functioning markets this is secured by the market mechanism. Organic agriculture, however, is only a small and marginal part of all agriculture, organic food is only a small and marginal part of the total food market, and organic food markets do not appear well-functioning. Hence, adaptation to demand is an important task to be performed both by the actors on the organic food market and by policy makers, whether on a national or European level.
This report may form the background for at least the following five suggestions addressed to the actors on the organic food market who wish to pursue the goal of improving the adaptation of farmers’ production to demand.
113
1. Serious attempts need to be made to present products to all interested consumers.
The experience from the analysis in this report is that this involves the inclusion of supermarkets as sales channel, as large and interested consumer segments are reached there. The importance of this suggestion is intensified by the fact that it appeared throughout the analysis that private non-organic firms are already among those who take the most and the largest initiatives in promoting organic food.
In order to strengthen the capacity for adapting production to demand good contacts between the supermarkets on the one hand, and organic farmers and processors on the other, need to be created. This may involve minor producer organisations oriented towards a few buyers, or it may involve larger firms attempting to serve larger parts of the market.
2. Identification of organic products must be as unambiguous as possible. This goal may even involve the development of new commercial labels by main distributors.
3. The product range needs to be expanded in all countries – it seems important to develop animal products as well as different types of processed food.
4. Organic products need to be promoted professionally via marketing plans that cover selected aspects of place, product, promotion and price in attempts to target interested consumer groups.
In the early phases of organic market development, organic agriculture movements played an important role in developing markets. However, it seems that the actors of the market have already for some years, been among the strongest in developing markets. The efforts made by the purely organic organisations and firms appeared insufficient in exploiting market potentials so far. Hence, it seems necessary to
5. develop types of organisation where organic producers can co-operate with processing firms, wholesalers and retailers who have a broader scope than only organic food. It even seems necessary that binding contracts are established between these actors to insure sufficient efforts for developing the field.
Regarding political authorities – whether on European or national level – this report may form the basis of at least four suggestions. Political intervention may help to develop the organic food market in several ways and need not to be effected for the sake of the environment or the organic farmers only. The general well-being of consumers, and of the economy as a whole, may be improved by all initiatives aimed at improving the adaptation of supply to demand and of the effective functioning of the organic food markets.
One very open result of this project is the detection of the major problems of market transparency in all countries. The problem implies major losses of consumer welfare because of reduced competition and extra costs for
114

obtaining market information. The lack of market transparency need not disappear by itself once production and sales grow large. Hence
1. it seems necessary to make deliberate efforts to reduce the market transparency problem by collecting and publishing statistics on production, sales and prices on a regular basis.1 The full effect of these efforts will be obtained if they are accompanied by increased research in production methods and markets in order to ease the adaptation of organic food production to market conditions.
The certification regime needs to be refined.
2. Production standards need to be harmonised even further – or at least the possibilities for using national standards as barriers for trade across national frontiers need to be modified. This includes the development of common livestock regulations, balancing animal welfare and environment protection against farmers’ production opportunities. This is not only relevant in a European context as organic standards are discussed under Codex Alimentarius within FAO.
3. The EU standards need promotion along with national standards in order to increase consumer attention to foreign products and facilitate the international trade. The recent introduction of a EU logo is an important step in this direction.
Direct support paid to organic farmers may well be justified by considerations for the environment. However,
4. the support needs to include market-oriented views as direct payments to farmers have clear effects on the small and volatile organic food markets. Hence support is needed for market development and information projects as well as for help to establish actors able to assist in organising farmers and firms in the food market.
_______________________
1 In spite of enormous efforts by all participating in collecting data for this project, the knowledge obtained is far from complete. It seems necessary to collect information on a more regular basis in order to allow private and public actors to make decisions on a well-informed basis.
115

10 References Abrahamsen, B. and J. Ingemann (1998). Markedsperspektiver for økologiske fødevarer - herunder first mover perspektiver. København, Miljøstyrelsen.
Albardiaz, S. (1997). Study of the barriers to organic farming development through consumption variables. Madrid.
Albonetti, G. (1995). Qualità senza compromessi. Verdi Consumi 1995, 3.
Biofach-Magazin 12/1997. Die Frische. Chance und Risiko, 6-8.
Guillou, H. and B. Sylvander (1997). La situation de la filière biologique en 1997. Toulouse: INRA-UREQUA.
Brombacher, J. and U. Hamm (1990). Ausgaben für eine Ernährung mit Bio-Lebensmitteln. Agra-Europe 31 no. 7, Markt und Meinung, 1-11.
CEMASE (1996). Estudo base sobre o mercado de agricultura biológica em Portugal. Lisboa: Centro de Estudos de Mercado e Análise Sócio-Economica Lda.
CMA (1996). Einstellungen und Markteinschätzungen aus Verbrauchersicht zu “alternativen Nahrungsmiteln/Biokost/ Ökoprodukten” insbesondere zu Obst und Gemüse. Bonn: CMA – Centrale Marketing-Gesellschaft der deutschen Agrarwirtschaft.
Cornes, R. and T. Sandler (1996). The Theory of Externalities, Public Goods, and Club Goods, Cambridge University Press.
A Concise Dictionary of Business (1990). Oxford: Oxford University Press.
CRABE (1993). Situation et perspectives de développement du secteur de la transformation et de la distribution des produits de l’agriculture biologique en Belgique. Jodoigne: CRABE.
Kissinger, R. (unpubl.). Studien zum Österreichischen Markt. Wien: Institut für Marktforschung, Dr. Fessel + GfK.
Firmino, A. (1998). Potential des ökologischen Landbaus in Portugal. In Willer, H. (ed.) (1998). Ökologischer Landbau in Europa. Perspektiven und Berichte aus den Ländern der Europäischen Union und den EFTA-Staaten. Holm: Deukalion, 303-316.
Foster, C. and N. Lampkin (1999). European organic production statistics 1993-96. Organic Farming in Europe: Economics and Policy Vol. 3, Stuttgart: Universität Hohenheim.
Forsa-Institut (unpubl.). Die Deutschen und ihre Ernährung – was werden wir übermorgen essen? (Köln: Forsa-institut (1997)).
Greiner, A. (1998). Brot, Liebe und Fantasie - Der italienische Bio-Market wächst. In: Schrot und Korn special, no 12/37, 29-33.
Hagner, C. (1996). Der Markt für ökologische Produkte in Hessen. Materialien des Zentrums für regionale Entwicklungsforschung der Justus-Liebig-Universität Giessen, no 37. (Giessen: Justus-Liebig-Universität).
116
Hamm, U. (1986). Absatzbedingungen bei Produkten aus alternativer Erzeugung. In Berichte über Landwirtschaft, Bd. 64. Münster-Hiltrup: Landwirtschaftsverlag, 72-152.
Hamm, U. (1991). 20 Jahre Vermarktung von Bioland-Produkten aus der Sicht eines Ökonomen. In Bioland, vol. 18/2, 32-34.
Hamm, U. (1992). Erzeugerzusammenschlüsse im ökologischen Landbau. Schriftenreihe des Bundesministeriums für Ernährung, Landwirtschaft und Forsten, Angewandte Wissenschaft Reihe A, no. 407. Münster-Hiltrup: Landwirtschaftsverlag, 72-152.
Hamm, U. and R. Hinderer (1994). Ausgewählte Ergebnisse des Storetests “Naturkind-Frischgemüse”. Stuttgart: Universität Hohenheim. Hamm, U., A. Poehls and J. Schmidt (1996). Analyse der Beratung von ökologisch wirtschaftenden Landwirten in Mecklenburg-Vorpommern. Schriftenreihe der Fachhochschule Neubrandenburg Reihe A, Band 2, Neubrandenburg.
Hamm, U. and J. Michelsen. (1996). Organic Agriculture in a Market Economy. Perspectives from Germany and Denmark. In Troels Østergaard (ed.): Fundamentals of Organic Agriculture. Tholey-Theley: Ökozentrum Imsbach, 208-222.
Hecq, W. and A. Vaessen. (eds.) (1994). Les actes du colloque ”Le marche des produits de l’agriculutre biologique dans l’union Europeenne” 23 Mars 1994 a Bruxelles. Jodoigne: CRABE.
Infood (1998). En undersøgelse af: Dansk daglivarehandels erfaringer med og forventninger til økologiske varer 1998. Århus, Økologisk Landscenter. Kotler, P. and G. Armstrong (1994). Principles of Marketing. Englewood Cliffs: Prentice Hall.
Kuhnert, H. and B. Wirthgen (1997). Die Bedeutung der Direktvermarktung als Einkommensalternative für landwirtschaftliche Betriebe in der Bundesrepublik Deutschland. Angewandte Wissenschaft, Reihe A no. 460, Münster-Hiltrup: Landwirtschaftsverlag.
Lampkin, N. (1994). Organic Farming: Sustainable Agriculture in Practice. In N.H. Lampkin and S. Padel (eds.). The Economics of Organic Farming. An International Perspective. Wallingford: CAB International, 3-9.
Lampkin, N. 1999. The potential for organic farming in Europe. Paper presented at the 11th Soil Association National Conference on Organic Food and Farming, Royal Agricultural College, Cirencester, 8th-10th January 1999.
Lampkin, N., C. Foster, S. Padel and P. Midmore (1999). The policy and regulatory environment for organic farming in Europe. Organic Farming in Europe: Economics an Policy, Vol. 1, Stuttgart: Universität Hohenheim.
Landøkonomisk Oversigt (1998). København: De Danske Landboforeninger.
Latacz-Lohmann, U. and C. Foster (1997). From ”niche” to ”mainstream” - strategies for marketing organic food in Germany and the UK. British Food Journal 8-9/99, 275-283.
117
Michelsen, J. (1993). Markedsføring af økologiske produkter. Esbjerg: Sydjysk Universitetscenter.
Michelsen, J. (1996). Organic farmers and conventional food distribution systems: The recent expansion of the organic food market in Denmark. American Journal of Alternative Agriculture 11(1), 18-24.
Michelsen, J. and M. Jaeger (1999). Danske økologisk landbrugere 1995. En beskrivelse baseret på en spørgeskemaundersøgelse. Esbjerg: Institut for Politisk Analyse, Syddansk Universitet – Esbjerg.
Michelsen, J. and M. Zakora (1999). Nyomlæggere til økologisk jordbrug 1995-97. En beskrivelse baseret på en spørgeskemaundersøgelse. Esbjerg: Institut for Politisk Analyse, Syddansk Universitet – Esbjerg.
Michelsen, J., S. Padel, C. Foster and K. Lynggaard (forthcoming). Institutional factors influencing the variation in the rate of conversion to organic farming in Europe 1985-1996. Stuttgart: Universität Hohenheim.
Miele M. (1995). Gli stili di consumo e la culturalizzazione dei mercati locali nei processi di sviluppo endogeno. In Miele M. and Rovai M. (eds.), Tendenze globali e tendenze locali nei processi di sviluppo: modelli interpretativi a confronto. Pisa: Departimento del Economia dell'agricoltura, 29-52.
Nieberg, H. and F. Offermann (1999). Economic performance of organic farms in Europe. Organic Farming in Europe: Economics and Policy Vol. 5, Stuttgart: Universität Hohenheim.
Poulsen, C. S. (1988). Børsens marketing leksikon. København: Børsen. Progressive tiltag for afsætning af økologiske produkter. Bilag til Økologisk Konference, Vingstedcentret tirsdag den 24. novmeber 1998. Skejby: Landbrugets Rådgivningscenter & Vesteregnens Erhvervsknudepunkt.
Stolze, M., A. Piorr, A. Häring and S. Dabbert (1999). Environmental and ressource use impacts of organic farming in Europe. Organic Farming in Europe: Economics and Policy Vol. 6, Stuttgart: Universität Hohenheim.
Strøm, B. (1995). Markedsmuligheder og betalingsvillighet for økologiske produkter. Rapport nr. 3. Oslo: Lantbrukets utredningskontor.
Tate,W. (1991). Organic Produce in Europe. London: The Economist Intelligence Unit.
Thimm, C., C. Karst and J. Schart (1991). Neue Absatzwege und Elastizität des Marktes für Produkte aus ökologischem Landbau in Nordeuropa. Studie im Auftrag der EG-Kommission. Fallingbostel: Thimm.
Van der Smissen, N., M. Koulouroudis and S. Sgouros (1998). Ökologischer Landbau in Griechenland. In: Willer, H. (ed): Ökologischer Landbau in Europa. Perspektiven und Bericht aus den Ländern der Europäischen Union und den EFTA-Staaten. Ökologische Konzepte No 98, Holm: Deukalion, 133-146.
Väisänen, J. and L. Pohjalainen (1995). Consumers’ interest in ecological products and their willingness to pay. (Mikkeli: Unversity of Helsinki).
118
Wier, M. and C. Calverley (1999). Forbrug af økologiske fødevarer. Del 1: Den økologiske forbruger. Faglig rapport fra DMU, nr. 272.
Willer, H. (ed.) (1998). Ökologischer Landbau in Europa. Perspektiven und Berichte aus den Ländern der Europäischen Union und den EFTA-Staaten. Ökologische Konzepte no. 98, Holm: Deukalion.
Zanoli, R. (1996). INEA Yearbook
Zittmayr, G. (1996). Das Adoptionsverhalten des Lebensmitteleinzelhandels. Eine interpretative Auswertung gezeigt am Beispiel österreichischer Bioprodukte. (Wien: Universität für Bodenkultur, Institut für Agrarökonomik).
ZMP (1998). Erzeugerpreise für Produkte aus Ökologischem Landbau, Vol. 7, no 26.
119
11 Contributors – National experts AT: Doz. Dr. Maurer and Dr. Wieshofer, Ludwig Bolzmann Institut,
Wien
BE: Carl Haest, Haest Consultancy for the Organic Industry, Aarschot
CH: Otto Schmid, FIBL-Beratungsbüro Ostschweiz, Frick
CZ: Tomas Zidek, ICEA Foundation for Organic Agriculture, Praha
DE: Prof. Dr. Ulrich Hamm, Fachhochschule Neubrandenburg, Neubrandenburg
DK: Dr Johannes Michelsen and Michael Borgen, Sydjysk Universitetscenter, Esbjerg
ES: Dr Javier Sanz, Politechnic University of Madrid, Madrid
FI: M.Sc. Jukka Rajala, Mikkeli Institute for Rural Reearch and Training. Helsinki University, Helsinki
FR: Cécile Bernard, Yvan Gautronneau, and C. David, Institut Superieur d’Agriculture Rhone-Alpes, Lyon
GB: Carolyn Foster, University of Wales, Aberystwyth
GR: Agapi Vassiliou, Cretan Agri-Environmental Group, Crete
IE: Noreen Gibney, Irish Organic Farmers and Growers Association, Dublin
IT: Dr Raffaele Zanoli and Simona Naspetti, Universita degli Studi di Ancona, Ancona
LU: Dr Marianne Altmann and Dirk Kopp, CO CONCEPT, Luxembourg
NL: J.J.C.M. Hammerstein and K.L. Zimmermann, LEI-DLO, Den Haag
NO: Ketil Valde and Helge Vittersø, NORSØK, Tingvoll
PT: Américo M. S. Carvalho Mendes, Filipe Serra and Susana Costa e Silva, Universidade Católica Portuguesa – Centro Regional do Porto, Porto
SE: Karin Höök, Sveriges Lantbruksuniversitet, Uppsala
120

12 Key informants AT: Mag. Herbert Allerstorfer; Mag. Josef Aigner; Dipl. Ing. Josef
Zach; Werner Lampert
BE: Michel Boulanger, co-ordinator of PROBILA-UNITRAB
CH: Karin Knauer, BIO SUISSE, market specialist in the Swiss Umbrella organisation; Yves Schätzle, BIO SUISSE, market specialist in the Swiss Umbrella organisation; Niklaus Steiner, Biofarm; Renato Isella COOP Basel; Hanspeter Baertschi, Migros
CZ: Tomas Mitacek, Director of Slunecni Brana company; Karel Matej, Manager of wholesale trade company, PRO-BIO
DE: Hinrich Hansen, Dialogpartner Agrarkultur, head of consultancy for organic farmers and manufacturers, Bohmstedt; Markus Rippin, head of the project ‘statistics of organic farmers’ prices’ of the Zentrale Markt- und Preisberichtsstelle für Erzeugnisse der Land-, Forst- und Ernährungswirtschaft, Bonn, and his assistent Karsten Ziebell; Elke Röder, manager of the wholesalers organisation of Bundesverband Naturkost Naturwaren, Hürth; Dr. Robert Hermanowski, marketing expert of Arbeitsgemeinschaft Ökologischer Landbau, Darmstadt; Joachim Grunwald, manager of the farmers’ marketing association Bioland GmbH Nord, Wunstorf; Prof. Dr. Bernd Wirthgen, professor for agricultural marketing, Gesamthochschule Kassel, Witzenhausen; Klaus Schneider-Reiss, manager of the farmers’ marketing association Vermarktungsgesellschaft Bioland Schleswig-Holstein Naturprodukte mbH & Co KG, Bordesholm; Rüdiger Kerschner, member of the management of Germany’s biggest wholesaler for wholefood shops, Dennree, Töpen; Karl Steves, manager of the specialised wholesaler for organic vegetables and fruits, Lehmann Natur GmbH, Duisburg; Hartmut Brinkmann, manager of the farmers’ marketing association Marktgemeinschaft der Naturland-Betriebe in Schleswig-Holstein, Glasau; Heribert Schramm, wholesaler for organic fruits and vegetables, Appenweier; Konstantin von Löbbecke, manager of the farmers’ marketing association Bergquell Naturhöfe, Dorstadt
DK: Teo Geer, The Organic Service Center and Infood, head of market analysis dept.; Niels Ebbe, Solhjulet; Poul Henrik Hedeboe, Svanholm; Bent Thomsen, Drabæks Mølle; Jørgen Pedersen, A/S Carl Rasmussen; Ib Damm-Ottesen, part-owner of an organic egg-packing and trade company; Torben Laursen and Jette Rønbjerg, FDB; Jette Rondbjerg, Central Labatory Coop Denmark (FDB).
121
ES: Joan Borja Jardí, Alimentos Biológicos Oleander, S.A., Exporter of a wide range of organic products; Dionisio de Nova, Técnicas Agrobiológicas, Agricultural technician, grower and salesman; Maya Al Hajj, Agricultural engineer, Master from the international Centre for advanced Agricultural Mediterranean Studies, Expert in marketing of organic products; Francisco Casero, Chairman of the Comité Andaluz de Agricultura Ecológica (control authority) and La CRAE
FI: Frank Ahrenberg, Product Manager of Tukospar; Sampsa Heinonen, Senior Officer, Plant Production Inspection Center; Teija Lammila, Marketing Manager of Sataluomu; Leila Lehtovirta, Test kitchen Manager, Inex Partners Oy; Ilkka Pietiäinen, Saimaan Luomu Oy, Managing Director; Auvo Rönkönharju, wholesale buyer and seller for Itu Oy; Pekka Terhemaa, Head of the Union for Organic Farming; Marja-Leena Tiusanen, Marketing Secretary for the Union for Organic Farming; Arto Varpio, Chairman of ELO
FR: M. Jacques Piort, responsible for organic farming at APCA (Assemblée Permanente des chambres d'Agriculture); M. Michel Bouiol, professor at ENITA of Clermont Ferrand; M. Faget, of the cereals co-operative la Franciade – Blois; H. D’yvoire, professor in marketing and strategy of l’ISARA, Lyon; Mme Monot Dgal., Ministry of agriculture
GB: Bill Starling, consultant and Soil Association inspector; Michael Marriage, Doves Farm Foods Ltd; Sally Bagenal, Organic Milk Suppliers Cooperative Ltd (OMSC); Gareth Rowlands, Rachel’s Dairy; Mary Weston, Organic Meat and Livestock Cooperative (OMLC); Peter Segger, Organic Farm Foods; Tim Finney, Managing Director, Eastbrook Farm Organic Meats Ltd
GR: Mathaios Mamalakis, President of the Cretan Agri-environmental Group and of the Organic Growers of Messara; George Volikos, Director of the Union of Co-operatives of Messara, Crete; Michalis Koulouroudis, President of the Hellenic Union of Organic Farmers and retailer; Spiros Sgouros, President of the DIO; Ana Taboukou, agricultural journalist; Kostas Jatas, organic farming consultant and owner of a company with organic supplies; Agathi Balbouzi, Office of Organic Product of the Ministry of Agriculture; Ioannis Goumas, Directory of the Nature and Environment, Ministry of Agriculture.
IE: Hellen Scully, Organic Trust, National Administrator; Anthony O’Dwyer, Co-ordinator, Shannon Region Organic Meat Co-op; Penny Lange, Contact Person for the Bio-dynamic Agricultural Association in Ireland.
IT: Giuseppe Paolini; Giorgio Parise, manager of BRIO a whole-sale company specialised in organic fruits & vegetables for the
122
supermarkets; Lucio Ceccarelli, manager of Naturasì, a franchising company of specialised organic retail shops; Walter Boffa, manager of La Sorgente, a wholesale import-export company specialised in organic cereals and pulses
LU: Änder Schanck, wholesaler; Raymond Aenderkerk, organic farming association (BioLabel); Malou Holtzem, organic farming association (DEMETER)
NL: Anonymous, Whole saler; Anonymous, Wine importer
NO: Helios, Wholesaler and shops; NKL (Norwegian consumers co-operation); Debio (certification body)
PT: Ângelo Rocha, manager of BIOCOOP; Joaquim Alves, manager of URZE; Eng. Hélder, manager of Cooperativa Agrícola de Vila Flor; Artur Aragão, owner and manager of the ALFANDAGH olive oil company; Neils Rump, owner and manager of Rump & Demenga, L.da; Maria da Conceição Cabral e Silva, manager of Sociedade Agrícola e Industrial do Algarve; Arlindo Pinto Cruz, wine grower in the Douro region; José Cardoso Rocha, owner and manager of Quinta da Comenda
SE: Anneke Svantesson, Market specialist on organic grain, EcoTrade AB; Carin Enfors, Market specialist on organic products,Ecocentrum; Camilla Sandenskog, Farmec slakt, Scan HB; Maria Gardfjell, Konsumentverket; Kari Örjavik, President, Samodlarna Sverige Coop; Björn Lindkvist, Expert on wine statistics, Systembolaget AB; Åsa Odelros, Advicer, Ecological Poultry Association; Kajsa Fridberg, informant, KRAV; Eva Blomkvist, Managers assistant, ARLA Göteborg.
123
124
13 Annex The annex includes three types of supplementary information. They are meant as a help for the reader to interpret the results mentioned in the main text. The information includes
a) country specific reviews of national markets for the five most important organic food products in 1997;
b) the questions from the questionnaire completed by national experts on the basis information from key actors in the national markets for organic products and
c) information from the questionnaires supplementary to the information presented in the tables of the main text.
Country specific reviews of national markets are presented in order to help the reader organising the information in a more country specific way as the main text focuses on presenting data on the European market as a whole. The tables include information on the five organic product groups that appeared most important in each group. Information covers main issues such as market share, supermarket sales, degree of processing, price premiums, and percentages sold as organic products.
The reason for printing parts of the questionnaire is, that the exact wording of the questionnaire is essential for the understanding of the information presented in the report. Furthermore, the questionnaire represents an effort of balancing the information which is available or which one may expect to be obtainable in most countries at this stage of organic market development. In spite of the modest ambitions of the questionnaire it still appeared difficult in many countries to collect the information asked for.
Far from all the information obtained from the questionnaries is presented in the report. As it is the best information of European markets of organic products currently available, it was seen as a possible help for future students of the issued to present most of the information obtained. The main information omitted concern the specification of the years in which different actors began to influence the market development (see section 8.1).
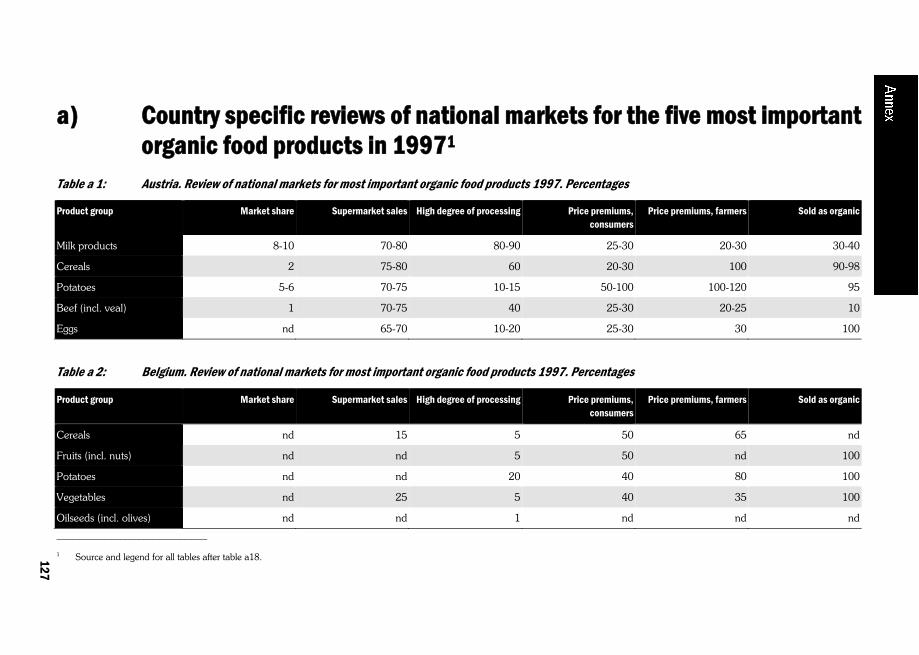
a) Country specific reviews of national markets for the five most important organic food products in 19971
Table a 1: Austria. Review of national markets for most important organic food products 1997. Percentages
Product group Market share Supermarket sales High degree of processing Price premiums, consumers
Price premiums, farmers Sold as organic
Milk products 8-10 70-80 80-90 25-30 20-30 30-40
Cereals 2 75-80 60 20-30 100 90-98
Potatoes 5-6 70-75 10-15 50-100 100-120 95
Beef (incl. veal) 1 70-75 40 25-30 20-25 10
Eggs nd 65-70 10-20 25-30 30 100
Table a 2: Belgium. Review of national markets for most important organic food products 1997. Percentages
Product group Market share Supermarket sales High degree of processing Price premiums, consumers
Price premiums, farmers Sold as organic
Cereals nd 15 5 50 65 nd
Fruits (incl. nuts) nd nd 5 50 nd 100
Potatoes nd nd 20 40 80 100
Vegetables nd 25 5 40 35 100
Oilseeds (incl. olives) nd nd 1 nd nd nd
________________________________ 1 Source and legend for all tables after table a18.
125
127

Table a 3: Germany. Review of national markets for most important organic food products 1997. Percentages
Product group Market share Supermarket sales High degree of processing Price premiums, consumers
Price premiums, farmers Sold as organic
Cereals 3.4 15 nd 20-150 100 85
Potatoes 2.2 40 20 50-100 200 95
Vegetables 1.7 25 30 20-100 50 90
Fruits (incl. nuts) 1.3 20 20 20-150 50 90
Milk products 0.5 30 50 25-80 15 50
Table a 4: Denmark. Review of national markets for most important organic food products 1997. Percentages
Product group Market share Supermarket sales High degree of processing Price premiums, consumers
Price premiums, farmers Sold as organic
Milk products 14.2 98 5 20-30 20-25 80
Potatoes 2.9 80-90 1 20-50 25-50 95
Vegetables 6-10 80-90 5 20-50 25-50 95
Cereals 3.5 90-95 35 0-20 60-70 100
Eggs 4.9 90 20 7-50 10-95 90
Beef (incl. Veal) 0.7 80 5 20-50 10-30 75
126
128
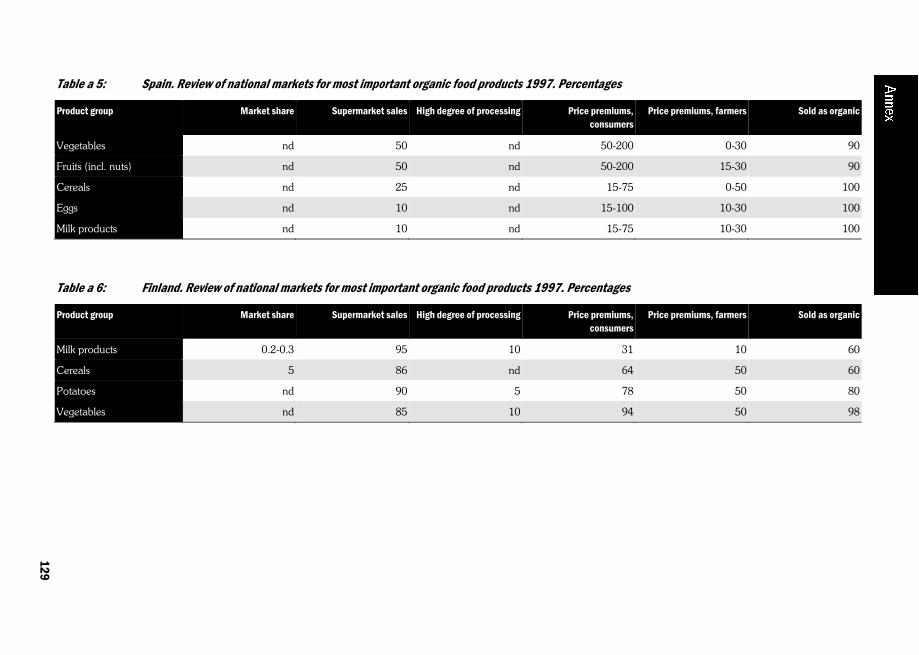
Table a 5: Spain. Review of national markets for most important organic food products 1997. Percentages
Product group Market share Supermarket sales High degree of processing Price premiums, consumers
Price premiums, farmers Sold as organic
Vegetables nd 50 nd 50-200 0-30 90
Fruits (incl. nuts) nd 50 nd 50-200 15-30 90
Cereals nd 25 nd 15-75 0-50 100
Eggs nd 10 nd 15-100 10-30 100
Milk products nd 10 nd 15-75 10-30 100
Table a 6: Finland. Review of national markets for most important organic food products 1997. Percentages
Product group Market share Supermarket sales High degree of processing Price premiums, consumers
Price premiums, farmers Sold as organic
Milk products 0.2-0.3 95 10 31 10 60
Cereals 5 86 nd 64 50 60
Potatoes nd 90 5 78 50 80
Vegetables nd 85 10 94 50 98
127
129
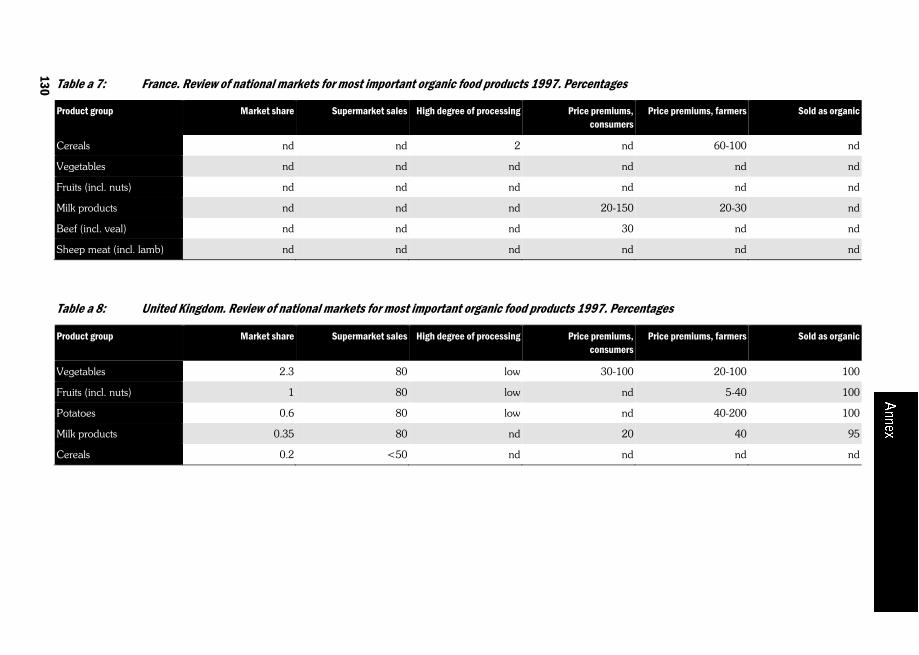
Table a 7: France. Review of national markets for most important organic food products 1997. Percentages
Product group Market share Supermarket sales High degree of processing Price premiums, consumers
Price premiums, farmers Sold as organic
Cereals nd nd 2 nd 60-100 nd
Vegetables nd nd nd nd nd nd
Fruits (incl. nuts) nd nd nd nd nd nd
Milk products nd nd nd 20-150 20-30 nd
Beef (incl. veal) nd nd nd 30 nd nd
Sheep meat (incl. lamb) nd nd nd nd nd nd
Table a 8: United Kingdom. Review of national markets for most important organic food products 1997. Percentages
Product group Market share Supermarket sales High degree of processing Price premiums, consumers
Price premiums, farmers Sold as organic
Vegetables 2.3 80 low 30-100 20-100 100
Fruits (incl. nuts) 1 80 low nd 5-40 100
Potatoes 0.6 80 low nd 40-200 100
Milk products 0.35 80 nd 20 40 95
Cereals 0.2 <50 nd nd nd nd
128
130
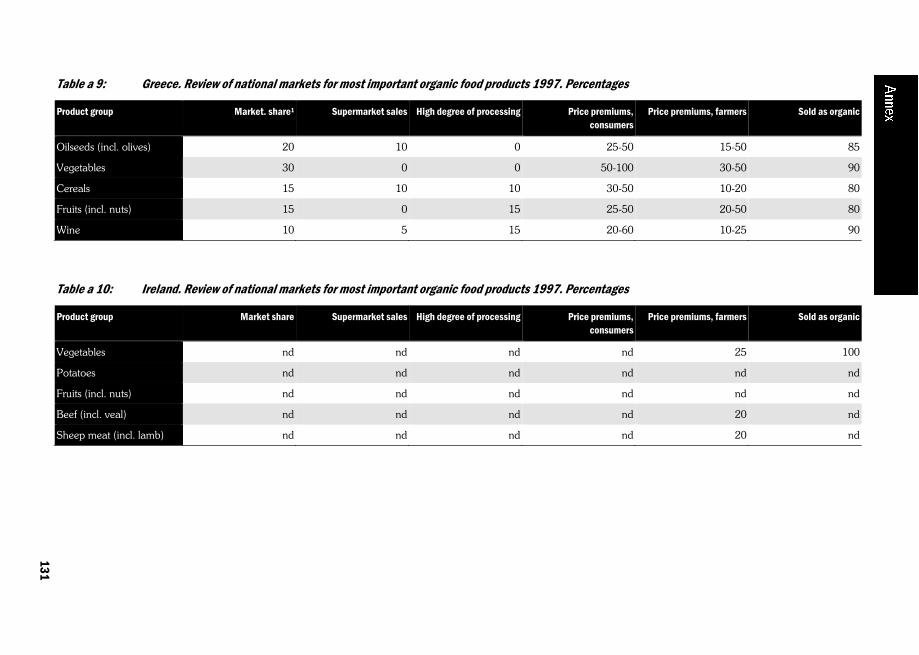
Table a 9: Greece. Review of national markets for most important organic food products 1997. Percentages
Product group Market. share1 Supermarket sales High degree of processing Price premiums, consumers
Price premiums, farmers Sold as organic
Oilseeds (incl. olives) 20 10 0 25-50 15-50 85
Vegetables 30 0 0 50-100 30-50 90
Cereals 15 10 10 30-50 10-20 80
Fruits (incl. nuts) 15 0 15 25-50 20-50 80
Wine 10 5 15 20-60 10-25 90
Table a 10: Ireland. Review of national markets for most important organic food products 1997. Percentages
Product group Market share Supermarket sales High degree of processing Price premiums, consumers
Price premiums, farmers Sold as organic
Vegetables nd nd nd nd 25 100
Potatoes nd nd nd nd nd nd
Fruits (incl. nuts) nd nd nd nd nd nd
Beef (incl. veal) nd nd nd nd 20 nd
Sheep meat (incl. lamb) nd nd nd nd 20 nd
129
131
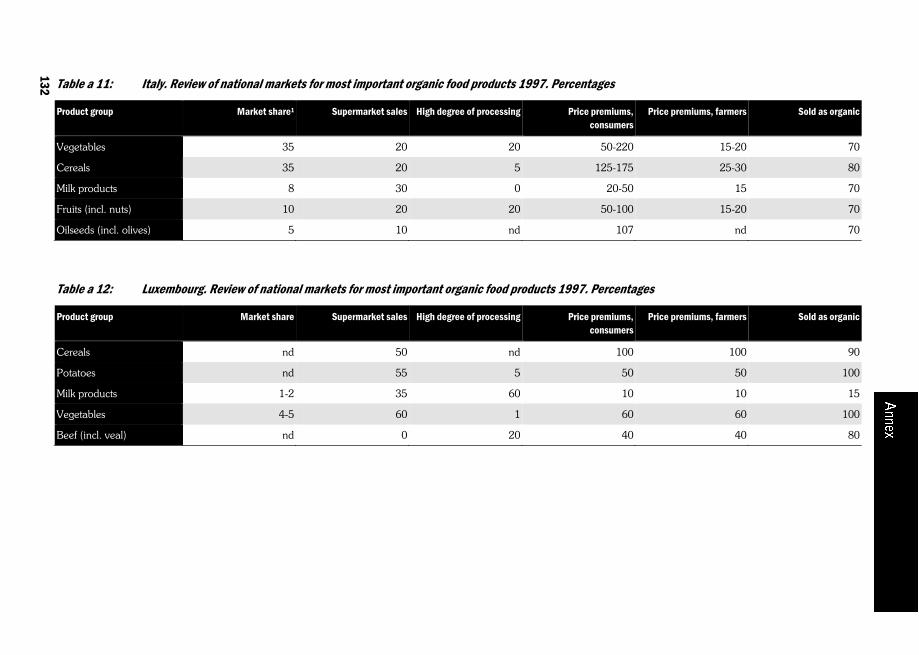
Table a 11: Italy. Review of national markets for most important organic food products 1997. Percentages
Product group Market share1 Supermarket sales High degree of processing Price premiums, consumers
Price premiums, farmers Sold as organic
Vegetables 35 20 20 50-220 15-20 70
Cereals 35 20 5 125-175 25-30 80
Milk products 8 30 0 20-50 15 70
Fruits (incl. nuts) 10 20 20 50-100 15-20 70
Oilseeds (incl. olives) 5 10 nd 107 nd 70
Table a 12: Luxembourg. Review of national markets for most important organic food products 1997. Percentages
Product group Market share Supermarket sales High degree of processing Price premiums, consumers
Price premiums, farmers Sold as organic
Cereals nd 50 nd 100 100 90
Potatoes nd 55 5 50 50 100
Milk products 1-2 35 60 10 10 15
Vegetables 4-5 60 1 60 60 100
Beef (incl. veal) nd 0 20 40 40 80
130
132

Table a 13: Netherlands. Review of national markets for most important organic food products 1997. Percentages
Product group Market share Supermarket sales High degree of processing Price premiums, consumers
Price premiums, farmers Sold as organic
Vegetables nd 2 nd 20-50 nd 100
Milk products 1 4 1 38 10 100
Fruits (incl. nuts) nd 1 1 26 nd 100
Beef (incl. veal) 0.1 0 0 nd nd 100
Potatoes <1 4 nd 33 33 100
Table a 14: Portugal. Review of national markets for most important organic food products 1997. Percentages
Product group Market share Supermarket sales High degree of processing Price premiums, consumers
Price premiums, farmers Sold as organic
Cereals nd nd 5 nd nd 10
Oilseeds (incl. olives) 0.4 95 1 30 20-30 100
Fruits (incl. nuts) <0.1 >90 nd 5 10-100 100
Wine <0.1 nd nd 25 20-30 100
Potatoes nd 100 nd 200 100 nd
131
133
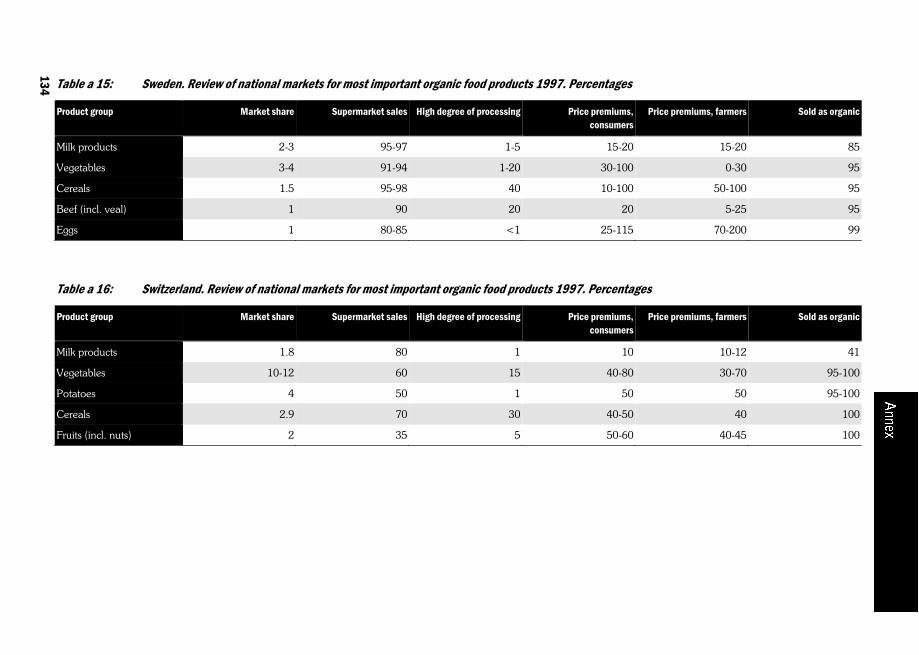
Table a 15: Sweden. Review of national markets for most important organic food products 1997. Percentages
Product group Market share Supermarket sales High degree of processing Price premiums, consumers
Price premiums, farmers Sold as organic
Milk products 2-3 95-97 1-5 15-20 15-20 85
Vegetables 3-4 91-94 1-20 30-100 0-30 95
Cereals 1.5 95-98 40 10-100 50-100 95
Beef (incl. veal) 1 90 20 20 5-25 95
Eggs 1 80-85 <1 25-115 70-200 99
Table a 16: Switzerland. Review of national markets for most important organic food products 1997. Percentages
Product group Market share Supermarket sales High degree of processing Price premiums, consumers
Price premiums, farmers Sold as organic
Milk products 1.8 80 1 10 10-12 41
Vegetables 10-12 60 15 40-80 30-70 95-100
Potatoes 4 50 1 50 50 95-100
Cereals 2.9 70 30 40-50 40 100
Fruits (incl. nuts) 2 35 5 50-60 40-45 100
132
134
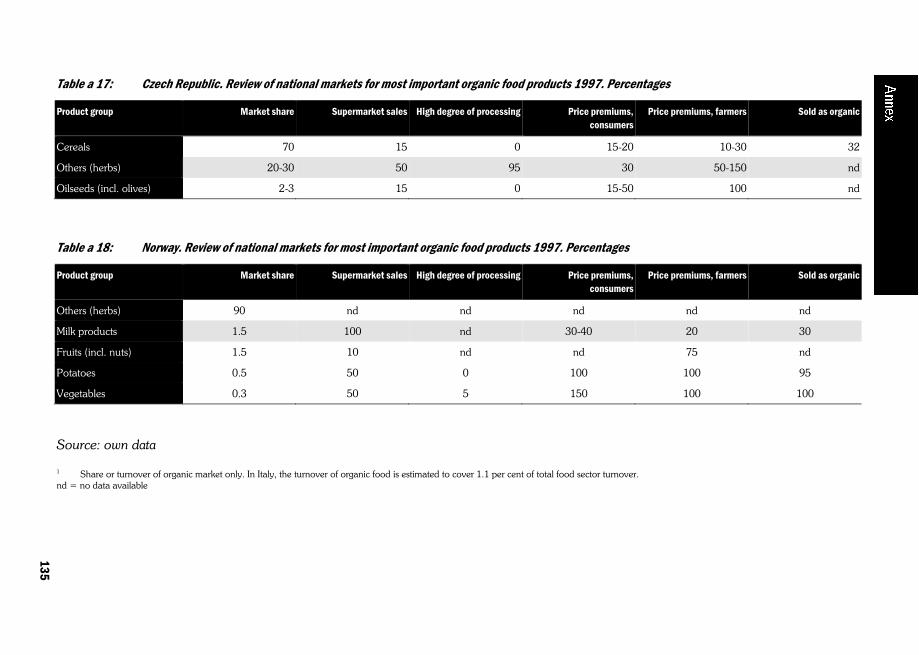
133
Table a 17: Czech Republic. Review of national markets for most important organic food products 1997. Percentages
Product group Market share Supermarket sales High degree of processing Price premiums, consumers
Price premiums, farmers Sold as organic
Cereals 70 15 0 15-20 10-30 32
Others (herbs) 20-30 50 95 30 50-150 nd
Oilseeds (incl. olives) 2-3 15 0 15-50 100 nd
Table a 18: Norway. Review of national markets for most important organic food products 1997. Percentages
Product group Market share Supermarket sales High degree of processing Price premiums, consumers
Price premiums, farmers Sold as organic
Others (herbs) 90 nd nd nd nd nd
Milk products 1.5 100 nd 30-40 20 30
Fruits (incl. nuts) 1.5 10 nd nd 75 nd
Potatoes 0.5 50 0 100 100 95
Vegetables 0.3 50 5 150 100 100
1 Share or turnover of organic market only. In Italy, the turnover of organic food is estimated to cover 1.1 per cent of total food sector turnover.
Source: own data
nd = no data available
135
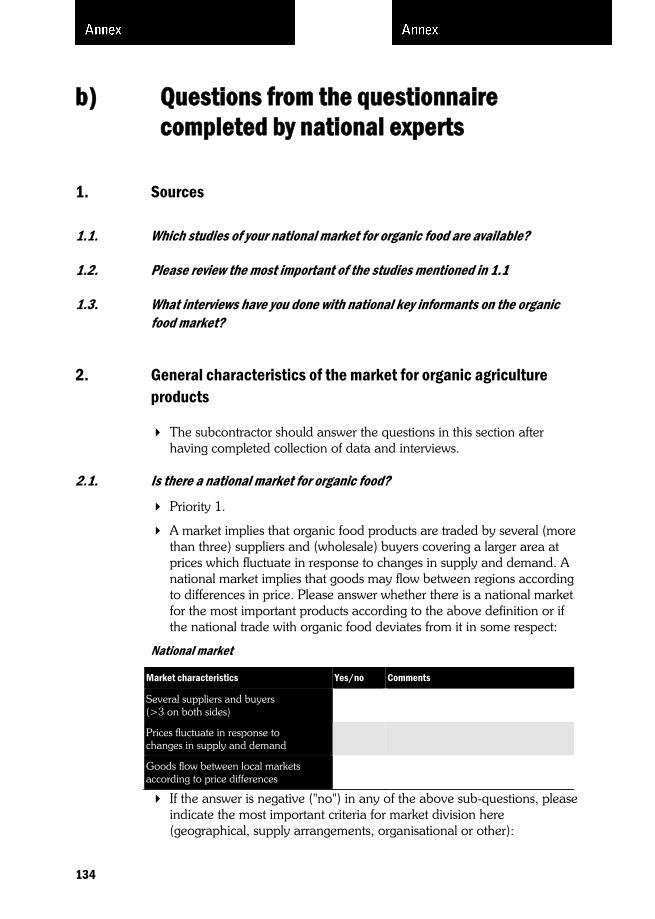
b) Questions from the questionnaire completed by national experts
1. Sources
1.1. Which studies of your national market for organic food are available?
1.2. Please review the most important of the studies mentioned in 1.1
1.3. What interviews have you done with national key informants on the organic food market?
2. General characteristics of the market for organic agriculture products
The subcontractor should answer the questions in this section after having completed collection of data and interviews.
2.1. Is there a national market for organic food?
Priority 1.
A market implies that organic food products are traded by several (more than three) suppliers and (wholesale) buyers covering a larger area at prices which fluctuate in response to changes in supply and demand. A national market implies that goods may flow between regions according to differences in price. Please answer whether there is a national market for the most important products according to the above definition or if the national trade with organic food deviates from it in some respect:
National market
Market characteristics Yes/no Comments
Several suppliers and buyers (>3 on both sides)
Prices fluctuate in response to changes in supply and demand
Goods flow between local markets according to price differences
If the answer is negative ("no") in any of the above sub-questions, please indicate the most important criteria for market division here (geographical, supply arrangements, organisational or other):
134
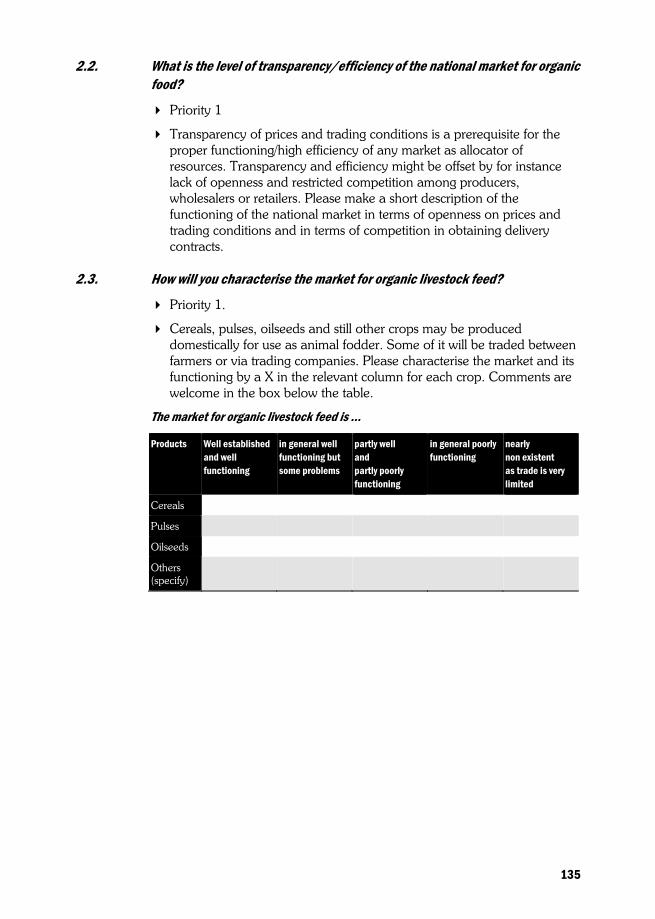
2.2. What is the level of transparency/efficiency of the national market for organic food?
Priority 1
Transparency of prices and trading conditions is a prerequisite for the proper functioning/high efficiency of any market as allocator of resources. Transparency and efficiency might be offset by for instance lack of openness and restricted competition among producers, wholesalers or retailers. Please make a short description of the functioning of the national market in terms of openness on prices and trading conditions and in terms of competition in obtaining delivery contracts.
2.3. How will you characterise the market for organic livestock feed?
Priority 1.
Cereals, pulses, oilseeds and still other crops may be produced domestically for use as animal fodder. Some of it will be traded between farmers or via trading companies. Please characterise the market and its functioning by a X in the relevant column for each crop. Comments are welcome in the box below the table.
The market for organic livestock feed is ...
Products Well established and well functioning
in general well functioning but some problems
partly well and partly poorly functioning
in general poorly functioning
nearly non existent as trade is very limited
Cereals
Pulses
Oilseeds
Others (specify)
135

2.4. Is there a national production of organically grown fodder crops with the main purpose of commercial sales?
Priority 1
Please fill in a X in the relevant column for each product. The space may be used to qualify the x-answer and comments are welcome in the box below the table.
Commercial fodder production
Products Yes, grown with the purpose of sale
No, national fodder production is composed of surplus production
Cereals …1
2.5. Are there any imports or exports of organically grown fodder crops?
Priority 1: a X in export/import column and indication of percentage of national production.
Priority 2: Other information
Comments are welcome in the box below the table. In task 2.1 the certifying bodies are generally asked for information on import/export quantities. In this task other sources should be used.
International trade
Products Imports tonnes
Exports Tonnes
% of national production
Country(ies) of origin/destination
Cereals …2
3. Organic agriculture food products
If you have problems with the categories in the tables of this section, please fill in your information in the most appropriate cells (you may also enlarge cells), make a comment in the box below the table and provide your information the way you wish.
If you wish to present more detailed information than asked for, please summarise data in the table, make a comment in the box below the table, and attach a copy of your original information (translation is not needed).
________________________________ 1 Same list as in question 2.3. 2 Same list as in question 2.3.
136
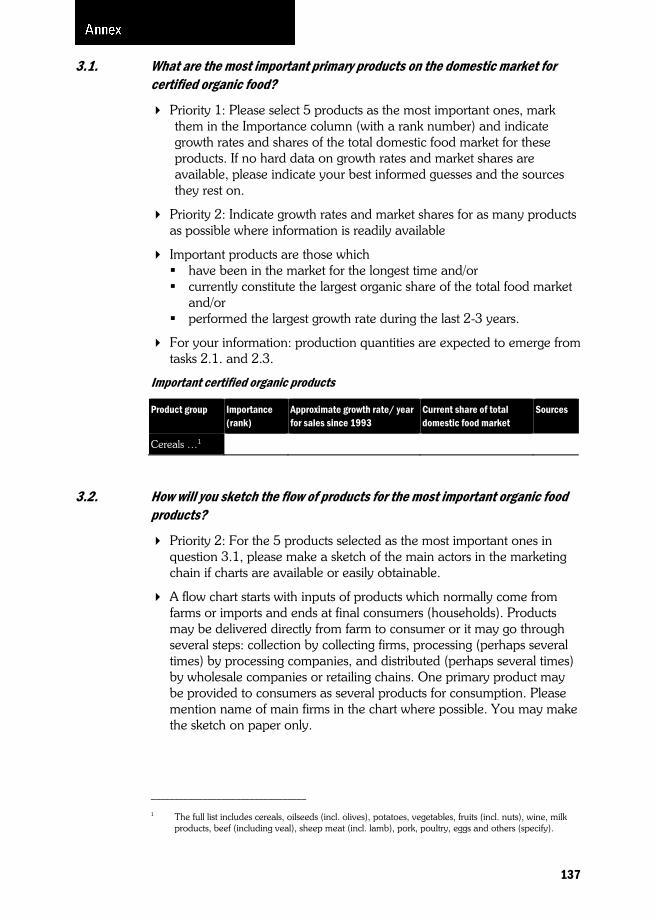
3.1. What are the most important primary products on the domestic market for certified organic food?
Priority 1: Please select 5 products as the most important ones, mark them in the Importance column (with a rank number) and indicate growth rates and shares of the total domestic food market for these products. If no hard data on growth rates and market shares are available, please indicate your best informed guesses and the sources they rest on.
Priority 2: Indicate growth rates and market shares for as many products as possible where information is readily available
Important products are those which have been in the market for the longest time and/or currently constitute the largest organic share of the total food market
and/or performed the largest growth rate during the last 2-3 years.
For your information: production quantities are expected to emerge from tasks 2.1. and 2.3.
Important certified organic products
Product group Importance (rank)
Approximate growth rate/ year for sales since 1993
Current share of total domestic food market
Sources
Cereals …1
3.2. How will you sketch the flow of products for the most important organic food products?
Priority 2: For the 5 products selected as the most important ones in question 3.1, please make a sketch of the main actors in the marketing chain if charts are available or easily obtainable.
A flow chart starts with inputs of products which normally come from farms or imports and ends at final consumers (households). Products may be delivered directly from farm to consumer or it may go through several steps: collection by collecting firms, processing (perhaps several times) by processing companies, and distributed (perhaps several times) by wholesale companies or retailing chains. One primary product may be provided to consumers as several products for consumption. Please mention name of main firms in the chart where possible. You may make the sketch on paper only.
_________________________________ 1 The full list includes cereals, oilseeds (incl. olives), potatoes, vegetables, fruits (incl. nuts), wine, milk
products, beef (including veal), sheep meat (incl. lamb), pork, poultry, eggs and others (specify).
137

3.3. How important are imported products in the domestic market for organic food, and are they imported from EU member states?
Priority 1: Please indicate the quantity and share of imports and countries of origin for the most important products mentioned in 3.1. If no hard data on imports are available please indicate your best informed guesses and the sources they rest on.
Priority 2: If information on imports and countries of origin are available please include it for as many products as possible.
Please indicate either the total quantity of imports or the share of import of the domestic organic market for the product or both and main countries of origin. In task 2.1 the certifying bodies are generally asked for information on import/export quantities. In this task other sources should be used.
Important certified organic products
Product group
Imports Country(ies) of origin
Sources
total quantity - tonnes
share of domestic market %
Cereals …1
3.4. How important are exported products for the domestic production of organic food, and are exports directed to EU member states?
Priority 1: Please indicate the quantity and share of exports and countries of destination for the most important products mentioned in 3.1. If no hard data on exports are available please indicate your best informed guesses and the sources they rest on.
Priority 2: If information on exports and countries of destination are available please include it for as many products as possible.
Please indicate either the total quantity of exports or the share of export of the domestic production or both together with main countries of destination. In task 2.1 the certifying bodies are generally asked for information on import/export quantities. In this task other sources should be used.
_________________________________ 1 Same list as in question 3.1.
138
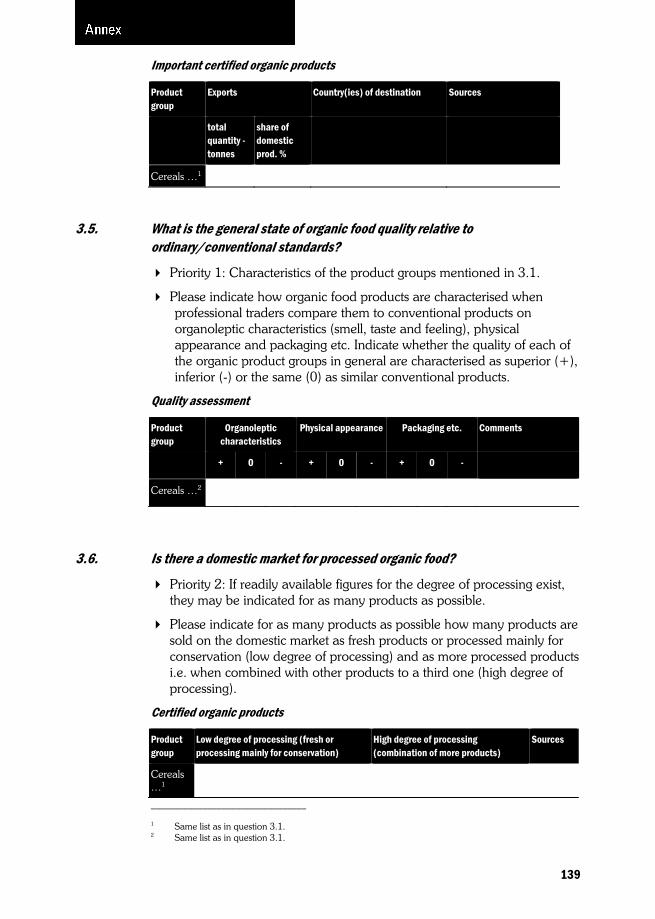
Important certified organic products
Product group
Exports Country(ies) of destination Sources
total quantity - tonnes
share of domestic prod. %
Cereals …1
3.5. What is the general state of organic food quality relative to ordinary/conventional standards?
Priority 1: Characteristics of the product groups mentioned in 3.1.
Please indicate how organic food products are characterised when professional traders compare them to conventional products on organoleptic characteristics (smell, taste and feeling), physical appearance and packaging etc. Indicate whether the quality of each of the organic product groups in general are characterised as superior (+), inferior (-) or the same (0) as similar conventional products.
Quality assessment
Product group
Organoleptic characteristics
Physical appearance Packaging etc. Comments
+ 0 - + 0 - + 0 - Cereals …2
3.6. Is there a domestic market for processed organic food?
Priority 2: If readily available figures for the degree of processing exist, they may be indicated for as many products as possible.
Please indicate for as many products as possible how many products are sold on the domestic market as fresh products or processed mainly for conservation (low degree of processing) and as more processed products i.e. when combined with other products to a third one (high degree of processing).
Certified organic products
Product group
Low degree of processing (fresh or processing mainly for conservation)
High degree of processing (combination of more products)
Sources
Cereals …1
_________________________________ 1 Same list as in question 3.1. 2 Same list as in question 3.1.
139

4. Sales channels for organic food
4.1. How important are different sales channels for the distribution of organic food products to consumers?
Priority 1: Distribution channels for the most important products mentioned in 3.1. If no hard data or studies are available, please indicate your best informed guesses and the sources they rest on.
Priority 2: If studies of the distribution of other products are available please fill in for as many products as possible.
Please indicate the approximate share (%) for each product distributed within each channel. Direct sales includes farm shops, local market trade etc. The reason for not having lines between the columns of whole food shops, specialised organic food shops and specialised shops, is that not all three categories may be present in each country and in other cases it might be impossible to distinguish between them. Please indicate all information where possible. Indicate it in the columns if data include combined information for more columns. Other comments may be put in below the table.
Important certified organic products
Product group
Channels Sources
+ + + + =
Direct sales to consumer
Specialised organic food shops
Specialised shops (bakers and butchers)
General stores incl. super/hyper-markets
Others Total
Cereals …1
_________________________________ 1 Same list as in question 3.1.
140

5. Promotion of organic food
5.1. What kind of label(s) are used to identify organic products in the domestic market and what is their share of the organic food market?
Priority 1: Fill in for types of labels which together cover at least 70% of the total market for certified organic food.
Please answer by indicating the market share of each type of label in % of total sales of organic products. One product may have more than one label and may thus be counted two or more times. If no hard data or studies are available please indicate your best informed guesses and the sources they rest on.
Labels
Label signifying Market share (%) Source
EU standards
National public certification
Organic agriculture movements
Organic farmers’ associations
Other private certifying bodies
Private label of organic business companies (retailers/wholesalers/ processing companies)
Private label of conventional business companies (retailers/wholesalers/ processing companies)
5.2. What are the most important sales arguments for organic food promoted by retailers?
Priority 2.
Please rank the 5 arguments mentioned in the table from high importance (5) to low importance (1). After that, please indicate any other important sales arguments in domestic promotion campaigns and the corresponding ranking number 1-5. If retailers nearly do not promote organic food products, please mention the main reasons for their purchasing of organic products under comments.
141
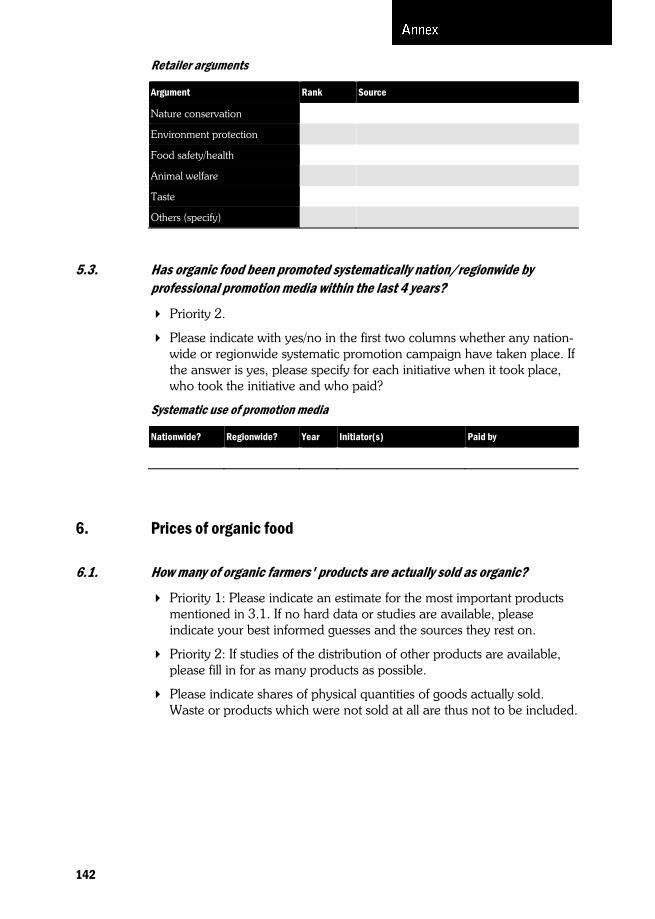
Retailer arguments
Argument Rank Source
Nature conservation
Environment protection
Food safety/health
Animal welfare
Taste
Others (specify)
5.3. Has organic food been promoted systematically nation/regionwide by professional promotion media within the last 4 years?
Priority 2.
Please indicate with yes/no in the first two columns whether any nation-wide or regionwide systematic promotion campaign have taken place. If the answer is yes, please specify for each initiative when it took place, who took the initiative and who paid?
Systematic use of promotion media
Nationwide? Regionwide? Year Initiator(s) Paid by
6. Prices of organic food
6.1. How many of organic farmers' products are actually sold as organic?
Priority 1: Please indicate an estimate for the most important products mentioned in 3.1. If no hard data or studies are available, please indicate your best informed guesses and the sources they rest on.
Priority 2: If studies of the distribution of other products are available, please fill in for as many products as possible.
Please indicate shares of physical quantities of goods actually sold. Waste or products which were not sold at all are thus not to be included.
142

Organic products sold as organic
+ =
Product group Sold as organic, %
Sold as conventional/ Non-organic, %
Total %
Sources
Cereals …1
6.2. What level of price premium are organic farmers typically receiving for their organic products as compared to conventional ones?
Priority 1: Please indicate an estimate for the most important products mentioned in 3.1. If no hard data or studies are available, please indicate your best informed guesses and the sources they rest on.
Priority 2: If studies of the distribution of other products are available, please fill in for as many products as possible.
Please indicate an estimate of typical price premiums for each product as compared to prices of non-organic products of corresponding quality. Premiums are calculated in % of conventional product price.
In task 2.3. a question on farm gate prices is posed based on available studies. Here you are kindly asked to address market experts for their knowledge of differences in farm gate prices.
Important certified organic products
Product group Typical price premiums % Sources
Cereals …2
_________________________________ 1 Same list as in question 3.1. 2 Same list as in question 3.1.
143

6.3 What level of price premium are consumers typically paying for organic food as compared to conventional food?
Priority 1: Information on the most important products as mentioned in 3.1. If no hard data or studies are available please indicate your best informed guesses and the sources they rest on.
Priority 2: If analyses are available on other products please fill in for as many products as possible.
Please indicate the size of typical consumer price premiums (%) for comparable products and sales channels. Preference should be given to results of price analyses. Indicate a %-range if necessary.
Important certified organic products
Product/group of products Typical price premiums % Sources
Cereals …1
6.4. Is there any experience with consumer reactions to different price levels on organic food?
Priority 2.
Please indicate bibliographical data on most recent and most covering studies in the attached file of references: referenc.xls and make a short summary of preconditions for studies and main findings in the space below. If no studies are available, please ask key informants about other documentation for most important products mentioned in 3.1.
_________________________________ 1 Same list as in question 3.1.
144
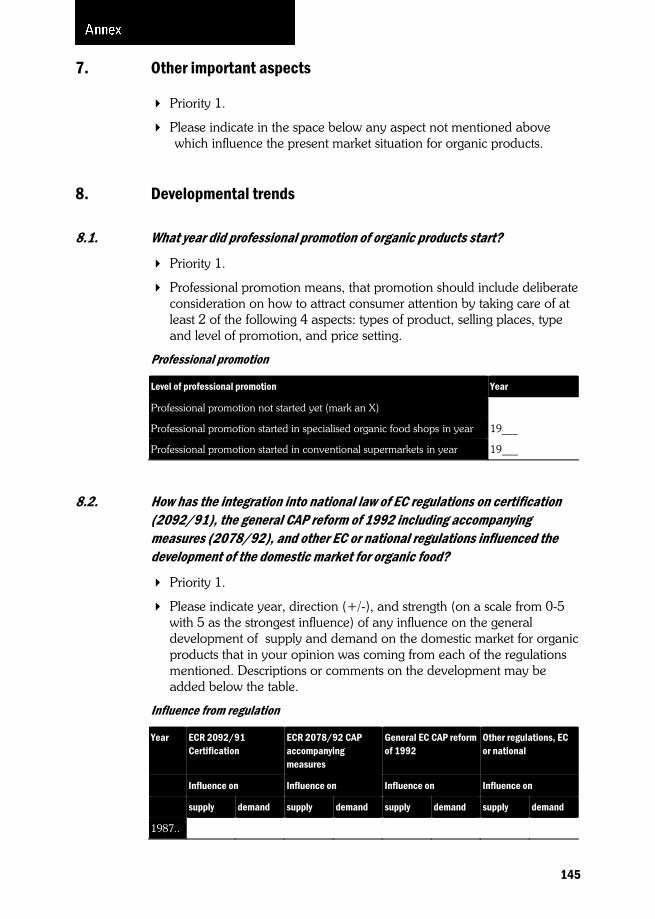
7. Other important aspects
Priority 1.
Please indicate in the space below any aspect not mentioned above which influence the present market situation for organic products.
8. Developmental trends
8.1. What year did professional promotion of organic products start?
Priority 1.
Professional promotion means, that promotion should include deliberate consideration on how to attract consumer attention by taking care of at least 2 of the following 4 aspects: types of product, selling places, type and level of promotion, and price setting.
Professional promotion
Level of professional promotion Year
Professional promotion not started yet (mark an X)
Professional promotion started in specialised organic food shops in year 19___
Professional promotion started in conventional supermarkets in year 19___
8.2. How has the integration into national law of EC regulations on certification (2092/91), the general CAP reform of 1992 including accompanying measures (2078/92), and other EC or national regulations influenced the development of the domestic market for organic food?
Priority 1.
Please indicate year, direction (+/-), and strength (on a scale from 0-5 with 5 as the strongest influence) of any influence on the general development of supply and demand on the domestic market for organic products that in your opinion was coming from each of the regulations mentioned. Descriptions or comments on the development may be added below the table.
Influence from regulation
Year ECR 2092/91 Certification
ECR 2078/92 CAP accompanying measures
General EC CAP reform of 1992
Other regulations, EC or national
Influence on Influence on Influence on Influence on
supply demand supply demand supply demand supply demand
1987..
145
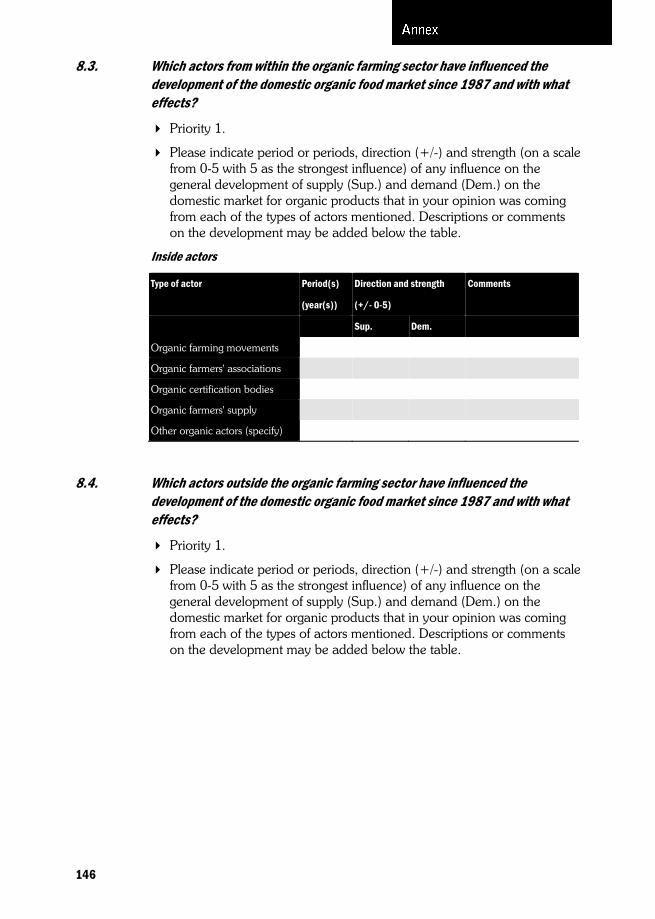
8.3. Which actors from within the organic farming sector have influenced the development of the domestic organic food market since 1987 and with what effects?
Priority 1.
Please indicate period or periods, direction (+/-) and strength (on a scale from 0-5 with 5 as the strongest influence) of any influence on the general development of supply (Sup.) and demand (Dem.) on the domestic market for organic products that in your opinion was coming from each of the types of actors mentioned. Descriptions or comments on the development may be added below the table.
Inside actors
Type of actor Period(s)
(year(s))
Direction and strength
(+/- 0-5)
Comments
Sup. Dem.
Organic farming movements
Organic farmers' associations
Organic certification bodies
Organic farmers' supply
Other organic actors (specify)
8.4. Which actors outside the organic farming sector have influenced the development of the domestic organic food market since 1987 and with what effects?
Priority 1.
Please indicate period or periods, direction (+/-) and strength (on a scale from 0-5 with 5 as the strongest influence) of any influence on the general development of supply (Sup.) and demand (Dem.) on the domestic market for organic products that in your opinion was coming from each of the types of actors mentioned. Descriptions or comments on the development may be added below the table.
146

Outside actors
Type of actor Period(s) (years)
Direction and strength (+/- 0-5)
Comments
Sup. Dem.
Major commercial firms
Non-organic farmers' unions
Consumers' demand
Organisations for nature conservation/environment protection
National marketing authorities
Agriculture public authorities
Other public authorities (specify) (the table continues)
Others (specify)
8.5. How would you describe the national organic market development in terms of the driving forces behind it?
Priority 1.
Please indicate for each year since 1987 whether in your opinion the market development was driven by Supply (marketing 'pushed' by farmers) Demand (marketing 'pulled' by consumers or retailers) Subsidy (marketing 'pushed' by EU or national subsidies)
by indicating with X' s for each year when demand, supply, or subsidies or combinations of two were more influential than the remaining two (one). Descriptions or comments on the development may be added below the table.
Driving forces
Year Supply Demand Subsidy
1987…
147
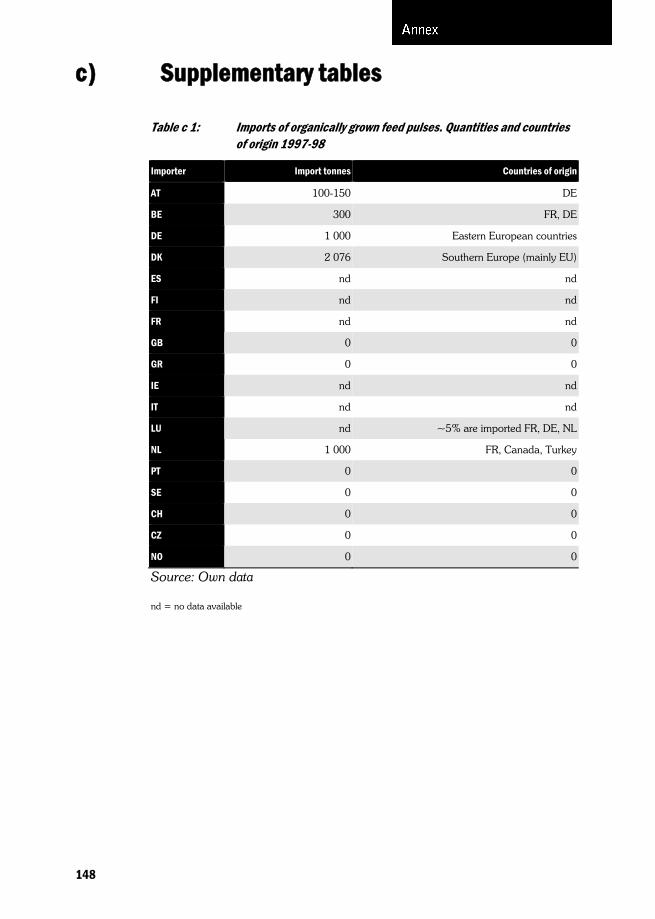
c) Supplementary tables
Table c 1: Imports of organically grown feed pulses. Quantities and countries of origin 1997-98
Importer Import tonnes Countries of origin
AT 100-150 DE
BE 300 FR, DE
DE 1 000 Eastern European countries
DK 2 076 Southern Europe (mainly EU)
ES nd nd
FI nd nd
FR nd nd
GB 0 0
GR 0 0
IE nd nd
IT nd nd
LU nd ~5% are imported FR, DE, NL
NL 1 000 FR, Canada, Turkey
PT 0 0
SE 0 0
CH 0 0
CZ 0 0
NO 0 0
Source: Own data
nd = no data available
148
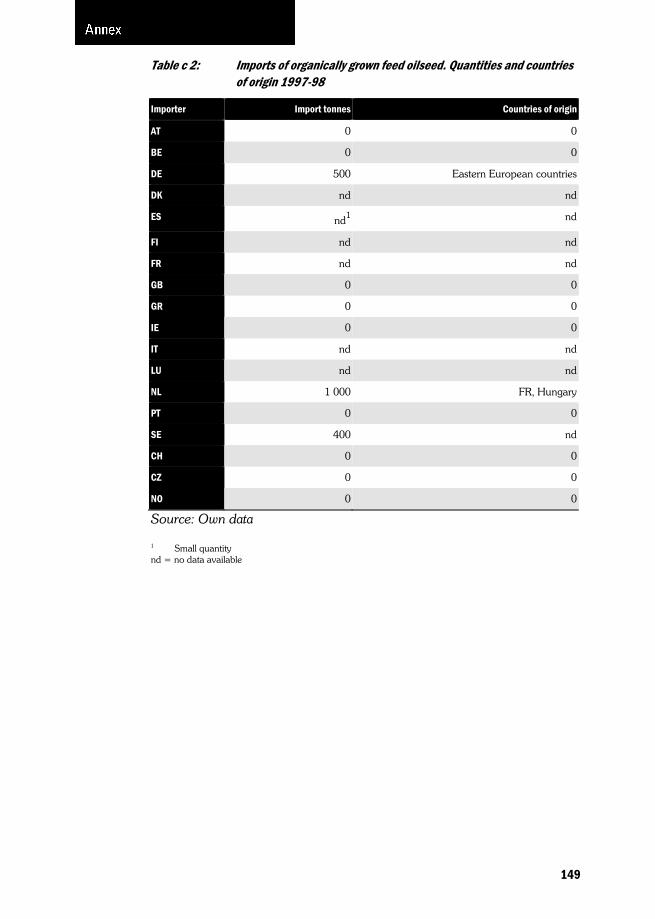
Table c 2: Imports of organically grown feed oilseed. Quantities and countries of origin 1997-98
Importer Import tonnes Countries of origin
AT 0 0
BE 0 0
DE 500 Eastern European countries
DK nd nd
ES nd1 nd
FI nd nd
FR nd nd
GB 0 0
GR 0 0
IE 0 0
IT nd nd
LU nd nd
NL 1 000 FR, Hungary
PT 0 0
SE 400 nd
CH 0 0
CZ 0 0
NO 0 0
Source: Own data
1 Small quantity nd = no data available
149

Table c 3: Export of organically grown feed cereals. Quantities and countries of destination 1997-98
Exporter Export tonnes Countries of destination
AT 250-500 DE
BE 0 0
DE 10 000 AT, DK, CH, NL
DK 0 0
ES nd nd
FI 100 FR
FR 0 0
GB 0 0
GR 0 0
IE 0 0
IT nd nd
LU nd nd
NL 1 250 AT, DE
PT 0 0
SE 8 000 nd
CH 0 0
CZ 0 0
NO 0 0
Source: Own data
nd = no data available
150
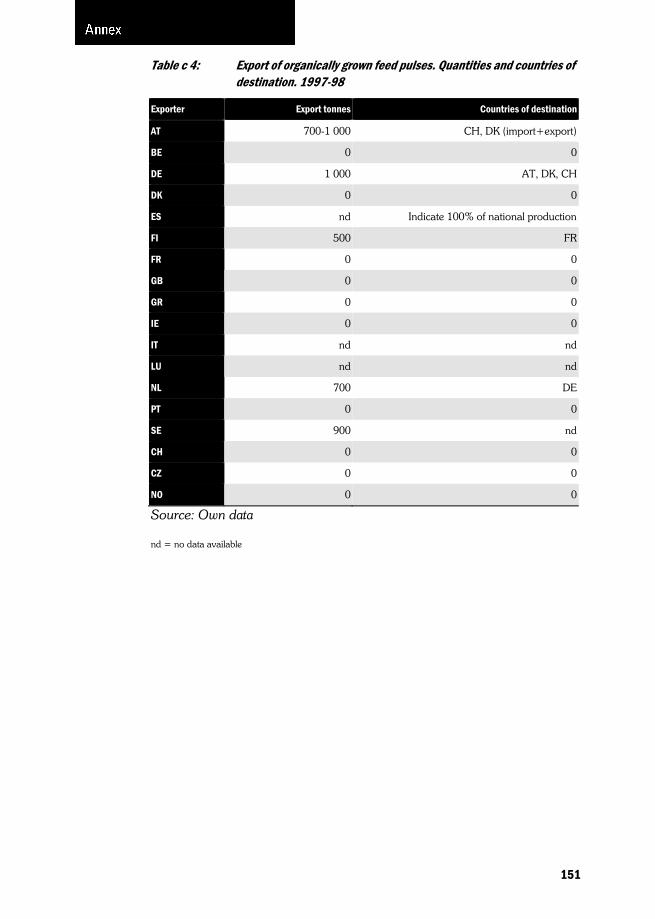
Table c 4: Export of organically grown feed pulses. Quantities and countries of destination. 1997-98
Exporter Export tonnes Countries of destination
AT 700-1 000 CH, DK (import+export)
BE 0 0
DE 1 000 AT, DK, CH
DK 0 0
ES nd Indicate 100% of national production
FI 500 FR
FR 0 0
GB 0 0
GR 0 0
IE 0 0
IT nd nd
LU nd nd
NL 700 DE
PT 0 0
SE 900 nd
CH 0 0
CZ 0 0
NO 0 0
Source: Own data
nd = no data available
151
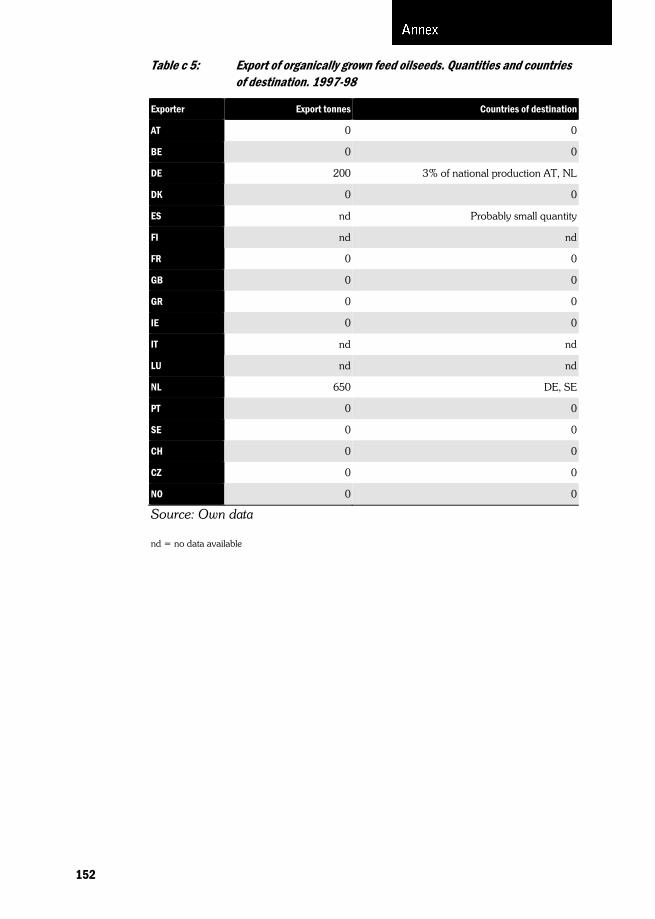
Table c 5: Export of organically grown feed oilseeds. Quantities and countries of destination. 1997-98
Exporter Export tonnes Countries of destination
AT 0 0
BE 0 0
DE 200 3% of national production AT, NL
DK 0 0
ES nd Probably small quantity
FI nd nd
FR 0 0
GB 0 0
GR 0 0
IE 0 0
IT nd nd
LU nd nd
NL 650 DE, SE
PT 0 0
SE 0 0
CH 0 0
CZ 0 0
NO 0 0
Source: Own data
nd = no data available
152

Table c 6: Certified organic food oilseeds. Importance, growth, and market share 1997-98
Importance. Rank
Approximate growth rate/year for sales since 1993. Percentage
Current share of total domestic food market. Percentage
AT >5 nd nd
BE 5 10 nd
DE >5 8 0.21 /0.32
DK >5 nd nd
ES 7 nd nd
FI >5 nd nd
FR >5 nd nd
GB >5 nd nd
GR 1 50 203
IE >5 nd nd
IT 5 5 53
LU >5 nd nd
NL >9 nd nd
PT 2 nd 0.4
SE >5 nd nd
CH 12 nd nd
CZ 3 30 2-33
NO >5 nd nd
Source: Own data
Note: >5 = Response given for the 5 most important groups, among which this product was not included 1 Share of quantities 2 Share of turnover.
3 Share or turnover of organic market only. In Italy, the turnover of organic food is estimated to cover 1.1 per cent of total food sector turnover.
nd = no data available
153
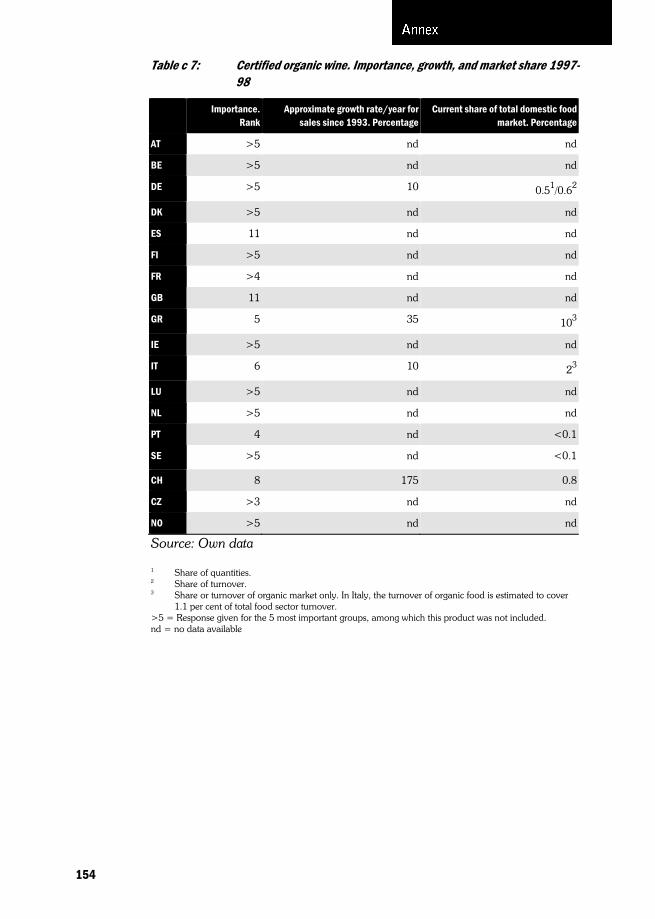
Table c 7: Certified organic wine. Importance, growth, and market share 1997-98
Importance. Rank
Approximate growth rate/year for sales since 1993. Percentage
Current share of total domestic food market. Percentage
AT >5 nd nd
BE >5 nd nd
DE >5 10 0.51/0.62
DK >5 nd nd
ES 11 nd nd
FI >5 nd nd
FR >4 nd nd
GB 11 nd nd
GR 5 35 103
IE >5 nd nd
IT 6 10 23
LU >5 nd nd
NL >5 nd nd
PT 4 nd <0.1
SE >5 nd <0.1
CH 8 175 0.8
CZ >3 nd nd
NO >5 nd nd
Source: Own data
1 Share of quantities.
2 Share of turnover.
3 Share or turnover of organic market only. In Italy, the turnover of organic food is estimated to cover 1.1 per cent of total food sector turnover.
>5 = Response given for the 5 most important groups, among which this product was not included. nd = no data available
154
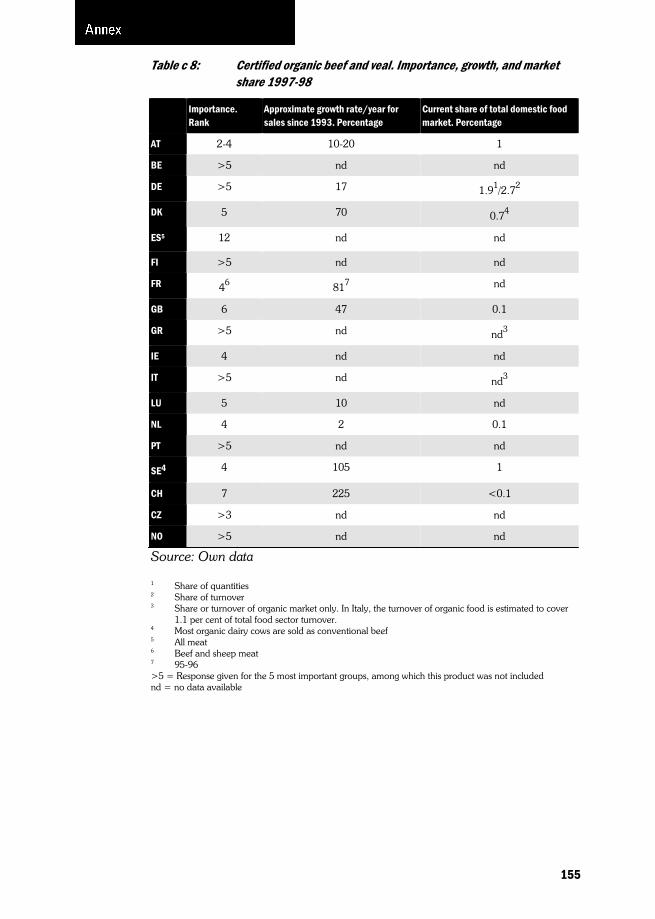
Table c 8: Certified organic beef and veal. Importance, growth, and market share 1997-98
Importance. Rank
Approximate growth rate/year for sales since 1993. Percentage
Current share of total domestic food market. Percentage
AT 2-4 10-20 1
BE >5 nd nd
DE >5 17 1.91/2.72
DK 5 70 0.74
ES5 12 nd nd
FI >5 nd nd
FR 46 817 nd
GB 6 47 0.1
GR >5 nd nd3
IE 4 nd nd
IT >5 nd nd3
LU 5 10 nd
NL 4 2 0.1
PT >5 nd nd
SE4 4 105 1
CH 7 225 <0.1
CZ >3 nd nd
NO >5 nd nd
Source: Own data
1 Share of quantities
2 Share of turnover
3 Share or turnover of organic market only. In Italy, the turnover of organic food is estimated to cover 1.1 per cent of total food sector turnover.
4 Most organic dairy cows are sold as conventional beef 5 All meat 6 Beef and sheep meat 7 95-96 >5 = Response given for the 5 most important groups, among which this product was not included nd = no data available
155
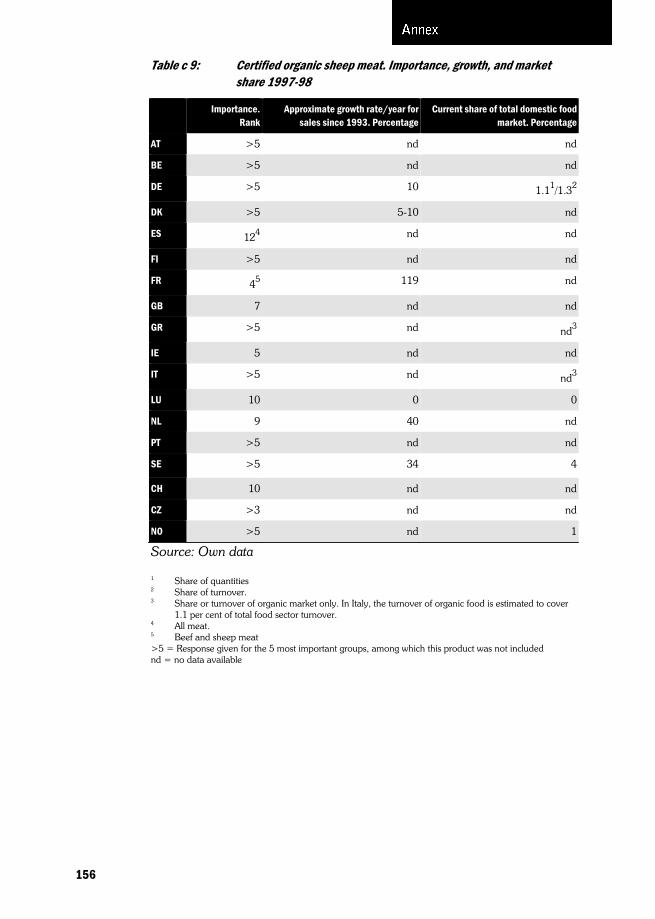
Table c 9: Certified organic sheep meat. Importance, growth, and market share 1997-98
Importance. Rank
Approximate growth rate/year for sales since 1993. Percentage
Current share of total domestic food market. Percentage
AT >5 nd nd
BE >5 nd nd
DE >5 10 1.11/1.32
DK >5 5-10 nd
ES 124 nd nd
FI >5 nd nd
FR 45 119 nd
GB 7 nd nd
GR >5 nd nd3
IE 5 nd nd
IT >5 nd nd3
LU 10 0 0
NL 9 40 nd
PT >5 nd nd
SE >5 34 4
CH 10 nd nd
CZ >3 nd nd
NO >5 nd 1
Source: Own data
1 Share of quantities 2 Share of turnover.
3 Share or turnover of organic market only. In Italy, the turnover of organic food is estimated to cover 1.1 per cent of total food sector turnover.
4 All meat.
5 Beef and sheep meat >5 = Response given for the 5 most important groups, among which this product was not included nd = no data available
156
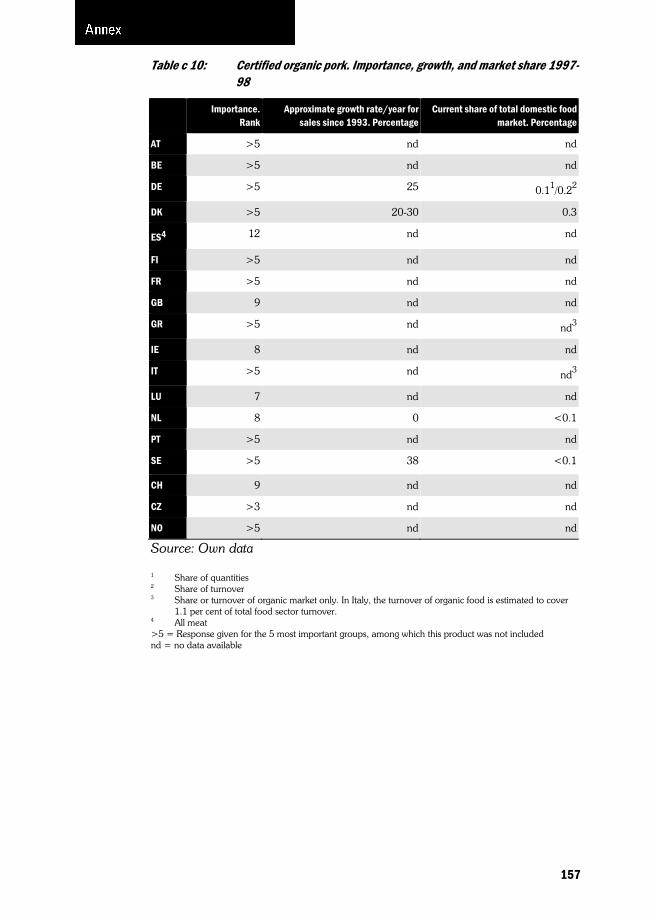
Table c 10: Certified organic pork. Importance, growth, and market share 1997-98
Importance. Rank
Approximate growth rate/year for sales since 1993. Percentage
Current share of total domestic food market. Percentage
AT >5 nd nd
BE >5 nd nd
DE >5 25 0.11/0.22
DK >5 20-30 0.3
ES4 12 nd nd
FI >5 nd nd
FR >5 nd nd
GB 9 nd nd
GR >5 nd nd3
IE 8 nd nd
IT >5 nd nd3
LU 7 nd nd
NL 8 0 <0.1
PT >5 nd nd
SE >5 38 <0.1
CH 9 nd nd
CZ >3 nd nd
NO >5 nd nd
Source: Own data
1 Share of quantities 2 Share of turnover 3 Share or turnover of organic market only. In Italy, the turnover of organic food is estimated to cover
1.1 per cent of total food sector turnover. 4 All meat >5 = Response given for the 5 most important groups, among which this product was not included nd = no data available
157

Table c 11: Certified organic poultry. Importance, growth, and market share 1997-98
Importance. Rank
Approximate growth rate/year for sales since 1993. Percentage
Current share of total domestic food market. Percentage
AT >5 nd nd
BE >5 nd nd
DE >5 30 0.11/0.22
DK >5 nd <1
ES4 12 nd nd
FI >5 nd nd
FR >5 nd nd
GB 10 nd nd
GR >5 nd nd3
IE 9 nd nd
IT >5 nd nd3
LU 8 nd nd
NL >5 nd nd
PT >5 nd nd
SE >5 125 <1
CH 11 nd nd
CZ >3 nd nd
NO >5 nd nd
Source: Own data
1 Share of quantities 2 Share of turnover 3 Share or turnover of organic market only. In Italy, the turnover of organic food is estimated to cover
1.1 per cent of total food sector turnover. 4 All meat >5 = Response given for the 5 most important groups, among which this product was not included nd = no data available
158

Table c 12: Certified organic eggs. Importance, growth, and market share 1997-98
Importance. Rank
Approximate growth rate/year for sales since 1993. Percentage
Current share of total domestic food market. Percentage
AT 5 20-30 nd
BE >5 nd nd
DE >5 30 0.51/0.72
DK 4 80 4.9
ES 4 nd nd
FI >5 nd nd
FR >5 nd nd
GB 8 nd nd
GR >5 nd nd3
IE 10 nd nd
IT 7 20 13
LU 9 nd 0-52
NL 7 0 0
PT >5 nd nd
SE 5 119 1
CH 6 75 0.4
CZ >3 nd nd
NO >5 nd nd
Source: Own data
1 Share of quantities 2 Share of turnover 3 Share or turnover of organic market only. In Italy, the turnover of organic food is estimated to cover
1.1 per cent of total food sector turnover. >5 = Response given for the 5 most important groups, among which this product was not included nd = no data available
159
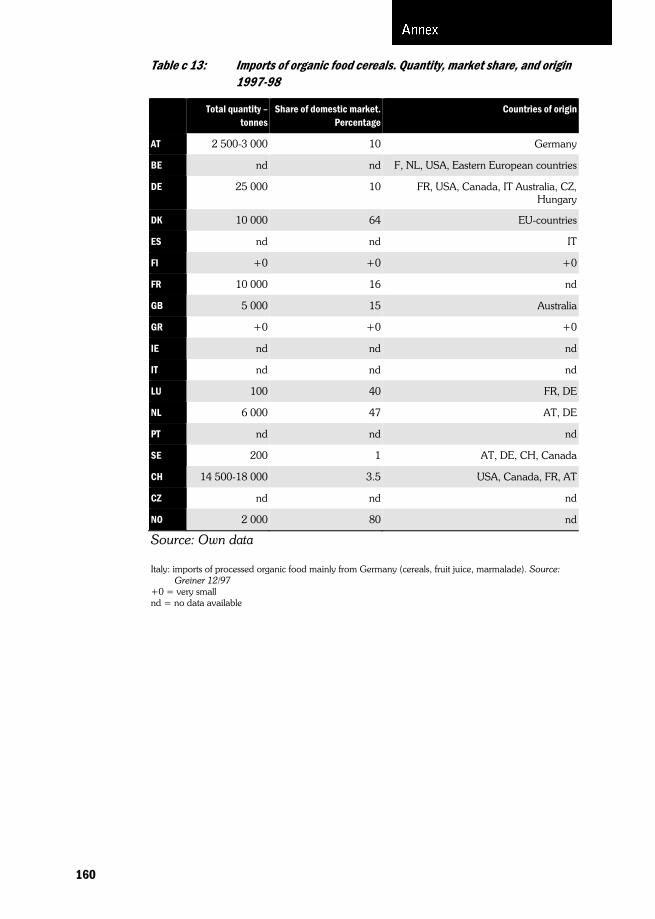
Table c 13: Imports of organic food cereals. Quantity, market share, and origin 1997-98
Total quantity – tonnes
Share of domestic market. Percentage
Countries of origin
AT 2 500-3 000 10 Germany
BE nd nd F, NL, USA, Eastern European countries
DE 25 000 10 FR, USA, Canada, IT Australia, CZ, Hungary
DK 10 000 64 EU-countries
ES nd nd IT
FI +0 +0 +0
FR 10 000 16 nd
GB 5 000 15 Australia
GR +0 +0 +0
IE nd nd nd
IT nd nd nd
LU 100 40 FR, DE
NL 6 000 47 AT, DE
PT nd nd nd
SE 200 1 AT, DE, CH, Canada
CH 14 500-18 000 3.5 USA, Canada, FR, AT
CZ nd nd nd
NO 2 000 80 nd
Source: Own data
Italy: imports of processed organic food mainly from Germany (cereals, fruit juice, marmalade). Source: Greiner 12/97
+0 = very small nd = no data available
160

Table c 14: Imports of organic food oilseeds (including olives). Quantity, market share, and origin 1997-98
Total quantity – tonnes
Share of domestic market. Percentage
Countries of origin
AT nd nd nd
BE nd nd nd
DE 8 000 50 USA, Canada, Hungary, FR, PT, ES, IT
DK nd 100 EU-countries
ES nd nd nd
FI nd nd nd
FR nd nd nd
GB nd nd nd
GR nd nd nd
IE nd nd nd
IT nd nd nd
LU 1 100 Greece via Germany
NL nd nd nd
PT nd nd nd
SE 0 0 0
CH 80-100 99 Canada, USA
CZ nd nd nd
NO nd nd nd
Source: Own data
nd = no data available
161
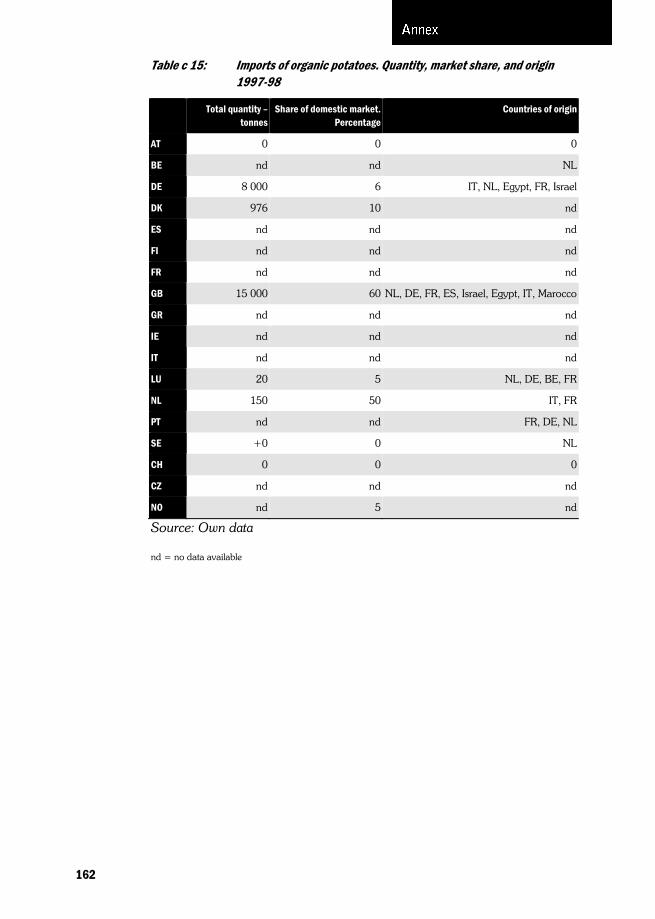
Table c 15: Imports of organic potatoes. Quantity, market share, and origin 1997-98
Total quantity – tonnes
Share of domestic market. Percentage
Countries of origin
AT 0 0 0
BE nd nd NL
DE 8 000 6 IT, NL, Egypt, FR, Israel
DK 976 10 nd
ES nd nd nd
FI nd nd nd
FR nd nd nd
GB 15 000 60 NL, DE, FR, ES, Israel, Egypt, IT, Marocco
GR nd nd nd
IE nd nd nd
IT nd nd nd
LU 20 5 NL, DE, BE, FR
NL 150 50 IT, FR
PT nd nd FR, DE, NL
SE +0 0 NL
CH 0 0 0
CZ nd nd nd
NO nd 5 nd
Source: Own data
nd = no data available
162

Table c 16: Imports of organic vegetables. Quantity, market share, and origin 1997-98
Total quantity – tonnes
Share of domestic market %
Countries of origin
AT 100 nd IT
BE nd nd NL, FR, Israel, ES, IE, Argentina
DE 40 000 36 FR, IT, ES, NL, Israel, GR, Hungary, BE, DK
DK 4 000 25 EU, Israel
ES nd nd FR, DE
FI nd nd nd
FR nd nd nd
GB1 64 520 70 nd
GR nd nd nd
IE nd nd nd
IT nd nd nd
LU 200 80 NL, DE, BE, FR
NL nd nd nd
PT nd nd FR, DE, NL
SE 100-150 5-10 NL, IT, DK, Israel, Argentina
CH 530-1 000 10 IT, FR, ES
CZ nd nd nd
NO 500 40 DK, NL, SE
Source: Own data
1 Countries of origin: Many nd = no data available
163
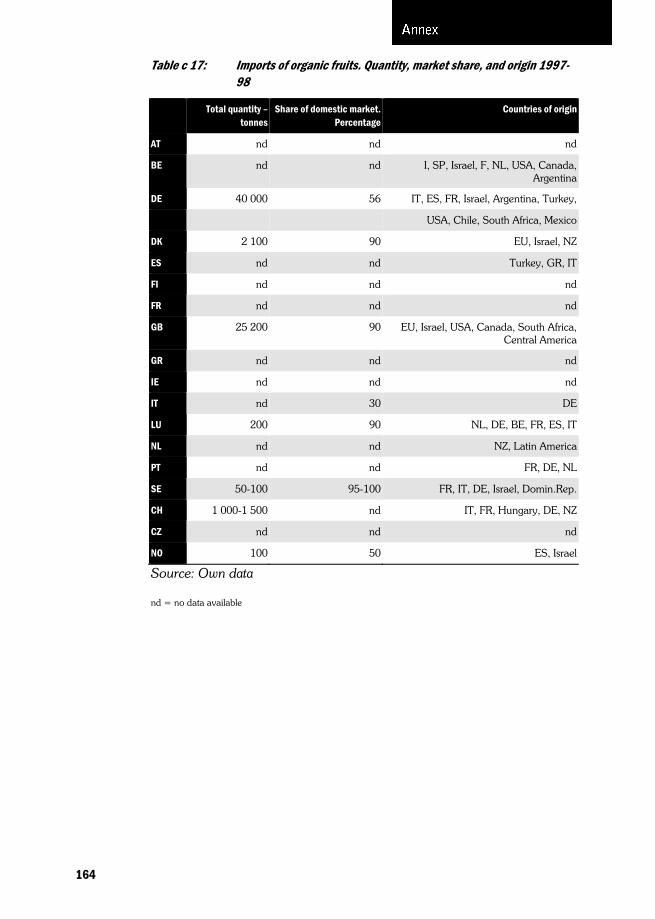
Table c 17: Imports of organic fruits. Quantity, market share, and origin 1997-98
Total quantity – tonnes
Share of domestic market. Percentage
Countries of origin
AT nd nd nd
BE nd nd I, SP, Israel, F, NL, USA, Canada, Argentina
DE 40 000 56 IT, ES, FR, Israel, Argentina, Turkey,
USA, Chile, South Africa, Mexico
DK 2 100 90 EU, Israel, NZ
ES nd nd Turkey, GR, IT
FI nd nd nd
FR nd nd nd
GB 25 200 90 EU, Israel, USA, Canada, South Africa, Central America
GR nd nd nd
IE nd nd nd
IT nd 30 DE
LU 200 90 NL, DE, BE, FR, ES, IT
NL nd nd NZ, Latin America
PT nd nd FR, DE, NL
SE 50-100 95-100 FR, IT, DE, Israel, Domin.Rep.
CH 1 000-1 500 nd IT, FR, Hungary, DE, NZ
CZ nd nd nd
NO 100 50 ES, Israel
Source: Own data
nd = no data available
164
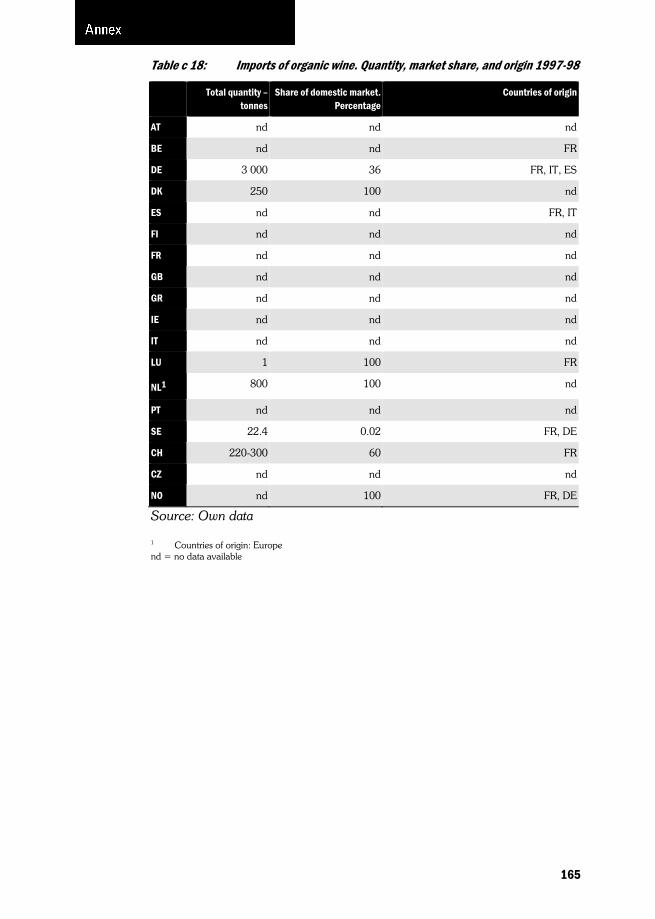
Table c 18: Imports of organic wine. Quantity, market share, and origin 1997-98
Total quantity – tonnes
Share of domestic market. Percentage
Countries of origin
AT nd nd nd
BE nd nd FR
DE 3 000 36 FR, IT, ES
DK 250 100 nd
ES nd nd FR, IT
FI nd nd nd
FR nd nd nd
GB nd nd nd
GR nd nd nd
IE nd nd nd
IT nd nd nd
LU 1 100 FR
NL1 800 100 nd
PT nd nd nd
SE 22.4 0.02 FR, DE
CH 220-300 60 FR
CZ nd nd nd
NO nd 100 FR, DE
Source: Own data
1 Countries of origin: Europe nd = no data available
165

Table c 19: Imports of organic milk products. Quantity, market share, and origin 1997-98
Total quantity – tonnes
Share of domestic market. Percentage
Countries of origin
AT 50 nd DE
BE 4 500 nd NL, DE
DE1 8 000 6 FR, IT, DK, NL
DK 0 0 0
ES nd nd nd
FI nd nd nd
FR 10 000-15 000 20 DE
GB 3 000 12 NL
GR nd nd nd
IE nd nd nd
IT nd 80 DE, AT
LU 100 50 DE
NL nd nd nd
PT nd nd FR
SE1 +0 <1 DK
CH 0 0 0
CZ nd nd nd
NO1 nd 100 DK
Source: Own data
1 DE, SE and NO indicate cheese imports nd = no data available
166

Table c 20: Imports of organic beef (including veal). Quantity, market share, and origin 1997-98
Total quantity – tonnes
Share of domestic market. Percentage
Countries of origin
AT nd nd nd
BE 50 nd NL, FR
DE 200 1 AT
DK 0 0 0
ES nd nd nd
FI nd nd nd
FR nd nd nd
GB 24 3 EU
GR nd nd nd
IE nd nd nd
IT nd nd nd
LU 0 0 0
NL nd nd nd
PT nd nd nd
SE 0 0 0
CH 0 0 0
CZ nd nd nd
NO nd nd nd
Source: Own data
nd = no data available
167
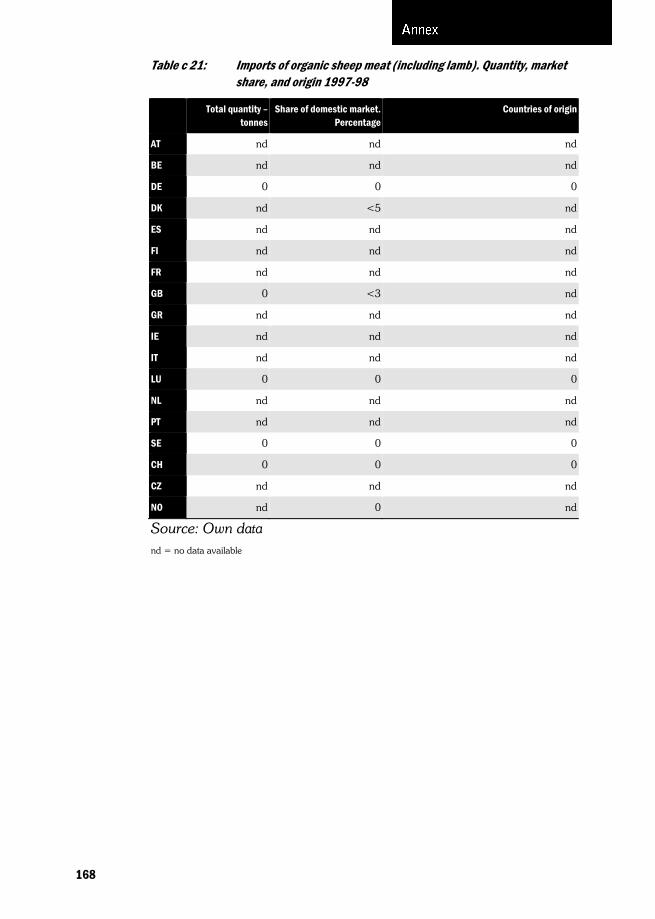
Table c 21: Imports of organic sheep meat (including lamb). Quantity, market share, and origin 1997-98
Total quantity – tonnes
Share of domestic market. Percentage
Countries of origin
AT nd nd nd
BE nd nd nd
DE 0 0 0
DK nd <5 nd
ES nd nd nd
FI nd nd nd
FR nd nd nd
GB 0 <3 nd
GR nd nd nd
IE nd nd nd
IT nd nd nd
LU 0 0 0
NL nd nd nd
PT nd nd nd
SE 0 0 0
CH 0 0 0
CZ nd nd nd
NO nd 0 nd
Source: Own data nd = no data available
168

Table c 22: Imports of organic pork. Quantity, market share, and origin 1997-98
Total quantity – tonnes
Share of domestic market. Percentage
Countries of origin
AT nd nd nd
BE 110 nd NL
DE 0 0 0
DK 41 10 nd
ES nd nd nd
FI nd nd nd
FR nd nd nd
GB nd nd nd
GR nd nd nd
IE nd nd nd
IT nd nd nd
LU 0 0 0
NL nd nd nd
PT nd nd nd
SE 0 0 0
CH 0 0 0
CZ nd nd nd
NO nd nd nd
Source: Own data nd = no data available
169
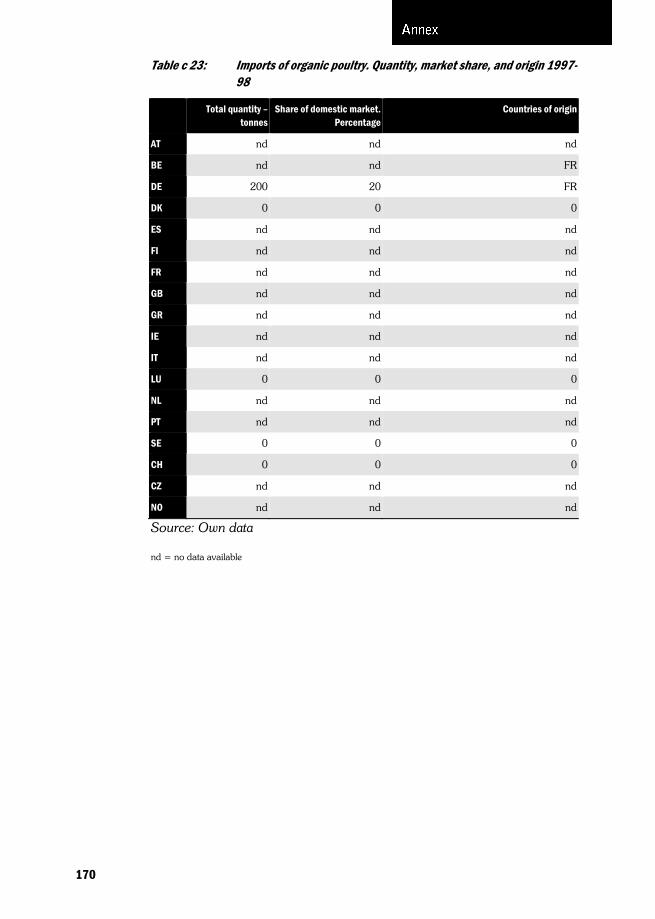
Table c 23: Imports of organic poultry. Quantity, market share, and origin 1997-98
Total quantity – tonnes
Share of domestic market. Percentage
Countries of origin
AT nd nd nd
BE nd nd FR
DE 200 20 FR
DK 0 0 0
ES nd nd nd
FI nd nd nd
FR nd nd nd
GB nd nd nd
GR nd nd nd
IE nd nd nd
IT nd nd nd
LU 0 0 0
NL nd nd nd
PT nd nd nd
SE 0 0 0
CH 0 0 0
CZ nd nd nd
NO nd nd nd
Source: Own data
nd = no data available
170

Table c 24: Imports of organic eggs. Quantity, market share, and origin 1997-98
Total quantity – tonnes
Share of domestic market. Percentage
Countries of origin
AT 0 0 0
BE nd nd NL, FR
DE 191 20 FR, NL, DK
DK 15 <1 DE
ES nd nd nd
FI 0 0 0
FR nd nd nd
GB nd nd nd
GR nd nd nd
IE nd nd nd
IT nd 20 AT
LU 122 80 NL
NL nd nd nd
PT nd nd nd
SE 0 0 0
CH 1302 nd nd
CZ nd nd nd
NO nd nd nd
Source: Own data
1 Mill. eggs 2 1 000 eggs nd = no data available
171
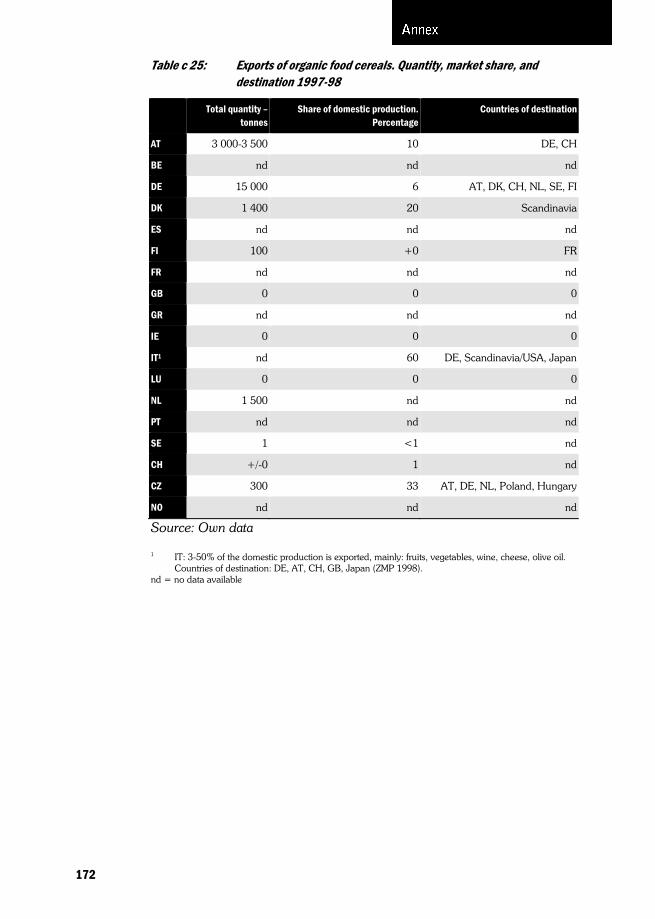
Table c 25: Exports of organic food cereals. Quantity, market share, and destination 1997-98
Total quantity – tonnes
Share of domestic production. Percentage
Countries of destination
AT 3 000-3 500 10 DE, CH
BE nd nd nd
DE 15 000 6 AT, DK, CH, NL, SE, FI
DK 1 400 20 Scandinavia
ES nd nd nd
FI 100 +0 FR
FR nd nd nd
GB 0 0 0
GR nd nd nd
IE 0 0 0
IT1 nd 60 DE, Scandinavia/USA, Japan
LU 0 0 0
NL 1 500 nd nd
PT nd nd nd
SE 1 <1 nd
CH +/-0 1 nd
CZ 300 33 AT, DE, NL, Poland, Hungary
NO nd nd nd
Source: Own data
1 IT: 3-50% of the domestic production is exported, mainly: fruits, vegetables, wine, cheese, olive oil. Countries of destination: DE, AT, CH, GB, Japan (ZMP 1998).
nd = no data available
172

Table c 26: Exports of organic food oilseeds (including olives). Quantity, market share, and destination 1997-98
Total quantity – tonnes
Share of domestic production. Percentage
Countries of destination
AT nd nd nd
BE nd nd nd
DE 200 3 BE
DK 0 0 0
ES 1 500 90 EU, USA, Japan
FI 0 0 nd
FR nd nd nd
GB nd nd nd
GR 300 80 DE, GB, DK, IT, SE
IE 0 0 0
IT1 nd 70-80 EU, Japan
LU 0 0 0
NL 650 20 nd
PT 40-45 25 FR, DE
SE 0 0 0
CH nd 0 nd
CZ nd nd nd
NO nd nd nd
Source: Own data
1 IT: 3-50% of the domestic production is exported, mainly: fruits, vegetables, wine, cheese, olive oil. Countries of destination: DE, AT, CH, GB, Japan (ZMP 1998).
nd = no data available
173

Table c 27: Exports of organic potatoes. Quantity, market share, and destination 1997-98
Total quantity – tonnes
Share of domestic production. Percentage
Countries of destination
AT 4 000 40 DE, IT, GB, CH
BE nd nd FR
DE 1 000 1 GB, CH, DK
DK 28 <1 nd
ES nd nd nd
FI nd nd nd
FR nd nd nd
GB 0 0 0
GR nd nd nd
IE 0 0 0
IT nd nd nd
LU 0 0 0
NL 1 000 80 FR, GB, DE, DK
PT 60 80 nd
SE 25 <1 NO
CH nd nd nd
CZ nd nd nd
NO nd nd nd
Source: Own data
nd = no data available
174

Table c 28: Exports of organic vegetables. Quantity, market share, and destination 1997-98
Total quantity – tonnes
Share of domestic production. Percentage
Countries of destination
AT nd nd nd
BE nd nd NL, DE, GB
DE 1 000 1 GB, NL, CH, DK
DK 3 900 25 DE, GB, Scandinavia
ES1 nd 90 EU
FI nd nd nd
FR nd nd nd
GB 0 0 0
GR 8 nd DE
IE 0 0 0
IT nd 50 AT, DE, Scandinavia
LU 0 0 0
NL nd 60-70 DE, DK, BE, GB
PT 60-100 33 FR, DE, GB
SE 30 <1 DK, NO
CH2 1 200-1 500 +0 AT, DE, Scandinavia, USA
CZ nd nd nd
NO nd nd nd
Source: Own data
1 ES: Agra-Europe No 31/97, Länderberichte: 75% of domestic production is exported, mainly: fruits, vegetables
2 CH: export of fruit juice = 80 % nd = no data available
175

Table c 29: Exports of organic fruits. Quantity, market share, and destination 1997-98
Total quantity – tonnes
Share of domestic production. Percentage
Countries of destination
AT nd nd nd
BE nd nd NL, DE, GB
DE 1 000 3 GB, CH, DK, SE, NL
DK 0 0 0
ES1 nd 90-95 EU, CH
FI 0 0 0
FR nd nd nd
GB 0 0 0
GR2 30 80 DE, GB
IE 0 0 0
IT3 2 000 70-80 DE, GB
LU 0 0 0
NL nd 50 DE, GB, AT, CH
PT nd nd FR, DE
SE 0 0 0
CH nd nd nd
CZ nd nd nd
NO nd nd nd
Source: Own data
1 ES: Agra-Europe No 31/97, Länderberichte: 75% of domestic production is exported, mainly: fruits, vegetables.
2 GR: Citrusfruits, currants, grapes, walnuts, almonds. Source: German importers and Van der Smissen et al. (1998)
3 IT: Greiner (1998) nd = no data available
176
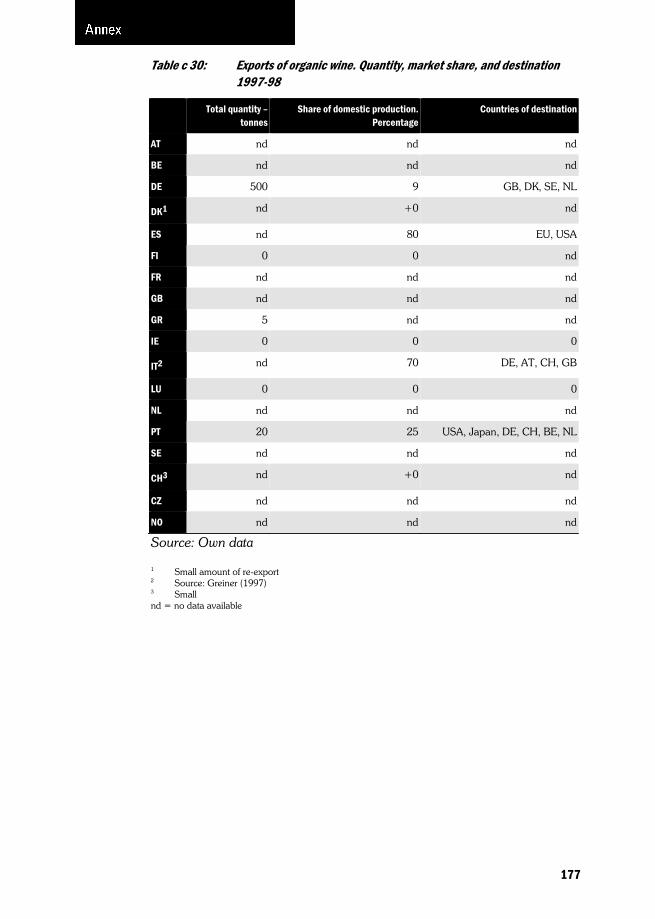
Table c 30: Exports of organic wine. Quantity, market share, and destination 1997-98
Total quantity – tonnes
Share of domestic production. Percentage
Countries of destination
AT nd nd nd
BE nd nd nd
DE 500 9 GB, DK, SE, NL
DK1 nd +0 nd
ES nd 80 EU, USA
FI 0 0 nd
FR nd nd nd
GB nd nd nd
GR 5 nd nd
IE 0 0 0
IT2 nd 70 DE, AT, CH, GB
LU 0 0 0
NL nd nd nd
PT 20 25 USA, Japan, DE, CH, BE, NL
SE nd nd nd
CH3 nd +0 nd
CZ nd nd nd
NO nd nd nd
Source: Own data
1 Small amount of re-export 2 Source: Greiner (1997) 3 Small nd = no data available
177

Table c 31: Exports of organic milk products. Quantity, market share, and destination 1997-98
Total quantity – tonnes
Share of domestic production. Percentage
Countries of destination
AT 30 000-50 000 10-15 DE, IT
BE 3 000 nd FR
DE 3 000 2 GB, IT, DK
DK 232 0.2 DE, GB, SE
ES 0 0 0
FI 0 0 0
FR nd nd nd
GB 0 0 0
GR nd nd nd
IE 0 0 0
IT1 nd 70 DE, AT, CH
LU 0 0 0
NL nd nd nd
PT nd nd nd
SE3 nd2 nd GB
CH nd2 +0 nd
CZ nd nd nd
NO nd nd nd
Source: Own data
1 Cheese 2 Small. 3 Milkpowder nd = no data available
178
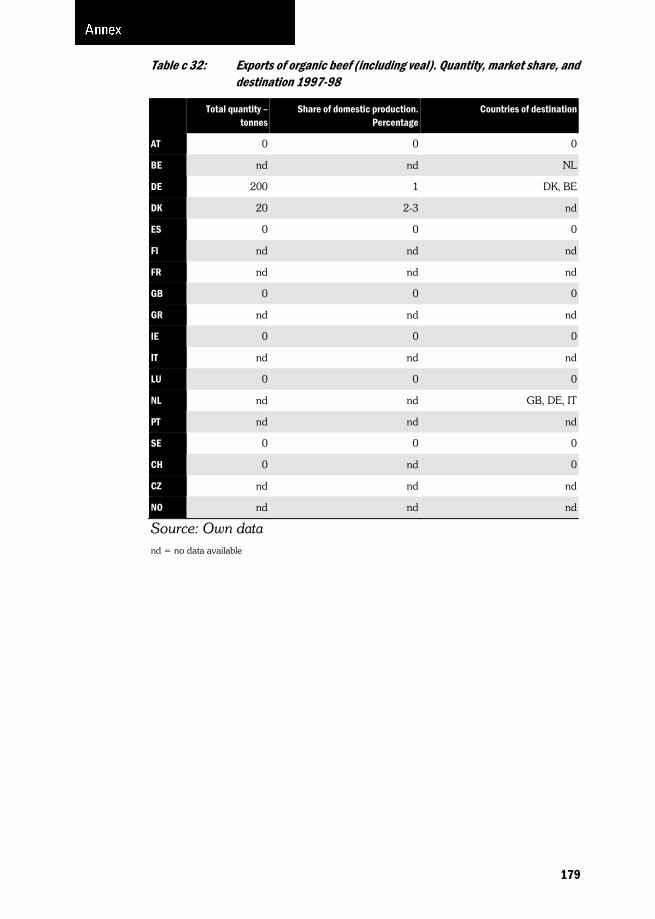
Table c 32: Exports of organic beef (including veal). Quantity, market share, and destination 1997-98
Total quantity – tonnes
Share of domestic production. Percentage
Countries of destination
AT 0 0 0
BE nd nd NL
DE 200 1 DK, BE
DK 20 2-3 nd
ES 0 0 0
FI nd nd nd
FR nd nd nd
GB 0 0 0
GR nd nd nd
IE 0 0 0
IT nd nd nd
LU 0 0 0
NL nd nd GB, DE, IT
PT nd nd nd
SE 0 0 0
CH 0 nd 0
CZ nd nd nd
NO nd nd nd
Source: Own data nd = no data available
179

Table c 33: Exports of organic sheep meat (including lamb). Quantity, market share, and destination 1997-98
Total quantity – tonnes
Share of domestic production. Percentage
Countries of destination
AT nd nd nd
BE nd nd nd
DE 0 0 0
DK 0 0 0
ES 0 0 0
FI 0 0 0
FR nd nd nd
GB 0 0 0
GR nd nd nd
IE 0 0 0
IT nd nd nd
LU 0 0 0
NL nd nd nd
PT nd nd nd
SE 0 0 0
CH nd nd nd
CZ nd nd nd
NO nd nd nd
Source: Own data
nd = no data available
180

Table c 34: Exports of organic pork. Quantity, market share, and destination 1997-98
Total quantity –tonnes
Share of domestic production. Percentage
Countries of destination
AT nd nd nd
BE nd nd NL
DE 0 0 0
DK 0 0 0
ES 0 0 0
FI nd nd nd
FR nd nd nd
GB nd nd nd
GR nd nd nd
IE 0 0 0
IT nd nd nd
LU 0 0 0
NL nd nd nd
PT nd nd nd
SE 60 nd GB
CH nd nd nd
CZ nd nd nd
NO nd nd nd
Source: Own data
nd = no data available
181
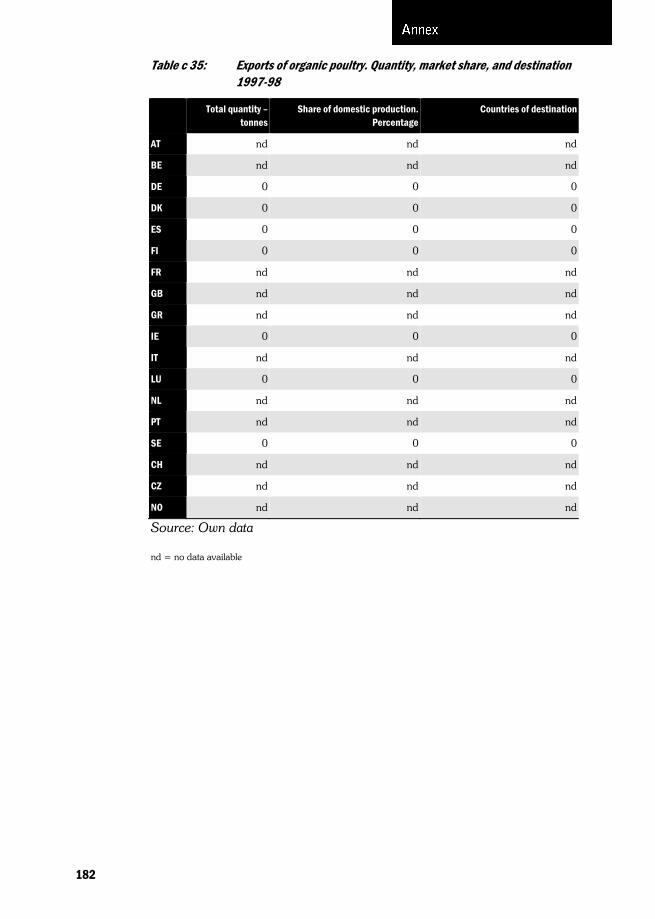
Table c 35: Exports of organic poultry. Quantity, market share, and destination 1997-98
Total quantity – tonnes
Share of domestic production. Percentage
Countries of destination
AT nd nd nd
BE nd nd nd
DE 0 0 0
DK 0 0 0
ES 0 0 0
FI 0 0 0
FR nd nd nd
GB nd nd nd
GR nd nd nd
IE 0 0 0
IT nd nd nd
LU 0 0 0
NL nd nd nd
PT nd nd nd
SE 0 0 0
CH nd nd nd
CZ nd nd nd
NO nd nd nd
Source: Own data
nd = no data available
182

Table c 36: Exports of organic eggs. Quantity, market share, and destination 1997-98
Total quantity – tonnes
Share of domestic production % Countries of destination
AT 5001 10 nd
BE nd nd nd
DE 0 0 0
DK 10 <1 nd
ES 0 0 0
FI 0 0 0
FR nd nd nd
GB nd nd nd
GR nd nd nd
IE 0 0 0
IT nd nd nd
LU 0 0 0
NL nd nd nd
PT nd nd nd
SE 0 0 0
CH nd nd nd
CZ nd nd nd
NO nd nd nd
Source: Own data
1 1 000 eggs nd = no data available
183

Table c 37: Highly processed, certified organic food. Minor products. Percentages of all certified organic food products
Beef Oilseeds Eggs Wine Sheep Pork Poultry
AT 40 nd 10-20 nd nd nd nd
BE 0 nd 0 nd nd 10 0
DE 20 95 10 0 5 35 5
DK 5 1 20 nd 0 10 20
ES1 nd high nd nd nd nd nd
FI 15 5 5 nd 5 20 5
FR2 nd nd nd nd nd nd nd
GB <1 nd nd nd <1 nd nd
GR3 nd 10 nd 15 nd nd nd
IE nd nd nd nd nd nd nd
IT nd nd 0 5 nd nd nd
LU 20 nd 0 nd nd 20 5
NL 0 1 5 nd 0 0 0
PT nd nd nd nd nd nd nd
SE 20 nd <1 nd 1 20 0
CH 10 1 30 0 5 20 5
CZ nd 0 nd nd nd nd nd
NO 5 nd nd nd nd nd nd
Source: Own data
1 For Spain no division in shares of low/high degree of processing is given – only ’x’ is marked in the dominant category.
2 In France while organic products are in general sold with a low degree of processing a market for processed food is developing in vegetables and fruits.
3 Wine: Numbers reversed, because wine in itself considered low degree of processing. nd = no data available
184

Table c 38: Sales channels for organic food cereals. Percentages of total sales in each sales channel 1997-98
Direct sales to consumer
Specialised organic food
shops
Specialised shops (bakers and
butchers)
General stores (super/hyper-
markets)
Others Total
AT 10 10-15 nd 75-80 0 100
BE 10 70 15 5 100
DE 10 50 25 15 0 100
DK <2 5 90-95 0 100
ES 10 65 0 25 0 100
FI 7 3 4 86 0 100
FR1 nd nd nd nd nd nd
GB 5 45 <50 0 100
GR 50 0 40 10 0 100
IE nd nd nd nd nd nd
IT 5 75 0 20 0 100
LU 15 20 15 50 0 100
NL 0 95 1 4 0 100
PT nd nd nd nd nd nd
SE 2-5 <1 95-98 0 100
CH 5 10 15 70 0 100
CZ 5 0 80 15 0 100
NO 10 10 0 80 0 100
Source: Own data
Note: Sales channels only include the domestic market: i.e. imports are included, exports excluded 1 All products: direct sales: 16%; Specialised organic food shops: 46%; General stores: 38% nd = no data available
185

Table c 39: Sales channels. Organic food oilseeds including olives. Percentages of total sales in each sales channel 1997-98
Direct sales to consumer
Specialised organic food
shops
Specialised shops (bakers and butchers)
General stores (super/hyper-
markets)
Others Total
AT nd nd nd nd nd nd
BE nd nd nd nd nd nd
DE 0 65 0 35 0 100
DK 0 <2 0 98 0 100
ES 10 60 0 30 0 100
FI 10 30 0 60 0 100
FR1 nd nd nd nd nd nd
GB nd nd nd nd nd nd
GR 10 0 80 10 0 100
IE nd nd nd nd nd nd
IT 10 80 0 10 0 100
LU nd nd nd nd nd nd
NL 0 100 0 0 0 100
PT 5 0 0 95 0 100
SE 2-5 0 0 95-98 0 100
CH 0 15 0 85 0 100
CZ 0 0 85 15 0 100
NO nd nd nd nd nd nd
Source: Own data
Note: Sales channels only include the domestic market: i.e. imports are included, exports excluded 1 All products: direct sales: 16%; Specialised organic food shops: 46%; General stores: 38%s nd = no data available
186
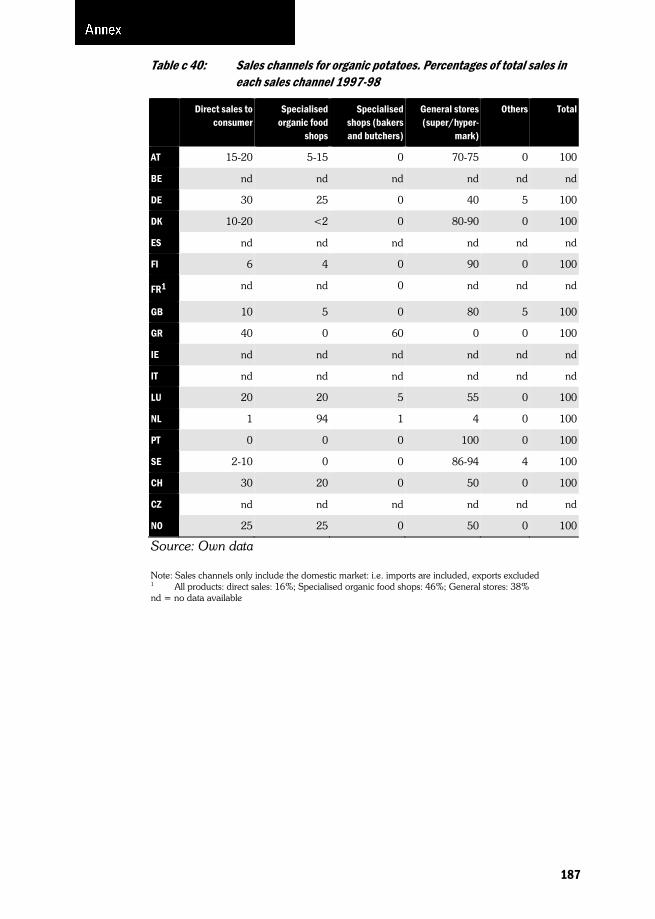
Table c 40: Sales channels for organic potatoes. Percentages of total sales in each sales channel 1997-98
Direct sales to consumer
Specialised organic food
shops
Specialised shops (bakers and butchers)
General stores (super/hyper-
mark)
Others Total
AT 15-20 5-15 0 70-75 0 100
BE nd nd nd nd nd nd
DE 30 25 0 40 5 100
DK 10-20 <2 0 80-90 0 100
ES nd nd nd nd nd nd
FI 6 4 0 90 0 100
FR1 nd nd 0 nd nd nd
GB 10 5 0 80 5 100
GR 40 0 60 0 0 100
IE nd nd nd nd nd nd
IT nd nd nd nd nd nd
LU 20 20 5 55 0 100
NL 1 94 1 4 0 100
PT 0 0 0 100 0 100
SE 2-10 0 0 86-94 4 100
CH 30 20 0 50 0 100
CZ nd nd nd nd nd nd
NO 25 25 0 50 0 100
Source: Own data
Note: Sales channels only include the domestic market: i.e. imports are included, exports excluded 1 All products: direct sales: 16%; Specialised organic food shops: 46%; General stores: 38% nd = no data available
187
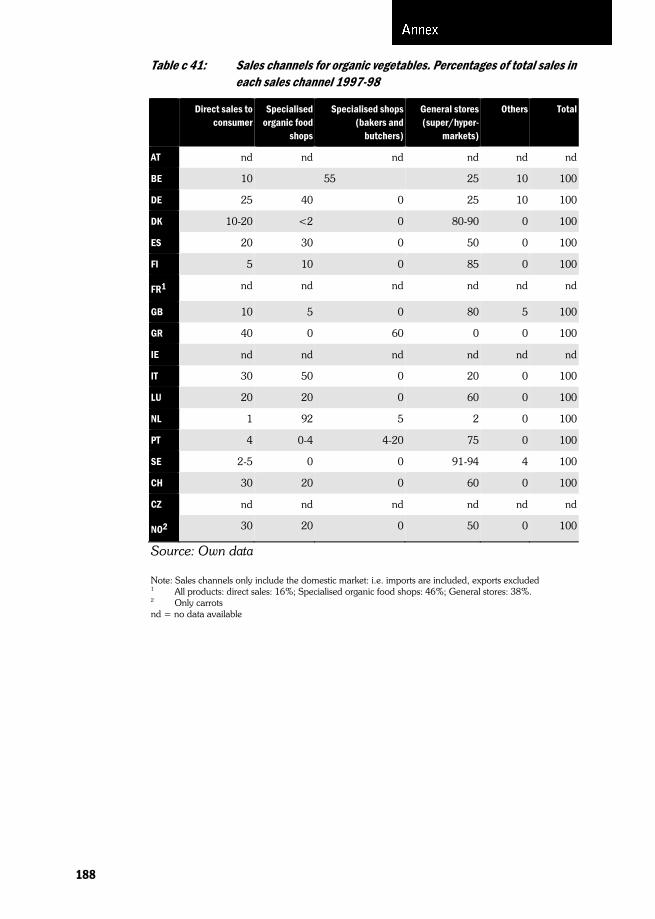
Table c 41: Sales channels for organic vegetables. Percentages of total sales in each sales channel 1997-98
Direct sales to consumer
Specialised organic food
shops
Specialised shops (bakers and
butchers)
General stores (super/hyper-
markets)
Others Total
AT nd nd nd nd nd nd
BE 10 55 25 10 100
DE 25 40 0 25 10 100
DK 10-20 <2 0 80-90 0 100
ES 20 30 0 50 0 100
FI 5 10 0 85 0 100
FR1 nd nd nd nd nd nd
GB 10 5 0 80 5 100
GR 40 0 60 0 0 100
IE nd nd nd nd nd nd
IT 30 50 0 20 0 100
LU 20 20 0 60 0 100
NL 1 92 5 2 0 100
PT 4 0-4 4-20 75 0 100
SE 2-5 0 0 91-94 4 100
CH 30 20 0 60 0 100
CZ nd nd nd nd nd nd
NO2 30 20 0 50 0 100
Source: Own data
Note: Sales channels only include the domestic market: i.e. imports are included, exports excluded 1 All products: direct sales: 16%; Specialised organic food shops: 46%; General stores: 38%. 2 Only carrots nd = no data available
188

Table c 42: Sales channels for organic fruits (including nuts). Percentages of total sales in each sales channel 1997-98
Direct sales to consumer
Specialised organic food
shops
Specialised shops (bakers and
butchers)
General stores (super/hyper-
markets)
Others Total
AT nd nd nd nd nd nd
BE nd nd nd nd nd nd
DE 20 60 0 20 0 100
DK 10-15 <2 0 80-90 0 100
ES 20 30 0 50 0 100
FI 30 20 0 50 0 100
FR1 nd nd nd nd nd nd
GB 5 5 80 10 100
GR 30 0 70 0 0 100
IE nd nd nd nd nd nd
IT 30 50 0 20 0 100
LU 20 20 0 60 0 100
NL 0 98 1 1 0 100
PT 0-1 0-1 1-5 >90 0 100
SE <1 0 0 >98 <1 100
CH 25 40 0 35 0 100
CZ nd nd nd nd nd nd
NO2 30 40 nd 10 20 100
Source: Own data
Note: Sales channels only include the domestic market: i.e. imports are included, exports excluded 1 All products: direct sales: 16%; Specialised organic food shops: 46%; General stores: 38%. 2 Juice/syrup nd = no data available
189

Table c 43: Sales channels for organic wine. Percentages of total sales in each sales channel 1997-98
Direct sales to consumer
Specialised organic food
shops
Specialised shops (bakers and butchers)
General stores (super/hyper-
markets)
Others Total
AT nd nd nd nd nd nd
BE nd nd nd nd nd nd
DE 65 15 20 0 0 100
DK 0 5 0 95 0 100
ES 0 80 20 0 0 100
FI nd nd nd nd nd nd
FR1 nd nd nd nd nd nd
GB nd nd nd nd nd nd
GR 20 0 75 5 0 100
IE nd nd nd nd nd nd
IT 30 55 0 15 0 100
LU 0 50 10 30 10 100
NL 0 99 0 1 0 100
PT nd nd nd nd nd nd
SE 0 0 100 0 0 100
CH 50 30 0 20 0 100
CZ nd nd nd nd nd nd
NO nd nd nd nd nd nd
Source: Own data
Note: Sales channels only include the domestic market: i.e. imports are included, exports excluded 1 All products: direct sales: 16%; Specialised organic food shops: 46%; General stores: 38%. nd = no data available
190

Table c 44: Sales channels for organic milk products. Percentages of total sales in each sales channel 1997-98
Direct sales to consumer
Specialised organic food
shops
Specialised shops (bakers and
butchers)
General stores (super/hyper-
markets)
Others Total
AT 10-20 10 0 70-80 0 100
BE 30 40 30 0 100
DE 10 55 0 30 5 100
DK 0 <2 0 98 0 100
ES 20 70 0 10 0 100
FI 1 4 0 95 0 100
FR1 nd nd nd nd nd nd
GB 0 15 0 80 5 100
GR nd nd nd nd nd nd
IE nd nd nd nd nd nd
IT 5 65 nd 30 nd 100
LU 25 40 0 35 0 100
NL 0 96 0 4 0 100
PT nd nd nd nd nd nd
SE 0 0 0 95-97 3-5 100
CH 5 15 5 80 0 100
CZ nd nd nd nd nd nd
NO 0 0 0 100 0 100
Source: Own data
Note: Sales channels only include the domestic market: i.e. imports are included, exports excluded 1 All products: direct sales: 16%; Specialised organic food shops: 46%; General stores: 38%. nd = no data available
191
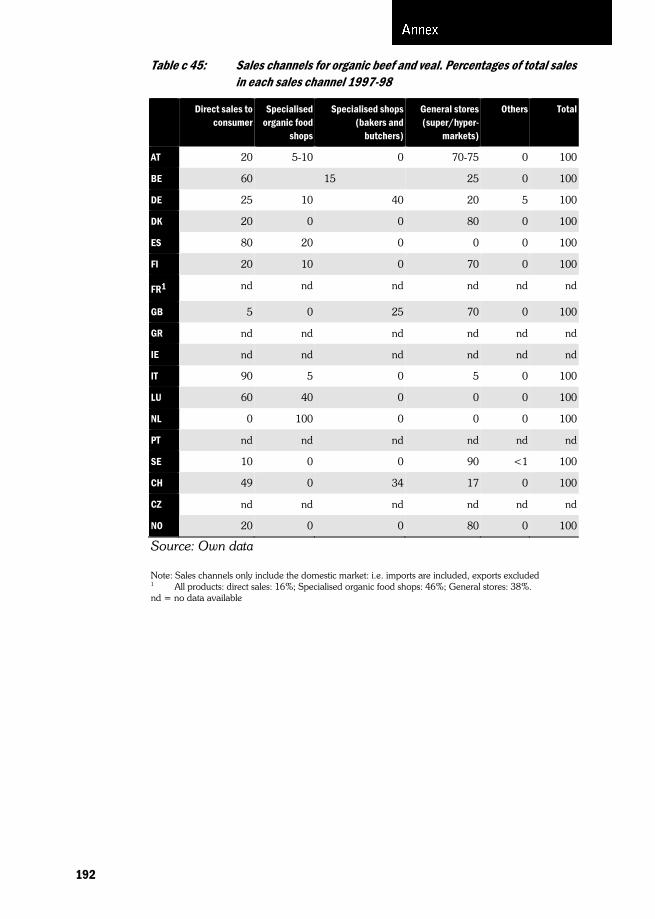
Table c 45: Sales channels for organic beef and veal. Percentages of total sales in each sales channel 1997-98
Direct sales to consumer
Specialised organic food
shops
Specialised shops (bakers and
butchers)
General stores (super/hyper-
markets)
Others Total
AT 20 5-10 0 70-75 0 100
BE 60 15 25 0 100
DE 25 10 40 20 5 100
DK 20 0 0 80 0 100
ES 80 20 0 0 0 100
FI 20 10 0 70 0 100
FR1 nd nd nd nd nd nd
GB 5 0 25 70 0 100
GR nd nd nd nd nd nd
IE nd nd nd nd nd nd
IT 90 5 0 5 0 100
LU 60 40 0 0 0 100
NL 0 100 0 0 0 100
PT nd nd nd nd nd nd
SE 10 0 0 90 <1 100
CH 49 0 34 17 0 100
CZ nd nd nd nd nd nd
NO 20 0 0 80 0 100
Source: Own data
Note: Sales channels only include the domestic market: i.e. imports are included, exports excluded 1 All products: direct sales: 16%; Specialised organic food shops: 46%; General stores: 38%. nd = no data available
192
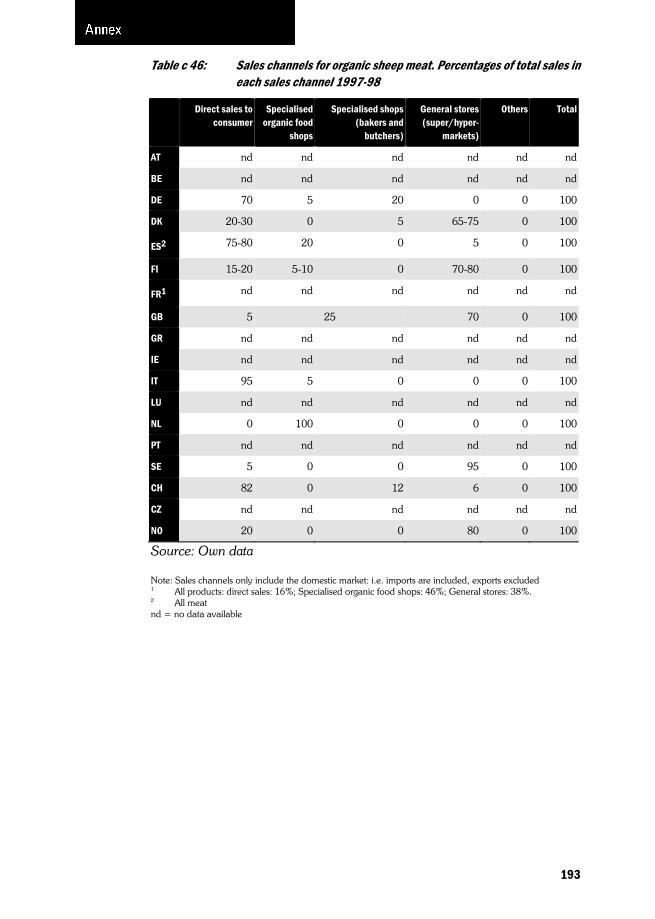
Table c 46: Sales channels for organic sheep meat. Percentages of total sales in each sales channel 1997-98
Direct sales to consumer
Specialised organic food
shops
Specialised shops (bakers and
butchers)
General stores (super/hyper-
markets)
Others Total
AT nd nd nd nd nd nd
BE nd nd nd nd nd nd
DE 70 5 20 0 0 100
DK 20-30 0 5 65-75 0 100
ES2 75-80 20 0 5 0 100
FI 15-20 5-10 0 70-80 0 100
FR1 nd nd nd nd nd nd
GB 5 25 70 0 100
GR nd nd nd nd nd nd
IE nd nd nd nd nd nd
IT 95 5 0 0 0 100
LU nd nd nd nd nd nd
NL 0 100 0 0 0 100
PT nd nd nd nd nd nd
SE 5 0 0 95 0 100
CH 82 0 12 6 0 100
CZ nd nd nd nd nd nd
NO 20 0 0 80 0 100
Source: Own data
Note: Sales channels only include the domestic market: i.e. imports are included, exports excluded 1 All products: direct sales: 16%; Specialised organic food shops: 46%; General stores: 38%. 2 All meat nd = no data available
193

Table c 47: Sales channels for organic pork. Percentages of total sales in each sales channel 1997-98
Direct sales to consumer
Specialised organic food
shops
Specialised shops (bakers and butchers)
General stores (super/hyper-
markets)
Others Total
AT nd nd nd nd nd nd
BE 10 30 60 0 100
DE 10 10 60 15 5 100
DK 10-15 0 5 80-90 0 100
ES2 80 20 0 0 0 100
FI 20 10 nd 70 nd 100
FR1 nd nd nd nd nd nd
GB nd nd nd nd nd nd
GR nd nd nd nd nd nd
IE nd nd nd nd nd nd
IT nd nd nd nd nd nd
LU 60 0 40 0 0 100
NL nd 100 nd nd nd 100
PT nd nd nd nd nd nd
SE 1 nd nd 99 nd 100
CH 8 nd 70 22 0 100
CZ nd nd nd nd nd nd
NO nd nd nd nd nd nd
Source: Own data
Note: Sales channels only include the domestic market: i.e. imports are included, exports excluded. 1 All products: direct sales: 16%; Specialised organic food shops: 46%; General stores: 38%. 2 All meat. nd = no data available
194

Table c 48: Sales channels for organic poultry. Percentages of total sales in each sales channel 1997-98
Direct sales to consumer
Specialised organic food
shops
Specialised shops (bakers and
butchers)
General stores (super/hyper-
markets)
Others Total
AT nd nd nd nd nd nd
BE 30 20 50 0 100
DE 30 20 40 5 nd 100
DK nd nd nd nd nd nd
ES nd nd nd nd nd nd
FI nd nd nd nd nd nd
FR1 nd nd nd nd nd nd
GB nd nd nd nd nd nd
GR nd nd nd nd nd nd
IE nd nd nd nd nd nd
IT 95 5 0 0 0 100
LU 80 10 10 0 0 100
NL 0 100 0 0 0 100
PT nd nd nd nd nd nd
SE 3-4 0 0 96-97 0 100
CH 94 0 0 6 0 100
CZ nd nd nd nd nd nd
NO nd nd nd nd nd nd
Source: Own data
Note: Sales channels only include the domestic market: i.e. imports are included, exports excluded 1 All products: direct sales: 16%; Specialised organic food shops: 46%; General stores: 38%. nd = no data available
195
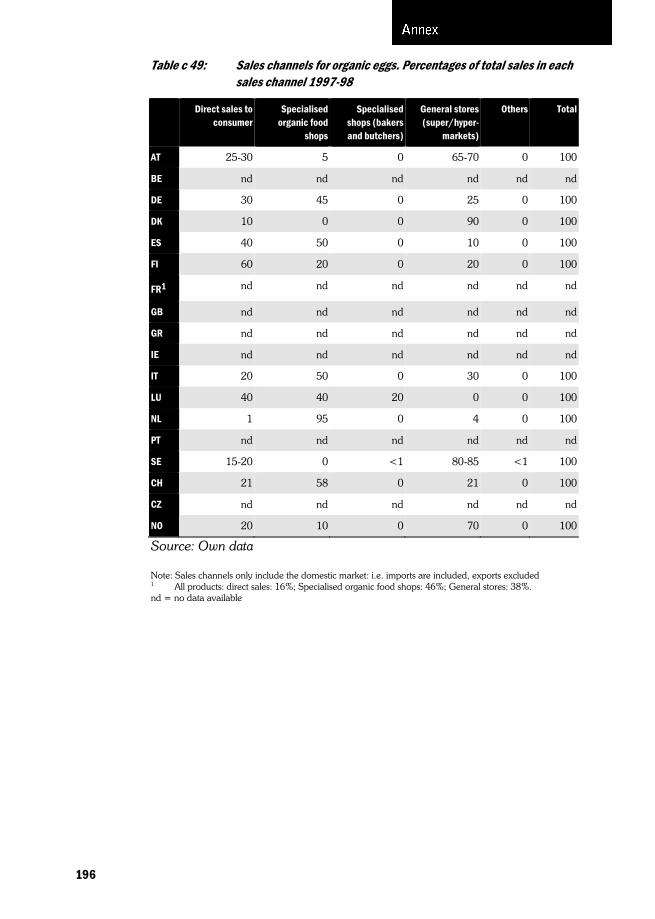
196
Table c 49: Sales channels for organic eggs. Percentages of total sales in each sales channel 1997-98
Direct sales to consumer
Specialised organic food
shops
Specialised shops (bakers and butchers)
General stores (super/hyper-
markets)
Others Total
AT 25-30 5 0 65-70 0 100
BE nd nd nd nd nd nd
DE 30 45 0 25 0 100
DK 10 0 0 90 0 100
ES 40 50 0 10 0 100
FI 60 20 0 20 0 100
FR1 nd nd nd nd nd nd
GB nd nd nd nd nd nd
GR nd nd nd nd nd nd
IE nd nd nd nd nd nd
IT 20 50 0 30 0 100
LU 40 40 20 0 0 100
NL 1 95 0 4 0 100
PT nd nd nd nd nd nd
SE 15-20 0 <1 80-85 <1 100
CH 21 58 0 21 0 100
CZ nd nd nd nd nd nd
NO 20 10 0 70 0 100
Source: Own data
Note: Sales channels only include the domestic market: i.e. imports are included, exports excluded 1 All products: direct sales: 16%; Specialised organic food shops: 46%; General stores: 38%. nd = no data available

Table c 50: Impact of the EC CAP reform of 1992 on organic market supply and demand. 1993-97
1993 1994 1995 1996 1997
Supply Demand Supply Demand Supply Demand Supply Demand Supply Demand
AT na na na na 0 0 0 0 0 0
BE 0 0 0 0 0 0 0 0 0 +2
DE +1 0 +1 0 +1 0 +1 0 +1 0
DK 0 0 0 0 0 0 0 0 0 0
ES nd nd nd nd nd nd nd nd nd nd
FI na na na na 0 0 0 0 +1 0
FR 0 0 0 0 0 0 0 0 0 0
GB 0 0 -2 0 -2 0 -2 0 -2 0
GR 0 0 0 0 0 0 0 0 0 0
IE 0 0 0 0 0 0 0 0 0 0
IT +1 0 +1 0 +1 0 +2 0 +2 0
LU 0 0 0 0 0 0 0 0 0 0
NL 0 0 0 0 0 0 0 0 0 0
PT nd nd nd nd nd nd nd nd nd nd
SE na na na na +2 0 +2 0 +2 0
Source: Own data
Note: Scores may vary from -5 to +5 with -5 signifying very strong negative influence and +5 very strong positive influence nd = no data available ;na = not applicable
197
199


