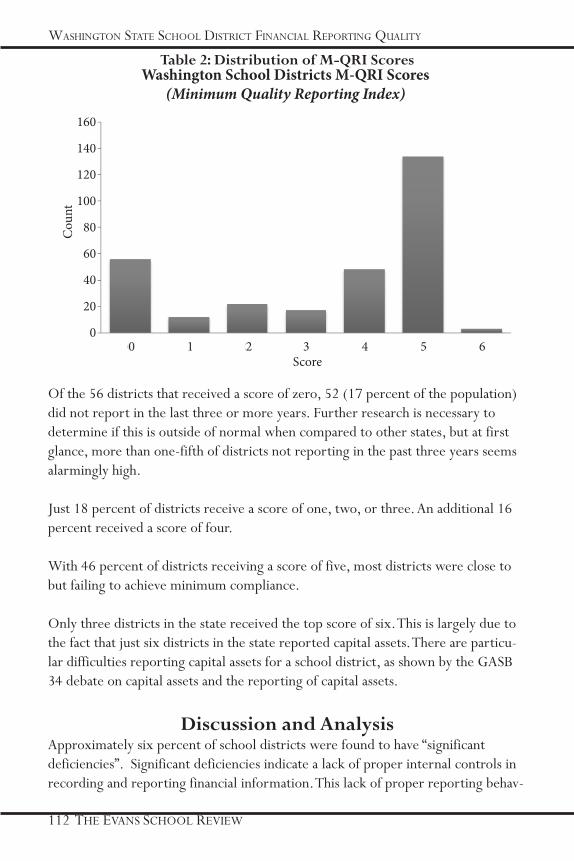
The Evans School Review Volume 5, Spring 2015 The Daniel J. Evans School of Public Policy and Governance University of Washington https://depts.washington.edu/esreview/ The Evans School Review is a student-run publication. The views and opinions ex- pressed in this journal are the authors’ own and do not necessarily represent the views of the Evans School of Public Policy and Governance or the University of Washington. Printed by: University Bookstore Press Seattle, Washington
Transcript
The Evans School ReviewVolume 5, Spring 2015
The Daniel J. Evans School of Public Policy and Governance
University of Washington
https://depts.washington.edu/esreview/
The Evans School Review is a student-run publication. The views and opinions ex-pressed in this journal are the authors’ own and do not necessarily represent the views of the Evans School of Public Policy and Governance or the University of Washington.
Printed by: University Bookstore PressSeattle, Washington
2014-2015 Editorial BoardEditors-In-Chief
Qingqing SunSophie Sullivan Proebsting
Staff EditorsMonique Nasrallah
Morgan Sampson-TobiasCorey Dahl
David WishardHester Serebrin
Josh ColeAndrew Weller
Faculty AdvisorDr. J. Patrick Dobel
Style EditorsLibby Wagner
Eli Seely
Section EditorsMekal BanyaszShireen Tabrizi
Senior EditorsLilliane Ballesteros
Isaac Fuchs
Managing EditorKyle Elliot
Director of MarketingVicky Clarke
Content EditorElka Peterson-Horner
Table of ConTenTs
A Letter from the Dean Sandra O. archibald
A Letter from the Editors-in-Chief QingQing Sun and SOphie Sullivan prOebSting
ReseaRCh
Increasing American Bilingualism: Policies for Evidence-Based World Languages Education hilary Jauregui
Our Skies, Our Schools, and Our Other Shortcomings: Why Washington Needs a Revenue-Positive Carbon Tax daniel S.S. cairnS
Contemporary Issues in Criminal Justice & Psychology with Applications to Seattle lauren JacObSOn SpOkane
E-Cigarettes and Public Health: Policy Options for Washington State patricia atwater, nick Fradkin, elizabeth MedeirOS, JOy haMiltOn gilrOy, aMy hagOpian, abigail halperin
Epistemic Pluralism in Public Policy: The Critical Theory and Neuroscience Perspectives gilbert Michaud
A Benefit-Cost Analysis of a Road Diet on Seattle’s Rainier Avenue South andrew deSMOnd, brian hutchinSOn
Table of ConTenTs
ReseaRCh (ConT.)Quality of Financial Reporting of Washington State School Districts: Results from a Population-Wide Analysis of Audited Financial Reports JOhn kurpierz, eliJah panci
The Benefits and Costs of an Earthquake Early Warning System in Washington State andrew calkinS, eli lieberMan
evans sChool feaTuRes
Evans School Policy Competition Winning Proposal:A Quadruple-Bottom Line Framework for Teacher Evaluation Stephanie FOrMan, kathryn JacOby, nicki Mcclung, JeFF whitehill
Evans School Deep Dive Capstone Seminar Report:Financial Implications of Direct Bank Lending and Carbon Emissions Trading: Analysis and Recommendations for the Governmental Accounting Standards Board zane beall, cOnnOr birkeland, alexandra caraganiS, yue dai, drew gregOry, ian griSwOld, ted hanSOn, Juan lepez, eli panci, JarOn reed, yang Shi, laura SMith, alex StOne, aarOn vetter, rOuxi zhuang
A Letter from the Dean
Sandra O. ArchibaldDean and Professor of Public Affairs
Ph.D. Agricultural Economics, 1984, University of California, Davis
Dear Reader:
This outstanding edition of the Evans School Review puts an exclamation point on what has been an extraordinary year ofaccomplishment by our Evans School students. In the classroom and in the work-place, in the legislative arena and in the mix of academic competition, our students have not only achieved, they have excelled.
It is no surprise this class would produce a quality product featuring thoughtful, well-researched, and interesting articles concerning public finance, the environ-ment, public health, criminal justice, emergency preparedness, and more—all significant and timely topics.
I congratulate this year’s hardworking Editorial Board, including Editors-in-Chief Sophie Sullivan Proebstin and Qingqing Sun; also Lilliane Ballesteros, Mekal Banyasz, Vicky Clarke, Kyle Elliot, Isaac Fuchs, Elko Peterson-Horner, Eli Seely, Shireen Tabrizi, and Libby Wagner. This year’s Staff Editors included Josh Cole, Co-rey Dahl, Monique Nasrallah, Morgan Sampson-Tobias, Hester Serebrin, Andrew Weller, and David Wishard. Thank you as well to the Review’s faculty advisor,Professor J. Patrick Dobel, for his time and guidance of this effort.
This fifth edition of Evans School Review gives testimony to everyone involved in its production and for that I am grateful.
Thank you.
Sandra O. ArchibaldDean and Professor
A Letter from the Editors-in-Chief
Qingqing Sun Sophie Sullivan ProebstingMPA ‘15 MPA ‘15
Dear Reader:
The Editorial Board is thrilled to present the 2014 -2015 edition of the Evans School Review, a student led and peer reviewed academic journal. Evans School Review is a student run academic journal that provides an excellent opportunity for students in the Evans community to share their creative research with a wide audience to fur-ther research innovation within the area of public policy and administration. In the five years of this journal, we have been lucky enough to have Editorial Boards with the passion and clear vision to make the review what it is today. We are grateful to be at an institution that has supported their students and our desire to present public policy work that is of great interest to us.
We were thrilled to receive a number of submissions from students outside of the Evans School. We have an author from Virginia Commonwealth University, as well as several of our peers at the University of Washington across several departments. From these submissions, we had an overwhelming number of articles that were both of excellent quality and interest. These articles highlight the interests of our school this year. This year’s articles focused on the hyper local, with a benefit cost analysis of Rainier Avenue South in South Seattle and a discussion of racial disparities in Seattle’s criminal justice system, to the national, with an analysis of including bilingual poli-cies in the American education system. Several articles focus on issues occurring at the state level in Washington, with a discussion of a quadruple bottom line evaluation framework for teachers, a benefit cost analysis of implementing an emergency earth-quake system, current and on going policy issues in the legislature, like regulation of e cigarettes, and the implementation of a carbon tax. This year, we were excited to have a contribution from a new class at the Evans School, a Deep Dive, in which 15 students spent one quarter with focusing on recent policy concerning direct bank loans to cities, and carbon emissions exchanges. We are grateful for every student who has shared their hard work and we were impressed to see this breadth of knowl-edge from our peers.
We greatly appreciate the hardwork of our entire Editorial Board: our Senior Editors Lilliane Ballesteros and Isaac Fuchs, Director of Marketing Vicky Clarke, Content Editor Elka Peterson-Horner, Managing Editor Kyle Elliot, and Style Editors Eli
Seely and Libby Wagner. This group has done incredible work this year and we are so amazed with their leadership. It is with their knowledge and skills that the journal is so strong, and they have made invaluable contributions to the process. We also greatly appreciate the hardwork of all staff editors who invested their time and skills in our group editing work in order to guarantee the high quality of our journal.
Thank you to Professor Pat Dobel, our faculty advisor, for sharing his expertise and experience, we greatly appreciate his advice, particularly as we look forward to next year’s edition. Thank you to Faculty Research Committee, Professors Allison Cullen and Mark Long, Linda Lake, Corey Dahl, and Matthew Lane for their advice, collab-oration, and continuing support of the Evans School Review. Thank you to Dean Ar-chibald and the administration’s ongoing support of its student’s academic pursuits.
Finally, thank you to you, our readers, for your interest and passion for public policy issues and the research of our incredible authors! We hope you will enjoy these in-novative ideas and research from the next generation of leaders in public sectors that aim to strengthen professional public policy analysis and management in this area.
Cheers!
Qingqing Sun & Sophie Sullivan ProebstingEditors-in-Chief
IncreasIng amerIcan BIlIngualIsm
10 THE EVANS SCHOOL REVIEW10 THE EVANS SCHOOL REVIEW
Increasing American Bilingualism: Policies for Evidence-Based World Languages
AbstractThe United States is undergoing a massive demographic and eco-nomic shift, and the global economy is increasingly competitive, interconnected and integrated. To stay competitive in this changing environment, the US must prioritize world languages education for all. Less than 20 percent of Americans are fluent in more than one language, and the current educational approach is inadequate to increase bilingualism to the level needed for global commerce and national security. A national world languages education policy is essential to incentivize world language education starting early and continuing through compulsory education. Funding should be allocated for teacher training and teaching assessments to ensure quality and effectiveness. Promising approaches, such as dual language immersion education and the International Baccalaureate Diploma Program, have been successful; however, a sustained and national world language education policy is essential for building a multilingual society.
IntroductionThe US is undergoing dramatic change, both economically and demographically. At the same time, the global economy is becom-ing increasingly competitive, interconnected, interdependent and integrated (Breton, 1998; Fry & Lowell, 2003; Gambino, Acosta & Grieco, 2014). Less than 20 percent of Americans are fluent in more than one language, and this limited level of bilingual-ism in the American population compromises the nation’s global economic competitiveness, its national security and the ability of its citizens to communicate with each other (Duncan, 2010). The US lags far behind European countries in the level of bilingualism, and will fall further behind given the current attitudes regarding and approaches toward world language education. Studying, and developing fluency in, world languages is the key to the global understanding Americans must cultivate (Tochon, 2009). Drastic
Jauregui
11VOL 5, SPRING 2015 11VOL 5, SPRING 2015
changes are necessary to achieve the vision of Secretary of the Department of Edu-cation, Arne Duncan:
To prosper economically and to improve relations with other countries, Americans need to read, write and understand other languages. It’s ab-solutely essential for the citizens of the United States to become fluent in other languages — and schools, colleges and universities must include producing bilingual students as a central part of their mission. (2010)
This paper will first review economic and demographic changes in the US, and how those changes drive the need for increased bilingualism. Next is a brief review of the US population’s linguistic abilities and the current American approach to world language education. It is followed by a discussion of the benefits of learn-ing additional languages. Then is a review of the sparse literature on employment outcomes for bilingual Americans, as well an examination of two areas of intense need for bilingual skills: healthcare and national security work. Two promising K-12 (kindergarten through twelfth grade) approaches for broadly expanding the level of bilingual proficiency are highlighted – dual language immersion education and the International Baccalaureate Diploma program. The paper concludes with a set of policy recommendations to move the nation toward the goal of a multilingual society.
Changes in American DemographicsThe US population is rapidly diversifying. According to the US Census, the foreign-born population has exploded in recent decades – from 14.1 million people over age 5, in 1980, to 40.6 million in 2012 (Gambino, Acosta & Grieco, 2014). Within this group, the vast majority do not speak English at home, and their numbers are increasing – 85 percent speak another language at home, up from 70 percent in 1980. Fully half of them, more than 20 million people, have limited English pro-ficiency (LEP) and over four million LEP people speak no English at all. In order to provide goods and services to the growing LEP population, the demand for bilingual employees will increase, likely resulting in wage premiums and enhanced employability for people who are proficient in both English and another language (Coomer, 2011).
Globalization of the EconomyBusiness is rapidly becoming more global and interconnected. With the prolifera-tion of the Internet, businesses now operate in an increasingly integrated world economy that allows people to easily interact, virtually and instantaneously, from
IncreasIng amerIcan BIlIngualIsm
12 THE EVANS SCHOOL REVIEW12 THE EVANS SCHOOL REVIEW
anywhere in the world (Breton, 1998). The speed and scope of globalization shows no signs of slowing, and American organizations will need to adapt by increasing the languages spoken by their staff to remain competitive in the global marketplace (Breton; Fry & Lowell, 2003; Saiz & Zoido, 2002). Though English is one of the international languages of business, the vast majority of people in the world – 85 percent – do not speak English (Tochon, 2009).
In order to maximize the efficiency of worldwide export business, as well as to cater to LEP communities within the US, bilingual staffs are essential (Fry & Low-ell, 2003; Saiz & Zoido, 2002). Internal linguistic and cultural competence with respect to an organizations’ target communities is a competitive advantage, and an American workforce with these market-driven skills is a strategic economic asset for the US (Saiz & Zoido; Wiley, Moore & Fee, 2012). Linguistic development is also essential to support US strategic and economic interests to prepare mul-tilingual diplomats, foreign policy analysts and military leaders (Duncan, 2010). As businesses continue to expand internationally, and as technology puts more employees in direct contact with suppliers, customers and colleagues across the world, monolingual speakers are facing increasing disadvantages in the domestic and international job market (Tochon).
While a multilingual staff confers a competitive business advantage, the lack of such linguistic ability actually hurts the bottom line. In the United Kingdom, the underinvestment in building language skills in the population costs businesses the equivalent of more than a three-and-a-half percent tax on British exports (Dulfano, 2013). Dulfano also described a European Commission study, which found similar results: Poor language skills across Europe resulted in lost contracts for 11 percent of small- and medium-sized businesses. A 2002 survey of large US corporations found that 30 percent were unable to take full advantage of opportunities due to employees’ insufficient international skills; 80 percent believed they would have had higher sales with a more internationally competent staff (Wiley, Moore & Fee, 2012)
Conducting business in countries and communities where English is not spoken is more costly and less efficient and effective without in-house skills, since translation and interpretation services are expensive and are of varying quality (Breton, 1998; Dulfano, 2013). Importantly, using the same language when conducting business diminishes psychological distances between parties, a key to forming business rela-tionships (Dulfano).
Jauregui
13VOL 5, SPRING 2015 13VOL 5, SPRING 2015
Language Learning in the USThe United States population lags behind other countries in bilingualism. More than half of Europeans, 53 percent, speak a language in addition to English (Dun-can, 2010). As previously mentioned, even this level is too low and businesses are suffering due to insufficient language skills (Dulfano, 2013). In the US, only 18 percent of adults speak a language in addition to English (Duncan).
This gap between the US and other nations begins in early education. The availabil-ity of world language classes is on the decline (Duncan, 2010). Significantly fewer elementary and middle schools offer a world language than ten years ago (Wiley, Moore & Fee, 2012). Lack of access is an equity issue; minority, low-income and rural students earn, and have access to, fewer credits in world languages (Duncan; NEA Research, 2007). Only ten states require world language study – not profi-ciency – as a graduation requirement, which leaves it as an optional elective across most of the nation (Duncan; Wiley, Moore & Fee). As a result, just 51 percent of public middle school students, and only 20 percent of high school students study a world language (NEA Research; Wiley, Moore & Fee). The access problem is fur-ther compounded by the shortage of world language teachers. Seventy-five percent of states reported shortages of teachers for world languages in the 2007–2008 school year, and teacher preparation programs are not meeting the demand for instructors (Duncan).
Among students who do study a world language, there is a troubling lack of diver-sity in languages learned. Spanish is the most commonly studied language in the US by far, with 72 percent of all K-12 world language enrollment (Wiley, Moore & Fee, 2012). While Latin America has a growing global market share and there are 500 million Spanish speakers worldwide – including millions in the US – China will soon be the world’s largest economy and Mandarin Chinese is the most com-monly spoken language today (de la Garza, Cortina & Pinto, 2008; Wiley, Moore & Fee). Despite this fact, only four percent of high schools offer Mandarin Chinese courses (Wiley, Moore & Fee). The same trend occurs at the postsecondary level – 95 percent of college students studying a world language choose a European language, and less than one percent select a language the US Department of De-fense deems critical for national security – such as Arabic, Urdu or Dari (National Security Education Program [NSEP], n. d.; Duncan, 2010).
The time spent interacting with a language is important; the standard US format – 30-60 minutes per week in elementary school, 300 hours across two years in high school – is woefully inadequate to achieve proficiency (NEA Research, 2007). Fur-
IncreasIng amerIcan BIlIngualIsm
14 THE EVANS SCHOOL REVIEW14 THE EVANS SCHOOL REVIEW
ther, the US educational system misses the optimal window for children to most easily learn an additional language (starting at 4 to 6 years old) by concentrating the hours of language instruction during high school (Wiley, Moore & Fee, 2012). In a dramatically different approach from the US, all member states of the Europe-an Union (EU) require world language study, and all but two mandate it through-out all the years of compulsory education (NEA Research; Tochon, 2009). This approach allows most European students to achieve communicative competency in two or three additional languages (Tochon). The vast majority of high-income countries begin world language education earlier than the US (early in elementary school), mandate it, and assess it regularly along with other core subjects (Klee, Lynch & Tarone, 1998; Wiley, Moore & Fee).
Benefits of BilingualismResearch has demonstrated myriad cognitive and educational benefits from de-veloping bilingual abilities (Dulfano, 2013; Kim, 2013). The process of building and maintaining additional language fluency results in enhanced communication, cooperation, empathy, problem-solving, and negotiation skills, as well as stronger mathematics and language arts capabilities (Dulfano; NEA Research, 2007). Ad-ditional skills central to effective cross-cultural communication, including global understanding and intercultural sensitivity are also fostered (Dulfano; Kim). Bilin-gualism actually changes the brain, creating larger language processing areas and greater adaptability (Tochon, 2009; Dulfano). The earlier bilingualism develops, the larger the language processing area becomes (Tochon).
Early childhood is the best time to commence learning an additional language (NEA Research, 2007; Tochon, 2009). Language acquisition that begins at four to six years old is characterized by fluency in adulthood with few grammatical errors, as well as flawless control over accent, pronunciation, and rhythm; young children are readily able to learn additional languages with native proficiency (Tochon). During early childhood, children’s brains are very malleable. They are exquisitely responsive to experience, and a child’s brain easily creates new and strengthens ex-isting neural circuits with early world language education (NEA Research; Tochon). Without this exposure, existing pathways are eliminated, and the ease of recreating those pathways becomes more difficult as people age (NEA Research; Tochon).
Bilingualism confers three major areas of advantage: (1) higher academic achieve-ment in both languages and other subjects; (2) cognitive benefits reflected in higher IQ scores, and (3) positive attitudes and beliefs about language learning and other cultures (Tochon, 2009). Specifically, bilingual children develop a sense of cultural
Jauregui
15VOL 5, SPRING 2015 15VOL 5, SPRING 2015
pluralism – an openness to and appreciation of other cultures – as well as an im-proved self-concept and sense of achievement at school (Tochon).
Employment Benefits of BilingualismSummary of the Literature. There is a dearth of research on the employment ben-efits for bilingual employees in the US, but it is logical to expect the many benefits of bilingualism would extend to employment outcomes (Kim, 2013). Currently, most research has focused on wages for US immigrants once they become fluent in English compared to their counterparts who do not gain fluency (Kim; Saiz & Zoido, 2002). The few studies that have investigated bilingualism in native English speakers are based on generic survey data, and the only outcome evaluated was wage premium. The results on wage premiums for bilingual abilities have been mixed, with some studies finding a positive benefit, and others finding none or even a wage penalty (Kim).
International research has shown a positive relationship between earnings and bilin-gualism in multilingual and multicultural settings, such as Quebec, Canada (Kim, 2013). This relationship has been documented in the EU as well, with higher re-turns for positions in management or business services (Kim). Two recent US stud-ies also found positive relationships between wages and bilingualism (Kim; Saiz & Zoido, 2002). In one, a representative sample of recent bilingual college graduates earned a modest but significant wage premium of between two and three percent (Saiz & Zoido). Kim’s study focused on second-generation Korean-Americans, over half of whom worked in managerial or professional positions. Within this group, bilingual employees earned a 17-25 percent wage premium over their monolingual counterparts. In a study of second-generation Latino immigrants, those who were bilingual made $2000-3200 more per year than their limited Spanish, English-dom-inant peers (de la Garza, Cortina & Pinto, 2008).
Industry Highlight: HealthcareDifferences in language between the care team and the patient and family are a ma-jor barrier to high-quality healthcare (Agency for Healthcare Research and Quality [AHRQ], 2012). Linguistic barriers reinforce and extend health inequities through substantial decreases in the quality of care, patient safety, and patient satisfaction (AHRQ, 2012). Both the Joint Commission on the Accreditation of Healthcare Or-ganizations and Title VI of the Civil Rights Act mandate language services for LEP patients, including the use of interpreters (at high cost, as well as variable quality and efficiency) and/or bilingual staff (Kalist, 2005). Given the potential risks to the health of LEP patients, there are imperatives, both legal and ethical, to take steps to
IncreasIng amerIcan BIlIngualIsm
16 THE EVANS SCHOOL REVIEW16 THE EVANS SCHOOL REVIEW
dramatically increase the language abilities of healthcare workers.
There is limited evidence that bilingual nurses earn a wage premium for this ability. Despite the risks to LEP patients attributable to widespread monolingualism in healthcare, just nine percent of nurses speak a language in addition to English, and a third of these bilingual nurses speak Spanish (Coomer, 2011). Three studies have been completed that analyze wage premiums for bilingual (Spanish and English) nurses, compared to monolingual nurses (Coombs & Cebula, 2010; Coomer; Kalist, 2005). Two (Coomer; Kalist) found a five- to 11-percent wage premium for bilingual nurses, while the third study (Coombs & Cebula) had mixed results.
There is mounting pressure to reduce the health inequities in LEP communi-ties that result from compromised care in predominantly monolingual healthcare systems. Providing language-concordant healthcare to the growing number of LEP patients requires significantly more bilingual healthcare staff (Kalist, 2005). In ad-dition, as nurses continue to expand their roles as client advocates and educators, bilingualism will be increasingly valued (Coombs & Cebula, 2010).
Limitations of the LiteratureThere are several limitations in the current literature. Because it is predominantly made up of analyses of previously-collected survey data, the results are not very nuanced, and many factors have not been sufficiently explored (Kalist, 2005; Kim, 2013). Gender, geographic location, race, ethnicity, occupation, work set-ting and specific job duties each affect wages (Kalist; Kim). Indeed, in the stud-ies of wage premiums for bilingual nurses, differences based on these factors emerged (Coombs & Cebula, 2010; Kalist). Kalist found significant variation in the amount of wage premium for bilingual ability: Women earned eight percent less than men, rural nurses earned seven percent less than urban, and hospital-based nurses earned between four and 15 percent more than nurses in any other setting. Coombs and Cebula found non-Latino bilingual nurses earned a wage premium, while Latino bilingual nurses did not. Researchers have not yet uncovered the reason(s) for these differences. It may be due to supply-demand issues (in the case of Latino nurses living in an area with many bilingual Latinos) or employment dis-crimination based on gender or race/ethnicity (Coombs & Cebula; Kim).
Cultural expertise and linguistic skills are urgently needed to address economic challenges, strengthen the position of US businesses in the global marketplace, and enhance various professions’ ability to respond to a changing world, as well as an increasingly diverse US population (NEA Research, 2007). Americans’ pervasive
Jauregui
17VOL 5, SPRING 2015 17VOL 5, SPRING 2015
lack of knowledge about world cultures and languages threatens not only global competitiveness, but also the ability to deliver safe healthcare and protect national security (NEA Research).
Industry Highlight: National SecurityAgencies involved with foreign affairs, such as nongovernmental organizations and governmental bodies (such as the Central Intelligence Agency [CIA]), are in desperate need of bilingual employees (Duncan, 2010; NSEP, n. d.; Saiz & Zoido, 2002). The CIA consistently struggles with recruiting adequate numbers of bi-lingual staff, and in 2010 set the goal to double its bilingual staff within five years (Duncan). In order to support national security efforts, a major federal initiative, the National Security Education Program (NSEP), was developed (NSEP, n. d.). The NSEP is made up of nine fellowships and other programs designed to build a broader and more qualified pool of Americans who possess both world language and international skills. The primary focus is on the less commonly-taught lan-guages that are essential to economic and strategic interests. Even with the NSEP, however, the need for bilingual personnel knowledgeable in foreign affairs and na-tional security work far outstrips the supply (Duncan, 2010). The need for bilingual personnel puts significant pressure on state and federal budgets to invest in world language education (Dulfano, 2013).
Approaches to Develop Widespread World Languages Proficiency
Two promising approaches for developing widespread bilingualism are two-way, dual language immersion programs beginning in elementary school and the In-ternational Baccalaureate Diploma Program in high school. Each program has the explicit goal of developing fluency in a second language, a global understanding and cultural competency.
Two-way, Dual language Immersion Two-way, dual language immersion programs deliver other core content (e.g. mathematics) in the non-English language, rather than simply learning about the language for short periods several times a week, as in the typical American ap-proach (Tochon, 2009). Immersion programs have received attention since the 1960s as one of the most effective approaches for second language acquisition in children, creating higher levels of proficiency than other types of programs (Tochon). In fact, many studies have confirmed this as an excellent approach for all
IncreasIng amerIcan BIlIngualIsm
18 THE EVANS SCHOOL REVIEW18 THE EVANS SCHOOL REVIEW
children (Tochon).
Two-way, dual language immersion programs begin in preschool, kindergarten or first grade for English-dominant students. Native speakers of the non-English immersion language, however, are able to enter the program at later grades (Alanís & Rodríguez, 2008). These programs require a balance of English-dominant and other language-dominant students, ideally half of each group, and no less than a third of the class from either. This is the critical balance for the success of immer-sion learning. Each group serves as a linguistic resource and model for the other, and provides real demonstrations of language use in a variety of contexts, as well as opportunities for extensive practice with the target language (Alanís & Rodríguez).
Several principles of effective, high-quality programs have been outlined in the literature (Alanís & Rodríguez, 2008; Collier & Thomas, 2004; Tochon, 2009). A central feature of two-way, dual language immersion programs is the use of the non-English language no less than half of the instructional time, and up to 90 percent of the time in earlier grades (Collier & Thomas). In addition, the following foundational elements are necessary (Collier & Thomas):
• Minimum of six years of bilingual instruction, with a blend of English-domi-nant and other language-dominant students,
• Focus on core academic curriculum,• High-quality language arts instruction in both languages, which are integrated
into thematic units,• Separation of each language, with no translation or repeated lessons in the
other language,• Use of collaborative and interactive teaching strategies, and• Specialized teacher training on the key principles of the two-way, dual language
immersion approach.
The Seattle Public School District has several immersion programs in elementary schools. Setting up these programs provides a unique opportunity for collaboration with local area businesses to guide program development (Wallis & Steptoe, 2006). When John Stanford International Elementary School was exploring language offerings, the principal surveyed 1,500 business leaders and learned that Spanish, Mandarin and Japanese were the most in-demand languages (Wallis & Steptoe). The results not only reinforced the need for bilingual and globally-oriented education, but also revealed a demand for the development of skills in other disciplines, such as technology (Wallis & Steptoe).
Jauregui
19VOL 5, SPRING 2015 19VOL 5, SPRING 2015
Program OutcomesStudents in immersion programs consistently demonstrate positive effects on both first- and second-language skills – even when the second-language is used dur-ing 90 percent of the instructional time (Alanís & Rodríguez, 2008). Immersion students outperform non-immersion peers on measures of mathematics, as well as English reading and writing (Alanís & Rodríguez). Research also shows that the length of time spent in a dual language program is positively correlated with aca-demic achievement (Alanís & Rodríguez).
EquityTwo-way dual language immersion programs support social justice and equity (Al-anís & Rodríguez, 2008; Tochon, 2009). Rather than the typical remedial approach to LEP students – segregating them into separate classrooms and offering “watered down” instruction – immersion programs take a very different approach (Alanís & Rodríguez). LEP students are empowered through mainstream curricular content, taught in their native language and in the company of their English-dominant peers (Alanís & Rodríguez). This is not only critical in terms of equity in education, but also improves educational gains and outcomes, which confers benefits at the soci-etal level as well.
International Baccalaureate Diploma ProgramsThe evidence-based International Baccalaureate Diploma Program (IB) was devel-oped by a nonprofit organization in 1968 (International Baccalaureate [IB], n.d.). IB programs are in 1,400 US schools and 147 countries across the world. The IB can continue the linguistic training of immersion programs (though previous lan-guage courses are not a requirement), and builds upon it with the additional foci of international-mindedness and intercultural competence.
The IB is designed for 16 to 19-year-old high school students and consists of an academically rigorous two-year program. All coursework is studied through an international perspective. Students enroll in courses from five core areas for the duration of their final two years in high school: (1) language and literature, (2) lan-guage acquisition, (3) sciences, (4) individuals and societies, and (5) mathematics. Students select a sixth core area to study: visual arts, finance/economics, or an ap-proved elective. At the end of the program, students take written and oral exami-nations to demonstrate competency in each subject, including a world language.
In addition to coursework and exams, students also study three central areas to broaden their viewpoints on academic, social and aesthetic issues, through applied
IncreasIng amerIcan BIlIngualIsm
20 THE EVANS SCHOOL REVIEW20 THE EVANS SCHOOL REVIEW
learning. The Creativity, Action and Service requirement is a 150-hour service project that further develops the student’s skills as a global citizen. The Theory of Knowledge requirement consists of an interdisciplinary year-long course, which analyzes how different domains of study establish accepted knowledge. This re-quirement also includes an externally assessed essay, which is evaluated by the IB organization. The final requirement is the Extended Essay, a 4,000-word research paper on a topic related to one or two of the six core areas.
Upon completion of the IB diploma program, students earn the International Baccalaureate certification. This certification satisfies entrance requirements for hundreds of domestic and international universities; many institutions also award up to two years of college-level credits for IB courses.
Program OutcomesSurprisingly little research has been conducted on academic or employment out-comes for IB graduates (Bunnell, 2008). In one study comparing IB and matched students in Chicago, IB graduates reported feeling academically prepared to suc-ceed and excel in postsecondary work (Coca, et al., 2012). They were also 40 per-cent more likely to attend a four-year college and 50 percent more likely to attend a selective school (Coca, et al.).
Policy RecommendationsSince responsibility for education is at the state level, there is no federal world-language education policy (Klee, Lynch & Tarone, 1998). Currently, most decisions about world-language teaching and learning are made at the local school district level. As a result, access to, priorities for, and the quality of world language pro-grams are inconsistent (Klee, Lynch & Tarone). The lack of a nationwide guiding policy is a major impediment to achieving broad bilingualism in the US. The recent adoption of the Common Core standards suggests that the federal government may be poised to begin taking a more active role in guiding the linguistic education of the nation’s children.
The fundamental goal for a national policy would be to support and incentivize universal world language education, starting at the elementary level and continuing throughout compulsory education. Further, demonstration of proficiency in a sec-ond language as a high-school graduation requirement should be strongly encour-aged (Saiz & Zoido, 2002). States and local school districts should be empowered to adapt programs to meet the area needs through collaboration with local lan-guage communities and businesses.
Jauregui
21VOL 5, SPRING 2015
National World Language Education Policy: Funding
A comprehensive model for federal world language funding is offered by Wiley, More, and Fee (2012). They propose a “Language for Jobs” initiative, a collabora-tion among federal Commerce, Labor, State, and Defense departments, and spear-headed by the Department of Education. They advocate funding on par with the National Security Education Program ($100 million annually) to invest in world-language skill development in order to support the nation’s economic competitive-ness. Interagency resource sharing, as well as collaboration on goals, outreach and implementation, strengthen this approach.
National World Language Education Policy: Teachers and Teacher Training
Additional responsibilities in the Language for Jobs initiative include funding for teacher training. As previously discussed, there is a significant shortage of quali-fied world language teachers. Teaching world languages in an immersion context requires additional specialized training to develop new skills. The dramatically in-creased supply of teachers needed to accomplish a “world language for all,” requires a significant investment at the federal level for the education of new teachers and immersion training for current teachers.
National World Language Education Policy: Accountability and Evaluation
The Department of Education, under Language for Jobs, should also develop a set of world language education accountability measures for teachers and programs. All world language programs receiving federal funding should be required to dem-onstrate adequate student skill progression. Teaching quality and learning progress assessments should mirror those of the other core subjects – mathematics, reading and the sciences. Ideally, the assessment process should also address continuity dur-ing school transitions. Currently, without any standardized, widely-implemented assessment tool, students often must restart their studies in new classes after tran-sitioning from elementary to middle school or middle to high school. Consistent assessment of progression in language acquisition will facilitate continuity across these transitions and avoid undermining student motivation and wasting instruc-tional time on mastered content (Tochon, 2009).
Specific quality metrics are essential to elevate language learning to the level of other core subjects. Without this accountability, the influence of other standardized
IncreasIng amerIcan BIlIngualIsm
22 THE EVANS SCHOOL REVIEW
testing and the desire to transition LEP students to English quickly can sabotage the quality of immersion programs (Alanís & Rodríguez, 2008).
National World Language Education Policy: Equity
Under this initiative, the Department of Education would also develop and pro-mote world language immersion programs nationwide, leveraging the nation’s existing heritage language speakers (US residents whose native language is not English) to do so. Heritage language speakers are a large, untapped resource for immersion programs. Proficiency in heritage languages is often lost between the second and third generation in the US, but participation in immersion programs not only helps maintain heritage languages, it also honors them by utilizing speak-ers for classroom language practice. This is especially important given the historical practice of quickly moving LEP students to English-only proficiency rather than developing bilingualism and biculturalism (Dulfano).
World language education, begun in the early school years, also reduces several educational inequities. Minority and low-income students lag behind their white and higher-income peers in their linguistic, cultural and geographical knowledge and benefit greatly from globally-focused world language education (Duncan; NEA Research). Students of color and LEP and low-income students experience the greatest gains from early exposure to additional languages (NEA Research, 2007). As a result, early world language education narrows achievement gaps and supports educational attainment. (NEA Research).
ConclusionIn an increasingly connected and integrated world, fluency in world languages is critical for the US population. Predominant monolingualism and the lack of global knowledge disadvantages the US in global competitiveness and national security. It disadvantages individual Americans in job competitiveness and earnings. It hurts the bottom line of American businesses as well as compromises the health and safe-ty of a large and growing segment of American society. While promising approach-es exist for developing young students’ fluency in world languages, coordinated and sustained national educational policies are required to achieve a predominantly bilingual nation with the international knowledge and skills required to support US global economic competitiveness and national security. These policies will likewise enhance communication and collaboration with peoples around the world.
Jauregui
23VOL 5, SPRING 2015
The next step toward building national standards and support for widespread world language proficiency is to look to the states that have begun the process. As of 2014, Utah had 118 active elementary- and middle-school dual language immer-sion programs, with the goal of making immersion programs universal throughout the Utah public school system (Utah Dual Language Immersion, n.d). The effort in Utah is ongoing. A recent senate bill, which did not pass the house, would have mandated proficiency in a world language as a graduation requirement (Utah State Legislature, 2015). As with many federal policies (e.g. the Affordable Care Act), work begins in the states. Utah provides a model to evaluate evolving best practices and areas where further refinement is necessary. Successes and lessons learned from Utah and other states’ implementation of widespread, evidence-based lan-guage programs, will lead the way for developing a national policy toward educa-tion that builds a multilingual society.
Author Affiliations
Hilary Jauregui is a public health nurse with experience in maternal-child health and is passionate about addressing the social determinants of health, including ac-cess to high-quality education and employment. She will receive her Doctorate of Nursing Practice in Community Health Nursing, with a specialty in cross-cultural and global health, from the University of Washington.
IncreasIng amerIcan BIlIngualIsm
24 THE EVANS SCHOOL REVIEW
References
Agency for Healthcare Research and Quality (2012). Disparities in Healthcare Quality Among Racial and Ethnic Groups: Selected Findings from the 2011 Nation-al Healthcare Quality and Disparities Reports (AHRQ Publication No. 12-0006-1-EF). Rockville, MD. Retrieved from http://www.ahrq.gov/qual/nhqrdr11/nhqrdrminority11.htm.
Alanís, I. & Rodríguez, M. A. (2008). Sustaining a dual language immersion pro-gram: Features of success. Journal of Latinos and Education, 7(4), 305-319. Breton, A. (1998). Economic Approaches to Language and Bilingualism. New Canadian Perspectives (Cat. no. CH3-2-7/1998E). Official Languages Support Programs, Department of Canadian Heritage, 15 Eddy, Ottawa, Ontario, Canada K1A-OM5.
Bunnell, T. (2008). The global growth of the International Baccalaureate Diploma Programme over the first 40 years: A critical assessment. Comparative Education, 44(4), 409-424.
Coca, V., Johnson, D., Kelley-Kemple, T., Roderick, M., Moeller, E., Williams, N. & Moragne, K. (2012, March). Working to My Potential: The Postsecondary Expe-riences of CPS Students in the International Baccalaureate Diploma Programme. University of Chicago Consortium on Chicago School Research, Chicago.
Coombs, C. K. & Cebula, R. J. (2010). Are there rewards for language skills? Evidence from the earnings of registered nurses. The Social Science Journal, 47(3), 659-677.
Coomer, N. M. (2011). Returns to bilingualism in the nursing labor market—De-mand or ability? The Journal of Socio-Economics, 40(3), 274-284.
Cortina, J., de la Garza, R. & Pinto, P. (2008). No entiendo: The effects of bilin-gualism on Hispanic earnings. Documento de Trabajo, 8(06).
Duncan, A. (2010). Education and the Language Gap: Secretary Arne Duncan’s Re-marks at the Foreign Language Summit, speech transcript. Retrieved from the US Department of Education website: http://www.ed.gov/news/speeches/educa-tion-and-language-gap-secretary-arne-duncans-remarks-foreign-language-summit.
Jauregui
25VOL 5, SPRING 2015
Dulfano, I. (2013). Assessing the Economic Value of the Spanish Language. Global Business Languages, 18(1), 2.
Fry, R. & Lowell, B. L. (2003). The value of bilingualism in the US labor market. Industrial and Labor Relations Review, 128-140.
Gambino, C. P., Acosta, Y. D. & Grieco, E. M. (2014). English-Speaking Ability of the Foreign-Born Population in the United States: 2012. Retrieved from the US Census Bureau website: http://www.census.gov/library/publications/2014/acs/acs-26.html.
International Baccalaureate (n. d.). The IB Diploma Programme. Retrieved from http://www.ibo.org/diploma/.
Kalist, D. E. (2005). Registered nurses and the value of bilingualism. Industrial & Labor Relations Review, 59(1), 101-118.
Kim, C. (2013). The Economic Value of Bilingualism among 1.5- and Second-Gen-eration Korean Americans. Development and Society, 42(1), 89-112.
Klee, C., Lynch, A., & Tarone, E. (Eds.) (1998). Research and Practice in Immer-sion Education: Looking Back and Looking Ahead: Selected Conference Proceed-ings. Center for Advanced Research on Language Acquisition, University of Min-nesota.
National Security Education Program (n. d.). About NSEP. Retrieved from Nation-al Security Education Program website: http://www.nsep.gov/content/about-nsep.
NEA Research (2007, December). The benefits of second language study. Re-trieved from National Council for State Supervisors for Language website: www.ncssfl.org/papers/BenefitsSecondLanguageStudyNEA.pdf.
Saiz, A. & Zoido, E. (2002, October). The returns to speaking a second language. (Working Paper No. 02-16). Federal Reserve Bank of Philadelphia.
Tochon, F. V. (2009). The key to global understanding: World languages educa-tion—why schools need to adapt. Review of Educational Research, 79(2), 650-681.
IncreasIng amerIcan BIlIngualIsm
26 THE EVANS SCHOOL REVIEW26 THE EVANS SCHOOL REVIEW
Utah Dual Language Immersion (n.d.). Why Immersion? Retrieved from the Utah Dual Language Immersion website: http://www.utahdli.org/index.html.
Utah State Legislature (2015). SB 219 Substitute World Language Proficiency Recognition – Bill Status. Retrieved from Utah State Legislature Website: http://le.utah.gov/~2015/bills/static/SB0219.html.
Wallis, C. & Steptoe, S. (2006, December 6). How to bring our schools out of the 20th century. Time, 168(25), 50-56.
Wiley, L. G., Moore, S. C. & Fee, M. S. (2012). A “Languages for Jobs” Initiative. Retrieved from the Council on Foreign Relations website: http://www.cfr.org/united-states/languages-jobs-initiative/p28396.
Cairns
27VOL 5, SPRING 2015 27VOL 5, SPRING 2015
Our Skies, Our Schools, and Our Other Shortcomings:
Why Washington Needs a Revenue-Positive Carbon Tax
Washington State faces a triple, intersecting threat from climate change, inadequately funded education, and rising income inequal-ity. To address this threat, we will need a carbon policy that is capable of reducing greenhouse gas emissions, raising revenue for the state, and closing the wealth gap. This spring, as the Washing-ton Legislature considers Democrat-sponsored companion bills for a statewide revenue-positive cap-and-trade system (HB 1314 & SB 5283), the nonprofit group Carbon Washington finalizes its draft language for an initiative to the people concerning a revenue-neutral carbon tax. The legislative bills would create a carbon mar-ket by selling allowances for carbon emissions. Carbon Washing-ton’s plan would tax emissions and rebate sales tax. Both of these measures could help to reduce greenhouse gas emissions, and the cap-and-trade bill could raise revenue. In one sense, we are lucky to have a choice between two desperately-needed greenhouse-reduction plans. However, neither of these two policy proposals is capable of addressing the triple, intersecting crisis as well as a revenue-positive carbon tax can.
A revenue-positive carbon tax has the benefits of reducing carbon emission, generating revenue, and revamping our state tax regime, all of which could help address the triple crisis and live up to our aspirations expressed in the Washington Environmental Policy Act (SEPA). Such a tax would foster the general welfare by decreasing ambient air pollution, thereby promoting overall public health; it would fulfill social and economic requirements of both present and future generations of Washington citizens by addressing the present revenue and education crisis. Crafted with an eye toward reforming our regressive tax structure, it could also reverse our alarming trend of increasing social inequality. This article surveys the interaction between climate change, inadequate school fund-ing, and social inequality. It compares the options available for ad-
Why Washington needs a Revenue-Positive CaRbon tax
28 THE EVANS SCHOOL REVIEW
dressing these issues before concluding that Washington State needs a holistic policy that can operate on multiple fronts: ecological, educational, and economic.
Fifteen years into the new millennium, our fair state may be known for progressive laws relating to recreational marijuana and marriage equality. However, our record on the environment, education, and income inequality is far from strong. De-spite our fortunate access to relatively low-carbon hydroelectric power, our state continues to import 13% of our electricity from Montana’s coal-burning Colstrip plant (Seattle Times, 2014). Even if we were to minimize imported electricity, our hydropower is premised on ecologically-dubious damming practices and depends on reliable snowpack. Such snowpack is, in an age of global warming, increasingly unpredictable. Our lack of strategy to confront our environmental issues spells big trouble for our state. Governor Inslee acknowledged that climate change could cost Washington $10 billion per year beginning around 2020 (Inslee, 2014). Climate change will damage our fisheries, agriculture, and human health. The warming of the atmosphere can create a lack of predictability in weather condi-tions, disastrous pest dynamics affecting agriculture, lag effect for planting cycles, and CO2 fertilization (some plants grow better with added CO2.) Further, we face infrastructure issues as the sea level rises. Parts of Seattle, for example, will be underwater and those engines of our economy, the ports, might struggle to adjust. Ocean acidification affects costal fishing, shellfish, and clamming, not to mention recreation. All of these climate change effects have economic consequences. Our response to this threat is thus far inadequate.
Further, as made clear by McCleary v. State, Washington is not meeting its mandate to adequately fund public education. For years, the state legislature forced school districts to enact local levies to fund operations. McCleary revisited the existing understanding that “compliance with Const. art. 9, ss 1 and 2 can be achieved only if sufficient funds are derived, through dependable and regular tax sources…” (Se-attle School District No. 1 of King County. v. State 1978). In other words, the state has a duty to fund basic education by means of a dependable and regular tax source. According to the most current estimates, our budget shortcoming is calculated round $6 billion (Blankinship, 2015). This is one reason a revenue-neutral carbon tax is preferable to a cap-and-trade system: It can help us comply with our Consti-tutionally-mandated method of funding public education. A cap-and-trade model would not be a dependable and regular tax source, since it would be an auction—not a tax—and it would vary with the market.
McCleary emphasizes the need for a new tax in Washington, but there is one other
Cairns
29VOL 5, SPRING 2015
compelling reason to create a carbon tax: It is an opportunity for progressive tax reform. Washington’s tax scheme is known as the nation’s “most regressive tax structure,” in large part owing to the state’s high sales tax (ITEP, 2015). Regressive tax structures are characterized by requiring lower-income groups to pay dispro-portionately more of their income to taxes than higher-income groups. In Wash-ington, the lowest quintile of income pays 16.8% of income as taxes, while the top 1% pays 2.4% (ITEP, 2015). The result is that the rich retain more wealth and poor have a harder time escaping poverty. Income inequality is a persistent con-cern. According to the most recent American Community Survey, Washington was among 15 states with a rising GINI coefficient (Chokshi, 2014). Our rising income gap combined with our perennially regressive tax system causes a revenue crisis in the state. The majority of wealth is owned by the top 20% of the income bracket, who pay an inadequate percentage of their income in taxes. The consequence of this dynamic is that for the past twenty years, state taxes as a percentage of state GDP have declined (OFM, 2012).
There is a nexus between climate change, education, and income inequality. True, just as both wealthy and poor countries will be affected by anthropogenic climate change (Stern, 2007), in Washington State both wealthy and poorer demographics will be affected. However, we can expect the loss to be borne primarily by low-in-come Washingtonians. Think of how extreme weather events such as Hurricane Ka-trine and Hurricane Sandy displaced poorer residents. Take another example: how local levies to fund education result in wealthier communities with better schools than poorer communities. Finally, consider Joseph Stiglitz’s arguments about the incalculable costs of social inequality. He writes, in terms as applicable to our state as they are to our country:
“There are two visions of America a half century from now. One is of a society more divided between the haves and the have-nots, a country in which the rich live in gated communities, send their children to expensive schools, and have access to first-rate medical care. Meanwhile, the rest live in a world marked by insecurity, at best mediocre education, and in effect rationed health care—they hope and pray they don’t get seriously sick. At the bottom are millions of young people alienated and without hope. I have seen that picture in many developing countries; econo-mists have given it a name, a dual economy, two societies living side by side, but hardly knowing each other, hardly imagining what life is like for the other. Whether we will fall to the depths of some countries, where the gates grow higher and the societies split farther and farther apart, I do not know. It is, however, the nightmare towards which we are slowly marching” (Stiglitz, 2012).
Why Washington needs a Revenue-Positive CaRbon tax
30 THE EVANS SCHOOL REVIEW
In short, there is a lot of work to be done.
This is not to say that our ambitions are too low or our intentions necessarily cor-rupt. We have legal controls in place. Indeed, Washington State is legally required to protect the environment. In 2013, Court of Appeals Judge Thomas Bjorgen expressed how, as a matter of State law, “each generation is trustee of the environ-ment for succeeding generations” (Lands Council v. Washington State Parks Recre-ation Commission 2013). Indeed, the legislature and all state agencies are bound by the Declaration of the SEPA, which declares “each person has a fundamental and inalienable right to a healthful environment and that each person has a respon-sibility to contribute to the preservation and enhancement of the environment” (RCW 43.21C.020(3)). Currently, a discussion is emerging around a proposal for an amendment to the Washington State Constitution that would incorporate an af-firmative right to a healthy environment (Cohen, 2015).
Short of amending the Constitution—which would be a welcome move—Wash-ington could do more follow the spirit of SEPA. SEPA, which was enacted in 1971, serves now to obligate environmental studies of proposed legislation (Rodgers, 1984). However, SEPA has never been just about the environment – it has all along contemplated the overall welfare and social health of future generations. RCW 43.21C.020(1) declares the three aims of the SEPA: to “(a) foster and promote the general welfare; (b) create and maintain conditions under which human beings and nature can exist in productive harmony; and (c) fulfill the social, economic, and other requirements of present and future generations of Washington citizens.” Considering the triple crisis outlined above in light of SEPA’s mission, our short-comings in environmental policy are obvious.
Governor Inslee has demonstrated a political will to change. He has committed Washington to “set binding limits on carbon emissions and deploy market mecha-nisms to meet those limits” (PCAPCE, 2014). In promulgating a better carbon policy, Governor Inslee and Christy Clark, the Premier of British Columbia, could make good on their promise in the Pacific Coast Action Plan on Climate and En-ergy to “link programs for consistency and predictability and to expand opportuni-ties to grow the region’s low-carbon economy” (PCAPCE, 2013). In April 2014’s Executive Order 14-04, Governor Jay Inslee expressed interest in developing a “market-based” plan to reduce greenhouse gas emissions in Washington State. More specifically, by 2020, the State aims to have twenty-five thousand “green economy jobs” (RCW 43.330.310) and to have reduced overall greenhouse gas emissions to 1990 levels (RCW 70.235.020).
Cairns
31VOL 5, SPRING 2015
We may have identified the problem and we may have verbal commitments to fol-low through. So, why isn’t our concrete environmental policy consistent with these goals? With so much at stake, can we afford anything less than the most effective policy tool at our disposal? Considering the severe discrepancy between our ambi-tions and our reality, revenue-positive carbon tax is really our best option.
To understand the purpose and function of a carbon tax, this article will first touch upon its basis in economic theory and then describe how it works in practice in British Columbia.
Basically, a carbon tax charges emitters like energy producers for greenhouse gas emissions, measured in carbon dioxide equivalent. In economic theory, greenhouse gas emissions are a negative externality. That is, they are the social cost of a pri-vate activity. A carbon tax is known as a “Pigouvian tax” (named for the economist Arthur Pigou), because it aims to reflect the cost of the externalities in the price of greenhouse gas emissions. Without such a tax, carbon-intensive fuels like coal and petroleum are cheap relative to green renewables like solar and wind, because the carbon-intensive fuels do not price in the deleterious economic effects associ-ated with their consumption. The negative externalities are felt by the economy as a whole, not just the individual consumer. Economists have a name for this wide-spread externalization of costs: a market failure. When the market can’t solve a problem, society will need to take interventionist action. The level of intervention required to reduce greenhouse gas emissions will be high, and a carbon tax would be the most effective option. It’s a solution appropriate to the problem. Anthropo-genic climate change may be the single largest market failure in human history. It affects not just the environment, but also our livelihood and our quality of life.
Simple and direct, a carbon tax would push greenhouse gas emitters to reduce their carbon impact or pay the tax to internalize the cost of their emissions. It could be targeted to an individual emitter, a set of emitters, or an entire industry. To imple-ment a carbon tax, the state would need to measure the tons of carbon emissions produced by an entity and it would need to set an appropriate price per ton. The measurement would probably be done by self-reporting to the Department of Ecology and regular auditing. The price would be set by statute, see for example Carbon Washington’s proposal (http://carbonwa.org/legal-language/).
By taxing carbon, we can both reduce greenhouse gas emissions and generate revenue. The dual purpose of Pigouvian taxes can be seen in prominent examples like so-called “sin taxes.” Sin taxes place additional financial burdens on smoking,
Why Washington needs a Revenue-Positive CaRbon tax
32 THE EVANS SCHOOL REVIEW
alcohol, and bottled water. Because the private benefit of these activities creates a burden on public goods, such as the health care system and landfills, sin taxes dis-incentivize the activity and attempt to supply funding for remedial measures. The legal incidence of a carbon tax would fall “upstream” on energy providers and fuel importers. The tax would take the form of a tax on greenhouse gas-contributing fossil fuels like gasoline and coal. Through market allocation, consumers would bear the costs in the form of higher gasoline and energy prices. A carbon tax, then, is priced to make it more expensive to generate greenhouse gases than to pay the tax. It would lead to a mixture of greenhouse gas reduction and increased revenue. The tax revenue could be used for reduction measures or other public goods. Although a carbon tax would be somewhat regressive, it could compensate for a re-duction in sales tax and supplement the Working Families Rebate for lower-income groups.
How does a carbon tax work in practice? For that answer, we can look to our northern neighbor. On July 1, 2008, British Columbia adopted North America’s first revenue-neutral carbon tax. The tax phased in over the next four years, reach-ing the final scheduled increase on July 1, 2012. The current price for carbon is $30 Canadian per metric ton of CO2. B.C.’s tax is revenue-neutral, which means that all revenue raised is swapped for tax reductions elsewhere. This tax recycling is taken seriously – so much so that the province’s Minister of Finance is penalized with a 15% salary reduction should the tax net any revenue. Aside from its reve-nue-neutrality, the tax swap was politically palatable in B.C. because the Conser-vative Party premier, John Cummins, oversaw the tax with support from his own party and that of the province’s Liberals.
After implementing its carbon tax, B.C. has successfully reduced greenhouse gas emissions. The province’s example could allay fears that carbon taxes are an ineffec-tive mechanism for meeting reduction goals. The province will complete a progress report this year on its Climate Action Plan. As of 2012, the final year of the carbon tax rate increase, the province was expected to meet its goal of 6% reduction in greenhouse gases since 2007 (Making Progress, 2012). The province has experi-enced a 5.3% per capita reduction above the Canadian average (Place, 2012).While B.C.’s tax has effectively reduced greenhouse emissions, it has not had a noticeable negative effect on the economy. B.C.’s economic performance since 2008 has tracked the overall Canadian recession and recovery, with a downturn be-tween 2008 and 2009, followed by an upswing. In comparison to other provinces, B.C.’s GDP growth has fared better than average since implementing the carbon tax (Making Progress, 2012). So, while there are undoubtedly confounding fac-
Cairns
33VOL 5, SPRING 2015
tors, there is no established inverse correlation between implementing the tax and supporting economic growth. In other words, carbon taxes can be consistent with economic growth.
One key virtue of the carbon tax is that it is enforceable on a small scale. A carbon tax in Washington wouldn’t depend on the action of other jurisdictions, though similar policies in other states or provinces certainly couldn’t hurt. As a neighbor and intimate economic and environmental partner with B.C., Washington’s carbon tax could complement regional efforts to reduce greenhouse emissions. By encour-aging a price for carbon emissions, the tax could also integrate well into a cap-and-trade model, such as California’s.
The list of virtues could expanded, but perhaps the best light in which to view the policy is in comparison with the alternatives.
The challenge of convincing Washingtonians about the virtues of a revenue-positive carbon tax shouldn’t be understated, as they are real and substantial. Even so, there are reasons to be hopeful that with enough information we could overcome the political hang-ups. Perhaps the best argument is to compare the revenue-positive carbon tax to the alternatives: inaction, cap-and-trade, and revenue-neutral carbon taxes.
First, the problems with inaction are self-evident, and perhaps its only strong argu-ment is the difficulty of action in the first place. Some argue that a carbon tax is simply not politically feasible. Many Washingtonians abhor taxes qua taxes. How-ever, more than 30 countries have passed carbon pricing laws. Of the countries that committed to reduce greenhouse gas emissions under the UN Framework Convention on Climate Change, some have implemented carbon taxes to fulfill their commitments. India, Japan, South Korea, Australia, and around 11 European nations have adopted energy taxes. Boulder, Colorado, passed a municipal carbon tax in 2006. Revenue from Boulder’s tax is invested in programs to further reduce greenhouse gas emissions.
Some point out that one of the rhetorical challenges facing proposed carbon taxes is that the taxes adversely affect economic performance. As the argument goes, a carbon tax at odds with development is a non-starter. Yet the DICE model, devel-oped by William Nordhaus, estimates that greenhouse gases, if left at current emis-sion rates, already adversely affect economic performance. Climate change should be an economic issue for all Washingtonians. Ocean acidification is harming the
Why Washington needs a Revenue-Positive CaRbon tax
34 THE EVANS SCHOOL REVIEW
local shellfish industry. And in a state so dependent on hydroelectric power, declin-ing glacial area and spring snowpack could potentially interrupt our main source of carbon-neutral energy, creating a positive leakage effect from failure to reduce greenhouse emissions through a carbon tax.
Second, why would a more business-friendly cap-and-trade system with offsets be less politically feasible and equally as efficient as a carbon tax? History rebuts this presumption. As Brittany Harris points out, “[i]n reality, environmentally effective and economically efficient carbon emission trading systems have eluded both the international community and the European Union, and in practice have arguably increased emissions by artificially prolonging and legitimizing reliance on fossil fuels” (Harris, 2014). Unlike a cap-and-trade system, a carbon tax could become effective almost immediately, making it the quickest way to lower greenhouse gas emissions (Sewalk, 2012). British Columbia’s carbon tax was up and running within five months, while the Northeast’s Regional Greenhouse Gas Initiative took five years (Duff, 2008). Further, while it should be conceded that a cap-and-trade program could raise revenue by auctioning allowances, this would probably not help our state with McCleary compliance. (We need “dependable and regular tax sources.)
Third, what is gained or lost by insisting on a revenue-positive model instead of a revenue-neutral carbon tax model? A revenue-neutral carbon tax is more politi-cally palatable to many in the state, while the two methods are equally efficient in reducing greenhouse gases. Thus, one might argue that the importance of reducing carbon emissions through the most politically-straightforward method outweighs any interest in raising revenue for the state. Why not copy British Columbia in this aspect? For Yoram Bauman, one of the major salutary effects of British Columbia’s model is the tax-swap. The tax swap creates such an effect whereby carbon taxes, instead of contributing revenue, reduce corporate income taxes.
To be clear, there is a lot at stake with the distinction between the two models. If Washington adopted B.C.’s carbon tax model, the $30 per ton CO2 would gen-erate an estimated $145 billion each year at current emissions (Bauman & Hsu, 2012). The choice between revenue-neutral and revenue-positive determines what happens to this remarkable amount of money generated in our economy.
Reasonable minds can differ as to which option to prefer for Washington’s econ-omy. This article suggests that perhaps the economy should not be the overrid-ing concern of environmental policy. The intersecting nature of climate change,
Cairns
35VOL 5, SPRING 2015
education, and social inequality is perhaps sufficient to tilt the scales in favor of the revenue-positive model for policy reasons. Considering the expected $6 billion of McCleary compliance, the $10 billion of environmental loss from climate change by 2020, and the incalculable social effect of rising inequality, the potential benefits of a revenue-positive carbon tax are hard to ignore. Moreover, there is a strong argument to make for state support for progressive initiatives funded by increased revenue. The revenue could, for example, lower tuition rates for public higher education programs, fund pre-school programs, improve water quality by installing urban swales, or fund the preservation of carbon sinks like Washington’s forests.
In conclusion, a revenue-positive carbon tax is the only policy tool which can speedily reduce greenhouse emissions, integrate into our regional environmental plan, raise revenue, and create progressive tax reform. For these reasons it’s our best option. To quote William Nordhaus, “[t]axes may be unpopular, but they work” (Tickell, 2009). Washington State should overcome its political inhibitions and pur-sue this policy option. A carbon tax in our state would work, and it would work on multiple levels to address the problems with our skies, our schools, and our other shortcomings.
Author Affiliations
Daniel Cairns is a third-year J.D. candidate at University of Washington School of Law and Editor-in-Chief of Washington International Law Journal. He holds a B.A. from University of Puget Sound and a M.A. in Social Science from University of Chicago.
Why Washington needs a Revenue-Positive CaRbon tax
36 THE EVANS SCHOOL REVIEW
References
Bauman, Y. & Hsu S. (2012, July 4). A Carbon Tax, Sensible for All. The New York Times. Retrieved from www.nytimes.com/2012/07/05/opinion/a-carbon-tax-sensible-for-all.html
Blankinship, D. (2015, February 17) Lawmakers: Fixing Washington education could hit $6 billion. Retrieved from www.komonews.com/news/local/Lawmak-ers-Fixing-Washington-education-could-hit-6-billion-292315441.html
Chokshi, N. (2014, September 18). Income Inequality Last Year Rose in 15 States. The Washington Post. Retrieved from www.washingtonpost.com/blogs/govbeat/wp/2014/09/18/income-inequality-last-year-rose-in-15-states/
Cohen, D. (2015). Forever Evergreen: Amending the Washington State Constitu-tion for a Healthy Environment. Washington Law Review 90, 349-404
Duff, D. (2009). Carbon Taxation in British Columbia. Vermont Journal of Environ-mental Law 10, 87, 87-107
Harris, B. (2014). Repeating the Failures of Carbon Trading. Pacific Rim Law & Policy Journal 23, 755, 755-793
Inslee, J. (2014). Washington Carbon Pollution Reduction and Clean Energy Leadership. Retrieved from www.governor.wa.gov/documents/Carbon_pack-age_overview_2015L.pdf
Institute on Taxation & Economic Policy. (2015). Who Pays? A Distributional Analy-sis of the Tax System in All 50 States. http://www.itep.org/pdf/whopaysreport.pdf.
Making Progress on B.C.’s Climate Action Plan (2012). www.env.gov.bc.ca/cas/pdfs/2012-Progress-to-Targets.pdf
Office of Financial Management. (2012). The Distribution of Income, Wealth, and Taxes Across Washington Househouses. Retrieved from www.ofm.wa.gov/re-ports/income_wealth_report.pdf
Cairns
37VOL 5, SPRING 2015
Pacific Coast Action Plan on Climate and Energy (2013). Retrieved from www.pacificcoastcollaborative.org/Documents/Pacific%20Coast%20Climate%20Ac-tion%20Plan.pdf
Place, E. (2012, November 5). Deciphering the Impacts of BC’s Carbon Tax. Sight-line Daily. Retrieved from www.daily.sightline.org/2012/11/05/deciphering-the-impacts-of-bcs-carbon-tax/
Rodgers, W. (1984) The Washington Environmental Policy Act. Washington Law Review 60, 33
Seattle Times. (2014 May 13) Montana Lawmaker Criticizes Washington’s Coal-Power Plan. Retrieved from www.seattletimes.com/seattle-news/montana-law-maker-criticizes-washingtonrsquos-coal-power-plan/
Sewalk, S. (2012). Carbon Tax with Reinvestment Trumps Cap-and-Trade. Pace Environmental Law Review 30, 611-612, 580-624
Stern, N. (2007). The Stern Review on the Economics of Climate Change.
Stiglitz, J. (2012). The Price of Inequality: How Today’s Divided Society Endangers Our Future. New York, NY: W. W. Norton & CompanyTickell, O. (2009, March 19) Replace Kyoto protocol with global carbon tax, says Yale economist. The Guardian. Retrieved from www.theguardian.com/environ-ment/2009/mar/12/carbon-tax-should-replace-kyoto-protocol
38 THE EVANS SCHOOL REVIEW
Issues In CrImInal JustICe & PsyChology aPPlIed to seattle
38 THE EVANS SCHOOL REVIEW
Contemporary Issues in Criminal Justice & Psychology with
University of Washington Evans School of Public Policy and Governance
MPA Candidate
IntroductionIn the aftermath of the shooting of Michael Brown in Ferguson, MO, and the many similar cases of unarmed black youth killed by police highlighted in the media since, it is becoming clearer to many that there are serious problems with the way the U.S. crimi-nal justice system works (or does not work). From police brutal-ity to stop-and-frisk laws to disparities in drug arrests and lengths of sentences, criminal justice is an arena where many feel some of the deepest inequities in our society persist. Until recently, these disparities have largely remained outside of public consciousness.
Several questions are raised by this landscape. First, why have we as a society permitted (and even promoted) such unequal practices in the way we police, sentence, incarcerate, and treat the formerly incarcerated? Second, what can be done to move toward a more just justice system? I argue that the fields of social and cognitive psychology can help us to better understand both of these ques-tions, pointing us in the direction of reforming our systems in the name of equity. The literature that has developed on retributive, procedural, and restorative justice, system justification theory, and intergroup relations can help us address both why we have landed where we have as a society with little protest and also how we might move forward. In this paper, I provide a broad overview of major contemporary issues in the U.S. criminal justice system that disproportionately affect people of color, provide a summary of the literature in social and cognitive psychology that I argue can be used to understand and address those issues, followed by a closer look at a local Seattle campaign to prevent the building of a new youth detention center as a case study to explore more specifically how we can apply the theories presented in the literature.
39VOL 5, SPRING 2015
Spokane
What’s Wrong with Criminal Justice in America?In short, a lot. As an entry point into a discussion of how psychological research can help us better understand and address these problems, I begin with an over-view of some of the major issue areas that have, at moments, crept into the public consciousness in recent months and years. These issues have received growing attention due to events such as efforts to eliminate the practice of “stop-and-frisk” in New York City last year, the exoneration of those responsible for the deaths of Trayvon Martin and Michael Brown, and Michele Alexander’s The New Jim Crow hitting bestseller status.
Stops & ArrestsIndividuals’ experience with the criminal justice system begins with an interaction with a police officer. Practices such as stop-and-frisk impact whole communi-ties who grow weary of constantly being questioned, assumed to be criminal until proven otherwise. The New York Civil Liberties Union reports that “from 2002 to 2011, black and Latino residents made up close to 90 percent of people stopped, and about 88 percent of stops – more than 3.8 million – were of innocent New Yorkers.” This is true even in predominantly white neighborhoods: “In 2011, Black and Latino New Yorkers made up 24 percent of the population in Park Slope, but 79 percent of stops” (New York Civil Liberties Union, n.d.).
Surveys from the late 1990s revealed that whites used and sold drugs at the same rates as people of other races and ethnicities, but blacks were detained on drug-re-lated charges at more than twice the rate of whites (Holman & Ziedenberg, 2006). Michelle Alexander explains the War on Drug police practices that have promoted such disproportionate stops and arrests: “When police go looking for drugs, they look in the ‘hood…. The hypersegregation of the black poor in ghetto communities has made the roundup easy” (Alexander, 2012, p. 124). Given the incentives for police forces to make more arrests and the lack of political backlash against such arrests from those in power, police take advantage of the fact that “black and Latino drug users are more likely than white users to obtain illegal drugs in public spaces that are visible to the police, and therefore it is more efficient and convenient for the police to concentrate their efforts on open-air drug markets in ghetto commu-nities” (Alexander, 2012, p. 125).
Who Goes to JailSince the 1980s, the US penal population has risen from 300,000 to over two mil-lion, making ours the highest incarceration rate in the world, even as crime rates have actually declined. Alexander (2012, p. 6) notes that “no other country in
40 THE EVANS SCHOOL REVIEW
Issues In CrImInal JustICe & PsyChology aPPlIed to seattle
the world imprisons so many of its racial or ethnic minorities. The United States imprisons a larger percentage of its black population than South Africa at the height of apartheid.” In some states, black men have been imprisoned on drug charges at rates 20-50 times greater than those of white men, despite equal rates of drug use and selling of drugs among whites and people of color (Alexander, 2012, p. 7). Here in King County, in 2013, black youth were nine times more likely to be incar-cerated than their white counterparts, despite the fact that King County’s popula-tion is only around seven percent Black, with similar trends for Latino and Native American youth (Kelety, 2014). These disparities outlive the sentences given to the convicted, as those with criminal records will be “subject to legalized discrimina-tion for the rest of their lives” (Alexander, 2012, p. 7).
Long Sentences and ExecutionThe Equal Justice Initiative (EJI) reports that more than half of the 3,095 people on death row in the U.S. are people of color, and 42% are African American. Further, a defendant is more likely to get the death penalty if the victim is white than if the victim is black, and the key decision makers in death penalty cases across the coun-try are almost exclusively white. Each year in Alabama, where EJI is based, nearly 65% of all murders were of black victims, yet 80% of the people currently awaiting execution in Alabama were convicted of murdering whites (Equal Justice Initiative, 2014). In his book, Just Mercy, EJI founder and director Bryan Stevenson (2014) tells the story of Walter McMillian, who was wrongly convicted of murder and placed on death row. Stevenson illuminates the deep prejudice that can affect every step of the process from arrest to execution. In a study of death penalty sentenc-ing, Eberhardt et al. (2006) find that the more stereotypically black a defendant appears, the more likely they are to be sentenced to death.
School-to-Prison PipelineWith the coining of the phrase “school-to-prison pipeline,” awareness has grown about the impacts of disproportionate disciplining of students and the strong con-nection of disciplinary action to entering the criminal justice system. In Washing-ton State, students of color in 177 school districts were on average 1.5 times more likely to be disciplined than white students, and Native Hawaiian/Pacific Islanders, American Indian/Alaska Natives, and African Americans were more than twice as likely to be disciplined (Washington Appleseed, 2012). Washington Appleseed reports that “zero-tolerance policies coupled with heightened police presence in schools has led to increased student arrests on school premises and a spike in direct student referrals to the juvenile court system, often for non-criminal offenses.” The trend starts early; the majority of moderate and high risk juvenile offenders in
41VOL 5, SPRING 2015
Spokane
WA in 2007 were first suspended by the time they were 13 years old. The school-to-prison pipeline can in fact be a vicious cycle; for some youth who return to their communities after a period of incarceration, having a juvenile record can trigger an emergency expulsion before they even come back to school. At the same time, numerous studies have demonstrated that school engagement after incarceration is an essential protective element in keeping youth from re-engaging in criminal behavior (Washington Appleseed, 2012).
How Can Psychology Help Us Understand andAddress What’s Wrong?
While the problems outlined above can seem overwhelming, lessons from the cutting edge of psychological research can help us understand why these problems have persisted and also gain insight into what could be done to solve them. The following areas of literature provide helpful insights on a variety of criminal justice issues.
Procedural JusticeWe tend to discuss justice in terms of outcomes – a jury’s verdict, a judge’s sen-tence. But the literature on “procedural justice,” which began taking hold in the 1970s led by John Thibaut and Laurens Walker, suggests that people are concerned not only with the outcomes they receive, but also with how decisions are made (Tyler, Boeckmann, Smith, & Huo, 1997, p. 75). The substantial research that has developed within this literature has shown that people react to the fairness of procedures in many arenas, including trials, plea bargaining and mediation, and police-citizen interaction as well as in organizational, political, and educational set-tings (Tyler, Boeckmann, Smith, & Huo, 1997, p. 82).
The current debate about the killing of Michael Brown, Eric Garner, and others affirms these findings. While a large part of the anger of protesters stems from the very fact of the deaths, the procedure by which the white officers responsible for the killings were evaluated and then exonerated appears just as much in the pub-lic discourse. The suggestion that the prosecutor in the grand jury proceedings in Brown’s case, Bob McCullough, served as president of an organization that raised money for the Darren Wilson Defense Fund and the fact that McCullough’s father was killed in the line of duty by a black man were among the many complaints with the grand jury process that have been raised to question the legitimacy of the outcome (Driscoll, 2014). The racial makeup of the grand jury in the Brown case (three black and nine white – comparable to St. Louis County but the reverse of
42 THE EVANS SCHOOL REVIEW
Issues In CrImInal JustICe & PsyChology aPPlIed to seattle
Ferguson’s own demographics) add motivation to protests on the grounds of pro-cedural justice (CBS, 2014). Alexander (2012, pp. 119-123) details the history of discrimination in jury selection dating back to slavery through today, when prose-cutors circumvent Supreme Court rulings against explicit race-based jury selection such that all-white juries deciding cases involving black defendants continue to be commonplace.
Procedural justice can also help us to understand why in most cases and in most times, lack of fairness in criminal justice systems does not result in widespread pro-test. Tyler et al. (1997, pp. 101-2) describe that the “fairness heuristic” leads us to believe that procedures must have been fair, and thus we accept the outcome. Due to the common belief that “the procedures for allocating resources involve, at least in theory, a free and open contest in which those with intelligence and ability can rise to the top through their personal efforts,” the poor and marginalized do not revolt, despite what appear to be quite unfair (or at least unequal) outcomes.
System Justification TheoryAnother area of literature that helps us to understand why those harmed by the status quo do not protest against it is “system justification theory.” Gary Blasi and John Jost (2006) review research that has shown how system justification operates through both “victim-blaming” and “complementary stereotypes.” That is, that we both assign negative characteristics to victims to justify to ourselves why they have received the outcomes they have, while at the same time assigning complementary characteristics, causally unrelated to those outcomes, to assuage our guilt about their lot. For instance, we stereotype blacks as lazy, thus justifying their lower economic status, but also as friendly and fun-loving or physically attractive to make us feel better about their life experience.
Blasi and Jost (2006) explain that “justifying the status quo satisfies several needs, including epistemic needs for consistency, coherence, and certainty, and existential needs to manage various forms of threat and distress and to find meaning in life.” Threats to the current system that do not have the perceived potential to over-throw the status quo and replace it with a new system instead “stimulate defense of the existing system and vengeance against those who threaten it.” Blasi and Jost de-scribe system justification as a “coping mechanism” both for those who benefit from and those who are disadvantaged by the status quo, “reducing anxiety, uncertainty, and distress and promoting positive rather than negative affect.”
43VOL 5, SPRING 2015
Spokane
Thus this literature can help us further understand how communities of color have suffered relatively quietly until recently under a criminal justice regime of great disparity and also understand the passionate backlash among whites – and some blacks – against the current wave of protest under the rallying cry of #blacklives-matter. Because these protests question the legitimacy and fairness of our current system, they provoke a strong need to justify it in order to maintain a self-under-standing that those of us who are advantaged deserve what we have and to solve the cognitive dissonance that would be created if we were to accept that the protests were credible.
Intergroup RelationsResearch pioneered by Henri Tajfel in the early 1970s has shown that people have a strong tendency to discriminate against “outgroup” members and prefer “ingroup” members even when those groups are defined arbitrarily. Tajfel (1970) shows that members of a group are inclined to punish members of another group even when the punishment comes at a cost to oneself. Rather than maximizing total utility for all, the “maximization of difference” was revealed to be most important to partici-pants in his experiments. Social identity theory has shown that we approach others by categorizing them, identifying others and ourselves in relation to group identity, and comparing ourselves favorably to the other group (Hall, 2014).
More recent research suggests that even if we believe that discrimination against outgroups is wrong, we do not accurately predict what our response will be to discriminatory acts, e.g. expressions of racism (Kawakami, Dunn, Karmali, & Dovi-dio, 2009). While we believe that when faced with racist actions we will intervene, we over-predict the extent to which we actually do so. Adding to the difficulty in cross-race interactions, researchers have found that different racial groups tend to have different – and conflicting – underlying interests and motivations when engag-ing in cross-race interactions. For example, while blacks tend to most desire being respected by whites they communicate with, whites instead are most driven by the desire to be liked when interacting with blacks (Bergsieker, Shelton, & Richeson, 2010).
The development of the Implicit Association Test (IAT) has helped to reveal how our racial biases are embedded, contrary to our explicitly stated beliefs. One of the creators of the IAT, Anthony G. Greenwald, reviews the findings produced by IAT and shows that even small IAT effects can have significant societal implications (Greenwald, Banaji, & Nosek, 2015, in press). This review suggests that IAT mea-sures can be used to predict discrimination in decisions in the arenas of personnel,
44 THE EVANS SCHOOL REVIEW
Issues In CrImInal JustICe & PsyChology aPPlIed to seattle
law enforcement, criminal justice, education, and health care by identifying those who are especially prone to committing discrimination and to understand system-level discrimination.
The research on intergroup relations can and should be used in a variety of ways to understand and address the many mechanisms of disparity in our criminal justice system, from policing practices to court proceedings and sentencing. For one, greater awareness among those who are employed in criminal justice institutions (police, judges, prosecutors, etc.) about implicit bias may help to discuss the prob-lems with a more scientific, and thus more acceptable, frame. That is, by present-ing research that shows these are tendencies we all succumb to, despite our best intentions, officers and other actors may be more likely to ease off of their defen-sive reactions against perceived claims that they are being called “racists.”
Case Study: Applying Lessons from Psychology toSeattle’s Juvenile Detention Center
In order to make more concrete the possibility of applying research insights from the bodies of literature summarized above, below I use a current issue in Seattle – activism focused on preventing the building of a new youth detention center – as a case study for how this could be done in other arenas of criminal justice prob-lems. I begin with an explanation of the context – a proposed new youth deten-tion center and the “No New Youth Jail Campaign” led by social activists to protest its construction. Then, I offer some potential paths, informed by what we have learned from behavioral decision research, toward addressing the concerns raised by the No New Youth Jail Campaign.
Juvenile Detention Center in Seattle’s Central District andActivism to Oppose It
The Juvenile Detention Center that has provoked this debate is managed by the King County Juvenile Division and is located at 12th and Alder in the Central Dis-trict of Seattle. According to the county, state law requires that King County pro-vide a juvenile detention facility, and the county uses it “sparingly and only for the most serious or violent crimes and high-risk offenders” (King County, 2014). In 2012, voters in King County narrowly approved (with 55% in favor) a levy to raise $210,000 to fund the rebuilding of the deteriorating jail along with a mixed-use development on the land currently occupied by the facility. While both supporters and opponents of the levy agreed that the conditions of the jail are in decline, deep disagreements continue to exist on the question of what should be done about it
45VOL 5, SPRING 2015
Spokane
(Garrett-Signh, 2012).
Recent activism spearheaded by several youth-led organizations in Seattle, includ-ing Youth Undoing Institutional Racism (YUIR) and Ending the Prison Industrial Complex (EPIC), has focused the debate on the fundamental question of whether youth should be detained in the first place, the disproportionality in who is de-tained, what we could achieve if we invested the funds into social services and sup-port programs for youth rather than a new jail, as well as concerns about gentrifi-cation caused by the mixed-used developments in the county’s plan (Washington Incaceration Stops Here, n.d.). As noted earlier, black youth in King County are nine times more likely to be incarcerated than their white counterparts (Kelety, 2014). Statewide, black youth make up 6% of the Washington population, but they make up 21% of youth sentenced to the state Juvenile Rehabilitation Administra-tion (Task Force on Race and the Criminal Justice System, 2012). As the overall number of youth detained in King County has declined - the current center is typi-cally less than half full – disproportionality persists (Cohen, 2014).
Improving Procedural Justice through Use of Restorative Justice Practices
Learning from insights of the literature on procedural justice to create a viable alternative to the status quo of youth detention, we must focus on the processes that lead to juvenile arrests and sentences. Addressing the procedures that lead to particular outcomes for youth will both change the outcomes themselves and address concerns about how youth and their families are treated by the system. An alternative pathway that has shown promise in other cities and internationally is the use of restorative justice models for responding to youth misbehavior. Restorative justice is
“a process that takes values such as healing, apology and forgiveness seriously, as well as practical prevention of recurrence…. where all the stakeholders in a crime have the opportunity to discuss what harm has been done and what needs to be done to repair that harm, prevent it from happening again, and meet the needs of the stakeholders” (Braithwaite, 2007).
Braithwaite (2007) describes the capacity of restorative justice practices and poli-cies to have both a “bubbling up” and “filtering down” impact. For example, Braith-waite shares the story of a network of volunteer ombudsmen who used restorative justice practices in exit meetings at nursing homes in Oklahoma. Their influence
46 THE EVANS SCHOOL REVIEW
Issues In CrImInal JustICe & PsyChology aPPlIed to seattle
in state- and nation-wide coalitions ultimately led the transformation of US nursing home law in the 1990s, showing the potential for restorative justice to “bubble up” into the law. School programs based in restorative justice have shown the poten-tial for “filtering down” from policy into “the justice of the school community” by engaging administrators, teachers, students, parents and staff in conversations about acceptable behavior. Braithwaite points out that while success has been seen in programs implemented in schools in the US, the same tools have been much less commonly adopted in criminal justice systems than has been the case in other countries.
In fact, the City of Seattle has already begun experimenting with the use of re-storative justice through a pilot program in its East Precinct. In the Seattle Police Department (SPD)’s 2014 budget, a full-time staff member was added “to explore alternative crime responses designed to avoid harm and violence escalation dur-ing police interaction and empower communities to restore public trust” (Seattle Police Department, 2013). Andrea Brenneke, director of the City of Seattle’s Restorative Justice Initiative, describes the program as “a dialogue where all parties can come together and understand what was done, and the significance and the meaning of that. What the harm was, and what the underlying meaning is behind that act. It would be a practice where we can learn from conflict instead of being torn apart” (Nickerson, 2013).
Successful reform efforts in other US cities affirm the idea that addressing proce-dural justice concerns by involving the community and families in decision-making is key to creating a more just system. A report on “The Dangers of Detention” published by the Justice Policy Institute shares that cities and counties that have en-acted reform measure their progress in part by their acceptance in the community. For example,
“Cook County engaged system kids and their parents for advice about how to improve the system, and persevered (and supported the staff) through some daunting complaints. In the aftermath, the probation department adjusted its office hours and locations, changed the way it communicated with clients and their families, and institutionalized feedback mechanisms. Now community members are genuinely engaged in decisions including policy formulation, program development, and even hiring” (Holman & Ziedenberg, 2006).
47VOL 5, SPRING 2015
Spokane
Learning from these efforts as well as its own pilot program, Seattle has the po-tential to chart a new path for its youth. Regardless of whether the new detention center is built or not, the debate its proposal has sparked may help to provide the necessary pressure to cause Seattle and King County officials to take reform efforts seriously. If the Restorative Justice Initiative pilot project is successful, the No New Youth Jail Campaign and its advocates will likely be a ready constituency to support its expansion.
Lessons from System Justification Theory: Creating a New System to Justify
While system justification theory may at first glance lead us to despair, given the strong inclination of both advantaged and disadvantaged groups to defend the status quo and respond harshly to threats to current systems, it may also provide lessons about how to make lasting change. Blasi and Jost (2006) explain that people will eventually accept change that they once viewed as untenable. They write, “when a new status quo is clearly established (e.g., by a court ruling, a new law, an election, a coup d’etat, or military victory), people perceive the emerging social arrange-ments in increasingly favorable terms and begin to justify and rationalize the new regime,” because defending the former system no longer offers psychological ben-efits. We have seen evidence of this in the past few years in the US, in the wake of new state laws to protect equal marriage and legalize marijuana. Before such laws were passed, campaigns focused on those issues seemed purely aspirational and faced tremendous resistance. As more states have voted in favor of the new status quo, these issues are now all but taken for granted as the right way to govern. Thus social movements targeted at major changes to the criminal justice regime may eventually be able to establish new systems and end justification of the old ones. In fact, the current criminal justice system as shaped by the War on Drugs was once met with resistance from the very local law enforcement agencies that now defend it (Alexander, 2012, pp. 72-3). In response to such resistance to his proposed War on Drugs, President Reagan pushed congress to provide millions of dollars of aid to local law enforcement and to allow for keeping of seized property. By changing the incentives, Reagan managed to create a new status quo to be defended rather than resisted.
The literature on system justification can also help us consider the importance of framing and priming. According to Blasi and Jost (2006), system justification theory suggests that “advocates should craft strategies that respond to the psycho-logical need to reduce dissonance among competing system justification motives” by framing the issues in a way that evokes the preferred system. They point to
48 THE EVANS SCHOOL REVIEW
Issues In CrImInal JustICe & PsyChology aPPlIed to seattle
an example of affirmative action programs that are framed as “properly designed to ameliorate or reduce implicit biases” rather than as strategies to redress past discrimination. Framed this way, classic anti-affirmative action arguments based on an “unwarranted preferences” frame are flipped upside down, “leaving opponents to explicitly justify existing implicit preferences that disadvantage women and people of color.” This type of framing could be used well in the context of addressing disproportionality in criminal justice systems in general and in the fight to redirect the new youth jail project in particular.
While they caution that such moments are exceptional rather than the norm, Blasi and Jost (2006) also note that “on occasion, justification of an ascendant (or perhaps utopian) system can replace justification of the current system.” The work that local youth activists are doing to build a movement not just against the youth jail but also toward an inspiring vision of a more just future could have the potential to counteract justification of the current system. In fall of 2014, the No New Youth Jail Campaign hosted a “Night of Creative Vision,” which organizers described as an event meant to “center youth-of-color’s artistic activism and their creative expres-sion for creating a world without prisons that cage our youth” with the goal to “redirect funding away from the mass incarceration of youth of color and towards community-based prevention, intervention and diversion services and programs” (Epic Seattle). The evening featured performances by local artists presenting poetry, spoken word, rap, dancing, and speeches about life in a racialized society (Kelety, 2014). These kinds of cultural events could have the potential to create a strong enough vision of an alternate, aspirational system to overcome system justi-fication of the status quo.
Combating Bias with Data-based SystemsThe literature on intergroup relations makes clear that we have little control over our own cognitive and behavioral reactions to other people. Our biases shape how we act whether we like it or not. Various findings in behavioral decision research have shown that we are indeed subject to “bounded ethicality” (Bazerman & Moore, 2013, pp. 143-5). Bazerman & Moore (2013) as well as other experts in the field (Dawes, Faust, & Meehl, 1989) have suggested that using data-based decision-analysis tools can help us make better and less biased decisions, which can have a significant impact for an entire institution (e.g. the King County Juvenile Division).
King County and the City of Seattle have already made a step in the right direc-tion by agreeing to activists’ demands to conduct a racial impact assessment of the new facility, a process which will start in early 2015 (Kelety, 2014). While activ-
49VOL 5, SPRING 2015
Spokane
ists were unsuccessful in convincing the Seattle City Council to deny the land use bill proposed to enable the building of the new detention center, they did convince the councilors after a show of large numbers and passionate voices at a city council meeting to amend the bill, delaying implementation of the zoning changes until a racial impact study could first be completed (Cohen, 2014). If done well and in a way that centers community voices, the assessment could help city and county offi-cials identify ways in which the new jail may unintentionally have disproportionate impacts on people of color and provoke questions that could alter the original plans to be more equitable.
A nation-wide juvenile detention reform program has shown positive results in efforts to reduce the number of youth needlessly or inappropriately detained by implementing data-based, institutional systems to make better decisions. The Juvenile Detention Alternatives Initiative (JSAI) is a public-private partnership that includes Santa Cruz County, California, Multnomah County in Oregon, Berna-lillo County in New Mexico, and Cook County in Illinois (Holman & Ziedenberg, 2006). Several of its eight core strategies (as outlined in Holman & Ziedenberg’s 2006 “Dangers of Detention” report) respond effectively to bias concerns raised in behavioral decision research, including “reliance on data” and “objective admissions screening.”
These strategies provide a model for how Seattle and King County might use the lessons of psychological research to ensure that its goals of racial equity and fairness in its juvenile system are achieved. By relying on data and objective procedures rather than the discretion of individual decision-makers who are unconsciously shaped by their own social identities and biases toward other groups, the city and county may be able to avoid some of the greatest pitfalls of the current system. Offering alternatives to secure confinement as an option at sentencing also could benefit from the lessons of research on defaults if the alternatives actually become the first option provided (Johnson & Goldstein, 2003). Strategies that are explic-itly focused on race are necessary because otherwise the biases of decision-makers may easily lead to overlooking disparities or justifying them as produced by a fair system.
ConclusionI have argued here that major contemporary issues in the US criminal justice system leading to stark racial disparities can be understood and addressed in part through the lens of key literatures within psychology. Research on procedural jus-tice, system justification theory, and intergroup relations all provide important in-
50 THE EVANS SCHOOL REVIEW
Issues In CrImInal JustICe & PsyChology aPPlIed to seattle
sights both into how we have gotten to where we are today and also how we might be able to move in a more just and equitable direction. In taking a closer look at a particular criminal justice issue currently facing Seattle, I proposed that expand-ing restorative justice practices, focusing activist strategies on frames that evoke an alternative, more just system, and using data-based decision-making procedures could help shape a more positive, less racially discriminatory future for the King County Juvenile Detention Center.
Author Affiliations
Lauren J. Spokane is a second year MPA candidate at the Evans School of Public Policy and Governance. Lauren also serves as board chair of Social Justice Fund NW, a grassroots foundation based in Seattle. Prior to coming to UW, Lauren worked as a community organizer with an interfaith social justice organization in Boston. She received her BA in Political Science with a concentration in Urban Studies from Yale University in 2008.
51VOL 5, SPRING 2015
Spokane
References
Alexander, M. (2012). The New Jim Crow. New York: The New Press.
Bazerman, M. H., & Moore, D. A. (2013). Judgment in Managerial Decision Mak-ing (8th Edition ed.). Hoboken, NJ: John Wiley & Sons, Inc.
Bergsieker, H. B., Shelton, J. N., & Richeson, J. A. (2010). To Be Liked Versus Respected: Divergent Goals in Interracial Interactions. Journal of Personality and Social Psychology, 99(2), 248-264.
Blasi, G., & Jost, J. T. (2006). System Justification Theory and Research: Implica-tions for Law, Legal Advocacy, and Social Justice. California Law Review, Inc., 94(4), 1119-1168. Retrieved from http://www.jstor.org/stable/20439060
Braithwaite, J. (2007). Building Legitimacy Through Restorative Justice. In T. R. Tyler, Legitimacy and Criminal Justice (pp. 146-162). New York: Russell Sage Foundation.
CBS. (2014, August 22). Racial and gender makeup of grand jury revealed in Fer-guson case. CBS News. Retrieved December 6, 2014, from http://www.cbsnews.com/news/ferguson-case-racial-and-gender-makeup-of-grand-jury-revealed/
Cohen, B. (2014, October 13). City Council vote will pave way for new youth de-tention center at 12th and Alder. Capitol Hill Seattle Blog. Retrieved December 7, 2014, from http://www.capitolhillseattle.com/2014/10/city-council-vote-will-pave-way-for-new-youth-detention-center-at-12th-and-alder/
Dawes, R. M., Faust, D., & Meehl, P. E. (1989). Clinical Versus Actuarial Judg-ment. Science, 243(4899), 1668-1674. Retrieved from http://www.jstor.org/stable/1703476
Driscoll, J. (2014, November 28). Ferguson DA McCullough benefited from I Support Darren Wilson t-shirt sales. examiner.com. Retrieved December 6, 2014, from http://www.examiner.com/article/ferguson-da-mccullough-benefited-from-we-support-darren-wilson-t-shirt-sales
Eberhardt, J. L., Davies, P. G., Purdie-Vaughns, V. J., & Johnson, S. L. (2006). Looking Deathworthy: Perceived Stereotypicality of Black Defendents Predicts
52 THE EVANS SCHOOL REVIEW
Issues In CrImInal JustICe & PsyChology aPPlIed to seattle
Capital-Sentencing Outcomes. Psychological Science, 17(5), 383-386.Epic Seattle. (n.d.). Night of Creative Vision. Retrieved December 7, 2014, from https://www.facebook.com/events/804553129586164/
Equal Justice Initiative. (2014). Death Penalty: Race. Retrieved December 2, 2014, from http://www.eji.org/deathpenalty/race
Garrett-Signh, S. (2012, August 7). Election Day Watch: Will we get a new Youth Services Center? – UPDATED. Central District News. Retrieved December 7, 2014, from http://www.centraldistrictnews.com/2012/08/election-day-watch-will-we-get-a-new-youth-services-center/
Greenwald, A. G., Banaji, M. R., & Nosek, B. A. (2015, in press). Statistically Small Effects of the Implicit Association Test Can Have Societally Large Effects. Journal of Personality and Social Psychology. Retrieved from http://faculty.washington.edu/agg/pdf/GB&N.Consequential%20small%20IAT%20effects.JPSP_final.2Sep2014.pdf
Hall, C. (2014, November 17). Lecture in PBAF 514 Psychology for Policy Analy-sis. University of Washington, Seattle, WA, USA.
Holman, B., & Ziedenberg, J. (2006). Dangers of Detention: The Impact of Incar-cerating Youth in Detention and Other Secure Facilities. Justice Policy Institute. Retrieved December 2, 2014, from http://www.justicepolicy.org/images/up-load/06-11_rep_dangersofdetention_jj.pdf
Johnson, E. J., & Goldstein, D. (2003, November 21). Do Defaults Save Lives? Sci-ence, 302, pp. 1338-1339.
Kawakami, K., Dunn, E., Karmali, F., & Dovidio, J. F. (2009, January 9). Mispre-dicting Affective and Behavioral Responses to Racism. Science, 323, 276-278.
Kelety, J. (2014, November 12). Opposition to proposed detention center sparks ‘Night of Creative Vision’. Capitol Hill Times. Retrieved December 3, 2014, from http://www.capitolhilltimes.com/2014/11/opposition-proposed-detention-cen-ter-sparks-night-creative-vision/
53VOL 5, SPRING 2015
Spokane
King County. (2014). King County Juvenile Division. Retrieved December 7, 2014, from http://www.kingcounty.gov/courts/detention/juvenile_detention.aspx
New York Civil Liberties Union. (n.d.). Stop And Frisk Facts. Retrieved December 3, 2014, from http://www.nyclu.org/node/1598
Nickerson, A. (2013, October 3). A restorative way to minimize crime. The Capi-tol Hill Times. Retrieved December 7, 2014, from http://www.capitolhilltimes.com/2013/10/restorative-way-minimize-crime/
Seattle Police Department. (2013). 2014 Proposed Budget. Retrieved from http://www.seattle.gov/financedepartment/14proposedbudget/documents/SPD.pdf
Stevenson, B. (2014). Just Mercy. New York: Spiegel & Grau.
Tajfel, H. (1970, November). Experiments in intergroup discrimination. Scientific American, 223(5), 96-102.
Task Force on Race and the Criminal Justice System. (2012). Juvenile Justice and Racial Disproportionality, A Presentation to the Washington State Supreme Court. Washington State Supreme Court, Olympia.
Tyler, T. R., Boeckmann, R. J., Smith, H. J., & Huo, Y. J. (1997). Social Justice in a Diverse Society. Boulder, CO: WestviewPress.
Washington Appleseed. (2012). Reclaiming Students: The educational and economic costs of exclusionary discipline in Washington State. Retrieved November 24, 2014, from http://media.wix.com/ugd/4569ed_e44ccb-42cff21777ea479f4125d347df.pdf
Washington Incaceration Stops Here. (n.d.). Why oppose the new youth jail? Retrieved December 7, 2014, from No New Youth Jail: https://nonewyouthjail.wordpress.com/why-oppose-the-new-youth-jail/
54 THE EVANS SCHOOL REVIEW
E-CigarEttE PoliCy oPtions
54 THE EVANS SCHOOL REVIEW
E-Cigarettes and Public Health: Policy Options for Washington State
AbstractE-cigarette use has increased dramatically over the past several years. Often marketed as healthy alternatives to combustible ciga-rettes—even as smoking cessation devices—the brief existence of these products precludes the possibility of obtaining evidence of possible long-term health benefits. While some studies have shown promise for these products as tobacco cessation devices, there are still many questions around e-cigarettes. Given the known effects of nicotine addiction and the rising popularity of the products among youth, adherence to the public health precautionary prin-ciple is advised. Since e-cigarettes and other electronic nicotine delivery/vaping devices are not yet regulated at the federal level, states and other jurisdictions are scrambling to assemble appropri-ate public policy for e-cigarettes. Washington State legislators can leverage regulatory tools proven to work for conventional tobacco products for e-cigarette policymaking, including retailer licensure, excise taxes, product labeling and disclosure requirements, prod-uct flavoring restrictions, marketing and age of purchase restric-tions, and restrictions on use in public places.
BackgroundElectronic cigarettes (e-cigarettes) are nicotine delivery devices that aerosolize nicotine and other chemicals to simulate the sensation of smoking a combustible cigarette (Kuschner, Reddy, Mehrotra, & Paintal, 2011). E-cigarettes were developed with the goal of mimicking the efficient nicotine delivery system of a con-ventional cigarette without the significant and harmful effects of tobacco smoke (Kuschner et al., 2011). The chemical composition of e-cigarettes can include metals, tobacco byproducts, volatile organic compounds, flavor agents and nicotine (Grana, Benowitz, & Glantz 2013). Some of the contents and inhaled byproducts of e-cigarettes and vaping product liquids are carcinogenic or contain other toxic substances (Callahan-Lyon, 2014). Nicotine is a highly addictive substance to which children, adolescents, and young adults are particularly vulnerable. Unlike combustible and smoke-
less tobacco products, the federal government does not currently regulate e-ciga-rettes (U.S. Department of Health & Human Services [U.S. HHS], 2012).
E-cigarette prices are low; the average daily e-cigarette user spends about $33 per month compared to $150-200 spent by a pack-a-day conventional cigarette smoker (Etter & Bullen, 2011). One recent study found that increasing e-cigarette prices would reduce consumption by youth and adults (Huang, Tauras, & Chaloupka, 2014). This mirrors findings of numerous economic studies published in peer-reviewed journals that demonstrate price increases, usually from taxes, reduce both adult and underage cigarette smoking. Results from these price elasticity studies show that every ten percent increase in the price of cigarettes reduces cigarette consumption overall by three to five percent (Frieden & Bloomberg, 2007).
A significant increase in e-cigarette use in the US has been spurred by marketing that promises a “safe” product, especially compared with other tobacco products (Grana & Ling, 2014). Perhaps as a result of this marketing, which includes product designs like candy flavored e-cigarettes that appeal to youth, e-cigarette use tripled among high school students between 2011 and 2013, and there is now evidence that e-cigarettes surpass conventional tobacco products in popularity among youth (Arrazola, Neff, Kennedy, Holder-Hayes, & Jones, 2013). Relative to combustible products, e-cigarettes are probably less dangerous, but there is little evidence to support the claim that there is no risk of harm (Grana et al., 2013).
Harm reduction in public health consists of a set of strategies to minimize the risk associated with certain behaviors or use of drugs. As a harm reduction tactic, e-cigarettes hold promise. However, while the inhaled compounds associated with e-cigarettes may be fewer and less toxic than conventional cigarettes, public health officials still advise caution. There is no evidence that e-cigarettes are a more ef-fective cessation aid than the nicotine patch (McRobbie, Bullen, Hartmann-Boyce, & Hajek, 2014). Other research points to a potential role of e-cigarettes as an introduction to other, more harmful tobacco products, particularly when used by children, adolescents, and young adults. For example, in 2014, the Centers for Dis-ease Control and Prevention (CDC) released a study that documented the surge in e-cigarette use among school-aged youth and highlighted the possibility that use of these products could serve as a “gateway” to combustible products (Bunnell, Agaku, Arrazola et al., 2014).
The precautionary principle suggests that, in the absence of evidence assuring the safety of a product, policymakers should act conservatively in protecting consum-
56 THE EVANS SCHOOL REVIEW
E-CigarEttE PoliCy oPtions
ers. Fortunately, numerous tobacco control policies have already been tested on the national, state and local levels – resulting in an estimated 8 million lives saved (Public Health Service [PHS], 2014).
Regulation and policy tools Since the first Surgeon General’s report in 1964, advocates and lawmakers have worked to formulate robust public policy in the U.S. to reduce the harms associ-ated with combustible cigarettes, including passing smoke-free laws, levying taxes, and enacting restrictions on age of purchase and advertising. These measures are widely credited for the dramatic decline in tobacco use and related disease, disabil-ity and death (Frieden & Bloomberg, 2007). While many of the health risks associ-ated with e-cigarettes are still being studied, a variety of jurisdictions are adopting proactive policies based on the precautionary principle (Saitta, Ferro, & Polosa, 2014).
The Family Smoking Prevention and Tobacco Control Act (FSPTCA), signed into law in 2009, grants the United States Food and Drug Administration (FDA) regula-tory authority over the manufacture, distribution, and marketing of tobacco prod-ucts (United States Food & Drug Administration [U.S. FDA]). The exact definition of “tobacco product” reads,
“…Any product made or derived from tobacco that is intended for human consumption, including any component, part, or accessory of a tobacco product (except for raw materials other than tobacco used in manufactur-ing a component, part or accessory of a tobacco product)” (United States Government Printing Office [U.S. GPO]).
The FDA thus governs both the manufacturing and marketing of tobacco. While nicotine occurs naturally in tobacco and the law recognizes nicotine as an addictive drug, the FSPTCA law only specifies cigarettes, cigarette tobacco, roll-your-own tobacco and smokeless tobacco (limited to “tobacco intended to be placed in the oral or nasal cavity”) as subject to regulation (U.S. FDA). Since e-cigarettes entered the market two years before the FSPTCA law was enacted, public awareness of the new product was low (Regan, Promoff, & Dube, 2013), and policymakers likely didn’t anticipate the need for regulation (King, Patel, Nguyen et al., 2014).
Amid increasing e-cigarette use, awareness, and pressure from the public health community, on April 24, 2014, the FDA issued a proposed rule deeming e-cig-arettes (as well as dissolvable tobacco, tobacco gels, hookah tobacco, cigars, and
pipe tobacco) and future nicotine products as tobacco products (U.S. GPO). Public comment on the proposed rule closed on August 8, 2014 with nearly 82,000 in-dividual comments received, and the rule is not expected to be finalized until late 2015 or 2016 (Briant, 2014). If finalized, the proposed rule states that e-cigarette manufacturers would be required to:
• Register with the FDA• Report product ingredient listings• Delay marketing of new products and risk claims until FDA has reviewed them• Stop distributing free samples (U.S. FDA)
Additionally, e-cigarettes and other deemed tobacco products would be subject to minimum age and identification restrictions, health warning requirements, and vending machine sales prohibition (U.S. FDA).
In the meantime, states and localities have unfettered ability to enact legislation related to e-cigarettes, and have scrambled to catch up. The proposed FDA “deem-ing rule” does not preempt most lower jurisdictions’ regulations that are already in place or those being considered for future adoption. However, in the case of combustible and smokeless tobacco products, many localities across the US are preempted from enacting legislation stricter than equivalent state legislation. Wash-ington State law prevents local jurisdictions from enacting policies that restrict combustible tobacco marketing, smoke-free indoor air and youth access beyond state law (Washington State Department of Health [WA DOH], 2010).
Fortunately, numerous policy options in the conventional tobacco control realm have already been tested on the state and local levels, and evaluations of their ef-ficacy can serve as a guide to regulating e-cigarettes.
Retailer licensingTobacco retailer licensing laws require businesses that sell tobacco products to buy a license from the government. These licenses provide a way for jurisdictions to identify purveyors of tobacco, and to implement and ensure compliance with state tobacco control program regulations (Jason, Berk, Schnopp-Wyatt, & Tal-bot, 1999). Perhaps most importantly, local jurisdictions can use licensure laws to restrict the density and location of retail outlets in any given area. Easy access to tobacco retailers is associated with higher rates of teen smoking (McCarthy et al., 2009; Novak, Reardon, Raudenbush, & Buka, 2006). Living in close proximity to tobacco retail outlets also has a negative effect on cessation (Reitzel, Cromley, Li
58 THE EVANS SCHOOL REVIEW
E-CigarEttE PoliCy oPtions
et al., 2011). Because tobacco retailers are clustered in low-income neighborhoods inhabited disproportionately by people of color, licensure laws provide an oppor-tunity for local governments to redress disparities in tobacco use and related health outcomes. Licensing requirements can be enacted by state governments (as they are in California) or cities (such as New York City), and 36 states had licensure laws on the books as of 2014 (McLaughlin, 2010; CDC, 2014). Some municipalities now require e-cigarette sellers to apply for restricted use permits, such as Buffalo, NY (Dudzik, 2014).
The Center for Tobacco Policy & Organizing at the American Lung Association of California defines a strong licensing law as one that (2009):
• Requires annual renewal of licensure• Adequately funds, through fees, enforcement and administration of the licens-
ing program (and perhaps other tobacco control endeavors)• Recognizes the full landscape of relevant laws by making a violation of any
regulation (federal, state or local) subject to penalty or revocation• Sets fines for violations high enough to act as a deterrent
TaxationOf all tools available to policymakers for curbing tobacco use, price increases are demonstrably the most effective (Frieden & Bloomberg, 2007). Although cigarette addiction might theoretically lead to price inelasticity, cigarette taxation has proven to be the most effective means for reducing cigarette consumption. Studies have demonstrated an inverse relationship between taxation and tobacco use (see Figure 1). As the price of tobacco increases, fewer people smoke (some quit, and some never initiate). This is true across the U.S. population as well as within subpopu-lations (i.e., youth, people of color and low-income smokers) (Campaign for Tobacco-free Kids, 2012). Results from price elasticity studies show that every ten percent increase in the real price of cigarettes reduces overall cigarette consump-tion by approximately three to five percent, the number of young adult smokers falls by 3.5 percent, and the number of children (under 18 years old) who smoke declines by six or seven percent (Boonn, 2012).
Tobacco excise taxes are traditionally considered regressive in that low-income to-bacco users pay a larger share of their income in taxes than higher-income individu-als, who are also less likely to smoke (Remler, 2004). However, the ultimate effect of tobacco taxation is progressive; because low-income users consume dispro-portionately more tobacco than wealthier populations and because consumption
declines with price increases, low-income users experience proportionately greater health benefits than their wealthier counterparts (Chaloupka, Yurekli, & Fong, 2012; Warner, 2000). Between 1990 and 2009, federal tobacco taxes rose from 16 cents to $1 per pack, while states increased their own taxes on cigarettes by a fac-tor of four. These tax increases significantly contributed to the 125 percent average cigarette price increase in the U.S. between 1990 and 2009 (see Figure 1).
Figure 1: Cigarette sales and price per pack, 1970-2008
In drafting a new tobacco tax inclusive of e-cigarettes, policymakers will need to consider the following questions (ChangeLab Solutions, 2014; Warner & Pollack, 2014):
• Given the many component parts of e-cigarettes, what should be taxed (e.g., devices, e-liquids)?
• Should the tax be higher, lower or the same as other tobacco products? What are the considerations in light of current evidence regarding e-cigarettes’ usefulness as a smoking cessation aid? (Some have argued for a significant cost differential, with conventional tobacco products taxed more heavily, to encour-age the purchase of e-cigarettes.)
• Should tax revenue be earmarked for tobacco control, prevention and/or ces-sation? If so, how can revenue be safeguarded for these purposes?
Two states, Minnesota and North Carolina, have adopted a tax on e-cigarette products. In May 2014, North Carolina adopted an excise tax equal to five cents per milliliter of nicotine liquid (about the same amount of nicotine as in a pack of cigarettes) (Maguire, 2014). In Minnesota, a tax equal to 95 percent of the whole-sale cost (the same tax as for regular cigarettes) went into effect on July 1, 2014 (Minnesota Department of Revenue).
60 THE EVANS SCHOOL REVIEW
E-CigarEttE PoliCy oPtions
Age of purchase restrictionsChildren and young adults under the age of 26 are most vulnerable to tobacco addiction. In fact, 99 percent of adults who smoke started before 26 years of age; brain development largely prevents adults who initiate use past this age from be-coming addicted (DiFranza, 2008). For this reason, policies that increase the legal age of purchase of tobacco products to 21 have gained support from prevention advocates. In 1984, Congress raised the age of alcohol purchase to 21, resulting in a sharp decline in drunk driving, alcohol consumption and motor vehicle accidents and fatalities among young adults (Winickoff, Gottlieb, & Mello, 2014). Youth smoking decreased by half in the first locality (Needham, MA) to enact “Tobacco 21” within five years of its implementation, a significantly greater decrease than in surrounding communities (Winickoff et al., 2014).
As of September 2014, at least 40 states have prohibited e-cigarette sales to minors (National Conference of State Legislatures [NCSL]). Washington State joined this group in 2013, specifically using the term “vapor product” to describe e-cigarettes (Washington State Legislature). At least five states—Colorado, Rhode Island, South Dakota, Tennessee, and Wyoming— added e-cigarettes to their definition of to-bacco products (NCSL). Idaho is also in this majority, further restricting electronic cigarette sales through vending machines accessible to minors (State of Idaho Leg-islature), as have several other states. These policies are possible because the federal government has not passed a law pre-empting the ability of states and localities to enact stricter legislation.
In Washington State, King (King County), Pierce (Tacoma-Pierce County Health Department [TPCHD]), Grant (Izenman, 2014), and Clark (Clark County, Wash-ington) counties ban the sale of e-cigarettes to minors under age 18. Similarly, in May 2014, the City of Pasco revised its municipal code to include e-cigarettes in its citywide smoking regulations (Hoops, 2014). These include a ban on sales to mi-nors (including sales through vending machines accessible to minors), penalties for minors who attempt to purchase e-cigarettes, and clear signage about these regula-tions (City of Pasco). Several cities in Spokane County have also prohibited sales to minors (Municipal Research and Service Center of Washington [MRSCW], 2014).
Labeling and disclosure requirementsThe size and nature of tobacco product warning labels is associated with consumer understanding of the risks of use, with more detailed and graphic labels related to
greater knowledge of health harms (Hammond, 2006). Tobacco users are exposed to these messages as many as 7,000 times each year, making labeling an essen-tial tool to promote prevention and cessation (Hammond, 2008). While graphic warning labels are now required in 77 countries/jurisdictions worldwide, the FDA proposed more substantive warning labels in 2012. These were subsequently ruled unconstitutional in federal appellate court on grounds that they violated the First Amendment (Almasy, 2013).
The Oregon Department of Justice (OR DOJ) has settled three lawsuits with an e-cigarette manufacturer and brought suit against another on the grounds that, with-out scientific evidence, marketing claims made by these companies were misleading and fraudulent. OR DOJ is the only state agency in the United States to pursue such legal action (2009). Meanwhile, several studies have found e-cigarette label-ing to be inadequate or inaccurate relative to required labeling for other products (Almasy, 2013).
Restrictions on product flavoringsTobacco industry documents reveal manufacturers have intentionally configured flavors of their products to appeal to young people (Carpenter, Wayne, Pauly, Koh, & Connolly, 2005). Flavored tobacco products are primarily aimed at and used by youth. One study found 20 percent of smokers aged 17 to 19 used flavored to-bacco, compared with 6 percent of older adults (Klein et al., 2008). As part of the 2009 FSPTCA law, the FDA banned flavored tobacco products (with the exception of cigars and products with menthol flavoring) and required tobacco companies to discontinue the use of misleading marketing terms like “light” and “low tar” to describe cigarettes (U.S. GPO).
E-cigarettes are available in more than 7,000 flavors, with 250 new flavors coming out each month (Richtel, 2014). While only one municipality in the United States currently regulates flavored e-cigarettes (Chicago), a New York City councilman recently introduced a bill that would restrict the sale of flavored e-cigarettes to tobacco bars (Bonazzo, 2014).
Requirements for child-resistant packagingPackaging of potentially harmful consumer products became subject to govern-ment regulation in 1970, when Congress passed the Poison Prevention Packaging Act. Child-safety packaging requirements for oral prescription medications are credited with the prevention of hundreds of child deaths from the mid-seventies onward (Rodgers, 1996).
62 THE EVANS SCHOOL REVIEW
E-CigarEttE PoliCy oPtions
In an effort to protect people—children in particular—from liquid nicotine, legislators in the U.S. House and Senate introduced a bill in 2014 requiring the Consumer Product Safety Commission to “promulgate a rule to require child safety packaging for liquid nicotine containers…” The bills have since moved out of com-mittee (United States Senate).
So far, three states—Minnesota, New York, and Vermont—have enacted a require-ment for e-cigarette-related nicotine liquid containers to be sold in “child-resistant” packaging (Tobacco Control Legal Consortium, 2014).
Limitations on Internet salesCongress passed the Prevent All Cigarette Trafficking Act (PACT Act) in 2010 to address tax evasion in online cigarette sales and prevent Internet sales to youth. Prior to the PACT Act, an estimated 20 percent of online cigarette sellers did not have any age-related purchase requirements, and among those that did, most al-lowed age to be self-reported (Ribisil, Kim, & Williams, 2002). Online e-cigarette sales are booming; Google defines “e-cigarettes” as a “breakout search term,” or a phrase that has exploded in use to the magnitude of more than 5000 percent (Yamin, Bitton, & Bates, 2010). As of 2009, Washington State prohibits the sale of many tobacco products online directly to consumers. However, e-cigarettes are not included in the definition of “tobacco product” under this law (Washington State Attorney General, 2008).
The lack of age verification mechanisms used in online purchasing of e-cigarettes and other tobacco products has led some lawmakers to take action. In January 2014, a California lawmaker introduced Assembly Bill 1500 to regulate online sales, but was ultimately unsuccessful (Mason, 2014). On August 8, 2014, attor-neys general from 29 states (including Bob Ferguson of Washington) submitted a comment to the FDA in response to the “deeming rule” proposal in an attempt to sway the agency toward prohibiting all “non-face-to-face” tobacco sales—including sale of e-cigarettes. The comment argues that since the PACT Act addresses only non-face-to-face sales of cigarettes and smokeless tobacco, the FDA needs to use its regulatory authority, as outlined in the FSPTCA law, to effectively extend this ban to e-cigarettes and all other “tobacco products” (Esterl, 2014). Although no state or local government has successfully curbed online e-cigarette sales, private online retailers like Amazon.com have instituted policies that prohibit product listings of this sort (Amazon.com, 2014).
School-based policies and programsMiddle and high school-based tobacco prevention programs include a range of interventions, but generally focus on imparting skills to resist tobacco use initiation and knowledge of its harms via educational curricula. School districts have been among the first jurisdictions to respond to the advent and popularity of e-ciga-rettes. As of July 2014, 11 of the 18 King County school districts have enacted e-cigarette bans on their campuses (Public Health Seattle & King County). Evidence is mixed as to whether educational programs are effective in preventing long-term initiation or increasing cessation, and a thorough search was unable to locate a single study of 100 percent smoke- and tobacco-free policies in elementary, middle and high schools (Glantz & Mandel, 2005). At the college and university level, a number of studies have documented the positive effects of smoke-free campus policies on prevalence of tobacco use (Wechsler, Kelley, Seibring, Kuo, & Rigotti, 2001), littering (Lee, Ranney, & Goldstein, 2013), and overall policy compliance (Harris, Stearns, Kovach, & Harrar, 2009).
Regulation of marketing practicesWith current bans on tobacco advertisements on television and in youth-focused magazines, the tobacco industry has sought new avenues to promote cigarettes and other tobacco products, especially to vulnerable youth. Between 1999 and 2008, tobacco companies spent 92 percent of their marketing dollars in gas stations, corner stores and other small retail venues. Young people frequent convenience stores, and thus have high exposure to this form of tobacco advertising (Riordan, 2012). This type of marketing, known as “point-of-sale” (POS), includes not only the location and type of advertising, but also discounts (e.g., two-for-one coupons) and other incentives. A 2009 review of the evidence found there was sufficient proof that these types of promotions disproportionately influence youth smoking (Paynter & Edwards, 2009). A number of policy options are available to regulate POS marketing tactics:
Many of the very same marketing strategies used for conventional tobacco products are now being deployed to promote e-cigarette brands (e.g., http://ecigflashbacks.strikingly.com), an increasing number of which are owned by tobacco companies
64 THE EVANS SCHOOL REVIEW
E-CigarEttE PoliCy oPtions
(Wall Street Journal, 2014).
With regard to conventional tobacco, a number of localities have restricted point-of-sale marketing. Providence, Rhode Island, prohibits coupons and other discounts on cigarettes. Three jurisdictions (New York City, Philadelphia and Jefferson Coun-ty, AL) have passed laws requiring tobacco retailers to post health warnings and/or information on cessation, though these have been subject to tobacco industry lawsuits (American Nonsmokers’ Rights Foundation [ANR], 2014). As of January 15, 2011, King County Board of Health Code 19.12 prohibits sampling, defined as offering of free or nominal cost electronic smoking devices or liquid nicotine.
Restrictions on use in public and/or indoor placesAs of October 2014, at least 22,527 US municipalities restrict smoking in public and certain private spaces (i.e., restaurants, bars, indoors) (ANR, 2014). A large body of research documents the benefits of such legislation in, among other things, reducing smoking, asthma prevalence, and heart attacks (Dinno & Glantz, 2007; Dove, Dockery, & Connolly, 2011; Hahn, 2010). Jurisdictions may seek to expand smoking prohibitions to e-cigarettes for the following reasons:o Permitting e-cigarette use may make it more difficult to enforce existing smoke-free rules, as some e-cigarettes look identical to conventional cigaretteso Allowing use of e-cigarettes could lead smokers of combustibles to use products in areas where smoking is bannedo If e-cigarette use is permitted in public places, people may be involuntarily exposed to possibly harmful second-hand emissionso Young people, who are particularly susceptible to tobacco industry mar-keting, may perceive cigarette use as “normal” and less harmful due to the presence of e-cigarettes in their communities (U.S. HHS)
As of October 1, 2014, three states (New Jersey, North Dakota, and Utah) restrict-ed e-cigarette use in all smoke-free venues within their state indoor air laws, and at least 11 other states prohibit use in some smoke-free public venues—often state-owned property, educational facilities and/or correctional facilities. More than 300 counties and cities restrict use of e-cigarettes in all or some smoke-free areas. Beginning January 1, 2015, Minnesota banned e-cigarette sales from all “moveable places of business” (e.g., kiosks and other transportable structures) (NCSL).
Since January 2011, King County bans e-cigarette use in workplaces, restaurants, and bars (MRSCW, 2014). Pierce County prohibits e-cigarettes from “any public place where children are lawfully permitted with the exception of certain places of
employment” (TPCHD). Grant County adopted similar measures that took effect on January 1, 2015 (Izeman, 2014). The city of Pasco, Washington, prohibits e-cigarette use in many outdoor public spaces, such as playgrounds and pools, as well as a ban on use in workplaces, restaurants, and bars (Hoops, 2014). The municipal code of Burien, Washington prohibits e-cigarette use in public parks (Public Health Seattle & King County, 2014).
ConclusionDue to the short history of e-cigarettes, there has been a limited time frame in which to generate and assess the evidence for policy-making. However, the suc-cessful regulatory efforts around conventional tobacco products can help inform policymakers’ decisions about e-cigarette regulation. Generalization of lessons from conventional tobacco products is warranted by the common use of nicotine to attract and retain large numbers of consumers. While there is little doubt that e-cigarettes are a safer alternative to conventional tobacco products, there is still reason to be skeptical about their long-term safety and potential effectiveness as tobacco cessation devices.
When the landmark FSPTCA was enacted, the FDA gained authority to regulate cigarettes. One of its first acts was to ban the sale of flavored tobacco products (2009). Since then, e-cigarette manufacturers quickly filled the void with numer-ous e-cigarette flavorings. These flavorings are known to attract youth, who are physiologically susceptible to nicotine addiction. Strong evidence demonstrates that flavor bans, as well as broader marketing and age-of-purchase restrictions, can reduce nicotine and tobacco product use—and lifelong addiction—among youth. A tax on e-cigarettes would further deter youth and adults from purchasing these products. The precautionary principle, paired with the devastating history of tobac-co, justifies the regulation of e-cigarettes using a range of proven policy measures. After all, legislation can be amended, but loss of human life cannot.
Author Affiliations
Patricia Atwater is the Program Coordinator for the University of Washington (UW) Tobacco Studies Program. She received her MPH from the UW School of Public Health Community-Oriented Public Health Practice Program (COPHP) in 2013.
Nick Fradkin is a second-year MPA/MPH student at the University of Washing-ton (UW). He is a two-time UW Tobacco Studies Program scholar and currently
66 THE EVANS SCHOOL REVIEW
E-CigarEttE PoliCy oPtions
works as a research assistant for the International Quitline Institute project within the Department of Family Medicine.
Elizabeth Medeiros is a first year MPH student at the University of Washington, concentrating in Social and Behavioral Sciences within the Department of Health Services. A Tobacco Studies Program scholar, Elizabeth currently works as a Re-search Assistant at the Northwest Center for Public Health Practice.
Joy Hamilton Gilroy is the Senior Program Manager at the Washington State Association of Local Public Health Officials (WSALPHO). A 2010 graduate of the UW School of Public Health, Joy is an expert in health policy analysis and advo-cacy.
Dr. Amy Hagopian is the director of the University of Washington’s Communi-ty- Oriented Public Health Practice Program in the Department of Health Servic-es. Dr. Hagopian teaches courses in evaluation, policy, and international health and primarily researches international health workforce issues.
Dr. Abigail Halperin is a senior lecturer in Family Medicine and Health Services at the University of Washington, and founder and director of the University of Washington Tobacco Studies Program. In addition to teaching and treating patients with tobacco dependence, Dr. Halperin has been an investigator on local, national, and international research and development projects related to tobacco prevention, treatment, and policy.
Almasy, S. FDA changes course on graphic warning labels for cigarettes. http://www.cnn.com/2013/03/19/health/fda-graphic-tobacco-warnings/
Amazon.com. Policies and Agreements – Restricted Products – Tobacco & To-bacco Related Products. http://www.amazon.com/gp/help/customer/display.html/?nodeId=200277660. Accessed 11 November 2014.
American Nonsmokers’ Rights Foundation. Overview List – How many Smokefree Laws?. 2014:1–3. Available at: http://www.no-smoke.org/pdf/mediaordlist.pdf.
Arrazola RA, Neff LJ, Kennedy SM, Holder-Hayes E, Jones CD. Tobacco use among middle and high school students - United States, 2013. MMWR Morb Mortal Wkly Rep. 2014;63(45):1021–1026.
Bonazzo, J. American Vaping Association Fuming Over Proposed Ban on Fla-vored E-Cigarettes. New York Observer. 8 October 2014. http://observer.com/2014/10/american-vaping-association-fuming-over-proposed-ban-on-fla-vored-e-cigarettes/
Boonn, A. Raising Cigarette Taxes Reduces Smoking, Especially Among Kids. Campaign for Tobacco Free Kids. Oct 2012. http://www.tobaccofreekids.org/research/factsheets/pdf/0146.pdf
Briant, T. Next Steps in the Tobacco Deeming Regulation Process. 2014, August 20. http://www.cspnet.com/category-news/tobacco/articles/next-steps-tobacco-deeming-regulation-process
Bunnell RE, Agaku IT, Arrazola R a, et al. Intentions to Smoke Cigarettes Among Never-Smoking US Middle and High School Electronic Cigarette Users, National Youth Tobacco Survey, 2011-2013. Nicotine Tob Res. 2014:1–8. doi:10.1093/ntr/ntu166.
Callahan-Lyon P. Electronic cigarettes: human health effects. Tob Control. 2014;23 Suppl 2:ii36–40. doi:10.1136/tobaccocontrol-2013-051470.
68 THE EVANS SCHOOL REVIEW
E-CigarEttE PoliCy oPtions
Campaign for Tobacco-Free Kids. Raising Cigarette Taxes Reduces Smoking, Es-pecially Among Kids. 2012:1–4. Available at: http://www.tobaccofreekids.org/research/factsheets/pdf/0146.pdf.
Carpenter C, Wayne GF, Pauly JL, Koh HK, Connolly GN. New Cigarette Brands With Flavors That Appeal To Youth: Tobacco Marketing Strategies. Health Affairs (Millwood). 2005 Nov-Dec;24(6):1601-10.CDC. State Tobacco Activities Tracking and Evaluation (STATE) System. 2014. Available at: http://apps.nccd.cdc.gov/statesystem/Default/Default.aspx.
Chaloupka FJ, Yurekli A, Fong GT. Tobacco taxes as a tobacco control strategy. To-bacco Control. 2012;21(2):172–180.
Clark County, Washington. Smoking in Public Places Law and electronic cigarettes. http://www.clark.wa.gov/public-health/community/smokelaw.html
DiFranza JR. Hooked from the first cigarette. Scientific American. 2008;298(5):82–87.
Dinno A, Glantz S. Clean indoor air laws immediately reduce heart attacks. Pre-ventive Medicine. 2007;45(1):9–11. doi:10.1016/j.ypmed.2007.03.013.
Dove MS, Dockery DW, Connolly GN. Smoke-Free Air Laws and Asthma Prevalence, Symptoms, and Severity Among Nonsmoking Youth. PEDIATRICS. 2011;127(1):102–109. doi:10.1542/peds.2010-1532.
Dudzik, K. Buffalo Now Requires E-Cigarette Shops to get Restricted Use Per-mits. WGRZ. 1 October 2014. http://www.wgrz.com/story/news/local/buf-falo/2014/09/30/buffalo-now-requires-e-cigarette-shops-to-get-restricted-use-permits/16514393/
Electronic cigarettes in King County. http://www.kingcounty.gov/healthservices/health/tobacco/facts/ecigs.aspx
Esterl, M. States Urge Tougher Curbs on E-Cigarettes. The Wall Street Jour-nal. 8 August 2014. http://online.wsj.com/public/resources/documents/fdaletter20140808.pdf
Etter J-F, Bullen C. Electronic cigarette: users profile, utilization, satisfaction and perceived efficacy. Addiction. 2011;106(11):2017–28. doi:10.1111/j.1360-0443.2011.03505.x.
Frieden TR, Bloomberg MR. How to prevent 100 million deaths from tobacco. The Lancet. 2007;369(9574):1758–1761. doi:10.1016/S0140-6736(07)60782-X.
Glantz SA, Mandel LL. Since school-based tobacco prevention programs do not work, what should we do? Journal of Adolescent Health. 2005;36(3):157–159. doi:10.1016/j.jadohealth.2005.01.001.
Grana R, Benowitz N, Glantz S. Background Paper on E-cigarettes (Electronic Nicotine Delivery Systems). Center for Tobacco Control Research and Education University of California, San Francisco. 2013:1–109. Available at: http://arizo-nansconcernedaboutsmoking.com/201312e-cig_report.pdf
Grana RA, Ling PM. “Smoking revolution”: a content analysis of electronic ciga-rette retail websites. Am J Prev Med. 2014;46(4):395–403. doi:10.1016/j.amepre.2013.12.010.
Hammond D. Effectiveness of cigarette warning labels in informing smokers about the risks of smoking: findings from the International Tobacco Control (ITC) Four Country Survey. Tobacco Control. 2006;15(suppl_3):iii19–iii25. doi:10.1136/tc.2005.012294.
Hammond D. Health warnings on tobacco packages: Summary of evidence and legal challenges. 2008:1–31. Available at: http://global.tobaccofreekids.org/files/pdfs/en/India-study-warningLabels-DHammond-Jan08.pdf.
Harris KJ, Stearns JN, Kovach RG, Harrar SW. Enforcing an Outdoor Smoking Ban on a College Campus: Effects of a Multicomponent Approach. J Am Coll Health. 2009;58(2):121–126. doi:10.1080/07448480903221285.
70 THE EVANS SCHOOL REVIEW
E-CigarEttE PoliCy oPtions
Hoops, R. Pasco City Council Bans Smoking Cigarettes, E-Cigarettes Near Outdoor Public Areas. 2014, May 19. http://www.nbcrightnow.com/sto-ry/25560070/pasco-city-council-bans-smoking-cigarettes-e-cigarettes-near-out-door-public-areas
Huang J, Tauras J, Chaloupka FJ. The impact of price and tobacco control policies on the demand for electronic nicotine delivery systems. Tob Control. 2014;23 Suppl 3:iii41–7. doi:10.1136/tobaccocontrol-2013-051515.
Izenman, A. Grant County adopts ordinance regulating e-cigarettes. 2014, Sep-tember 15. http://moseslakegrantcounty.kxly.com/news/environment/139501-grant-county-adopts-ordinance-regulating-e-cigarettes
Jason LA, Berk M, Schnopp-Wyatt DL, Talbot B. Effects of enforcement of youth access laws on smoking prevalence. Am J Community Psychol. 1999;27(2):143–160.
King BA, Patel R, Nguyen, KH, et al. Trends in Awareness and Use of Electronic Cigarettes Among US Adults, 2010-2013. Nicotine Tob Res. 2014 Sep 19. pii: ntu191. [Epub ahead of print]
Klein SM, Giovino GA, Barker DC, Tworek C, Cummings KM, O’Connor RJ. Use of Flavored Cigarettes Among Older Adolescent and Adult Smokers: United States, 2004–2005. Nicotine & Tobacco Research. 2008;10(7):1209–1214.
Kuschner WG, Reddy S, Mehrotra N, Paintal HS. Electronic cigarettes and third-hand tobacco smoke: two emerging health care challenges for the primary care provider. Int J Gen Med. 2011;4:115–20. doi:10.2147/IJGM.S16908.
Lee JGL, Ranney LM, Goldstein AO. Cigarette butts near building entrances: what is the impact of smoke-free college campus policies? Tobacco Control. 2013;22(2):107–112. doi:10.1136/tobaccocontrol-2011-050152.
Maguire, M. North Carolina lawmakers adopt tax on electronic cigarettes. 2014, May 29. http://www.reuters.com/article/2014/05/29/us-usa-cigarettes-north-carolina-idUSKBN0E92C020140529
Mason, M. State lawmaker seeks ban on most tobacco, e-cigarette online sales. Los Angeles Times. 13 January 2014. http://articles.latimes.com/2014/jan/13/lo-cal/la-me-pc-internet-tobacco-sales-20140113
Matrix of Strong Local Tobacco Retailer Licensing Ordinances. The Center for To-bacco Policy & Organizing, American Lung Association of California. 2009:1–26. Available at: http://www.smokefreemarin.com/documents/LicensingMatrix-May09.pdf.
McCarthy WJ, Mistry R, Lu Y, Patel M, Zheng H, Dietsch B. Density of Tobacco Retailers Near Schools: Effects on Tobacco Use Among Students. American Journal of Public Health. 2009;99(11):2006–2013. doi:10.2105/AJPH.2008.145128.
McLaughlin I. License to Kill?: Tobacco Retailer Licensing as an Effective Enforce-ment Tool. Tobacco Control Legal Consortium. 2010:1–18.
McRobbie H, Bullen C, Hartmann-Boyce J, Hajek P. Electronic cigarettes for smoking cessation and reduction. Cochrane Database of Systematic Reviews 2014, Issue 12. Art. No.: CD010216. DOI: 10.1002/14651858.CD010216.pub2.
Minnesota Department of Revenue. Tobacco Tax – E-cigarettes. http://www.revenue.state.mn.us/businesses/tobacco/Pages/e-Cig.aspx
More E-Cigarettes in the Hands of Big Tobacco - Corporate Intelligence - WSJ. blogswsjcom. 2014. Available at: http://blogs.wsj.com/corporate-intelli-gence/2014/02/03/more-e-cigarettes-in-the-hands-of-big-tobacco/. Accessed October 28, 2014.
Municipal Research and Service Center of Washington. Smoking Regulations, Tobacco Prevention Programs. 2014. Available at http://www.mrsc.org/subjects/humanservices/tobacco.aspx#ecigarette
National Conference of State Legislatures. Alternative Nicotine Products – Elec-tronic Cigarettes. http://www.ncsl.org/research/health/alternative-nicotine-products-e-cigarettes.aspx
Nelson B. 2581 - Child Nicotine Poisoning Prevention Act of 2014. United States Senate.
72 THE EVANS SCHOOL REVIEW
E-CigarEttE PoliCy oPtions
Novak SP, Reardon SF, Raudenbush SW, Buka SL. Retail tobacco outlet density and youth cigarette smoking: A propensity-modeling approach. American Journal of Public Health. 2006;96(4):670–676. doi:10.2105/AJPH.2004.061622.
Oregon Department of Justice. Oregon Attorney General John Kroger Stops Sale Of Unapproved Electronic Cigarettes. 2009. Available at: http://www.doj.state.or.us/releases/pages/2009/rel081809.aspx. Accessed November 4, 2014.
Paynter J, Edwards R. The impact of tobacco promotion at the point of sale: A systematic review. Nicotine & Tobacco Research. 2009;11(1):25–35. doi:10.1093/ntr/ntn002.
Proposed Deeming Rule, 79 Fed. Reg. at 23, 195.
Public Health – Seattle & King County. Report on Tobacco Policies in Local Parks. 2014:1–8. Available at: http://lawatlas.org/files/skc/Tobacco_in_parks_FI-NAL_1-10-14.pdf.
Public Health Service. The Health Consequences of Smoking ¬ — 50 Years of Progress A Report of the Surgeon General. 2014.
Regan AK, Promoff G, Dube SR, et al. Electronic nicotine delivery systems: adult use and awareness of the ‘e-cigarette’ in the USA. Tob Control. 2013 Jan;22(1):19-23. doi: 10.1136/tobaccocontrol-2011-050044.
Regulating Toxic Vapor. ChangeLab Solutions. 2014:1–10. Available at: http://changelabsolutions.org/publications/e-cig-regulation.
Reitzel LR, Cromley EK, Li Y, et al. The Effect of Tobacco Outlet Density and Proximity on Smoking Cessation. American Journal of Public Health. 2011;101(2):315–320. doi:10.2105/AJPH.2010.191676.
Remler DK. Poor smokers, poor quitters, and cigarette tax regressivity. American Journal of Public Health. 2004;94(2):225–229. doi:10.2105/AJPH.94.2.225.
Research conducted by Nick Fradkin on behalf of Public Health Seattle & King County. The eleven school districts are: Auburn, Bellevue, Enumclaw, Highline, Is-saquah, Northshore, Renton, Riverview, Seattle, Tahoma, and Tukwila.
Ribisl KM, Kim AE, Williams RS. Are the sales practices of internet cigarette ven-dors good enough to prevent sales to minors? American Journal of Public Health. 2002;92(6):940–941. doi:10.2105/AJPH.92.6.940.
Richtel M. E-Cigarette Makers Are in an Arms Race for Exotic Vapor Flavors. New York Times. 7/15/2014.
Riordan M. DEADLY ALLIANCE: How Big Tobacco and Convenience Stores Part-ner to Market Tobacco Products and Fight Life-Saving PoliciesTable of Contents. countertobaccoorg. 2012:1–51. Available at: http://countertobacco.org/sites/default/files/deadlyalliance_full_report.pdf.
Rodgers, GB. The safety effects of child-resistant packaging for oral prescription drugs: two decades of experience. Jama. 1996;275.21:1661-1665.
Saitta D, Ferro GA, Polosa R. Achieving appropriate regulations for electronic cigarettes. Ther Adv Chronic Dis. 2014;5(2):50–61. doi:10.1177/2040622314521271.
State of Idaho Legislature. Idaho Code. Title 39 – Health and Safety. Chapter 57 – Prevention of Minors’ Access to Tobacco. http://www.legislature.idaho.gov/id-stat/Title39/T39CH57SECT39-5706.htm
Tacoma-Pierce County Health Department. E-Cigarette Frequently Asked Ques-tions. http://www.tpchd.org/files/library/e377c23d58eaeb02.pdf
Title 6 – Health and Sanitation. City of Pasco Municipal Code. https://egov-pasco.com/weblink8/0/doc/460552/Page1.aspx
Tobacco Control Legal Consortium. Electronic Cigarette Liquid Packaging and Sales Requirements. September 2014. http://publichealthlawcenter.org/sites/de-fault/files/resources/tclc-fs-e-liquid-packaging-2014_0.pdf
Tobacco Internet Sales. Washington State Attorney General; 2008:1–1. Available at: http://www.atg.wa.gov/uploadedFiles/Home/Office_Initiatives/Legislative_Agenda/2009/Tobacco_Internet_Sales.pdf.
74 THE EVANS SCHOOL REVIEW
E-CigarEttE PoliCy oPtions
United States Food and Drug Administration. Deeming – Extending Authorities to Additional Tobacco Products. http://www.fda.gov/TobaccoProducts/Labeling/ucm388395.htm
United States Food and Drug Administration. Issue Snapshot on Deeming: Regulat-ing Additional Tobacco Products. http://www.fda.gov/downloads/TobaccoProd-ucts/NewsEvents/UCM397724.pdf
United States Food and Drug Administration. Overview of the Family Smoking Prevention and Tobacco Control Act. http://www.fda.gov/downloads/Tobacco-Products/GuidanceComplianceRegulatoryInformation/UCM336940.pdf
United States Government Printing Office. Deeming Tobacco Products To Be Subject to the Federal Food, Drug, and Cosmetic Act, as Amended by the Family Smoking Prevention and Tobacco Control Act; Regulations on the Sale and Distri-bution of Tobacco Products and Required Warning Statements for Tobacco Prod-ucts; Proposed Rule. http://www.fda.gov/downloads/TobaccoProducts/Guid-anceComplianceRegulatoryInformation/UCM394914.pdf
United States Government Printing Office. Family Smoking Prevention and To-bacco Control and Federal Retirement Reform. http://www.gpo.gov/fdsys/pkg/PLAW-111publ31/pdf/PLAW-111publ31.pdf
US Department of Health and Human Services, Centers for Disease Control and Prevention, National Center for Chronic Disease Prevention and Health Promo-tion. 2012. 2012 Surgeon General’s Report—Preventing Tobacco Use Among Youth and Young Adults. Available at: http://www.surgeongeneral.gov/library/reports/preventing-youth-tobacco-use/exec-summary.pdf.
US Department of Health and Human Services, Centers for Disease Control and Prevention, 2012 Surgeon General’s Report—Preventing Tobacco Use Among Youth and Young Adults. 2012:1–22.
Warner KE, Pollack HA. The Nicotine Fix. The Atlantic. 2014. Available at: http://www.theatlantic.com/features/archive/2014/11/the-nicotine-fix/382666/. Ac-cessed January 19, 2015.
Warner KE. The economics of tobacco: myths and realities. Tobacco Control. 2000;9(1):78–89.
Washington State Department of Health. Burden of Tobacco in Washington State: Fact Sheet. 2010:1–2. Available at: http://www.doh.wa.gov/Portals/1/Docu-ments/Pubs/340-164-BurdenOfTobaccoInWashingtonStateFactSheet.pdfWashington State Legislature. Revised Code of Washington (RCW) 26.28.080. Selling or giving tobacco to minor – Belief of representative capacity, no defense – Penalty. http://app.leg.wa.gov/rcw/default.aspx?cite=26.28.080
Wechsler H, Kelley K, Seibring M, Kuo M, Rigotti NA. College smoking policies and smoking cessation programs: results of a survey of college health center direc-tors. J Am Coll Health. 2001;49(5):205–212.
Winickoff JP, Gottlieb M, Mello MM. Tobacco 21--an idea whose time has come. N Engl J Med. 2014;370(4):295–297. doi:10.1056/NEJMp1314626.
Yamin CK, Bitton A, Bates DW. E-cigarettes: a rapidly growing Internet phenom-enon. Ann Intern Med. 2010;153(9):607–609. doi:10.7326/0003-4819-153-9-201011020-00011.
76 THE EVANS SCHOOL REVIEW
EpistEmic pluralism in public policy
76 THE EVANS SCHOOL REVIEW
Epistemic Pluralism in Public Policy: The Critical Theory and Neuroscience
PerspectivesGilbert Michaud
gilbert.l.michaud @gmail.com
Virginia Commonwealth University Wilder School of Government and Public Affairs
Ph.D. Candidate
AbstractIn this paper, it is argued that public policy theory and practice require both variety and versatility in order to adapt to the mani-fold situations that public sector work can pose. Currently, several academics and professionals reduce public policy to some amal-gamation of the disciplines of economics, political science, and business. However, additional outlying perspectives, such as the critical, neuroscience, psychoanalytic, post-structural, feminist, and post-traditional theories (among others), can also offer much benefit to the comprehension of public policy. Looking at public policy analysis and action through this larger group of disciplines can be phrased as epistemic pluralism. In this realm, the term epistemic concerns knowledge or ways of knowing, while plural-ism concerns an approach that considers a variety of perspectives. This epistemic pluralism approach, though often unsung, offers considerable relevance and utility to public policy theory and prac-tice. For instance, scholars and practitioners alike can utilize such a tactic to better understand political arrangements and human behavior. This paper will consider the lack of epistemic plural-ism in academia and policymaking processes, and analyze practical implications through the critical theory and neuroscience perspec-tives. The critical theory perspective is deliberated as a way to challenge the obviousness of policy systems, as well as uncover the limitations in how human beings operate within particular struc-tures and relations with each other. The neuroscience perspec-tive focuses on the brain and behavior and is considered as it has prominent established truths concerning human nature that have not yet been connected with public policymaking.
IntroductionIt is perplexing that public policy, despite positing itself as an integrative discipline, suffers from a lack of perspectives in theory and practice. Most orthodox texts of the policy sciences describe
77VOL 5, SPRING 2015
Michaud
a system of agenda-setting, policy implementation, and evaluation, often acting within the political status quo and considering behavior through a rational or public choice lens. Why such one-dimensionality? Should students and policymakers not employ alternative perspectives to better comprehend how systems work and people act?
Epistemic pluralism is an exemplary method that employs multiple approaches to knowing. Working in direct opposition to reductionism, it is inherently apprehen-sive of an over-reliance on a single theory or lone approach, and, thus, stresses that numerous approaches to knowledge are needed to seek an enhanced truth.
Consider an example from the economics discipline. Decades ago, the neoclassi-cal approach attained dominance in the minds of scholars in explaining social and economic phenomena. More recently, however, economists have considered alter-native approaches such as those seen in the development of behavioral economics. Notably, Kahneman and Tversky (1979) confront assumptions of human rationality by incorporating psychology concepts into the economics discipline via prospect theory, which claims that decision-making is more largely based on risk-aversion than rationality or expected utility. Such promotion of pluralism in economics has allowed specialists to think critically of reliance upon any one approach to eco-nomic knowledge.
Despite progress in multidisciplinary research, several academic subjects remain apprehensive to evolve beyond their disciplinary walls. In public policy, using epis-temic pluralism to consider alternative approaches can be momentous in pushing the discipline to new places.
Background The applicative aims of the epistemic pluralism approach center on putting public policy in perspective, both in academia and in policymaking practice. Not only does this approach enhance disciplinary vocabulary, measures, and models, but it also provides imperative practitioner and research-oriented benefits by increasing the realm of knowledge.
While university-level public policy programs frequently claim to encompass a multidisciplinary approach, this remains largely unfulfilled, particularly consider-ing the discipline’s historical identity struggles for distinction and independence (Vigoda, 2003). Similarly, some government entities have partnered with multi-disciplinary organizations to improve policymaking processes via nudge theory, or
78 THE EVANS SCHOOL REVIEW
EpistEmic pluralism in public policy
indirect suggestions toward behavioral alternatives (e.g., UK’s Behavioural Insights Team; US’s Social and Behavioral Sciences Initiative); however, such an approach remains unconventional (John, 2014). Accordingly, public policy scholars and prac-titioners should encourage various ways of harvesting knowledge and be tentative of placing full support in one, sole method.
Literature ReviewPublic policy is often construed as governmental activities to mitigate societal problems. Mainstream policy texts habitually describe an agenda-setting process (Gandy Jr., 1982) that is clouded by value conflicts and power struggles (Birkland, 2011; Moran, Rein, & Goodin, 2006). Policymakers must consider what resources are available to achieve a solution (Fischer, 1995) and determine which agency or organization is accountable for policy enactment (Peters, 1999). Evaluation mea-sures help conclude if a policy was justified, considering its expenses and remu-nerations (Nagel, 2002).
While these generalized steps help discern the overall policy process, there is limited literature that advocates a more encompassing, multidisciplinary method. Scholars have noted the hindrance of an entirely multidisciplinary approach due to the structure of disciplinary knowledge (e.g., Cartwright, 1999), as values and uncertainties are unexpressed, and foundational issues are disregarded (Funtowicz & Ravetz, 1993). However, some have been successful in delineating the epistemic pluralism technique and the utility it offers to their respective disciplines (e.g., Spender, 1998; Teffo, 2011; Turkle & Papert, 1992). In public policy, epistemic pluralism is a rarely found methodology, though Dryzek and Niemeyer (2006), Farmer (2008, 2010, 2012), Waldo (1984), and Whetsell (2012) have advocated such approaches. Further, Cors (2014) suggests a cloud-based tool to organize the multiple public policy perspectives for students and practitioners to use.
One outlying perspective to consider is critical theory. Critical theory aims “to liberate human beings from the circumstances that enslave them” (Horkheimer, 1982, p. 244) and contest the simplicity of the world. Marcuse (1964, p. 16) suggests that human life is moving toward a “pacification of existence” as critical thought becomes continuously ignored to yield way to the status quo. This brings forth an annihilation of discourse, imagination, and culture into what Marcuse (1964) terms the dominant order. Against this environment, Marcuse endorses the “great refusal” (Marcuse, 1964, p. xxxvi) as a suitable process of a critical-thought rebellion against socially accepted standards. The critical theory approach has often been used in research (e.g., Causevic & Lynch, 2011; Holmes & Warelow, 2008;
79VOL 5, SPRING 2015
Michaud
Lunn, 2009).
The neuroscience perspective is another intriguing approach, looking at all aspects of the nervous system, particularly the brain. It is concerned with emotions, be-having, thinking, moving, and feeling (Kandel & Squire, 2001). It is through neuro-science that investigators seek to interpret how the brain influences behavior, as its 100 billion neurons form more than 100 trillion connections with other neurons (Farmer, 2010). Since each of these connections can be either active or inactive at any moment in time (Adams, 1990), the intricacy of the brain is truly incompre-hensible. Further, neuroplasticity describes how brain functions are neither con-fined to a set location nor do they remain fixed (Shaw & McEachern, 2001). The neuroscience approach has also been used in literature, particularly in law (e.g., Goodenough & Prehn, 2004; Müller, 2010).
Practical ImplicationsCritical Theory Perspective
Public policy scholars and practitioners ought to consider critical theory as a way to uncover the assumptions that hinder a full awareness of how policy processes work. Consider the example of the consumer. Consumers are thought of as having a wide-ranging scope in decision-making, but is this true? Should consumers not use critical theory to question the social structure of corporatism and consumer-ism, and how they fulfill their needs for goods and services?
Ultimately, critical theory aims to guide humans toward emancipation from domi-nating principles about policymaking systems. Scholars and practitioners need to get beyond constraining ideologies and false consciousness. They should use creativity and imagination to be analytical of common beliefs and develop critical actions. Critical theory needs to be involved in public policy as a way “to free citi-zens and administrators from reified, theoretical preconceptions and institutional constraints, allowing them to recreate themselves and the institutional arrange-ments” (Box, 2005, p. 91).
The critical theory approach empowers persons to think critically and question the status quo that pervades the public policy discipline. This can be done via a reflec-tive evaluation of society and policymaking norms, identifying means of change, and developing attainable goals toward meaningful transformation. Within this process, critical theory allows the discovery of alternative approaches. The per-spective of critical theory can help society advance beyond archetypical policymak-ing activities.
80 THE EVANS SCHOOL REVIEW
EpistEmic pluralism in public policy
Neuroscience PerspectiveThe neuroscience perspective shows how our brains play a fundamental role in rea-soning, speaking, and logical processes. Researchers study the chemical substances that carry messages in the nervous system from one neuron to another and how this dictates behavior. Certainly, an understanding of human behavior is crucial in shaping public policy. Would a deeper understanding of the many drivers that guide behaviors (e.g., cognitive, motivational, emotional, etc.) not assist in policy-making decisions?
Adding depth beyond timeworn ways of thinking about the behavior of a citizenry can influence public policy for societal progress. Though costly and not universally available (Marik, Rakusin, & Sandhu, 1997), brain scans and imaging could help evaluate the appropriateness of persons for certain jobs, predict voting likelihoods and consumer purchases, and explain humans’ inclinations and distastes. Why are policymakers and school districts not pushing music in younger levels of school, when it is shown to enhance brain functions, learning, and attitude (Vitale, 2011)? Why are 18 year-olds tried under the law as adults, despite the fact that their fron-tal cortex is not completely developed until their early twenties (Steinberg, 2009)? These education policy and law examples merely provide a glimpse of neurosci-ence’s serious implications for public policy.
Though we have just scratched the surface of this fascinatingly complex subject, we should continue to promote further brain-related examination of how people are driven. This will almost certainly show that human behavior diverges from what academics assume in models. Considering the neuroscience perspective on this quest for epistemic pluralism can have a powerful effect on policy theory and practice.
ConclusionIs it clear that public policy is simply a combination of economics, politics, and business? Why not consider alternative perspectives? What about other viewpoints not even discussed here? Utilizing epistemic pluralism, public policy is a unique interconnection between a seemingly never-ending variety of disciplines. It has been argued that the utilization of the critical theory and neuroscience perspectives offer a viable approach for superior public policy comprehension by emancipating one-dimensionality and considering the role of the brain. However, only consid-ering these two alternate perspectives is a lamentable oversight. Public policy is not a system that relies solely on one approach, nor should it be reduced to one simplistic method. Employing epistemic pluralism is an intriguing method to fully grasp public policy theory and implement it in the real world.
81VOL 5, SPRING 2015
Michaud
Author Affiliations
Gilbert Michaud is a Ph.D. student at Virginia Commonwealth University, pursu-ing a degree in Public Policy & Administration. Gilbert’s research interests include public policy theory, renewable energy policy, and economic development.
82 THE EVANS SCHOOL REVIEW
EpistEmic pluralism in public policy
References
Adams, J. L. (1990). A complementarity mechanism for enhanced pattern process-ing. Neural Computation, 2(1), 58–70.
Birkland, T. (2011). An introduction to the policy process: Theories, concepts, and models of public policy making. Armonk, NY: M.E. Sharpe, Inc.
Box, R. C. (2005). Critical social theory in public administration. Armonk, NY: M.E. Sharpe, Inc.
Cartwright, N. (1999). The dappled world: A study of the boundaries of science. New York, NY: Cambridge University Press.
Causevic, S., & Lynch, P. (2011). Phoenix tourism: Post-conflict tourism role. An-nals of Tourism Research, 38(3), 780–800.
Cors, C. (2014). Expanding understanding of public policy as a complex and pluri-disciplinary system: Illustrating possibilities of epistemic pluralism. (Doctoral dis-sertation). Retrieved from http://scholarscompass.vcu.edu/etd/3574/.
Dryzek, J. S., & Niemeyer, S. (2006). Reconciling pluralism and consensus as po-litical ideals. American Journal of Political Science, 50(3), 634–649.
Farmer, D. J. (2008). Epistemic pluralism and neuroscience. Administrative Theory & Praxis, 30(3), 285–295.
Farmer, D. J. (2010). Public administration in perspective: Theory and practice through multiple lenses. Armonk, NY: M.E. Sharpe, Inc.
Farmer, D. J. (2012). Theorizing in perspective. Administrative Theory & Praxis, 34(2), 180–190.
Fischer, F. (1995). Evaluating public policy. Mason, OH: Thompson-Wadsworth. Funtowicz, S., & Ravetz, J. (1993). Science for the post-normal age. Futures, 25(7), 735–755.
Gandy Jr., O. (1982). Beyond agenda setting: Information subsidies and public policy. Norwood, NJ: Ablex Publishing.
83VOL 5, SPRING 2015
Michaud
Goodenough, O. R., & Prehn, K. (2004). A neuroscientific approach to norma-tive judgment in law and justice. Philosophical Transactions of the Royal Society B: Biological Sciences, 359(1451), 1709–1726.
Holmes, C. A., & Warelow, P. J. (2008). Culture, needs and nursing: A critical theory approach. Journal of Advanced Nursing, 25(3), 463–470.
Horkheimer, M. (1982). Critical theory. New York, NY: Seabury Press.
John, P. (2014). Policy entrepreneurship in UK central government: The Behavioral Insights Team and the use of randomized controlled trials. Public Policy and Admin-istration, 29(3), 257–267.
Kahneman, D., & Tversky, A. (1979). Prospect theory: An analysis of decision un-der risk. Econometrica, 47(2), 263–291.
Kandel, E. R., & Squire, L. R. (2001). Neuroscience: Breaking down scientific bar-riers to the study of brain and mind. Annals of the New York Academy of Sciences, 935, 118–135.
Lunn, J. (2009). The role of religion, spirituality and faith in development: A criti-cal theory approach. Third World Quarterly, 30(5), 937–951.
Marcuse, H. (1964). One-dimensional man. Boston, MA: Beacon Press.
Marik, P. E., Rakusin, A., & Sandhu, S. S. (1997). The impact of the accessibility of cranial CT scans on patient evaluation and management decisions. Journal of Inter-nal Medicine, 241(3), 237–243.
Moran, M., Rein, M., & Goodin, R. E. (2006). The Oxford handbook of public policy. New York, NY: Oxford University Press.
Müller, J. L. (2010). Psychopathy—An approach to neuroscientific research in forensic psychiatry. Behavioral Sciences & the Law, 28(2), 129–147.
Nagel, S. S. (2002). Handbook of public policy evaluation. Thousand Oaks, CA: Sage Publications.
84 THE EVANS SCHOOL REVIEW
EpistEmic pluralism in public policy
Peters, B. G. (1999). American public policy: Promise and performance. Chap-paqua, NY: Chatham House.
Shaw, C. A., & McEachern, J. C. (2001). Toward a theory of neuroplasticity. Phila-delphia, PA: Psychology Press.
Spender, J. C. (1998). Pluralist epistemology and the knowledge-based theory of the firm. Organization, 5(2), 233–256.
Steinberg, L. (2009). Adolescent development and juvenile justice. Annual Review of Clinical Psychology, 5, 47–73.
Teffo, L. (2011). Epistemic pluralism for knowledge transformation. International Journal of African Renaissance Studies, 6(1), 24–34.
Turkle, S., & Papert, S. (1992). Epistemological pluralism and the revaluation of the concrete. Journal of Mathematical Behavior, 11(1), 3–33.
Vigoda, E. (2003). Rethinking the identity of public administration: Interdisciplin-ary reflections and thoughts on managerial reconstruction. Public Administration & Management, 8(1), 1–22.
Vitale, J. L. (2011). Music makes you smarter: A new paradigm for music educa-tion? Perceptions and perspectives from four groups of elementary education stakeholders. Canadian Journal of Education, 34(3), 317–343.
Waldo, D. (1984). The administrative state: A study of the political theory of American public administration. New York, NY: Holmes & Meier.
Whetsell, T. A. (2012). Theory-pluralism in public administration: Epistemology, legitimacy, and method. The American Review of Public Administration, 43(5), 602–618.
85VOL 5, SPRING 2015
DesmonD, HutcHinson
85VOL 5, SPRING 2015
A Benefit-Cost Analysis of a Road Diet on Seattle’s Rainier Avenue South
Andrew Desmond
ald6@ u.washington.edu
University of Washington Evans School of Public Policy and Governance
MPA Candidate
Brian Hutchinson
hutch14@ u.washington.edu
University of Washington Evans School of Public Policy and Governance
MPA Candidate
AbstractRainier Avenue South in Seattle, Washington, is an accident-prone road, with an average of 414 crashes occurring each year along a 2.5-mile stretch between Letitia Avenue and Seward Park Avenue South. Speeding vehicles and a high number of bicycle-vehicle and pedestrian-vehicle accidents indicate that the road’s design may contribute to the prevalence of traffic accidents.
We undertake a benefit-cost analysis of one option for improv-ing safety on Rainier Avenue South: a road diet. Between Letitia Avenue and Seward Park Avenue, the road diet would convert Rainier Avenue from a four-lane road into a two-lane road with a center turn lane.
Our analysis examines the social benefits and costs of institut-ing a road diet relative to the status quo (i.e. no road diet). Road diets are known to provide substantial safety benefits because they reduce the number of crashes that occur. However, decreasing the number of lanes can impose travel time costs.
We estimate the benefits of implementing a road diet on Rainier Avenue South by using injury data from Seattle Department of Transportation. On average about 414 crashes and 214 injuries oc-cur each year on the road. Each injury—broken down in specific categories ranging from minor to fatal—is monetized through US DOT’s value of a statistical life. Recent literature suggests that road diets in urban areas achieve about a 19 percent reduction in crashes. We apply this figure to statistics on Rainier Avenue South to obtain an estimate of how much injury cost would be avoided as a result of a road diet. We find that rechanneling Rainier Avenue South would provide substantial safety benefits of $102.1 million over a 20-year period.
Costs: Rechanneling Rainier Avenue requires a trade-off between in-creased safety and increased travel times for motorists using the
86 THE EVANS SCHOOL REVIEW
Benefit-Cost AnAlysis of A RoAd diet foR seAttle’s RAinieR Avenue south
road and its alternative, Martin Luther King, Jr. Way. Recent literature shows that delays occur on “road-diet” roads when traffic exceeds 1,700 bidirectional cars per hour, and that delays are anywhere from >0 – four mph. Factoring in travel demand and population growth, we model how often Rainier Avenue North would exceed this critical threshold. Median household income in the Seattle area is used to affix a monetary value to each minute of delay. Factoring in the effects of population growth, we estimate the costs of travel delays to be $31.2 million over a 20-year period.
Taking the benefits and costs together, our analysis finds that installing a road diet on Rainier Avenue South will result in net benefits of $70.9 million over 20 years. Given these findings, it is recommended that the City of Seattle enact the consid-ered road diet project.
IntroductionProblem – Why Rainier, Why Now?
Rainier Avenue South between Letitia Avenue and Seward Park Avenue South in southeast Seattle is a hazardous four-lane road that threatens motorists, bicyclists and pedestrians alike. In three years, 1,243 accidents have occurred on the 2.5-mile stretch of Rainier separating Letitia Avenue and Seward Park Avenue (Seattle Met, 2014). This includes 56 pedestrian- and bike-related accidents. Comparable four lane roads like Lake City Way and 35th Avenue in Seattle have seen substan-tially fewer accidents. For example, about 10,000 more motorists use Lake City Way during peak hours than Rainier Avenue South, but Rainier has been the scene of 73% more accidents (Seattle Department of Transportation, 2013).
What is Causing Accidents on Rainier?Rainier is a four-lane undivided road, meaning there are no physical barriers separating north/south traffic flows. In addition, several other characteristics make Rainier prone to accidents:
• High traffic volumes.• Road design that enables high rates of speeding:
• As many as 9% of road users are categorized as “high-end speeders” – those traveling in excess of ten miles per hour above the speed limit.
• 56% of road users exceed the speed limit by 3 mph or more. (Seattle De-partment of Transportation, 2014)
• Lack of protected bike lanes on northbound/southbound traffic lanes.• Poor design for pedestrians.
87VOL 5, SPRING 2015
DesmonD, HutcHinson
• Timed crossing signals – a recent UW study found that pedestrian signal timings were much longer than the industry standard.
• Unmarked crossings.
Considering Options to Address Unsafe Road ConditionsMotivated by the unsafe conditions, community members in southeast Seattle have partnered with Seattle’s Department of Transportation (SDOT) to devise commu-nity-appropriate solutions to the problem. One possible solution that has sur-faced—an approach used by SDOT in several previous instances—is the road diet.
Road DietsA road diet, as its name suggests, generally involves reducing the number of ve-hicular travel lanes on a given road (Welch). Reducing the number of lanes results in safety benefits to motorists, bicyclists, and pedestrians. However, on high traffic roads, reducing the number of lanes can also cause travel times to increase, result-ing in costs to motorists. This section outlines the concept of a road diet, and ways in which rechanneling roads can result in safety benefits and travel time costs. It then briefly examines existing studies that detail the typical size of these effects, before positioning this background information in the context of Seattle’s Rainier Avenue South.
What is a Road Diet?Historically, preference for cars as the preferred travel mode and skyrocketing car ownership led to roadway expansions. As the argument went, in order to reduce congestion roads should be expanded to accommodate more vehicles. While ex-panding roads does increase a given road’s car-carrying capacity, several negative repercussions typically result (Burden, Gandy, and Sallaberry, 2011). Primarily1, these include:
• Higher vehicular speeds.• Increases in the number of traffic accidents.
Recognition of these costs is leading to a reversal in trend. In defiance of the for-mer emphasis on “growing” roads to reduce congestion, many cities are initiating road diets that reduce the number of travel lanes. Commonly these road diets oc-cur on 4-lane urban roads. A road diet reduces them to two travel lanes, divided by
1 Secondary costs include increased emissions and noise. In addition, expanding roadways can de-crease “community livability” by discouraging multi-modal use of a roadway. See “Benefits and Costs Measured in this Analysis” for further discussion.
88 THE EVANS SCHOOL REVIEW
Benefit-Cost AnAlysis of A RoAd diet foR seAttle’s RAinieR Avenue south
a third center turn lane.2 Below, Figure 1 illustrates this transformation.
Figure 1: Source: Benefits and Costs of a Road Diet for Livingston Avenue, New Jersey
Before
After
In addition to rechanneling the lanes, a road diet also typically adds in visible (sometimes protected) bike lanes. Many introduce pedestrian friendly amenities like bulbed sidewalks that jut out into the street.3 These decrease the distance that pedestrians must walk in the street itself, and increase crosswalk visibility. A road diet can be implemented at low cost—about $50,000 per mile—because changing the lane structure generally involves little more than restriping an already paved roadway.
2 Road diets are implemented in many other scenarios. Other examples include reduction of 8-lane roads to four, and 6-lane roads to five.3 The road diet under consideration on Rainier Avenue does not include this feature, however.
89VOL 5, SPRING 2015
DesmonD, HutcHinson
Safety Improvements and Travel Time EffectsRoad diet enhancements generally improve safety, while effects on travel time depend on existing road volumes. Safety improves for several reasons. 1) Because only one travel lane exists in each direction, fewer lane changes occur, reducing the opportunity for collisions. In ad-dition, with only one lane, vehicles are constrained in their ability to speed because the road only moves at the pace of the slowest driver. 2) A dedicated center turn lane means that drivers do not feel as much pressure from trailing through vehicles to make a quick turn. This reduces vehicle collisions and pedestrian vulnerability. 3) Dedicating street space to bicyclists decreases the chance that bicycle-vehicle accidents occur. Reducing the number of lanes that pedestrians must cross also improves accident risk.
Travel time effects are less clear. After a road diet, travel times can either be longer or shorter depending on the number of vehicles that travel on the road. Road diets have been successful on roads that carry as many as 30,000 daily vehicles, but researchers generally agree that 20,000-23,000 average daily vehicles (ADT) is the more accurate threshold for determining whether or not to implement a road diet (Burden and Lagerwey, 1999). Hour-by-hour, 1,700 bidirectional vehicles per hour is used as the critical threshold (Thomas, 2013). Below these levels, a road diet will produce no traffic delays; above it, vehicles are slowed by congestion.
It’s easy to imagine that reducing lanes leads to increased travel times. But, it is harder to see how a road could maintain travel speeds with a reduction of up to 100% of carrying capacity. Efficiency can be maintained in these circumstances, however, for several reasons. 1) Except sometimes during peak hours (“rush hour”), most roads carry far less than the maximum amount of vehicles that they can support. A single lane is sometimes all that is needed to handle the vehicles that use a given road. 2) Adding center turn lanes can add up to 30 percent in efficiency of movement (Burden and Lagerwey). Thus, even though there are fewer lanes and travel speed decreases, the remaining lanes move more efficiently.Road Diets in Perspective: What the Data Says about Safety and Travel DelayA study of existing road diet analyses—which included 30 urban road diet sites in California and Washington State (including Seattle locations)—found that road diets result in a 19 percent4 average reduction in crashes (Harkey, 2008).
In circumstances in which a road diet caused travel delay, vehicles experienced slowing anywhere between >0 mph - 4 mph along their route (Thomas).
4 Standard error = 2.5%
90 THE EVANS SCHOOL REVIEW
Benefit-Cost AnAlysis of A RoAd diet foR seAttle’s RAinieR Avenue south
A Road Diet on Rainier Avenue SouthFor the purpose of this analysis, the pro-posed road diet for Rainier Avenue South will occur on a 2.5-mile stretch between Letitia Avenue and Seward Park Avenue South (Figure 2).
The project will reduce Rainier Avenue South from four travel lanes to two, and will incorporate a third center turn lane. Bi-directional bike lanes will be added on either side of the street. Estimated capital cost of the road diet is $125,000.
Along varying sections of the route, ADT ranges from 19,700 – 26,600, with significant pedestrian activity occurring in and around dense neighborhood urban centers (Seattle Department of Transpor-tation). On average, about 414 crashes occur every year.
Figure 2: Rainier Avenue South between Le-ticia Avenue and Seward Park Avenue South
Ex Ante Benefit Cost Analysis of a Road Diet on Rainier Avenue South
To measure the social benefits and costs of the proposed road diet, we conduct an ex ante analysis that compares benefits and costs of the road diet relative to the al-ternative: the status quo. We measure the project’s benefits and costs over a 20-year time frame. The selected 20-year time frame is similar to the time frame used in other transportation related projects (Noland, 2104).
Benefits and Costs Measured in this AnalysisRoad diets carry with them the key benefit of improved safety for motorists, bicyclists and pedestrians. Safety improvements will thus be the primary benefit measured in this analysis. Road diets also offer several other benefits that are not included in this analysis for the reasons listed below:
91VOL 5, SPRING 2015
DesmonD, HutcHinson
Unmeasured benefits:• Noisereductionresultingfromtrafficcalming (Litman 1999). Scholarship finds that
noise reduction will sometimes result from road diets, but only if the project reduces stop-and-go traffic. The likelihood that the road diet considered on Rainier Avenue will do so is unknown, and thus we choose not to include this benefit.
• Emissionsreductionresultingfromtrafficcalming (Rutgers University). Like noise reduction, emissions reductions will only result if the project reduces stop-and-go traffic. It too is omitted from this analysis due to doubts about stop-and-go traffic impacts.
• Improvedcommunitylivability. By reducing speeds and making an area safer, road diets can improve community livability and bolster property values. Road diets are also sometimes accompanied by aesthetic elements, such as tree-lined avenues and benches. The road diet considered in this analysis lacks these aesthetic improvements. Also, counting the property value increases would double-count the safety benefits of the project, as said property values inflate precisely because of the increased safety. As a result, we omit community liv-ability from this analysis.
Implementing a road diet will result in the following costs:• Capital cost of the project (i.e. striping the road) – estimated at $125,000. • Increased commute times suffered by automobile users of Rainier Avenue,
inclusive of future road use increases as a result of population growth) • Increased commute times suffered by automobile users of MLK, Jr. Way, as
a result of traffic spillover from Rainier Avenue South. Spillover will occur because Rainier users who suffer delays will utilize nearby MLK, Jr. Way as a potentially quicker alternative route.
ProjectedOutcomesforRelevantStakeholdersBelow, a Kaldor-Hicks tableau displays the groups for whom we are measuring benefits and costs. This analysis considers benefits and costs from the regional per-spective, meaning that all road users, regardless of where they live, are considered in this analysis. The benefit categories in gray are those omitted in this analysis (as discussed above).
92 THE EVANS SCHOOL REVIEW
Benefit-Cost AnAlysis of A RoAd diet foR seAttle’s RAinieR Avenue south
Figure 3: Kaldor-Hicks tableau for Road Diet: Benefits and Costs (Seattle Perspective)Motorists Pedestrians Bicyclists Bus
PassengersBenefits
Reduced Accident Probability
x x x
Increased Mobility x xNoise Reduction
Emission ReductionImproved Community
LivabilityCosts
Stripping CostsTravel Delays x x
Net
Calculating Safety BenefitsThe project benefits are actually the injury costs that are avoided as a result of implementing the road diet. We calculate the benefit of avoided injuries at $5,807,970 in year 1. Over the 20-year life course of the project, avoided injuries are calculated at $102,130,810.
The following steps are used to attain a monetary value of injuries avoided as a result of implementing a road diet, and thus to arrive at the above figures:1. For each type of injury that can occur in a crash—minor, moderate, serious,
severe, critical, and fatal (known as AIS categories)—we assign a monetary “damage” value that is based on proportions of the value of a statistical life (VSL).
2. About 414 accidents and 214 injuries occur on Rainier Avenue each year. From recent research, we derive the likelihood of a given crash/injury falling into one of the AIS categories.
3. Next, the VSL valuations in step 1 are multiplied by the crash category distri-butions in step 2. From this, we obtain the “total cost” of crashes on Rainier Avenue S.
4. Finally, the value obtained in step three—total cost of crashes—is subtracted from the same value obtained under the conditions of a road diet (in which we project a 19% reduction in crashes).
Each of these steps are detailed in depth below.
93VOL 5, SPRING 2015
DesmonD, HutcHinson
Figure 3: Kaldor-Hicks tableau for Road Diet: Benefits and Costs (Seattle Perspective)Adjacent
ResidencesAdjacent
BusinessesGovernment Net
BenefitsReduced Accident
ProbabilityIncreased Mobility
Noise Reduction x xEmission Reduction x x
Improved Community Livability
x x
CostsStripping Costs x
Travel DelaysNet
Step 1 - Value of a Statistical Life and Injury Crash Categories
When an accident occurs, po-lice officers on scene typically record injuries in impact catego-ries: killed, incapacitating injury, non-incapacitating injury, possible injury, no injury. This system is known as KABCO. KABCO can then be coded into a more detailed breakdown of crash injuries known
Table 1Injury Severity
CodeDescription Valuation
(% VSL)AIS 1 Minor 0.3AIS 2 Moderate 4.7AIS 3 Serious 10.5AIS 4 Severe 26.6AIS 5 Critical 59.3AIS 6 Fatal 100
as the Abbreviated Injury System (AIS).In the AIS system, injuries are placed in categories numbered 1-6, with each number representing an injury that ranges from minor to fatal. The US Department of Transportation provides specific rec-ommendations on how to value each injury as a percentage of its recommended Value of a Statistical Life (VSL): $9.2 million (US Department of Transportation, 2014).
Table 1 illustrates the breakdown of AIS categories. A minor injury, for instance is worth .003 of the VSL or $27,000.
94 THE EVANS SCHOOL REVIEW
Benefit-Cost AnAlysis of A RoAd diet foR seAttle’s RAinieR Avenue south
Step 2 - Breakdown of Injury Severity in Crashes on Rainier Avenue
Knowing how much an injury is worth, it then becomes necessary to figure out how many of each type of injury is occurring in crashes on Rainier Avenue South. For 4-lane, undivided roads similar to Rainier Avenue, The National Highway Transportation Safety Administration (NHTSA) estimates that about 63 percent of the crashes that occur result in property damage only (no injury). The remaining 37 percent of crashes result in varying gradations of injury (US Department of Trans-portation, 2010). Table 2 shows a breakdown of these probabilities, and resulting distributions of collisions that occur on Rainier in a given year.
Table 2: Probability of an Injury on RainierInjury Severity Probability # of Collisions Total InjuriesAIS 1 0.3288 136.27 196.45AIS 2 0.0287 11.89 17.16AIS 3 0.0081 3.36 4.86AIS 4 0.0013 0.55 0.80AIS 5 0.0004 0.17 0.26Fatal 0.0015 0.65 0.94Property Damage Only (PDO)
0.6309 261.40 0
Total 1 414.33 220.47
In addition to collisions, however, we must also factor in that vehicles may be car-rying more than one occupant at the time of a crash, or that a crash may injure multiple pedestrians or bicyclists. SDOT’s record show that when a crash causes injury, on average about 1.4 people are involved in that crash. Utilizing this fig-ure, the final column of Table 2 contains final estimations of the total # of injured people impacted in each injury severity category.
Steps 3 & 4 - Obtaining Final Estimates of the Cost AvoidedIn each AIS category, the total number of people injured in a Rainier crash is multiplied by the AIS categories’ VSL valuation. For instance, in a given year, about 17.16 “moderate” injuries are predicted to result from crashes on Rainier Ave.
17.16 * (9.2 million * .047) = $7,418,0595
Injuries in the road diet scenario are predicted to be 19 percent lower. Table 3 5 Rounding produces small difference (in Table 3 as well)
95VOL 5, SPRING 2015
DesmonD, HutcHinson
shows the estimated crashes that will occur in each category if a road diet is in place. Summing costs across all categories in pre- and post-road diet scenarios will yield total estimated costs of injury in the status quo and under a road diet. The difference between the two figures represents cost avoided in the first year of after the road diet.
$30,568,263 - $24,760,293 = $5,807,970
Over the 20-year life span of the project the road diet produces $102,130,810 in avoided injury costs.6
Cost of Traffic DelaysWhy a Road Diet May Increase Travel Delays
The most substantial cost imposed by road diets are traffic delays. We estimate that road diet will result in 20-year travel costs of $31.3 million.
Road diets have the potential to decrease vehicle speeds and thus increase commute times. On Rainier Avenue, a 4-lane road, a proposed road diet will eliminate one lane altogether while converting another into a separating turn lane. In many cases, the result is increased vehicle density (i.e. congestion), and reduced speeds.8 It is
6 This figure is based on calculations that assume the following: .0118% growth in VSL each year, 5% Discount Rate, and vehicle growth on the roadway equal to 2% each year.7 NHTSA estimates the average cost of “property damage only” collisions to be $3,861.67.8 It should be noted that road diets do not always result in increased travel delays. Due to their mechanics, namely the introduction of a middle turn lane, road diets can actually improve flow and reduce travel times, if not keeping them constant. (just an important aside).
96 THE EVANS SCHOOL REVIEW
Benefit-Cost AnAlysis of A RoAd diet foR seAttle’s RAinieR Avenue south
imperative to monetize the cost of travel delays to accurately evaluate the benefits and costs of the proposed road diet.
The following sections outline the steps taken to quantify traffic delay impact on both Rainier Avenue and MLK.
Population Growth and Vehicle Traffic on RainierCurrently the fastest growing city in the country, Seattle’s population is projected to grow at a high rate over coming decades. Regional population growth will likely add new cars to the roads, increase congestion and lengthen commutes. The extent to which population growth will impact congestion is uncertain, however. In this analysis, we assume that automobile volumes will increase, but at a rate less than the rate of population growth. This assumption is made because many factors—i.e. gas prices and availability of transit—influence the number of cars on the road.
To this point, daily vehicle volumes have actually declined in Seattle at a rate of about .00697percent each year from 2000-2012 (Seattle Department of Transporta-tion, 2012). Lacking access to a truly accurate travel demand model and acknowl-edging that common practice dictates that growth be modeled in, we assume a base case growth of 2 percent with an upper bound of 4 percent and a lower bound of -0.006.
We account for this growth in our model by using the following equation:
Calculating Travel Delays – Methodology As previously mentioned, a meta-analysis of road diets finds that travel delays can be expected on roads undergoing a conversion when per-hour road volume exceeds 1,700 cars per hour (bi-directionally). As can be seen in Table 4, current (2014) traffic volumes exceed the critical threshold of 1,700 cars per hour in three hours of an average workday (3pm through 5pm).
The meta-analysis also finds that travel delays resulting from road diet conversions range from >0 mph – four mph (assuming the 1,700 critical vehicles per hour threshold is crossed) (Thomas). We thus anticipate some delay on Rainier Avenue South as a result of the road diet conversion. The sections below describe how we
9 This figure is utilized in sensitivity analysis calculations for our “best case scenario.”
97VOL 5, SPRING 2015
DesmonD, HutcHinson
quantify and monetize the impact of travel delay on Rainier and MLK. 8
Modeling Delays on RainierIn an automobile, it currently takes seven minutes to travel the 2.5 miles of Rainier examined for a road diet. The degree to which speed alterations will impact travel time is given in Table 5. For instance, a 1 MPH decrease in road speeds will increase travel time to 7.3 minutes, a 4.9 percent increase. Similar-ly, a four MPH decrease in road speed will increase travel times to 8.61 minutes, a 23 percent increase.
Travel Demand Elasticity and Modeling Delays on MLK
As road speeds decline on Rainier Avenue South—and commute time increases—we anticipate some automobile commuters will abandon Rainier Avenue for MLK Jr. Way. The extent to which this will occur is given by the following travel demand elasticities on urban routes (Litman):
• -0.27 in the short run10 • -0.57 in the long run
The above figures represent how sensitive Rainier commuters will be to lengthened commutes. For example, the short-run elasticity of -0.27 means that for every 10 percent increase in travel time on Rainier Avenue, 2.7 percent of Rainier commuters
Table 4Time Traffic Volumes12:00 AM 2241:00 AM 1532: 00 AM 1523:00 AM 994:00 AM 1855:00 AM 4186:00 AM 8667:00 AM 13708:00 AM 14479:00 AM 134610:00 AM 133711:00 AM 147012:00 AM 15851:00 PM 15532:00 PM 15813:00 PM 18044:00 PM 18235:00 PM 18406:00 PM 15627:00 PM 12798:00 PM 10079:00 PM 90610:00 PM 60711:00 PM 374
will abandon Rainier for MLK in the short run. The long-run elasticity of -0.57 means that for every 10 percent increase in travel time on Rainier, 5.7 percent of commuters will abandon Rainier for MLK.
10 Note that the short run is likely very short here. Savvy road travelers will quickly realize that nearby MLK is faster, and structure their commute accordingly.
98 THE EVANS SCHOOL REVIEW
Benefit-Cost AnAlysis of A RoAd diet foR seAttle’s RAinieR Avenue south
Table 5Short Run Travel Elasticity Long Run Travel Elasticity1 MPHDecrease
However, increased traffic volumes on MLK will also impact commute times there. We estimate that commute times on MLK will increase by 1 – 3 minutes based on field research that utilized traffic information from Google Maps.119
Monetizing Costs of Travel Delays on Rainier Avenue and MLK Jr. Way
We affix a dollar value to travel delays by utilizing the following calculation:
Monetization of travel delays on Rainier Avenue:As the above discussion suggests, “size of delay” is impacted by the magnitude of speed change. Delays on Rainier are expected to range from 0.34 minutes to 1.6 minutes. Seattle area median income per minute is $0.49. This analysis also as-sumes that delays will only occur on weekdays, meaning impacts will only be felt 250 days out of the year. So, monetizing delays on Rainier looks like this:
We find the total cost to Rainier automobile travelers, inclusive of attrition to MLK, to be $14.9 million.
Monetization of travel delays on MLK:The same process utilized above is used to calculate the cost of delay to MLK auto-mobile travelers. We find the total cost to MLK automobile travelers to be $16.1 million.
11 The methods employed here are admittedly crude, and should be revisited in future analyses.
99VOL 5, SPRING 2015
DesmonD, HutcHinson
Results – A Net Social BenefitUsing the methodology outlined above, we arrive at a net present value of $70.9 million over the 20-year life of the project (Table 6). This figure is calculated using the following assumptions:• 5% social discount rate• 19% reduction in accidents on Rainier Avenue• 2-mph speed decrease on Rainier Avenue• 2% growth in motor vehicle use of Rainier Avenue and MLK• A one-minute travel delay imposed on MLK motorists due to Rainier avenue
Benefit-Cost AnAlysis of A RoAd diet foR seAttle’s RAinieR Avenue south
Best Case: $104.3 million in net benefitsThe best case, as suggested by our research, includes the following parameters:• 3% social discount rate• 21.5% reduction in accidents on Rainier Avenue• 1 mph speed decrease on Rainier Avenue• -0.006 motor vehicle growth on Rainier and MLK• One-minute delay imposed on MLK motorists due to Rainier Avenue spillover.
Worst Case: -$9.7 million in net costsThe worst case, as suggested by our research, includes the following parameters:• 7% social discount rate• 16.5% reduction in accidents on Rainier Avenue • 4-mph speed decrease on Rainier• 4% motor vehicle growth on Rainier and MLK
Table 7 - Sensitivity AnalysisAssumes Base Case Best Case Worst CaseSocial Discount Rate 5% 3% 7%Reduction in Collisions
A Monte Carlo analysis was not performed because we felt that we lacked certain crucial information about probability distributions needed to perform an accurate analysis. Specifically, the literature lacked information about the probability distri-butions for key variables, such as speed change on Rainier Avenue. For example, literature states that speed changes of >0 – four mph will occur, but the litera-ture did not offer any indication of the probability of any one figure occurring. It is likely the magnitude of speed change is not random, but is rather dependent on certain factors that would inform a probability distribution. Without this informa-tion, we felt that a Monte Carlo analysis would return interesting but not entirely
101VOL 5, SPRING 2015
DesmonD, HutcHinson
useful results.
Recommendation We recommend that the Seattle Department of Transportation take action to implement a road diet on Rainier Avenue South. An overwhelmingly positive net present value occurs in both the best- and base-case scenarios. An unlikely worst-case scenario drives NPV only slightly negative over a 20-year period. However, it is important to recognize that several impacts were not included in this analysis that may positively or negatively influence the results of this study.
Impacts Not Included in the AnalysisThere are several key impacts not included in this analysis. Future work should consider these impacts and seek to incorporate them. They include:• Increased accident potential on MLK due to increased congestion.• Increased mobility for pedestrians and bicyclists on Rainier.• Delays incurred by bus users.• Not included because it requires specific figures of ridership statistics on
each route, at every point during the day. • The degree to which delay on Rainier Avenue will cause people to substitute
car travel with public transportation or other modes (thereby removing cars from the road). This would be calculated using the cross-price elasticity of demand between automobile use and public transportation.
• Road diet maintenance costs.
DiscussionWhile confident in our findings, we also recognize several possible additions that would refine our analysis.
AIS Probabilities under a Road DietFirst, additional research should consider how a road diet alters the distribution of injuries on Rainier Avenue. In our calculations, probabilities of injury are held con-stant in both the status quo and road-diet scenarios. For instance, in current condi-tions there is about a 33 percent chance that an accident-related injury is a minor one. However, the road-diet design may have little impact on minor accidents, but a large impact on the frequency with which serious accidents occur. Knowing spe-cifically how a road diet will alter the probability that certain accidents types will transpire would alter the safety benefits of the road diet. Unfortunately, the current literature on road diets does not discuss revised AIS probabilities on roads that have
102 THE EVANS SCHOOL REVIEW
Benefit-Cost AnAlysis of A RoAd diet foR seAttle’s RAinieR Avenue south
undertaken a road diet.
MLK Travel DelayWe utilized crude methods to estimate travel delays imposed on MLK motorists. An accurate estimate of travel delays using a congestion model would provide more accurate time delay estimates. This would have bearing on our overall findings.
Projected Vehicle Traffic on Rainier through 2034Finally, and importantly, the projected growth of vehicle traffic on Rainier has a massive impact on the magnitude of our findings. Seattle’s population is projected to grow at a high rate over coming decades. Increased population will likely mean higher demand for existing roadways. However, travel demand is notoriously dif-ficult to predict, with many factors—i.e. gas prices and availability of transit—in-fluencing the number of cars on the road.
As mentioned previously, lacking access to a truly accurate travel demand model, we use a base case growth of two percent. This percentage is loosely based on a high-end five-percent growth rate used for a similar four-lane road undergoing a road diet in New Jersey. In a benefit-cost analysis of the project, the authors note that five percent is “robust” and likely much larger than any growth in usage that would actually occur (Noland, 2014). We in fact believe that even two percent growth in traffic is likely to be inflated.
Days in a YearThis analysis made the weighty assumption that travel delays will only occur on weekdays, when Rainier Avenue and MLK will experience high volumes of morn-ing and evening commuters. However, future analysis should assess whether delays will occur on weekends. This too will have bearings on the results of the analysis.
ConclusionA road diet on Rainier Avenue provides positive net benefits of $70,878,330 over the course of 20 years. Massive benefits result from reduced injuries ($102,130,810), while travel delays only result in costs of $31,252,479. In addi-tion, results from this BCA synchronize with growing political and citizen desire for change on the road. We recommend that the City of Seattle proceed to convert Rainier Avenue from a 4-lane undivided road, to a 3-lane road with two total travel lanes and one center-turn lane.
103VOL 5, SPRING 2015
DesmonD, HutcHinson
Author AffiliationsBrian Hutchinson is a seasoned project manager and researcher. Most recently, he worked as a Research Assistant at Literacy Bridge, where he analyzed health data from a survey the organization administered in Northwest Ghana. Brian holds a BA in English and Political Science from the University of Washington, and is currently pursuing his Master’s degree at the University’s Evans School of Policy and Gover-nance.
Andrew Desmond is an MPA candidate in the Evans School of Policy and Gov-ernance. He is primarily interested in issues concerning community and economic development, and how data can be used more effectively by local governments to achieve goals related to these topics.
104 THE EVANS SCHOOL REVIEW
Benefit-Cost AnAlysis of A RoAd diet foR seAttle’s RAinieR Avenue south
References
Burden, Dan, and Peter Lagerwey. “Road Diets: Fixing the Big Roads.” (1999): Rpt. Walkable Communities, 1-15. Web.
Harkey, D. L., Srinivasan, R., Baek, J., Council, F. M., Eccles, K., Lefler, N. Bonne-son, J. A. (2008). Accident modification factors for traffic engineering and ITS im-provements (pp. 21-22, Rep.). Washington, D.C.: Transportation Research Board. doi:http://onlinepubs.trb.org/onlinepubs/nchrp/nchrp_rpt_617.pdf
Litman, Todd. Transport Elasticities: Impacts on Travel Behavior. Federal Ministry for Economic Cooperation and Development, Germany. P. 22
Litman, Todd. Traffic Calming Benefits, Costs and Equity Impacts. (1999): Rpt. Victoria Transport Policy Institute.
Moving Beyond the Automobile. Perf. Dan Burden, Charles Gandy, & Mike Salla-berry. Street Films, 12 Apr. 2011. Web.
Noland, Robert, Dong Gao, Eric Gonzales, Charles Brown, and Glenn Patterson. Costs and Benefits of a Road Diet for Livingston Avenue in New Brunswick, New Jersey. Rep. 2014. Web.
Noland, R. B., Gao, D., Gonzales, E., Brown, C., & Patterson, G. (2014, March). Costs and Benefits of a Road Diet for Livingston Avenue in New Brunswick, New Jersey (Rep.). http://thecityofnewbrunswick.org/planninganddevelopment/wp-content/uploads/sites/8/2014/04/Livingston-Ave-Road-Diet-Web.pdf
Rutgers University. Costs and Benefits of a Road Diet for Livingston Avenue in New Brunswick.
Seattle Department of Transportation. 2012 Traffic Report. Print.
Seattle Department of Transportation. Traffic Flow and Data Maps – 2013. Ac-cessed at http://www.seattle.gov/transportation/tfdmaps.htm
Seattle Department of Transportation. Rainier Avenue South Road Safety Corridor. By Jim Curtin. 2014. Web.
105VOL 5, SPRING 2015
DesmonD, HutcHinson
Seattle Department of Transportation. Rainier Avenue South Road Safety Corridor. Presentation, 12 Nov, 2014. Accessed at http://www.seattle.gov/transportation/docs/RainierNovember2014_Draft%20acs.pdf
Seattle Met. Pedestrian Chronicles: Looking for a Longterm Solution on Rainier Ave. S. 13 Nov, 2014
Thomas, Libby. “Road Diet Conversions: A Synthesis of Research.” (2013): n. pag. Pedestrian and Bicycle Information Center. Web.
US Department of Transportation. Guidance on Treatment of the Economic Value of a Statistical L. 2014. Web.
US Department of Transportation. National Highway Transportation Safety Admin-istration. The Economic and Societal Impact Of Motor Vehicle Crashes, 2010. N.p., 2010. Web.
Welch, Thomas M. The Conversion of Four-Lane Undivided Urban Roadways to Three-Lane Facilities. Rep. N.p.: Iowa Department of Transportation. Web.
106 THE EVANS SCHOOL REVIEW
Washington state school District Financial reporting Quality
106 THE EVANS SCHOOL REVIEW
Quality of Financial Reporting of Washington State School Districts:
Results from a Population-Wide Analysis of Audited Financial Reports
John Kurpierz, MPA
john@instituteforbetter governance.com
Institute for Better Governance
Elijah Panci
pancieli@ u.washington.edu
University of Washington Evans School of Public Policy and Governance
MPA Candidate
AbstractWe examined the population of audited financial reports from all of Washington State’s 292 School Districts via the State Audi-tor’s Office. We found that 19 percent of school districts do not produce audited financial statements, and an additional 34 per-cent have problems ranging from relatively minor to severe. Of the remainder, 46 percent are generally compliant, yet only one percent of school districts produce disclosures that fully com-ply with generally accepted accounting standards (GAAP). This rate and quality of disclosures is significantly less and of lower quality than many other systems of financial reporting. The current reporting system appears to have significant flaws.
BackgroundAudited financial reports are an integral part of effective, ethical governance. Reports allow stakeholders to understand a govern-ment’s finances and the context in which those finances oper-ate. Most local governments in Washington State produce yearly reports in accordance with RCW 43.09.230 that are relatively accessible. School districts in Washington State appear to be an exception, with many districts having out-of-date, problematic, or nonexistent audited financial reports. Why the discrepancy? This research seeks to describe this behavior and begin to ex-plain why such behaviors are encountered in the current audit-ing environment. In sum, Washington State School Districts are difficult sources from which to gather information, and this raises questions whether this is an endemic problem. This indicates it is important to catalogue the extent of missing and incomplete au-dited financial reports in order to understand the Washington State school district environment.
107VOL 5, SPRING 2015
Kurpierz, panci
The Eras of Financial Reporting Transparency inPublic Systems
History reveals three broad stages of reporting public finances in America: an era of non-reporting, an era of simple reporting, and an era of accrual reporting. Each era exhibits a distinct level and format of reporting. These distinct levels and formats resemble the levels and formats at which Washington State School Districts are cur-rently reporting.
Reporting quality is influenced by communication distance (Kossinets et al 2008) and the bounded rationality of executives. Technology has strongly reduced the effect of communication distance (such as through the internet), and somewhat reduced the effect of executive bounded rationality (such as through improved management science). This is shown in the historical trend of increasingly detailed reporting that is communicated to leaders with greater expectations of interpreta-tion.
The Non-Reporting Era (1644-1934)For a large proportion of American history, public entities were not required to report any financial information at all. The important traits of this era were general nondisclosure, cash basis accounting and budgeting, and widespread corruption. These traits appear interrelated. Lack of disclosure to outside entities and lack of accrual-basis accounting and long-term budgeting make it significantly easier for individuals to take unethical actions. While there are examples of disclosure from this era, such as Baltimore and Ohio Railroad’s contractually-obligated disclosures, or E.S. Mills Public Accounts manual, these were not widely adopted (Previts 1998, Flesher 2003).
The lack of public oversight and general chaos not only meant that fraud was much easier to commit, but that even organizations working in good faith could severely harm themselves through poor planning or lack of awareness. Such uncertainty and exposure to liability were among the reasons various good governance groups such as the National Municipal League and the Citizens Union formed in the late 1800s (Roybark 2012). These organizations sought to standardize and expand public accounting and reporting. However, it would be another 30 years, marked by aggressive municipal growth (and the pitfalls such growth encountered when not properly reported) for public financial reporting to enter into the next, more thorough era (Potts 1978).
108 THE EVANS SCHOOL REVIEW
Washington state school District Financial reporting Quality
The Simple Reporting Era (1934-1984)The Simple Reporting Era is characterized by basic disclosure, cash basis account-ing and budgeting, and growing standardization and professionalization. While significantly shorter than the preceding era, it was also more dynamic, involving numerous actors and rapidly-growing codifications in the search to produce a universal effective standard. For governments, the initial force was at the federal level, with the New Deal’s Securities Act of 1933 and Securities Exchange Act of 1934 creating new banking regulations and federal programs requiring accounting oversight (Coffman 1997). This increased disclosure and standardization of govern-ment finance spread in successive waves to governments, with ad-hoc groups such as the National Committee on Municipal Accounting (NCMA) and its successor, the National Committee on Governmental Accounting (NCGA) advocating for and setting the standards.
The net effect of these ad-hoc and volunteer groups was a significant improvement over the Non-Reporting Era. While not as thorough or intricate as later systems of disclosures would be, the core concepts of transparent funds presented according to generally accepted principles were widely disseminated by volunteer organiza-tions (Freeman 1978, Gauthier 2001). This dissemination spread faster in larger governmental entities, with the federal government changing fastest, and many smaller organizations (such as cities) lagging behind.
However, the growth in standardization rapidly swamped the small volunteer groups who had done the work of disseminating and lobbying for these concepts. Volunteer professional expertise was insufficient, and the original standards lob-bied for led to new, unexpected pitfalls, such as New York City’s 1975 near-default on its debt obligations (Blumenthal 2002). These new strains on the small budget of interested volunteers was too much, and in 1984 the Government Account-ing Standards Board (GASB) was created by the Financial Accounting Foundation, the American Institute of Certified Public Accountants, the Government Finance Officers Association, the National Association of State Auditors, Comptrollers and Treasurers, and the seven organizations representing state and local government officials (Roybark 2012).
The Accrual Reporting Era (1984-Present)The Accrual Era is characterized by disclosure and analysis, accrual-basis account-ing, and growing transparency. Management’s Disclosure and Analysis (MD&A) by the disclosing entity has been useful in providing context, increased transparency has aided in letting community members participate in decision making, and ac-
109VOL 5, SPRING 2015
Kurpierz, panci
crual basis accounting has helped provide a more long-term view on revenues and expenditures that can prevent situations such as 1975 New York. While the Era of Accrual Reporting has several problems of its own, it has generally been an im-provement over the preceding eras in terms of disclosure, efficiency, and account-ability.
The importance of describing these eras is to show how well they match the three core reporting approaches of government organizations and, from there, how well those three formats explain the Washington State School Districts. Approximately 19 percent of Washington State School Districts are still working within the Non-Reporting Era, and a further 46 percent are using a system designed for compli-ance with the dictates of the Simple Reporting Era. The remainder are currently in the Accrual Reporting Era but having various difficulties fully complying with all the pronouncements of Generally Accepted Accounting Principles (GAAP). Only three out of the nearly 300 districts (~one percent) have systems in place that match the quality found in Accrual Reporting Era governmental organizations elsewhere. This suggests that the scandals and dangers that befell organizations of the Non-Reporting and Simple Reporting Eras could strike these school districts in the future.
MethodThe entire population of Washington State School Districts served as the evidence for this study. In all, there are 292 districts. We used audited financial statements from the Washington State Auditor’s website as the source. We tracked basic vari-ables of financial reporting from each statement:
• HasauditedfinancialstatementonStateAuditor’swebsite• Issueyearoftheaudit• Lengthofauditperiod• Existenceofsignificantdeficiencies• Existenceofmaterialweaknesses• Existenceofabalancesheet - Value of the Total Liabilities and Fund Balance• Existenceofastatementofrevenues - Total revenues - Total expenditures• Whetherornotthedistrictreportedcapitalassets - Amount of long-term debt - Mention of debt rating
110 THE EVANS SCHOOL REVIEW
Washington state school District Financial reporting Quality
- If there is a debt rating, the company that provided the rating - If there is a debt rating, the rating itself
We coded the bold variables to provide a score for each school district based on the completeness of their reporting. Each of these variables received an “index” score (Ingram 1984, Cheng 1992, Smith 2004), with the variables chosen to meet mini-mum GAAP reporting standards. For example, in the population we found that the length of the audit period spanned one to three years, which we assigned the fol-lowing scores: one year = one; two years = zero; and three years = negative one.1
We measured each of the listed variables as an initial sense-making activity. This was combined with a literature review of other studies that focused on correlations between certain indexed traits and financial well-being (Ingram 1984, Banker et al 1989, Cheng 1992, Smith 2004, Carslaw et al 2007). From this review, we deter-mined that the traits marked in bold were of recurring use in creating meaningful indices. This included existence of basic GAAP-minimum information, such as the existence of balance sheets and statements of revenue, as well as generally-accepted causes for concern, such as audit findings of material weaknesses in the past.
We then judged each variable as either a positive step, neutral step, or a nega-tive step based on its predicted effect on financial well-being. For example, the existence of significant deficiencies is a negative fact, while a lack of significant deficiencies is a neutral step. Reporting a capital asset is “above and beyond” what is required by the State Auditor’s Office, so it is considered a positive step. Positive steps were assigned a plus one, neutral steps a zero, and negative steps a negative one. In theory this creates a ten-point scale of negative four to positive six, but cer-tain traits (such as the lack of a financial statement altogether) preclude the more negative scores. As a result, we end with a scale of zero to six.
After coding the variables we added the indexed scores together to provide each district with an overall score regarding reporting completeness, which we call their Minimum Quality of Reporting Index (M-QRI) score.
1 There are two conflicting views on longer audit cycles. Models around timeliness of audited information argue that longer cycles lead to less timely information, which is correlated with higher risk classification (Carslaw et al 2007). However, the State Auditor’s Office (SAO) of Washington State only allows school districts with low risk to have longer audit cycles. Because of this, the data around reporting cycles may be noisier than some of the other data points.
111VOL 5, SPRING 2015
Kurpierz, panci
Table 1: Quality of Reporting Index – Scales
VariableIndex Scoring Scale
-1 0 1Has Financial Statement(N=292)
No(52)
Yes(240)
Most Recent Issue Year(N=240)
<2013(31)
2013(17)
2014(193)
Audit Period(N=240)
>2-Year Cycle(20)
2-Year Cycle(13)
1-Year Cycle(208)
Significant Deficiencies(N=240)
Yes(18)
No(222)
Material Weaknesses(N=240)
Yes(19)
No(221)
Has Balance Sheet(N=240)
No(54)
Yes(186)
Has Statement of Revenue(N=240)
No(0)
Yes(240)
Reported Capital Assets(N=240)
No(234)
Yes(6)
ResultsThe M-QRI scores ranged between zero and six, with six being the highest pos-sible. The data shows that the majority of the data is at either end of the spectrum with relatively few districts scoring in the middle. The majority of districts that attempted reporting succeeded, while a seemingly non-trivial number made no effective attempt.2
2 Discussion with the Washington State Auditor’s Office indicates that many districts that do not produce audited financial statements instead receive an “Accountability Audit”. An Accountability Au-dit “evaluates whether there is reasonable assurance the state agency adhered to applicable federal or state laws, regulations and its own policies and procedures” (SAO 2015). Accountability Audits are separate and distinct from an audited financial statement.
112 THE EVANS SCHOOL REVIEW
Washington state school District Financial reporting Quality
Table 2: Distribution of M-QRI Scores
Of the 56 districts that received a score of zero, 52 (17 percent of the population) did not report in the last three or more years. Further research is necessary to determine if this is outside of normal when compared to other states, but at first glance, more than one-fifth of districts not reporting in the past three years seems alarmingly high.
Just 18 percent of districts receive a score of one, two, or three. An additional 16 percent received a score of four.
With 46 percent of districts receiving a score of five, most districts were close to but failing to achieve minimum compliance.
Only three districts in the state received the top score of six. This is largely due to the fact that just six districts in the state reported capital assets. There are particu-lar difficulties reporting capital assets for a school district, as shown by the GASB 34 debate on capital assets and the reporting of capital assets.
Discussion and AnalysisApproximately six percent of school districts were found to have “significant deficiencies”. Significant deficiencies indicate a lack of proper internal controls in recording and reporting financial information. This lack of proper reporting behav-
Washington School Districts M-QRI Scores(Minimum Quality Reporting Index)
160
140
120
100
80
60
40
20
0
Cou
nt
0 1 2 3 4 5 6Score
113VOL 5, SPRING 2015
Kurpierz, panci
iors can range in meaning from completely harmless to a sign of severe mismanage-ment. As a result, it is considered a warning sign but does not necessarily indicate that a problem will result. This is comparable to a doctor asking a patient if they are eating five to nine servings of fruit and vegetables a day and the patient replying that they are unsure. In both cases, uncertainty about compliance is worrisome but not actual proof of noncompliance.
Significant Deficiency Example: An organization processes many inter-organization transactions each month. Individual inter-organization transac-tions are not material and often just transfers between units to finance normal operations. There is a formal management policy in place to reconcile inter-organization accounts and confirm balances between business units, but there is no system in place to ensure enactment of said policy. Management conducts monthly investigations of a few large-dollar inter-organization account differ-ences and prepares a detailed monthly variance analysis of operating expenses to assess reasonableness.
This is a significant deficiency because the magnitude of a misstatement on a financial statement resulting from this deficiency would reasonably be ex-pected to be more than inconsequential, but less than material. This is because individual inter-organization transactions are not material and the monthly investigation should catch any material misstatement. However, the company must design controls to catch smaller misstatements as well, not just material misstatements.
Similarly, seven percent of school districts were found to have “material weakness-es”. Material weaknesses indicate that the auditor identified specific places where internal controls in recording or reporting financial information were not followed or are otherwise ineffective. This is significantly more problematic than significant deficiencies, as it turns a warning sign into proof of a problem. A material weakness is not that a door was left unlocked; it is that the door was opened after it had been left unlocked. Building upon the earlier health analogy, this is the doctor checking the meal journal of a patient and seeing no fruits and vegetables eaten for signifi-cant stretches.
114 THE EVANS SCHOOL REVIEW
Washington state school District Financial reporting Quality
Material Weakness Example: An organization processes many intercom-pany transactions each month. In this scenario individual inter-organization transactions are frequently material and relate to a wide range of transactions. There is a formal management policy in place to reconcile intercompany ac-counts and confirm balances between business units, but no process to ensure that these procedures are performed on a consistent basis. Therefore, recon-ciliation between accounts is not timely and differences in inter-organization accounts are frequent and significant.
This is a material weakness because misstatements resulting from this deficien-cy would reasonably be expected to be material, as transactions are frequently material transactions relating to a wider range of activities. Furthermore, the likelihood of these misstatements are more than remote because compensating controls are not properly designed or not operating effectively. The magnitude and likelihood of misstatements resulting from this internal control meet the definition of a material weakness.
There is a relationship between significant deficiencies and material weaknesses. They are functionally the same problem in different stages of its life cycle: De-ficiencies are potential control failures that will turn into material weaknesses when the potential failure becomes actual failure. However, this means that the population overlap of organizations having both is relatively rare. For most of the observed cases, the six percent deficiencies and the seven percent weaknesses were different school districts. This means approximately 13 percent of Washington State School Districts have internal control problems that are of concern to State Audi-tors (Rice & Weber 2012).
Table 3: Population Distribution of Scores
Score NumberProportion of
PopulationConclusion
0 56 19% Fails1 12 4%
Needs Improvement
2 22 8%3 17 6%4 48 16% Considerable
Progress5 134 46%6 3 1% Complies
Another issue noted among the population is the high rate of late audit reports
115VOL 5, SPRING 2015
Kurpierz, panci
taking a year or more (~360 days). This compares unfavorably to a mean delay of ~180 days (Carslaw et a 2007), to the municipal mean delay of ~120 days (Mc-Clelland & Giroux 2000), and to Texan Independent School Districts delay of ~80 days (Deis & Giroux 1992). For some districts, the most recent audited financial statement is from 2008. This is related to two separate traits. First, some districts are on two or three-year audit cycles. This means that some school districts are “up to date” while their most recent audit report is from 2011. At the same time, some districts simply have audits that are late (Dwyer and Wilson 1989). Only 66 per-cent of school districts had an audited financial report from 2014. This is equivalent to having medical records a year or more out of date when seeking diagnosis.3
Nearly 20 percent of school districts are not filing audited financial reports. This is in direct contravention of healthy financial disclosure practices. Districts that are not producing audited financial reports are an informational black hole: We can make no meaningful judgment on their state of being because we cannot directly observe the state of their being. In the medical analogy, these are patients who are absent. We are unsure if they are dying, injured, asymptomatic, or even hale and hearty; without a GAAP-compliant report it is impossible to effectively discern their condition.
Roughly a third (34 percent) of school districts are struggling, scoring less than five but more than zero. These indicate school districts that are having difficulty complying with financial disclosure regulations but are making attempts to do so. These range from schools doing a severely problematic job (score of one or two; 12 percent), a moderate job (score of three; six percent), or are just short of general compliance (score of four; 16 percent). The relatively low numbers indicate an overall bimodal distribution for the population, with most districts either almost achieving compliance, or generally not attempting compliance at all. The former of these two types of districts may have a problem, but it is a solvable one: Providing further accounting capacity through training, funding, or other forms of support will likely improve their outcome.
A plurality of school districts (46 percent) are “nearly compliant”, scoring a five out of six on our M-QRI scale. This indicates nearly sufficient but not GAAP-com-pliant reporting. Most school districts are meeting the minimum reporting quality
3 As noted before, many of the reports (33 out of 48) that were not issued in the past year are due to schools on multiyear audit cycles performed with the permission of the State Auditor. However, Carslaw et al. (2007) show that multiyear cycles are correlated with higher risk classifications for school districts. Additionally, this does not account for the 15 districts that did not have permission to have a longer audit cycle.
116 THE EVANS SCHOOL REVIEW
Washington state school District Financial reporting Quality
required by state law and going no further. This is adequate to satisfy Washington State, but compares unfavorably to the higher standard private organizations and many governments reach, such as form 990s (nonprofit tax returns) or compre-hensive annual financial reports (CAFRs) attain. This compares to the health of an average American: It could be better, but their current state of health is a situation of least concern compared to the more serious problems within the population.
Only one percent of the population of school districts met the minimum standard of CAFR-level disclosures by scoring a six out of six on the M-QRI. Compared to GAAP-compliant audited financial reports overall, the one percent are performing well. By comparison with the other school districts, they are exceptional.
ConclusionThe population analysis shows endemic poor and opaque financial reporting practices. Approximately one in three school districts is experiencing some severe problem, whether it be significant deficiencies (six percent), material weaknesses (seven percent), or failure to report (19 percent). When combined with schools that are struggling to meet current reporting standards (34 percent), roughly half of all Washington State School Districts are having serious reporting problems.
When 19 percent of a population is failing to comply with the most basic recom-mendations of healthy financial disclosure, it does not follow that the disclosure should be made mandatory, but it does indicate that some social good of the rec-ommendation is not being created. This failure to comply with reporting standards indicates a problem somewhere within the reporting process. Additionally, this level of lacking audited financial reports is not seen among publically-traded se-curities, nonprofit organizations, or local or federal governments, all of which are much better at disclosure.
However, different forms of reporting failure require different policy interven-tions. For example, a school district scoring four on the index scale may only need increased technical capacity in the form of training or grants. A district that has ma-terial weaknesses perhaps needs a thorough overhaul of internal control protocols, either implemented internally or imposed from the outside, to bring its reporting into compliance. A non-reporting district, by contrast, needs some form of policy intervention to induce it to begin reporting; whether that induction should involve positive or negative reinforcement is beyond the scope of this study.
Disclosures can be costly initially, requiring additional staff training, oversight, and
117VOL 5, SPRING 2015
Kurpierz, panci
technology. However, this compliance does often pay for itself over time. Baber and Gore (2008) find that municipalities who maintain GAAP-compliant disclo-sure standards have greater access to debt at fourteen to twenty-five basis points cheaper than noncompliant entities, and cheaper debt cost and contracting costs upon complying with GAAP. Additionally, Saito and McIntosh (2007) find that more stringent disclosure requirements reduced the nonproductive use of taxes, freeing funds to be used more effectively by Georgia school districts.
This paper suggests new avenues of fruitful research into the motivations, incen-tives, and difficulties school districts encounter in producing audited financial re-ports. We have found there is significant noncompliance with GAAP and failure by many entities to produce audited financial reports. The prevalence of noncompli-ance points to the possibility of structural flaws. Such flaws may be in the structure of reporting and compliance, in the technical accounting capacity of the actors within the system, or other possibilities such as location or school district size. These flaws may also portend fraud or corruption being discovered in these dis-tricts in the future. This research identifies the extent and nature of this noncompli-ance. Having done so, further avenues of research have been opened to describe, explain, and understand the sources and results of this noncompliance.
AcknowledgementsWe would like to extend our deepest thanks to Dr. Kenneth A. Smith for providing insight, experience, and support in creating this research paper.
Author Affiliations
John Kurpierz is a social science generalist who fell in love with government accounting, earning him the nickname “Swiss Army Knife”. He earned his MPA from the Evans School of Public Affairs in 2013 with specializations in accounting/finance and local government. John currently is Research Associate for IBG, and has had his research presented at the conferences of Public Administration Review and the American Accounting Association.
Elijah Panci received his BA in Political Theory and Constitutional Democracy from James Madison College of Political Science at Michigan State University, with a specialization in Science, Technology, the Environment, and Public Policy. He is currently an MPA candidate at the Evans School of Public Policy and Governance at the University of Washington, specializing in public finance.
118 THE EVANS SCHOOL REVIEW
Washington state school District Financial reporting Quality
References
Baber, William R., and Gore, Angela K., “Consequences of GAAP Disclosure Regulation: Evidence from Municipal Debt Issues” The Accounting Review Vol. 83, No. 3. 2008
Banker, Rajiv D., Bunch, Beverly S., and Strauss, Robert P., “Factors Influencing School District Financial Reporting Practices” Research in Governmental and Non-profit Accounting, Vol. 5, pages 27-56. 1989
Blumethal, Ralph “Recalling New York at the Brink of Bankruptcy” New York Times, December 5, 2002
Carslaw, Charles; Mason, Richard; and Mills, John R., “Audit Timeliness of School District Audits” Journal of Public Budgeting, Accounting & Financial Management Vol. 19, No. 3, Fall 2007
Cheng, Rita H., “An Empirical Analysis of Theories on Factors Influencing State Government Accounting Disclosure” Journal of Accounting and Public Policy, 11, 1-42 (1992)
Coffman, Edward N., Tondkar, Rasoul H., & Previts, Gary J., Historical Perspec-tives of Selected Financial Accounting Topics (2nd ed.), McGraw-Hill Companies, Inc., 1997.
Deis, Donald R. Jr., and Giroux, Gary “Determinants of Audit Quality in the Public Sector” The Accounting Review, Vol. 67, No. 3 (Jul.), pp. 462-479 1992
Dwyer, Peggy D., and Wilson, Earl R., “An empirical investigation of factors affect-ing the timeliness of reporting by municipalities” Journal of Accounting and Public Policy Vol. 8, Issue 1, Spring 1989
Flesher, D. L., W. D. Samson and G. J. Previts, “The Origins of Value-for-Money Auditing: The Baltimore and Ohio Railroad, 1827–1830”, Managerial Auditing Journal, Vol. 18, No. 5, 2003.
Freeman, Robert J., and Nuttall, Donald M., “The GAAFR Restatement Prin-ciples: An Executive Summary”, Governmental Finance, Vol. 7, No. 2, 1978.
119VOL 5, SPRING 2015
Kurpierz, panci
Governmental Accounting Standards Board Statement No. 34, Basic Financial Statements—and Management’s Discussion and Analysis—for State and Local Governments 1999
Gauthier, Stephen J., “Then and Now: 65 Years of the Blue Book”, Government Finance Review, Vol. 17, No. 3, 2001.
Ingram, Robert W., “Economic Incentives and the Choice of State Government Ac-counting Practices” Journal of Accounting Research, Vol. 22, No. 1 (Spring, 1984), pp. 126-144
Kossinets, Gueorgi; Kleinberg, Jon, and Watts, Duncan “The Structure of Informa-tion Pathways in a Social Communication Network” Proceedings of the 14th ACM SIGKDD international conference on Knowledge discovery and data mining 2008
McClelland, Andrew J., and Giroux, Gary “An Empirical Analysis of Auditor Report Timing by Large Municipalities” Journal of Accounting and Public Policy 19(2000) 263-281
Potts, James H., “The Evolution of Municipal Accounting in the United States: 1900-1935” The Business History Review Vol. 52, No. 4, Winter 1978
Previts, Gary J., and Merino, Barbara D, A History of Accountancy in the United States: The Cultural Significance of Accounting Ohio State University Press 1998
Rice, Sarah C., and Weber, David P. “How Effective Is Internal Control Reporting under SOX 404? Determinants of the (Non-)Disclosure of Existing Material Weak-nesses” Journal of Accounting Research, 50: 811–843 (2012)
Roybark, Helen M., Coffman, Edward N., & Previts, Gary J. “The First Quarter Century of the GASB (1984–2009): A Perspective on Standard Setting (Part One)” ABACUS, Vol. 48, No. 1, 2012
Saito, Yoshie, and McIntosh, Christopher S., “The Value Added by Auditing and the Hidden Costs of Regulation: Public School Operation” Submission to AAA 2007 Management Accounting Section Meeting
120 THE EVANS SCHOOL REVIEW
Washington state school District Financial reporting Quality
Securities and Exchange Commission. “Appendix D: Examples of Significant Defi-ciencies” accessed from https://www.sec.gov/rules/pcaob/34-49544-appendixd.pdf accessed 4/10/2015
Smith, Kenneth A., “Voluntarily Reporting Performance Measures to the Public: A Test of Accounting Reports from U.S. Cities” International Public Management Journal, 7(1), pages 19-48, 2004.
Washington State Auditor’s Office. “State Government: Accountability Audits” accessed from http://www.sao.wa.gov/state/Pages/StateAccountability.aspx 2/27/2015
121VOL 5, SPRING 2015
Calkins, lieberman
121VOL 5, SPRING 2015
The Benefits and Costs of an Earthquake Early Warning System in Washington State
Eli Lieberman
elil@ u.washington.edu
University of Washington Evans School of Public Policy and Governance
MPA Candidate
Andrew Calkins
calkinsl@ u.washington.edu
University of Washington Evans School of Public Policy and Governance
MPA Candidate
IntroductionWashington State was reminded of its precarious geology early in the morning of February 28, 2001, when a magnitude 6.8 earth-quake struck just north of the state’s capitol. Although the ensuing damage was relatively small, Washington State is home to numer-ous fault zones that pose a significant risk to human life including the Cascadia Subduction Zone and the Seattle Fault. The Cascadia Subduction Zone could produce a megathrust earthquake, which are among the planet’s most powerful earthquakes, capable of rup-turing in excess of magnitude 9.0. While education and preparato-ry drills serve as a potential way to reduce the casualties associated with natural hazards, their effectiveness is enhanced with proper warning of oncoming hazards (Hoshiba, 2014). While the United States has warning systems in place for hur-ricanes and tornados, the country’s infrastructure for earthquake early warning vastly lags behind several countries, most notably, Japan. Since 2007, Japan has been successfully operating an Earth-quake Early Warning System (EEWS) that disseminates informa-tion about the size and location of incoming earthquakes to the public at large. The Japanese system has been tested numerous times and has been credited with saving many lives and millions of dollars in infrastructure (Birmingham, 2011). EEWS are ca-pable of issuing seconds up to a minute of warning to individuals through a variety of media including: television, cellular network push notifications, internet, emergency broadcasting systems, radio, and sirens (ShakeAlert, 2014). Even though the warning’s timeframe is relatively short, people are able to undertake possibly lifesaving action by either exiting buildings or by seeking cover under solid objects (Hoshiba, 2014). However, as previous studies have noted, EEWS require significant public investment, which warrants investigation into whether the benefits of the system outweigh the costs. This paper will present a benefit-cost analysis (BCA) for the implementation of an EEWS
122 THE EVANS SCHOOL REVIEW
Benefits and Costs of an earthquake early Warning system in Washington state
in Washington State, specifically the Shake Alert system currently being proposed for the West Coast. If the benefits of such a system are found to outweigh the costs, then a strong argument exists for the legislature of Washington State and/or the federal government to approve public funding for the construction and ongoing maintenance of an EEWS.
How Earthquake Early Warning Systems WorkEEWS systems work by exploiting the nature in which earthquakes produce seismic movement. Once a fault line ruptures, two types of seismic waves are emitted from the epicenter (origin point)—Secondary Waves and Primary Waves. Primary Waves or P-Waves move faster than Secondary Waves or S-Waves, and are not associated with the damaging movement observed during an earthquake (Hoshiba, 2014). By placing sensors throughout a region prone to earthquakes, computers are able to detect the quicker moving P-Waves and analyze the location and strength of the earthquake before the damaging S-Waves arrive. These systems are not perfect; areas close to the epicenter will receive little warning, as they are located in the “blind zone,” where the P-Waves and S-Waves arrive simultaneously (Hoshiba, 2014).
Standing & ParametersEEWS systems can bring substantial benefits to both human life and physical infra-structure. We choose to limit our BCA to human casualties because we believe the inherent value of an EEWS is its ability to mitigate the loss of human life. Physi-cal infrastructure is of secondary importance. Therefore, standing can be defined as anyone physically in Washington State during an earthquake. If our BCA can demonstrate positive net present value (NPV) by solely taking into account human life, then adding in the benefits associated with preventing damage to physical in-frastructure will most likely push the NPV further into the black. Considerable in-terests exists from the business community and the utility industry, suggesting that an EEWS may have significant benefits for private businesses and public agencies. For instance, the Hanford Site has expressed interest in incorporating a Washing-ton State EEWS into internal operations. If the NPV is close to zero, the results of our BCA will incentivize further research into the physical benefits an EEWS can provide Washington State.
Although Washington State is home to numerous fault lines, we choose to limit our BCA to the five earthquake scenarios deemed by the Washington State Department of Natural Resources (DNR) to most likely affect those with standing: the Cascadia Subduction Zone, Seattle Fault, Tacoma Fault, Nisqually Fault, and the Olympia
123VOL 5, SPRING 2015
Calkins, lieberman
Fault. Analysis of earthquake scenarios beyond these five will not produce enough benefits to substantially change the NPV. The scope of our analysis also excludes the damages associated with tsunamis from offshore earthquakes. The United States currently has a fully functional tsunami warning system operated by the National Oceanic and Atmospheric Association (NOAA). This system is separate from an EEWS system and there is no reason to believe the implementation of an EEWS will save any lives above and beyond the NOAA system. Simulations from the Cas-cadia Subduction Zone indicate it takes approximately 20-30 minutes for a tsunami to reach the coast of Washington State (NOAA, 2014). This time frame is of orders of magnitude greater than an EEWS and therefore requires a completely different set of warning systems and reactionary protocol.
The benefits of the EEWS will be measured by its impact on human causalities. The reduction in casualties will be monetized on a four-point scale using methodology developed by the Federal Emergency Management Agency (FEMA) for conducting BCA of disaster mitigation.
Model For Calculating BenefitsWillingness to Pay vs. Costs Avoided
The benefits of an EEWS can be calculated in one of two ways—Willingness to Pay (WTP) or Costs Avoided (CA). Under the WTP scenario, the aggregated amount that a society is willing to pay for a system determines the system’s total value (Klafft, 2011). For example, if the WTP for an EEWS in Washington State is $10 per person, then the net benefits of the EEWS is $10 times the population of Wash-ington State, or $10 x 6 Million People = $60,000,000. WTP is determined using a non-market valuation technique know as Contingent Valuation (CV). While CV is frequently used to ascertain the value of public goods, there are numerous reasons why CV is not appropriate for EEWS. Firstly, respondents to an EEWS survey are highly susceptible to a judgment bias. CV respondents can vastly overestimate or underestimate the probability of an earthquake depending on their knowledge of risk and/or previous exposure to earthquake hazards (Asgary, 2007). Either of these judgmental errors can lead respondents to state their WTP as either higher or lower than their true WTP. For these reasons, a BCA of an EEWS will prove more accurate by assuming a paternalistic frame that takes into account the true scientific assessment of earthquake probability. CA accomplishes this by using statistical analysis of cost estimates interpolated from casualty approximations scaled proportionally to the value of a statistical life (VSL) (Klafft, 2011). Because these values represent the costs prevented by deploy-
124 THE EVANS SCHOOL REVIEW
Benefits and Costs of an earthquake early Warning system in Washington state
ing an EEWS compared to the same earthquake scenario without an EEWS, they can be thought of as the benefits of an EEWS. These benefits can then be weighed against the construction, maintenance, and operation costs to determine the NPV of implementation. Our analysis uses the CA method to determine the NPV because it allows us to account for a range of measures and probabilities based on established research.
Our ModelBuilding off the model developed by Meissen and Voisard, we employ an original technique to estimate CA by using the following parameters: effectiveness (ability to take action), uptake, distance, and probability (Klafft, 2011). Later sections of the paper will delve into these parameters, but in essence, effectiveness refers to the ability for an individual to save oneself from harm. Uptake refers to the salience of the system amongst people with standing, and distance accounts for a popula-tions proximity to the epicenter of the earthquake. Finally, probability represents the probability of the five earthquake scenarios over a 50-year time horizon derived from United States Geological Survey (USGS) estimates (Given, 2014). Therefore, the benefits of an EEWS in Washington State can be represented by Equation 1 as follows:
Where, Pe represents the probability of a given earthquake and AVE represents a 50 year discounted average of the value of casualties avoided (effectiveness * dis-tance * uptake) for that same earthquake. For our base case estimates we discount the above function using a 7% discount rate as per the recommendation of the Of-fice of Management and Budget (OMB). As Hallagatte notes, the OMB’s number is apt because “the discount rate can be calculated as the opportunity cost of capital, especially when strong capital reallocation is involved”(Hallegatte, 2006). As previ-ously mentioned, one of the big challenges facing the implementation of an EEWS is the large amount of public funds necessary for both construction and operation.
Benefits: Quantifying The Casualties AvoidedEstimates of Human Casualties
In order to calculate the benefits of the EEWS, we first establish a baseline scenario that estimates the casualties incurred from the five earthquakes without an EEWS. The model then estimates to what degree an EEWS would avoid these casual-ties and their associated costs. The casualty estimates were obtained from reports developed by the DNR using the Hazus Multi-Hazard (Hazus) system. The Hazus
125VOL 5, SPRING 2015
Calkins, lieberman
system is a geographic information systems-based program developed by the Fed-eral Emergency Management Agency (FEMA) for use by public agencies in predict-ing the impacts of natural hazards, including earthquakes (FEMA, 2015). DNR has used the system to run reports on various earthquake scenarios, including the five used in this analysis.
Hazus reports provide casualty estimates for four different injury types (levels 1-4): self-treatment, treat and release, hospitalization, and fatality. For three of the five earthquakes we examine, the Hazus system also produces county level casualty estimates, which are leveraged in our EEWS effectiveness calculations (see discus-sion of distance factors, below). Additionally, the Hazus output provides casualty estimates for different times of day. Earthquakes that occur during the middle of the day, for instance, have greater casualties than those occurring at night and this is taken into account in our analysis.
Monetizing CasualtiesOur analysis monetizes the Hazus casualty estimates before estimating the value saved from the potential effects of the EEWS. To do this we use monetary values provided by FEMA for purposes of conducting a BCA (FEMA, 2009). Estimates for costs avoided from a particular injury level inflated to 2014 dollars are as follows:
• Level 1 (Self-Treatment, minor injury): $13,280.67• Level 2 (Treat and Release, non-life threatening): $99,605.06• Level 3 (Hospitalization, life threatening): $1,204,114.46• Level 4 (Value of a statistical life): $6,418,992.53
Per FEMA, the fatal injury figure itself is based on the Federal Aviation Administra-tion’s guidance on the value of a statistical life (FEMA, 2014). The estimates for non-fatal injuries are also scaled to estimates of the value of a statistical life, in oth-er words, a person’s willingness to pay for a reduction in risk (FAA, 2008). Since it would be nearly impossible to measure WTP for all possible injuries, the above groupings and their values are determined by a group of physicians who “relate injuries in each [category] to the loss of quality and quantity of life involved” (FAA, 2008). These estimates are supplemented by estimates of the loss of earnings and productivity. The above cost estimates provided by FEMA are especially useful for our analysis as they were calculated by agencies to correspond to the Hazus injury levels and groupings.
Since the EEWS is analyzed using a 50-year time horizon, we can reasonably expect
126 THE EVANS SCHOOL REVIEW
Benefits and Costs of an earthquake early Warning system in Washington state
that it will benefit more people in the future, as the five major earthquakes will themselves result in higher casualty levels due to population growth. Therefore, our analysis of monetized casualties accounts for population growth in Washington State based on a historical rate of 1% per year (WSDOT, 2014).
Estimating the Effectiveness of an EEWSThe most central component of this project involves the estimation of the EEWS’ effectiveness at reducing the number of casualties resulting from various earth-quake scenarios. It is also the most sensitive portion of the analysis. Complicating any analysis of the EEWS is the fact that the behavior of respondents is largely unobserved. Our analysis of effectiveness is concerned with the effect of the system on those casualties produced in the Hazus estimates. The EEWS is predicted to have no negative effect on people who would not be injured without the system. We consider three key variables, distance, uptake of system, and ability to take action.
Distance: Whether an EEWS is effective depends on how much time it provides respondents before shaking occurs. Since shaking from an earthquake takes longer to travel to areas farther away from the epicenter, counties hundreds of miles away will receive a longer warning time and will have more time to react in a positive way to protect themselves. Since the Hazus casualty estimates provide county-level estimates for some earthquakes, we are able to factor in distance to account for different effectiveness levels in counties near and far away from an epicenter. An EEWS can provide anywhere from a few seconds to up to a minute of warning.
We take into account distance by multiplying effectiveness and uptake by factors of 1(for counties farthest away), 0.75 (for counties moderately distanced from epicenter), and 0.1 for counties very near to the epicenter. The factor of 1 repre-sents the EEWS acting as intended, providing people who receive the alert with enough time to act. Conversely, counties near the epicenter center are likely to be very near the blind zone and will only receive a maximum of a few seconds warn-ing, or no warning at all. We base our near epicenter variable on Fujinawa’s 2009 projections (Fujinawa, 2013; Ohara, 2011). stating that 2 seconds of warning could reduce fatalities by 25%. However, since several of the earthquakes analyzed in our BCA include counties in potential blind zones, we use a more conservative distance weight of 0.1 to account for this. Additionally, lead times that exceed 5 seconds but are less than 20 seconds result in significantly larger casualty reductions. Therefore, we use a weight closer to 1, than to .1 for our moderately distanced counties, as 10 seconds or more is enough time many people to take a positive action (Fujinawa, 2013; Ohara, 2011).
127VOL 5, SPRING 2015
Calkins, lieberman
Figure 1: Shake Alert warning time depending on distance from epicenter (ShakeAlert, 2014)
Uptake: Not everyone will receive the EEWS alert due to low-awareness, lack of coverage, or because there will be some amount of people who will not be near devices capable of receiving the alert. Our analysis assumes an uptake variable of 0.75, meaning that 75% of casualties will receive the EEWS alert in some form. Just one distribution stream for the EEWS, cell phone push notifications, could un-der a best-case scenario potentially reach upwards of 90% of the population (Lee, 2013).
Ability to take effective action: Perhaps more important than whether one receives an EEWS alert in time to brace for shaking is the ability and willingness of the re-spondent to take a positive action to protect themselves. The literature with regard to EEWS effectiveness in this area is limited to surveys conducted in Japan after seismic events, namely the 2011 Tohoku earthquake. A survey conducted by the Japanese Meteorological Agency found that 61% of survey respondents were able to and took some kind of action after receiving an EEWS alert to improve their safety before the Tohoku earthquake (Fujinawa, 2013). Other respondents either chose not to take action or attempted to act but were not successful (Fujinawa, 2013). In some areas, the level of action taken was as high as 74%, illustrating that there is considerable room to increase this variable over time (Hoshiba, 2014). We assume a 0.6 or 60% effect for the ability of a person to take action based on these
Warning Time Depends on Distance to Quake(Assumes 10 seconds to issue warning)70
War
ning
Tim
e (s
econ
ds)
60
50
40
30
20
10
00 20 40 60 80 100 120 140 160
Distance to Earthquake Epicenter (miles)
128 THE EVANS SCHOOL REVIEW
Benefits and Costs of an earthquake early Warning system in Washington state
survey responses.
Effectiveness Indicators: By multiplying the distance, uptake, and effect variables discussed above by one another, we are able to calculate different levels of total ef-fectiveness for counties far from epicenter, moderately distanced, and near epicen-ter. This produces overall effectiveness levels that are likely to be conservative, as shown in Table 1.
Table 1: Effectiveness Estimates of EEWSUptake Ability to Take
Near Epicenter 0.75 0.6 0.1 0.045 Even in the best-case scenario, the EEWS only lowers casualties by 45%. Since this indicator is used for counties farthest away from the epicenter, the benefits are much less as these counties experience fewer casualties to begin with. Of note is that this best-case reduction of 45% is still less than the 80% to 90% reduction in serious injuries and fatalities estimated by Fujinawa et al. (2009). In the worst case scenario, counties near the epicenter avoid only 5% of casualties. We expect that the EEWS would not be totally useless in areas near the epicenter, even with only a few seconds of warning.
Determining Benefits For Individual Earthquakes The value of the EEWS for each individual earthquake is found by multiplying the effectiveness indicators by the monetized number of casualties in each county. These are then summed to produce the expected benefits of a single earthquake scenario, which are discounted for each of the 50 years, then averaged. This pro-vides the value of AVE, in Equation 1, above. Multiplying the AVE for each earth-quake by its associated probability of occurrence provides its NPV. These benefits can then be weighed against the cost of the EEWS.
129VOL 5, SPRING 2015
Calkins, lieberman
Costs Of An EEWSImplementation and Operational Costs
The costs of an EEWS for Washington State are based on the USGS’ Shake Alert System. Currently, the Shake Alert is the only plan for an EEWS under develop-ment in the United States. The system costs are distributed between two West Coast regions—California and the Pacific Northwest. The two regions are associat-ed with different costs and can be implemented either jointly or separately (Given, 2014). Due to the standing of our analysis, the costs of the Shake Alert system will be limited to the estimates for the Pacific Northwest, which includes Washington State and Oregon. Earthquake fault zones, especially the Cascadia Subduction Zone, transcend state boundaries, and if the Shake Alert system is going to function properly, sensors must be placed throughout Oregon. If the standing of our analysis were expanded to include Oregon, one would expect to see a substantial boost in benefits with no additional costs. Interested parties can use this fact to advocate for federal or joint (Washington and Oregon) funding to lower the cost burden on any one entity. The construction cost of the Shake Alert system for the Pacific Northwest is $15.2 million, with annual maintenance and operational (AMO) costs of $4.7 million (Given, 2014). Due to the 50-year time horizon of earthquake probabilities, we discount the AMO costs over 50 years using a 7% social discount rate to achieve a NPV of $80 million. We assume the Shake Alert system will not need to be re-placed over this 50-year time horizon. This is a safe assumption as the AMO costs include line items to both replace and upgrade equipment.
False AlarmsAs noted by Klaffen and Meissen, the costs associated with false alarms needs to be included in the CA model when performing a BCA of an EEWS (Klaffen and Meis-sen, 2008). However, our model does not incorporate these costs for two reasons: (1) the majority of the costs associated with false alarms are due to the “restart” of physical infrastructure, and (2) the literature is mixed on the effect of false alarms on human causalities (Goltz, 2002). In regards to the former, our model is restrict-ed to human causalities and therefore does not include the benefits or costs linked to an EEWS and physical infrastructure.
Our model will need to incorporate false alarms if it is determined that they will alter the way people react to a warning during the event of an actual earthquake. This is due to the psychological effect known as “cry wolf ” syndrome (Klafft, 2011). Frequent false positives desensitize people to the point where they may
130 THE EVANS SCHOOL REVIEW
Benefits and Costs of an earthquake early Warning system in Washington state
ignore an actual warning. However, as FEMA notes “[cry wolf] syndrome is not a problem if [false alarms] are well explained and understood.” The data on false alarms in Japan actually speaks to this point. Due to a countrywide education cam-paign, the survey conducted by Japanese Meteorological Agency found that 83% of the survey respondents were aware of the possibility of false alarms (Fujinawa, 2013). Additionally, a secondary study in Mexico City found false positives actu-ally provided a “drill”-like scenario, which helped respondents prepare to act in the event of the real thing (Tierney, 2000). Due to the ambiguity in the literature, the expected value of false alarms on human causalities appears to be zero; thus, it is excluded from our CA model.
Quantitative Estimates Of The Costs And Benefits Of An EEWS
Base Case Results of the BCAOur model under the base assumptions described above indicates that an EEWS in Washington State would yield a positive net present value of $20 million. Our breakdown of the benefits and costs is summarized in Table 2. This output repre-sents the results our most plausible estimates of EEWS’ effectiveness and costs, earthquake probabilities, and expected damages.
Partial Sensitivity Analysis We conducted a sensitivity analysis to determine whether significant changes in our assumptions would change the NPV from positive to negative, or drastically increase the benefits. The highlighted assumptions below were varied one at a time, not simultaneously.
131VOL 5, SPRING 2015
Calkins, lieberman
Effectiveness: The most sensitive aspect of our model is the effectiveness indicator applied to various counties as a means of estimating casualty reductions. When we increase the ability to take action variable up to 0.8 from our baseline of 0.6, we see benefits rise substantially to $53 million. This produces a best-case effective-ness indicator for counties far away from an epicenter of only 0.6, still substantially less than Fujinawa et al’s projections. Conversely, if we reduce this variable to 0.4 (only 40% of people receiving the alert are able to take action), the model returns a negative NPV of $13 million. The break-even point for the ability to take action variable is 0.48.
Distance: Our model is also highly sensitive to changes in the distance factor, particularly for counties moderately distanced from the epicenter. If we reduce the most plausible estimate from 0.75 down to 0.5, then the NPV for the EEWS returns a negative NPV of $8 million. The two other distance variables are less sen-sitive to changes, which shows that a large concentration of the casualties from the five earthquakes are in counties that are far enough away benefit from the EEWS.
Discount Rate: Reducing the social discount rate positively increases the NPV ($57 million for a discount rate of 0.03). Conversely, increasing the discount rate lowers the NPV. The internal rate of return (the discount rate at which the NPV is equal to 0) is relatively high at approximately 0.17.
Value of Casualties Avoided: The values used in this analysis for costs avoided for the four different casualty categories are somewhat sensitive to changes. Uniformly reducing the values by 20% returns a slightly negative NPV of $0.06 million.
Worst Case Scenario: Using the lower bound estimates for ability to take action, distance, uptake, and the value of injury costs avoided, the model returns a negative NPV of $54 million.1
Monte Carlo SimulationIn order to test the results of our BCA of an EEWS we conducted a Monte Carlo simulation, which allowed us to vary selected variables simultaneously and by dif-ferent distributions. The Monte Carlo analysis is especially useful for our purposes due to the significant role played by probability. Additionally, as explained above, some of the key variables are extremely sensitive in determining whether the proposed EEWS returns a positive NPV. Using a Monte Carlo analysis we varied
1 The uptake variable was set to 0.5, effect (ability to take action) set to 0.4, distance factor for moderately distancedcounties set to 0.5, and injury and fatality values reduced by 20%.
132 THE EVANS SCHOOL REVIEW
Benefits and Costs of an earthquake early Warning system in Washington state
the following variables within a given range, typically a normal distribution except where noted:
• Earthquake probabilities• Ability to take action• Expected costs of earthquake without EEWS• EEWS Uptake• EEWS System Costs• Social Discount Rate (uniform distribution between .02 and .12)
This model returned a positive NPV 58% of the time over one million observa-tions. The distribution of values is represented in Figure 2, the kernel density estimate. The average NPV was $32 million, which is $12 million higher than our base case estimate.
Figure 1: Kernel Density Estimate of EEWS, Monte Carlo Analysis
Kernel Density Estimate of EEWS Net Benefit
Den
sity
2.00
0e-0
94.
000e
-09
6.00
0e-0
9
-2.000e-08 2.000e-08 4.000e-08 6.000e-080
kernel = epanechnikov, bandwidth = 4.3e+06
0
netben
133VOL 5, SPRING 2015
Calkins, lieberman
FUTURE RESEARCHWhile our analysis is limited to the benefits associated with avoiding human cau-salities, an EEWS can actually be interwoven into society in numerous and com-plex ways. The Bay Area Rapid Transit (BART) system in San Francisco recently completed an earthquake event reaction system upgrade. BART trains are now linked to the first iteration of the Shake Alert in California and can automatically be slowed or stopped if an earthquake is detected in the San Francisco area. Ad-ditionally, the potential exists for the following actions to be taken in the event of an EEWS alert: medical professionals can stop procedures, firehouse doors can be opened, elevators can be shut down, dangerous chemicals can be stored, sensitive mechanical equipment can be put offline, and financial transactions can be halted (Burkett, 2014). In total, these actions potentially represent sizable benefits if soci-ety were to implement an EEWS, which are not being accounted for in our paper. As noted in the partial sensitivity analysis above, the results of our BCA are delicate to the values of several variables. If a future paper were to quantify these physical costs and benefits, a positive NPV will likely be far more robust.
The previously mentioned JMA survey also reveals that the non-physical benefits of an EEWS may be important as well. Hoshiba et al state that “psychological relief is a major factor in the perception of usefulness in addition to actual actions” (Hoshi-ba, 2014). So far, no effort or research design has been proposed to quantify these psychological factors.
CONCLUSIONWhile other studies have laid out a framework for evaluating the benefits and costs of an EEWS, our model is the first that begins to quantify the actual benefits and costs of an EEWS to society. Our analysis of the proposed EEWS in Washington State shows that there is a positive NPV of $20 million under our most plausible estimates of EEWS effectiveness. As a result, we recommend that the project go forward.
The analysis also illustrates that the benefits of an EEWS are highly sensitive to a few key variables, namely the distance factor and the ability of EEWS respondents to take action (which combine for the overall effectiveness of the system). Future analyses of an EEWS could benefit from additional research into the effectiveness of these systems on altering human behavior immediately prior to an earthquake, beyond the existing surveys discussed above.
Taking into account the limitations in knowledge regarding EEWS’ effectiveness
134 THE EVANS SCHOOL REVIEW
Benefits and Costs of an earthquake early Warning system in Washington state
on human behavior, the model we have developed is conservative, both in assump-tions of EEWS effectiveness on casualty reductions as well as in the model’s inputs. For instance, this analysis did not include non-human costs and benefits that may be incurred if the system was incorporated into the business community and public utilities. Additionally, the analysis only includes five earthquakes that will be most impactful in Washington State. Benefits would likely only increase by adding more earthquakes to the analysis and by looking at physical benefits. Ultimately, our analysis shows that, even accounting for only reductions in human casualties, the EEWS project is likely to have a positive NPV.
Author Affiliations
Eli Lieberman is a second year MPA candidate at the Evans School of Public Policy and Governance. He hopes to work in Washington, D.C. after graduation to advocate for the protection of public lands and solutions to climate change.
Andrew Calkins is a second year MPA candidate at the Evans School of Public Policy and Governance. He is passionate about urban policymaking, housing and social policy, and conducting data-driven research and analysis.
135VOL 5, SPRING 2015
Calkins, lieberman
References
Asgary, A., Levy, J. K., & Mehregan, N. (January 01, 2007). Estimating willingness to pay for a hypothetical earthquake early warning systems. Environmental Haz-ards, 7, 4, 312-320.
Birmingham, L. (2011, February 18). Japan’s Earthquake Warning System Ex-plained. Time, Inc.
Burkett, E., (August, 2014). ShakeAlert—An Earthquake Early Warning System for the United States West Coast. United States Geological Survey. Web.
Federal Aviation Administration. Revised Departmental Guidance: Treatment of the Value of Preventing Fatalities and Injuries in Preparing Economic Analyses. (2008, February 1).
FEMA. “Hazus-Multi Hazard Overview.” Retrieved November 21, 2014, from https://www.fema.gov/hazus/hazus-multi-hazard-overview.
FEMA. (2009, January 1). BCA Reference Guide. (Retrieved April 22, 2015, from http://www.fema.gov/ media-library-data/20130726-1736-25045-7076/bca_reference_guide.pdf.
FEMA BCA Help Line (December 12, 2014). Correspondence via Email.
Fujinawa, Y., & Noda, Y. (2013). Japan’s Earthquake Early Warning System on 11 March 2011: Performance, Shortcomings, and Changes. Earthquake Spectra, 29(s1), S341-S368.
Fujinawa, Y., Rokugo, Y., Noda, Y., Mizui, Y., Kobayashi, M., & Mizutani, E. (2009). Development of application systems for earthquake early warning. Journal of Di-saster Research, 4(4), 218-228.
Given, D.D., Cochran, E.S., Heaton, T., Hauksson, E., Allen, R., Hellweg, P., Vidale, J., and Bodin, P., (2014). Technical implementation plan for the Shake Alert production system—An Earthquake Early Warning system for the West Coast of the United States: U.S. Geological Survey Open-File Report 2014–1097, 25p., http://dx.doi.org/10.3133/ofr20141097.
136 THE EVANS SCHOOL REVIEW
Benefits and Costs of an earthquake early Warning system in Washington state
Goltz, James., (2002). Introducing Earthquake Early Warning in California: A Sum-mary of Social Science and Public Policy Issues. Rep. Pasadena: Governor’s Office of Emergency Services. Print.
Hoshiba, Mitsuyuki. (2014). Review of the Nationwide Earthquake Early Warning in Japan during Its First Five Years, Pages 505-529. Chapter in Earthquake Hazard, Risk, and Disasters.
Hallegatte, S. (2006). A cost-benefit analysis of the New Orleans flood protection system. AEI-Brookings Joint Center. Regulatory Analysis, 06-02.
Hoshiba, M. “Review of the Nationwide Earthquake Early Warning in Japan during Its First Five Years.” In Wyss, M. (2014). Earthquake hazard, risk, and disasters. Waltham, MA: Elsevier/Academic Press.
Klafft, Michael, and Ulrich Meissen. “Assessing the Economic Value of Early Warn-ing Systems.” Proceedings of the 8 The International ISCRAM Conference – Lis-bon, Portugal (2011): N. Pag. Web.
Lee, R. (2013, June 5). Cell phone ownership hits 91% of adults. Retrieved No-vember 22, 2014, from http://www.pewinternet.org/2013/06/06/cell-phone-ownership-hits-91-of-adults/.
NOAA. “NOAA Tsunami - How does the Tsunami Warning System Work?” (n.d.). Retrieved November 1, 2014, from http://www.tsunami.noaa.gov/warning_sys-tem_works.html.
Tierney, K., (2000). Implementing a Seismic Computerized Alert Network (SCAN) for Southern California: Lesson and Guidance from the Literature on Warning Response and Warning Systems. Trinet Studies and Planning Activities in Real-Time Earthquake Early Warnings. Print.
Washington State Department of Transportation. Population Growth. Retrieved November 20, 2014, from http://www.wsdot.wa.gov/ planning/wtp/datali-brary/population/wspopulationgrowth.htm.
137VOL 5, SPRING 2015
Forman, Jacoby, mcclung, Whitehill
137VOL 5, SPRING 2015
A Quadruple Bottom Line Framework for Teacher Evaluation
University of Washington Evans School of Public Policy and Governance
MPA Candidate
AbstractIn 2014, the Federal Department of Education revoked Washing-ton State’s waiver from No Child Left Behind (NCLB), resulting in districts throughout the state losing control of $40 million and labeling the majority of Washington’s schools as “failing.” The loss of the NCLB waiver means that Washington State must reallocate 20% of Title 1 funds, constraining school budgets and ultimately impacting students’ learning environment.
At issue is Washington’s failure to link teacher evaluations to measures of student academic growth on state standardized tests. The Federal Department of Education asserts the importance of using student test data to objectively evaluate the performance of individual teachers. Washington’s teachers, however, object to the use of student test scores in teacher evaluation. They argue that test-based measures are inaccurate and do not reflect meaningful student learning.
AssessWA is a Quadruple Bottom Line (QBL) teacher evaluation framework that satisfies the waiver requirements for No Child Left Behind and provides a more comprehensive assessment of stu-dent growth by which to evaluate teachers. It builds on the exist-ing Washington State Teacher/Principal Evaluation Project (TPEP) framework by defining student growth according to four “bottom lines”: Academic Performance, Social and Emotional Learning, Environmental Stewardship, and Arts and Culture.
AssessWA aligns with existing state standards that are not currently included in the teacher evaluation system. Washington State stan-dards already include arts and environmental education, but in an accountability environment increasingly focused on test scores, teachers feel pressure to prioritize tested subjects at the expense of arts, sustainability, and social-emotional learning. AssessWA redefines student growth to include not just improved test score performance, but holistic development that produces globally
138 THE EVANS SCHOOL REVIEW
Quadruple Bottom line Framework For teacher evaluation
minded, well-rounded citizens.
Questions about how to accurately and fairly differentiate between high and low quality teachers are at the heart of the current policy debate impacting education in Washington State. While all parties agree that Washington’s students need and deserve high quality teachers, disagreement over the content of teacher evaluations threatens the educational opportunities of some of Washington’s most vulnerable students.
Problem DefinitionLast year, Washington was the first state to have its Elementary and Secondary Education Act waiver revoked. The Federal Department of Education (DOE) issues waivers to states to provide flexibility in certain requirements of the ESEA, more commonly known as No Child Left Behind. With the loss of the waiver, Washing-ton’s schools lost control over 20% of Title I funds1, totaling $40 million statewide, that must now be reserved for Supplemental Education Services (SES) and school choice. These programs are inadequate to meet the needs of Washington’s low income students and fail to provide the flexibility and targeted interventions that schools and districts were previously able to provide with the waiver.
At issue is Washington’s failure to link teacher evaluations to measures of stu-dent academic growth on state standardized tests. To regain the waiver, the DOE requires states to implement teacher evaluation systems that “…use multiple valid measures in determining performance levels, including as a significant factor data on student growth for all students…” In an effort to regain the waiver, two bills were introduced in the 2013-2014 legislative session that would require “student growth data elements used in educator evaluations include results from federally mandated statewide student assessments” (HB 2800/SB 5880).
Many groups opposed these bills, most notably the Washington Education Asso-ciation (WEA), the highly influential state teachers’ union. Washington’s teach-ers object to the use of student test scores in teacher evaluation. They argue that test-based measures are inaccurate and do not reflect meaningful student learning. Among their arguments against the bill, they state, “Only a fraction of teachers teach one of the subjects or grades currently covered by state tests,” and, “The 1 Title I, Part A of the Elementary and Secondary Education Act, as amended (ESEA) provides financial assistance to local educational agencies (LEAs) and schools with high numbers or high per-centages of children from low-income families to help ensure that all children meet challenging state academic standards. Federal funds are currently allocated through four statutory formulas that are based primarily on census poverty estimates and the cost of education in each state.
139VOL 5, SPRING 2015
Forman, Jacoby, mcclung, Whitehill
inappropriate overemphasis on high-stakes testing harms students by narrowing the curriculum, reducing classroom learning time and reducing the overall reliability of the testing system itself ” (“Message to the Legislature,” 2015). Washington State did not pass this legislation and the DOE revoked the waiver (Duncan, 2014), leading to loss of flexibility in federal requirements and the redi-rection of $40 million away from school and district programs. The consequences of losing the waiver have real implications for students in Washington State. Many students, especially in rural areas, do not have access to SES providers, and others are losing programs that target traditionally under-served students (Saifer & Speth, 2007). For example, the approved SES providers for Yakima School District, which serves a large Latino population, are mainly located several hours away from Yakima and do not speak Spanish. The mismatch of student needs and services available left some students without tutoring services. When Washington lost the waiver, Bremerton School District had to reduce after school learning programs from serving 360 students to 20, and Wapato school district had to cut preschool and other learning programs (Salerno, 2014).
There is a compelling need for Washington to regain its ESEA Waiver to return im-portant services to students. However, our teacher evaluation system must reflect an accurate, equitable, and comprehensive vision of high-quality teaching.
Policy Solution: AssessWA For Washington to regain its ESEA waiver, teacher evaluations must be tied to student growth measurements. Traditionally, states have used value-added mea-surements based on federally-approved statewide tests, such as the Measurement of Student Progress or Smarter Balanced. AssessWA recognizes that test scores are valuable as broad measures of growth and accountability, but rejects that they are sufficient as sole measures of student growth.
AssessWA is a teacher evaluation framework that includes test-score based mea-surements to fulfill ESEA requirements and allow Washington to regain its ESEA waiver and Washington schools to regain control of their Title I funds. At the same time, AssessWA redefines student growth, asserting that education is not just math and English Language Arts and that success is not just test scores. Student growth refers to all learning standards and growth in skills and qualities that are valued by parents, the community, and society, and that will help students succeed in school, life, and careers.
We apply a Quadruple Bottom Line framework to teacher evaluations in Washing-
140 THE EVANS SCHOOL REVIEW
Quadruple Bottom line Framework For teacher evaluation
ton State, measuring teachers’ contributions through four critical components of student learning: Academic Achievement, Environmental Stewardship, Social-Emo-tional Learning, and Creative Vitality (Arts and Culture).
Quadruple Bottom LineThe Quadruple Bottom Line framework is an extension of John Elkington’s Triple Bottom Line, which proposes profit, people, and planet as three “bottom lines” by which to measure an organization’s performance. The idea was for a business to consider factors beyond the traditional profit bottom line in determining its success, namely its impact on the environment and its social responsibility (The Economist, 2009). In his working paper, Joaquín Herranz Jr. further develops the Triple Bottom Line concept and introduces creative vitality as a fourth bottom line. The Quadruple Bottom Line theory is presented as a conceptual framework for businesses, nonprofits, and government to use in holistic performance measure-ment (Herranz, 2015).
Triple Bottom Line performance is used widely in firms’ internal and external accountability measures, particularly as they are subject to greater transparency expectations and public scrutiny. Quadruple Bottom Line (QBL) may be applied to organizational performance and, notably, has been the central framework in city planning initiatives. Research on the artistic vitality of cities and the impact it has on economic growth and social structures shows that cities with more artistic and cultural vitality and diversity are stronger economically, with greater innovation, faster growth, more high-tech industry and higher quality of life (Florida, 2005).
Herranz considers both the extrinsic and intrinsic values of artistic vitality, these being effects such as the economic and social value of the arts, as well as creative, aesthetic, and quality-of-life improvements that come with attention to the arts in society, and we argue the same applies in considering the importance of arts in education. As the world shifts from an industrial to a knowledge economy, these additional performance considerations are critical to incorporate into the education and development of young and future generations (Herranz, 2015).
Value-added measures are numerical scores of teacher effectiveness, statistically de-rived from student test scores on state-standardized assessments. They are intended to isolate an individual teacher’s impact on student learning from other factors, and they are one set of measures that allow administrators to identify the highest and lowest performing teachers in a given school. This information is important both for targeting support and for identifying individuals utilizing best practices to im-pact student learning. It is extremely difficult to accurately isolate the impact of an individual teacher from other school and contextual influences (Corcoran, 2010). These scores are primarily valid in comparing teachers within the same school and have limited ability to characterize those teachers whose scores land in the middle quartiles (Perez & Bryk, n.d.). In addition, the narrow and high-stakes focus on test scores creates strong incentives for negative teaching practices, such as “teach-ing to the test;” teaching test-taking skills rather than cognitive skills; and reducing time spent on other learning standards in favor of tested subjects (Corcoran, 2010; Walker, 2014). This focus on testing “displaces priorities” in classrooms, and leads to “taking away from teaching time,” “squashing the desire to read,” “displacing op-portunities to exercise communication and collaboration skills,” “placing focus on form over content,” and “narrowing the scope of writing genres” (Watanabe, 2007, p. 351-352).
Since value-added scores have limited utility, AssessWA proposes a more comprehen-sive approach to evaluating quality teaching based on student growth. Our system measures student academic growth over time and includes both quantitative and qualitative data when considering the evidence of learning in light of the teaching context (Darling-Hammond, Jaquith, & Hamilton, 2012). Quantitative measures consist of student scores on state- or district-level standardized tests. A teacher may supplement test scores using standards-based student work portfolios or perfor-mance tasks evaluated against a specific rubric as qualitative measures. While we propose that all teachers present evidence of student growth, a teacher and his or her supervisor should determine acceptable quantitative and qualitative measures jointly during the evaluation cycle with the goal of accurately representing and improving student academic performance.
142 THE EVANS SCHOOL REVIEW
Quadruple Bottom line Framework For teacher evaluation
People “Thecurrentoveremphasisontestscoresisinadvertentlyretardingacademicachievementandpreventingfuturegenerationsofyoungpeoplefromdevelopingtheabilitytobeactive,engagedmembersofademocracy.”
Cohen,2006
Educators impart social and emotional knowledge in addition to academic knowl-edge. A 2013 Phi Delta Kappa/Gallup poll found that “the public sees the most important purposes as preparing students to become responsible citizens and helping people to become economically self-sufficient” (Weissberg & Cascarino, 2013). Being a responsible citizen means developing social-emotional skills such as self-awareness, conflict resolution, communication and collaboration, and under-standing and involvement in social justice and good will issues. Improvements in social-emotional learning are shown to lead to academic improvement (Weissberg & Cascarino, 2013).
Three states have already established SEL standards: Illinois has created ten learning standards with several benchmarks for each (Illinois Learning Standards for SEL, n.d.). According to the Collaborative for Academic, Social, and Emotional Learn-ing, there are several factors that define high-quality state standards aligned with five areas of social-emotional learning: self-awareness, self-management, social awareness, relationship skills, and responsible decision-making (Dusenbury et al., 2014). Currently, the Washington State legislature is considering bills that would create similar SEL standards. The Center on Great Teachers & Leaders recommends states and districts “explicitly include practices that promote or support SEL in educator evaluation systems” (Yoder, 2014).
There are several assessments to measure children’s social-emotional learning. A study by the Raikes Foundation reviewed available assessments and recommended several (Haggerty, Elgin, & Woolley, 2011). These assessments can be integrated into the current system and help provide teachers an understanding of students’ non-academic development. Appendix A provides a couple examples of existing model programs that measure SEL achievement.
In the same Phi Delta Kappa/Gallup Poll mentioned above, 65% of respondents said, “public schools should give more emphasis to teaching about environmental issues.” Environmental education is mandatory in Washington. Section 392-410-115 of the Washington Administrative Code says: “Instruction about conservation, natural resources, and the environment shall be provided at all grade levels in an interdisciplinary manner through science, the social studies, the humanities, and other appropriate areas” (Washington State Legislature, 2007). This legislation is reflected in Washington’s Environmental and Sustainability Education (ESE) learn-ing standards. However, these standards are not given any recognition in teacher evaluations and are overshadowed by tested subjects.
Introducing green programming in schools will have the long-term outcome of ex-posing students to a liveable wage career in a growing field. Green industries tend to grow faster than the overall economy, and green jobs are accessible to work-ers without a college degree (Pollack, 2012). In both the short term and the long term, students greatly benefit from sustainability programming.
Numerous studies show the benefits of environmental education, ways that it can be incorporated into teaching, and ways to measure learning outcomes. Hollweg et al. (2011) advocate for a flexible point system that incorporates numerous scoring dimensions decided upon mutually by the teacher and administration and based on different desired outcomes (as shown in Appendix A). The report also provides a wealth of resources for different grade levels and objectives. Monroe et al. rein-force this methodology and talk about the capacity building and benefits to stu-dents when teachers are encouraged to convey information, build understanding, improve skills, and enable sustainable actions (Monroe et al., 2007).
144 THE EVANS SCHOOL REVIEW
Quadruple Bottom line Framework For teacher evaluation
Arts education includes classes in music, visual arts, fine arts, theater, and dance; arts integration, in which art is used as support in academic subjects; and world cultures. With resources, class time, and evaluation standards dedicated to tested subjects, arts and culture are given a back seat and often are not offered in lower-resource schools.
Most educators and community members support the teaching of art in schools (Winner & Goldstein, 2013). The OECD’s Centre for Educational Research and Innovation recommends arts instruction, besides the potential for incidental academic benefits, “for art’s sake.” They cite the importance of artistic skills in in-novative societies, as well as the development of skills for future careers in artistic disciplines including graphic design, industrial design, marketing and advertising, web design, the music industry, and fine and performing arts. Students who are skilled in or inspired by art may never discover or develop these skills if they are not offered in public schools (Winner & Goldstein, 2013).
In Seattle, The Creative Advantage Initiative is working to bring the arts back to public schools by 2020. They promote arts education because art gives young people “the tools to express themselves and their ideas” and “creative outlets” with which to express them. Art enables students to become “creative and critical thinkers,” and creates “well-rounded, communicative, and adaptable residents in the Seattle community” (“The Creative Advantage,” n.d.).
Several organizations, including Creative Advantage, Arts Corps, and the National Coalition for Core Arts Standards, have developed assessment tools for arts pro-grams, and Creative Advantage has developed strategies for integrating art into the teaching of other subjects. While assessment information is still being developed and is not yet public information, in the future, AssessWA can reach out to organiza-tions developing these tools.
145VOL 5, SPRING 2015
Forman, Jacoby, mcclung, Whitehill
Measuring Student GrowthAssessWA intentionally avoids prescribing additional tests to measure student growth in the added components. AssessWA works within Washington State’s current evalu-ation framework, known as TPEP: Teacher/Principal Evaluation Project. Each of the student learning components above can be measured with existing tools if a teacher chooses to use a standardized tool. However we recognize the importance of creativity and flexibility in the classroom, and make an effort to reflect this in the framework.
A test score growth component will be required for teachers of tested subjects, with the option to choose one or more additional growth measures on which to be evaluated—teachers are not expected to integrate all four components into their classes. This inclusion of test scores is necessary for Washington to regain the ESEA flexibility waiver and only needs to be a “significant portion” of the evaluation—there is no mandated minimum percentage of the evaluation that test scores must account for, and common interpretation is that test scores simply must be consid-ered and inform evaluations.
An Innovative Approach While the QBL framework has been applied to other sectors, no state has used this framework to build a vision for quality teaching and learning. However, there is a body of research about SEL, arts, and other alternatives to test score-driven education that suggests these are vital components of a well-balanced education that benefits all students (“SEL Competencies,” n.d.; Pellegrino & Hilton, 2012; Weissberg & Cascarino, 2013), as well as a number of nonprofit organizations that advocate for and provide these supplemental learning opportunities to students (Creative Advantage, ArtsEd WA, IslandWood, YDEKC, Yale Center for Emotional Intelligence). While other states, such as Massachusetts, New Mexico, and Califor-nia have implemented teacher evaluation systems that expand measures of “student growth” to include a range of academic growth measures, AssessWA builds on this existing foundation to assert the importance of broader types of learning. Illinois’ SEL standards, for example, have a separate evaluation—meaning a teacher’s efforts in these areas are not rewarded on the primary evaluation, giving little in-centive to teach social skills. AssessWA integrates these evaluations into the primary teacher evaluation, reducing peripheral assessments and creating one multi-dimen-sional evaluation framework. Appendix B shows where QBL programming can be implemented, and demonstrates the outputs and outcomes of AssessWA.
146 THE EVANS SCHOOL REVIEW
Quadruple Bottom line Framework For teacher evaluation
Benefits for Students, Teachers, Communities ShortTerm:
Washington will regain flexibility in NCLB requirements, giving districts and schools the freedom to continue local programs that serve their most vulner-able populations of students. Additionally, all teachers, not only those in tested subjects, will have ways to measure student growth that acknowledge their important contributions. AssessWA provides a forum to bring stakeholders together in conversation to solidify a comprehensive and equitable vision of effective teaching.
MediumTerm:
AssessWA shifts the focus of teacher evaluations, adding greater emphasis to stu-dent growth in areas valued by parents, employers, and community members. Rather than narrowing curriculum to focus on short-term gains on standard-ized tests, teachers will be held accountable to a vision of good teaching that emphasizes student well-being and multidimensional learning.
LongTerm:
Students gain valuable skills in dimensions outside of just math, English lan-guage, and test-taking. With greater attention on environmental issues, artistic expression, and behavioral competencies, students will graduate as well-rounded, engaged citizens able to compete in the 21st century job market (Strauss, 2014).
OutcomesAssessWA will clarify the multiple measures of student growth called for in TPEP. The inclusion of standardized testing will meet NCLB waiver requirements and give schools back the much-needed funding that accompanies the waiver.Teacher evaluations are of high consequence, with low scores triggering added scrutiny of teaching practices, as well as probation, tenure, and firing decisions. When state test scores are the only measure of success, educators are incentivized to “teach to the test” (Corcoran, 2010), with as much as 30% of total classroom time devoted to test preparation and completion (“NEA Survey,” 2014). This nar-row, output-based focus will not achieve OSPI’s goal of ensuring every student is “ready for career, college, and life” (Strauss, 2014), and it detracts from all other aspects of student learning in favor of tested subjects. Using state test scores to de-fine student growth allows only teachers of tested grades and subjects to be evalu-ated on student growth. Using AssessWA’s measures in combination provides a range of student growth measures that allow teachers working in a variety of content areas and in non-tested grades and subjects to accurately demonstrate the impact of their instruction on student growth.
Current testing-focused evaluations incentivize teachers to forego important aspects of a balanced education because their evaluation and their jobs depend on it. Tying evaluations to a range of important learning activities means teachers
147VOL 5, SPRING 2015
Forman, Jacoby, mcclung, Whitehill
can demonstrate that they are imparting important learning and development on their students, and relieve some of the “extreme pressure” (“NEA Survey,” 2014) they feel from districts and principals to deliver high test scores. This practice and outcome would align with preferences of parents, the community, and employers as well: the 2014 PDK/Gallup Poll on the Public’s Attitudes toward Public Schools reported that while 24% of respondents said that “performing well on a standard-ized test” is “very important” to a student’s future career success, 86% responded that “learning skills like dependability, persistence, and teamwork” is “very impor-tant.”
This and other research (Posner & Patoine, 2009) leads us to anticipate short-term outcomes for students such as more access to art, social, and environmental learn-ing in school, higher levels of engagement and motivation, and fewer discipline referrals (Arts Education Partnership, 2013). Long-term outcomes for students in-clude higher graduation rates, greater job prospects, and social and emotional skills to help them succeed in life, society and careers. These benefits accrue to society, as well, as Washington gains a generation of environmentally-conscious, creative, globally-minded and engaged citizens.
ImplementationAssessWA will be incorporated into the existing TPEP framework. An example of the most common framework, Danielson, can be found in Appendix C. The appendix shows how complex the evaluation process is and elucidates how time consuming it can be to learn such a framework.
Current teacher evaluation criteria are written into Washington State Code2. Con-sequently, the legislature will need to approve a bill that defines student growth according to the AssessWA framework. We will develop this bill in conjunction with stakeholders, including OSPI, to ensure they are supported throughout the legisla-tive process.
In the 2014 legislative session, the Washington state House of Representatives and Senate considered two bills that tied student growth to the federally-mandated statewide achievement exams. However, the bills died in their committees and the legislature never voted on them. This was primarily due to pressure from the teach-ers’ union. According to the bill reports, there was considerable opposition from the WEA and few proponents supporting the existing bills.
2 The relevant state code is RCW 28A.405.100
148 THE EVANS SCHOOL REVIEW
Quadruple Bottom line Framework For teacher evaluation
The 2014 legislation narrowly defined student growth as achievement on the state standardized tests. The WEA opposed this for many reasons, but they include that the student growth goal is too specific to be practical and that state tests do not measure student growth from one point to another. AssessWA broadens the teacher evaluation, addressing the WEA’s concerns about the previous bills, and intends to build relationships and support with local stakeholders, including nonprofit organizations and school districts, to gain more support for the bill. As momentum builds and bills pass further and further through the legislative process, the message is clear: It is time for reform.
The current TPEP system allows teachers to, in collaboration with their supervisor, define how they will measure student growth and how much growth they should expect. The AssessWA system would not change how student growth goals are set or calculated. Instead, it would provide a framework that requires teachers to include measurements of the whole child. Allowing the teachers to define how they mea-sure social-emotional learning, environmental stewardship, and creative vitality, using their own classroom-based assessments, will still satisfy the demands of the WEA, while including academic achievement on the state standardized tests will satisfy the federal requirements.
Campaign PlanAssessWA will require the support of the WEA and the Office of the Superintendent of Public Instruction (OSPI). OSPI championed previous legislation to define stu-dent growth and were strongly opposed by the teachers’ union.
The AssessWA CoalitionTo craft the bill that would codify AssessWA into law, we will assemble a team of educators, policymakers, and lawmakers. WEA and OSPI have significant influence in the state capital and OSPI’s support will be necessary in carrying out the changes to the TPEP framework. Central to our work, then, will be bringing these two groups to the table to craft specific language for the bill. OSPI will need to provide resources to support the implementation of AssessWA. Other potential allies include:
• Steve Litzow (R) is the chair of the state Senate Early Learning and K-12 Education Committee. Senator Litzow worked with OSPI on the 2014 student growth legislation and would be a strong champion in the legislature for As-sessWA as well.
• Representative Sharon Tomiko Santos (D) is the Chair of the House Education Committee and can advocate for the AssessWA bill as well and help ensure its
149VOL 5, SPRING 2015
Forman, Jacoby, mcclung, Whitehill
passage.• Senator Rosemary McAuliffe (D) is the ranking democrat on the Senate Early
Learning & K-12 Education committee. Her support will help generate broad-er democratic support in the Senate and help smooth the passage of the bill.
• The Washington Association of School Administrators is the union for prin-cipals and superintendents. Bringing them into the coalition will help build legitimacy for the bill.
In addition, there are many community organizations and initiatives throughout Washington State that have developed standards, curricula, evaluations, and profes-sional development opportunities aligned with the AssessWA framework. A poten-tial influencer is IslandWood; an environmental education organization that trains teachers to incorporate environmental learning into their classrooms. Another is Creative Advantage, a program in Seattle Public Schools that is promoting arts inte-gration in the classroom. Both organizations have high interest in policy reform but low power to enact change. Bringing representatives from these organizations to help develop the language and tools teachers can use in their classrooms will help support implementation and make a case to representatives pushing for reform.
Our MessageAssessWA will encourage teachers to spend more time on what the public believes students should be learning in school. In building support with the public, unions, and policymakers, we will present the following messages:
• Education is not just about academic achievement. Right now, the only true measurements of student learning focus solely on academic knowledge and ignore the other key aspects of growth: social-emotional learning, environmen-tal stewardship, and creativity. AssessWA goes beyond academic knowledge and helps support an understanding of the whole child. It encourages teachers to focus more on skills and knowledge students will need in the future.
• The AssessWA solution builds on the existing framework. It allows teachers and districts flexibility in measuring student growth, but gives them a better frame-work for measuring growth according to the whole child, not just academic achievement.
150 THE EVANS SCHOOL REVIEW
Quadruple Bottom line Framework For teacher evaluation
Budgetary ConsiderationsPrimary cost drivers in implementing AssessWA will include:
• Training teachers and administrators in the modifications to the TPEP frame-work
• Curriculum coordination and revision• Time required to build effective coalition of support• Development or acquisition of classroom-based assessment resources
We drew from several comparable policies to develop a five-year proposed budget (see Appendix D). The total budget of AssessWA over five years is estimated to be ap-proximately $13 million. To fund the project, we will seek private and government grants to build and test the pilot system and will possibly seek appropriations in FY 2017 and beyond.
Predicting the cost of implementing AssessWA relies heavily on evidence from the Chicago and Illinois Public School system implementation of SEL, various imple-mentations of value-added and teacher observation cost predictions, and estimates provided by Washington State Representative Mary Lou Dickerson in her report to the Basic Education Task Force Chair on the potential cost of implementing SEL measures in Washington State, which shows a cost of around $1.4 million per year for the development of curriculum, training, and revision of standards (Dickerson, 2008). We also considered a study by Chambers et al., sponsored by the Bill and Melinda Gates Foundation and Rand Corporation, which concluded that expen-ditures on new teacher evaluation systems can range from $6.4 million to $24.8 million (Chambers, Brodziak de los Reyes, & O’Neil, 2013). Another report by the Seattle Arts Education Consortium estimated the cost of developing a tailored evaluation tool to be around $18,000 (SAEC, 2005).
Finding Funding SourcesEducation, arts education, and environmental education grants and funding attract-ed over $59 million in grants from prominent Northwest givers in 20143. Local givers and state and federal grant-makers recognize the need for education reform, and the costs associated with real change. Table 1 outlines just a few available grant-funding opportunities that might be available to AssessWA.
3 Amount includes arts education, alliances, advocacy, and policy analysis, education support & services, elementary and secondary schools, and environmental education categories. More informa-tion on these trends and givers can be found at https://philanthropynw.org/trends14/washington.
151VOL 5, SPRING 2015
Forman, Jacoby, mcclung, Whitehill
Table 1: AssessWA Funding SourcesGrant Amount
AvailableDescription
Race to the Top $4.35 bil-lion
Grant available to States to encourage educa-tion innovation and curriculum reform. (Grants.gov, ED-GRANTS-072909-002)
Supporting Effective Educator Development (SEED)
$24.1 mil-lion
Funding for Not-for-Profit Organiza-tions for projects that support teacher or principal training. (Grants.gov, ED-GRANTS-021015-002
Arts in Education Na-tional Program (AENP)
$6.7 mil-lion
Supports national-level, high-quality Arts education activities and services for children and youth. (Grants.gov, ED-GRANTS-021015-001
International Paper En-vironmental Education Grants
$5,000 - $25,000 +
Supports public and non-profit institutions that help students understand a sustainable approach to balance environmental, social, and economic needs. (International Paper Foundation)
Bill & Melinda Gates Foundation – College Ready
Varies The BMGF College Ready program asserts “effective teaching” as a philanthropic prior-ity and continues to fund projects that create innovative teaching methods or assessments and build on measures of effective teaching. (Gates Foundation–College Ready)
ConclusionAssessWA is an innovative and comprehensive way to evaluate teacher performance using a quadruple bottom line approach. There are many systemic issues that make policy changes in education extremely complex and difficult to craft. There are so many stakeholders, including students, who are greatly affected by decisions made at federal, state, and local levels. We offer a comprehensive solution that we believe is amenable to many of those stakeholders. However, reform is a process of com-promise and flexibility. We are willing to be active participants to ensure, in the end, that students are receiving the best possible education to give them the skills to succeed at college and their careers.
The loss of the No Child Left Behind Waiver, and the Title I funding requirement represent an opportunity – a policy window – for AssessWA to bring new ideas to a captive audience and really change the face of public education in Washington State.
152 THE EVANS SCHOOL REVIEW
Quadruple Bottom line Framework For teacher evaluation
Appendix A: Examples of Alternative Education Frameworks
SEL Example:
Source – Youth Development Executives of King County. (2014 July). Developing Skills: Social and Emotional Learning Programs and Curriculum. Excerpt.
Environmental Education Example:
Source – Hollweg et. al. (2011). Excerpt.
153VOL 5, SPRING 2015
Forman, Jacoby, mcclung, Whitehill
Appendix B: The Theory of Change — The Impact of Incorporating QBL
154 THE EVANS SCHOOL REVIEW
Quadruple Bottom line Framework For teacher evaluation
Appendix C: The Charlotte Danielson Comprehensive Evaluation Framework
Source: Danielsen, Charlotte. 2015 January. Danielsen’s Framework for Teaching Comprehensive & Focused Evaluation diagram. Washington T-PEP Program. Re-trieved from http://tpep-wa.org/wp-content/uploads/DAN%20-%20CompVS-Focus.pdf
155VOL 5, SPRING 2015
Forman, Jacoby, mcclung, Whitehill
Appendix D: Five-Year Projected Budget
156 THE EVANS SCHOOL REVIEW
Quadruple Bottom line Framework For teacher evaluation
Appendix E: Definition of Terms and Abbreviations Used
ESEA: Elementary & Secondary Education ActDOE: Federal Department of Education FRL: Free/reduced lunchNCLB: No Child Left BehindOSPI: Office of the Superintendent of Public Instruction QBL: Quadruple Bottom LineSEL: Social-Emotional LearningTitle I: Federal funding allocated to schools and districts specifically to support low-income students, as measured by free/reduced lunch eligibilityTPEP: Teacher/Principal Evaluation ProjectWEA: Washington Education Association, the state teachers’ union
157VOL 5, SPRING 2015
Forman, Jacoby, mcclung, Whitehill
References
Arts Education Partnership. (2013). Preparing Students for the Next America: The Benefits of an Arts Education.
Bill & Melinda Gates Foundation, The. (2015). College ready – Effective Teaching. Retrieved from http://collegeready.gatesfoundation.org/work/effective-teaching.
Cohen, J. (2006). Social, Emotional, Ethical, and Academic Education: Creating a Climate for Learning, Participation in Democracy, and Well-Being. Harvard Edu-cational Review, 76(2). Retrieved from http://www.ijvs.org/files/Publications/Social,%20Emotional,%20Ethical.pdf.
The Creative Advantage. (2015). Retrieved from http://www.creativeadvantagese-attle.org.
Chambers, J., Brodziak de los Reyes, I., & O’Neil, C. 2013 May. How Much Are Districts Spending to Implement Teacher Evaluation Systems? Case Studies of Hillsborough County Public Schools, Memphis City Schools, and Pittsburgh Public Schools. American Institutes for Research RAND Education and American Institutes for Research WR-989-BMGF (Working paper prepared for the Bill and Melinda Gates Foundation).
Corcoran, S. P. (2010). Can Teachers be Evaluated by their Students’ Test Scores ? Should They Be? The Use of Value-Added Measures of Teacher Effectiveness in Policy and Practice.
Darling-Hammond, L., Jaquith, A., & Hamilton, M. (2012). Creating a compre-hensive system for evaluating and supporting effective teaching. Stanford, Califor-nia: Stanford Center for Opportunity Policy in Education (SCOPE).
Dickerson, Mary Lou. 2008 August 18. Social and Emotional Learning Proposal Follow Up. State of Washington House of Representatives: Mary Lou Dickerson, State Representative, 36th District. Memorandum to Dan Grimm, Basic Education Task Force Chair.
158 THE EVANS SCHOOL REVIEW
Quadruple Bottom line Framework For teacher evaluation
Duncan, Arne. “Washington Extension Determination Letter.” Letter to Randy Dorn. 24 Apr. 2014. Secretary’s Letter to Washington ESEA Flexibility. US De-partment of Education, 24 Apr. 2014. Web. 5 Jan. 2015. <http://www2.ed.gov/policy/eseaflex/secretary-letters/wad6.html>.
Dusenbury, L., Weissberg, R., Goren, P., & Domitrovich, C. (2014). State Stan-dards to Advance Social and Emotional Learning. Retrieved from Collaborative for Academic, Social, and Emotional Learning website.Florida, R. (2005). Cities and the Creative Class. In Cities and the Creative Class (pp. 27–45).
Grants.gov. (2015 March). Find Open Grant Opportunities. Retrieved from http://www.grants.gov/.
Haggerty, K., Elgin, J., & Woolley, A. (2011). Social-Emotional Learning Assess-ment Measures for Middle School Youth. Social Development Research Group, University of Washington
Herranz, J. (2015). Quadruple Bottom Line Performance: A Conceptual Frame-work (Working Paper).
Hollweg, K. S., Taylor, J. R., Bybee, R. W., Marcinkowski, T. J., McBeth, W. C., & Zoido, P. (2011). Developing a framework for assessing environmental literacy. Washington, DC: North American Association for Environmental Education. Avail-able at http://www.naaee.net.
Illinois Learning Standards for Social/Emotional Learning (SEL). (n.d.). Retrieved February 2, 2015, from http://www.isbe.net/ils/social_emotional/standards.htmInternational Paper Foundation. (2015). IP Foundation Website. Retrieved http://www.internationalpaper.com/US/EN/Company/IPGiving/IPFoundation.html. Message to Legislature: Vote NO on SB 5880 and HB 2800 - OurVoice WEA. (n.d.). Retrieved January 29, 2015, from http://ourvoicewashingtonea.org/mes-sage-legislature-vote-sb-5880-hb-2800/
Monroe, M. C., Andrews, E., & Biedenweg, K. (2007). A framework for environ-mental education strategies. Applied Environmental Education and Communica-tion, 6:205-216. Taylor & Francis Group LLC.
159VOL 5, SPRING 2015
Forman, Jacoby, mcclung, Whitehill
National Research Council (U.S.), Committee on Defining Deeper Learning and 21st Century Skills, Pellegrino, J. W., Hilton, M. L., National Research Council (U.S.), Division of Behavioral and Social Sciences and Education, … Board on Test-ing and Assessment. (2012). Education for life and work: developing transferable knowledge and skills in the 21st century. Washington, D.C.: The National Acad-emies Press.
NEA Survey: Nearly Half Of Teachers Consider Leaving Profession Due to Stan-dardized Testing. (n.d.). Retrieved March 10, 2015, from http://neatoday.org/2014/11/02/nea-survey-nearly-half-of-teachers-consider-leaving-profession-due-to-standardized-testing-2/
Posner, M. I., & Patoine, B. (2009). How Arts Training Improves Attention and Cognition. Retrieved March 11, 2015, from http://www.dana.org/Cerebrum/Default.aspx?id=39419
PDK International. (n.d.). Retrieved March 10, 2015, from http://pdkintl.org/programs-resources/poll/
Perez, M., & Bryk, A. (in press). Making Decisions About Teachers Based on Imper-fect Data, 1–46.
Pollack, Ethan. 2012 October 10. Counting up to green: Assessing the green economy and its implications for growth and equity. Economic Policy Institute. Retrieved from http://www.epi.org/publication/bp349-assessing-the-green-economy/.
Saifer, S., & Speth, T. (2007). Supplemental educational services and implementa-tion challenges in the Northwest Region states (006). Retrieved from Institute of Education Sciences website: http://ies.ed.gov/ncee/edlabs/regions/northwest/pdf/REL_2007006.pdf.
Salerno, C. (2014, November 21). School districts cutting programs since losing No Child Left Behind waiver.
Seattle Arts Education Consortium, SEAC. (2005). Assessing Learning Through the Arts. 1-16.
160 THE EVANS SCHOOL REVIEW
Quadruple Bottom line Framework For teacher evaluation
Seattle Public Schools & Seattle Office of Arts and Cultural Affairs. (2013). Seattle K-12 Arts Plan. Retrieved from http://www.seattleschools.org/.
SEL Competencies. (n.d.). Retrieved March 11, 2015, from http://www.casel.org/social-and-emotional-learning/core-competencies/
Strauss, Valerie. 2014 May 8. How students will be affected by federal revocation of Washington’s NCLB waiver. Washington Post. Retrieved from http://www.washingtonpost.com/blogs/answer-sheet/wp/2014/05/08/how-students-will-be-affected-by-federal-revocation-of-washingtons-nclb-waiver/.
The Capitol Record | News, background and notes on Washington state gov-ernment [Blog post]. Retrieved from http://capitolrecord.tvw.org/2014/11/school-districts-cutting-programs-since-losing-no-child-left-behind-waiver/#.VM1zI17DKZo.
The PDK/Gallup Poll on the Public’s Attitudes toward the Public Schools. (2014). Retrieved March 10, 2015, from http://pdkpoll.pdkintl.org/october/. Triple bottom line. (2009, November 17). The Economist. Retrieved from http://www.economist.com/node/14301663.
U.S. Green Building Council. ND. Characteristics of a Green School. The Center for Green Schools. Retrieved from http://www.centerforgreenschools.org/main-nav/k-12/what.aspx.
161VOL 5, SPRING 2015
Evans school DEEp DivE TEam
161VOL 5, SPRING 2015
Financial Implications of Direct Bank Lending and Carbon Emissions Trading: Analysis and Recommendations for the
Governmental Accounting Standards BoardEvans School Deep Dive Team:
University of Washington Evans School of Public Policy and Governance
IntroductionFifteen Evans School MPA students recently participated in an inaugural “Deep Dive” capstone seminar. The seminar focused on the financial implications of two recent state and local policy developments: growth in direct bank lending to municipalities and the advent of sub-national carbon emissions markets. A direct bank loan is when a state or local government circumvents the traditional municipal bond market and borrows money directly from a lender. Sub-national carbon emissions exchanges, such as those recently launched in California and proposed in Washington State, could generate billions in new state government revenue by attaching fees to the right to emit carbon. Both these devel-opments will affect the financial health of many state and local governments. However, at the moment it is not clear how these developments should be reflected on state and local governments’ financial statements.
The seminar’s mandate was to advise the Governmental Account-ing Standards Board (GASB) on how to fill this information gap. The GASB is a quasi-governmental body that sets accounting rules for US state and local governments. It is the crucial link between the more than 20,000 governments that prepare financial state-ments according to its rules and the taxpayers, investors, and other stakeholders who use those statements to hold those govern-ments accountable.
The direct bank lending analysis focused on two main questions: How many governments have taken out direct bank loans and how many are expected to in the future? And what concerns do inves-tors, credit rating analysts, and others have about direct bank lend-ing, and how might new disclosures in financial statements speak to those concerns?
162 THE EVANS SCHOOL REVIEW
Financial implications oF Direct Bank lenDing anD carBon emissions traDing
The emissions trading analysis focused on two different questions: How have private companies and governments in other countries accounted for the financial impact of emissions trading? And are US emissions trading markets sufficiently well-developed to support “fair value” accounting of emissions credits on govern-ments’ financial statements?
During an intensive ten week quarter, the students assembled a multifaceted analy-sis of these questions. They compiled an exhaustive review of the relevant academic and practitioner literatures. They interviewed more than 50 key GASB stakehold-ers. They also produced original empirical analysis from several sources of adminis-trative data. Professor Justin Marlowe supervised.
On March 17, 2015, the students briefed the GASB and submitted reports that will inform the Board’s future discussions in this area. This paper is a short summary of the key findings and recommendations presented in those reports. If the Board decides to create new accounting standards in either of these areas, the students’ research will have directly impacted fiscal policy on these crucial emerging areas.
Accounting Implications of Direct Bank Lending to Governments
Overview of the Direct Bank Loan Market The market for loans directly from financial institutions to governmental entities is often referred to as direct loans, direct bank loans, or direct bank placements (DBP). Perhaps one of the most significant challenges with direct bank loans is the lack of disclosure requirements associated with these loans in borrowers’ financial statements.
When a government seeks to issue a bond in the capital markets, that bond is con-sidered to be a public offering and is subject to Securities and Exchange Commis-sion (SEC) Rule 15c2-12. This law requires the issuer to disclose the price, inter-est rate, loan terms, and other material information in a publicly-available official statement. These bond disclosures are posted to a Nationally Recognized Municipal Securities Information Repository (NRMSIR) or the Electronic Municipal Market Access (EMMA) website and are reviewed by retail investors, large institutional investors, credit ratings agencies, and other entities seeking information on the issuer’s financial position. The disclosures made in official statements are critical to assigning credit ratings, investor decisions, and market transparency.
163VOL 5, SPRING 2015
Evans school DEEp DivE TEam
Governmental entities issuing DBPs are not subject to public disclosure require-ments when taking on debt in the form of direct bank loan. As privately-offered loans, these products do not meet the definition of a municipal security under the SEC rules, and, therefore, are exempt from Rule 15c2-12. Although these bank loans may share many of the same terms and conditions and security pledges as outstanding bonds, these terms can easily go undisclosed.
While the amount of a loan must be included in an entity’s comprehensive annual financial report, the report may exclude important covenants or loan terms that could have a material effect on the entity’s debt profile, financial position, or ability to repay existing bondholders.
The increased trend in DBP started after the collapse of bond insurance in 2008. Governments began to hedge the risk associated with variable rate debt – also known as variable rate demand obligations or “VRDOs” – by entering into fixed-variable rate swaps. These swaps allowed governments to pay effective interest rates lower than prevailing market rates. These variable rate transactions usually re-quired “liquidity support” in the event that investors moved their money away from VRDOs. Liquidity support for many of these VRDOs began to expire in 2010 and 2011, at which point banks refinanced many of them as DBP to reduce their risk associated with supporting VRDOs (Jacobs, et. al 2011). These refinancing activi-ties were the catalyst for substantial growth in the DBP market.
DBPs offer governments many advantages, but the lack of transparency and avail-able data on DBPs makes it difficult for the public to determine which govern-ments are involved in the DBP market. The questions before the GASB are whether the DBP market is large enough and the transparency issues substantial enough to warrant new accounting rules.
Size of the Direct Bank Loan Market Today Although determining the true size of the overall market for DBPs is difficult, data from federal commercial banking regulators, the California Debt and Investment Advisory Commission (CDIAC), and the Washington State Auditor suggest the market is large and growing. In addition, independent analyses of market data in-dicate large increases in the size of the direct loan municipal market (Breckenridge Capital Advisors 2014). In the fourth quarter of 2014, data showed Federal Deposit Insurance Corporation (FDIC)-insured institutions held $131 billion in direct loans from states and political subdivisions in the U.S., the largest amount ever reported
164 THE EVANS SCHOOL REVIEW
Financial implications oF Direct Bank lenDing anD carBon emissions traDing
by the FDIC (FDIC 2014).
Analysts at S&P estimated the market for direct bank loans could account for as much as 20 percent of municipal debt in a January 2015 white paper on DBP in 2014 (Bodek 2014). S&P also reported that analysts had examined 404 direct loans for which they had received disclosure documents in 2014, with a par amount of $15.8 billion (Buswick 2015). Note that note all loans evaluated in 2014 were originated in 2014, as some were from prior years.
The California Debt and Investment Advisory Commission, the state’s clearing-house for all public debt issuance, aggregates data on all public debt issued in Cali-fornia. In 2009, the first year in which data are available for the “Loan from a bank or other institution” debt category, public borrowers in the state issued only seven direct loans for a total par value of $40 million. By 2014, par value of direct loans had increased by more than 2000 percent, with 62 issuances for a total par of $869 million (CDIAC 2015).
Total Holdings of Direct Loans among FDIC-Insured Institutions
(Amounts in $ millions, 2014 dollars)
$140,000
$120,000
$100,000
$80,000
$60,000
$40,000
$20,000
$-
1998
Q1
1998
Q4
1999
Q3
2000
Q2
2001
Q1
2001
Q4
2002
Q3
2003
Q2
2004
Q1
2004
Q4
2005
Q3
2006
Q2
2007
Q1
2007
Q4
2008
Q3
2009
Q2
2010
Q1
2010
Q4
2011
Q3
2012
Q2
2013
Q1
2013
Q4
2014
Q3
165VOL 5, SPRING 2015
Evans school DEEp DivE TEam
In January 2015 alone, public borrowers in California engaged in seven direct bank loans for a total par value of $285 million, or 17 percent of all public debt issued in the state that month. In previous years, direct loans did not account for more than 1.5 percent of total public debt issued in the state.
In Washington State, our analysis of public financial data provided by the Washing-ton State Auditor’s Office suggests DBPs are also increasing. In 2009, 25 public borrowers in Washington reported a total ending balance of $76.2 million in direct bank loan debt. By 2013, the last year for which full data are available, 346 public borrowers reported a total ending balance of $336.9 million in direct loan debt. Note that Analysts at the Washington State Auditor’s office indicated the categories “Notes payable” and “LID notes payable with commitments” are likely direct bank loans, although some direct bank loans may also be coded in the “Miscellaneous” category. We omitted the “Miscellaneous” category from this analysis in the inter-est of a conservative estimate of the market. “Ending balance” is the total liability reported by the issuer at the end of the fiscal year, in nominal dollars.
Direct Bank Lending in CaliforniaPrincipal Amount and Tota Number of Direct Loans, by year
$1,000,000,000
$900,000,000
$800,000,000
$700,000,000
$600,000,000
$500,000,000
$400,000,000
$300,000,000
$200,000,000
$100,000,000
Tota
l Pri
ncip
al A
mou
nt o
f Dire
ct L
oans
(in n
omia
nl d
olla
rs)
$02009 2010 2011 2012 2013 2014
100
90
80
70
60
50
40
30
20
10
0
Tota
l Num
ber o
f Dire
ct L
oans
Issu
ed
166 THE EVANS SCHOOL REVIEW
Financial implications oF Direct Bank lenDing anD carBon emissions traDing
In nominal dollars, the ending balance of direct loans increased by 342 percent from 2009 to 2013. As a percentage of total public debt issued in Washington State, direct loans accounted for 0.42 percent in 2009, but increased to 1.17 percent in 2013, according to Schedule 9 of Liabilities data proved by the Washington State Auditor. The percentage of issuers engaging in direct bank loans increased from less than 5 percent of all issuers to 2009 (25 out of 521), to 28 percent of all issuers (346 out of 878).
All indications suggest this market is going to grow, but perhaps not rapidly.
Costs and Risks for Governments that Use Direct Bank Loans
Governments generally face two costs when issuing bonds: the cost of obtaining the bond (e.g. issuance costs), as well as reporting costs related to disclosure. The cost of issuing a bond varies depending on the size of the issue and the complexity of the structure. An interview with the budget director of a large urban county in the Pacific Northwest disclosed that issuance costs generally amount to two percent of the bond sale amount. This figure includes underwriter fees, legal fees, and staff time, to name a few.
Obtaining a direct bank loan requires significantly lower transaction costs, as the
Direct Bank Lending in Washington State:Ending Amount and Total Number of Direct Loans, by Year
$700,000,000
$600,000,000
$500,000,000
$400,000,000
$300,000,000
$200,000,000
$100,000,000
$-
Tota
l Pri
ncip
al A
mou
nt o
f Dire
ct L
oans
, in
Nom
inal
Dol
lars
Tota
l Num
ber o
f Dire
ct L
oans
Issu
ed
2009 2010 2011 2012 20130
50
100
150
200
250
300
0
350
400
167VOL 5, SPRING 2015
Evans school DEEp DivE TEam
use of an underwriter is not needed, and the staff time involved in securing the loan requires a fraction of the overall process and timeline for obtaining a tradi-tional municipal bond. Due to the variability in bond issuances, it is difficult to precisely estimate how much money municipalities are spending on the indirect and direct costs associated with obtaining bonds. Additionally, the lack of available information for direct bank loan disclosures makes it very challenging to determine the associated costs for the DBP market.
The disclosure standards associated with the traditional bond market were es-tablished to protect investors by offering a clear picture of the issuer’s financial position. These disclosures include debt obligations, an entity’s ability to pay the bond, and terms and conditions that have the potential to impair the rights of other bondholders, among other key pieces of information.
Direct borrowing by municipalities introduces risk and uncertainty by limiting the amount of information readily available to the public regarding a government’s debt portfolio. Lack of information increases risk as well as the cost of borrowing from financial institutions based on risk and return theories. Bank loans change the debt profile of governments, making it more difficult for credit rating agen-cies to accurately rate the quality of governments’ public debt issuances. In May of 2014, S&P threatened to cut the rating of governments’ debt issues if they did not disclose their direct bank loans (Municipal Market Advisors 2014). By not disclos-ing these direct bank loans, credit rating agencies are unable to accurately assess a government’s ability to repay its outstanding debt and also assess a government’s fiscal health.
To understand a government’s financial position and their relative credit risk, the impact of all debt, including bank loans, must be analyzed. Financial report users are concerned with some of the risks that bank loans can bring forth, and detailed disclosure in the notes would assist in analyzing this risk. A conversation with a representative of CDIAC noted that disclosure within the financial reports would not entirely soothe the concerns of investors. Investors are concerned not only with reporting and disclosure within financial statements, but also prior disclosure, similar to the disclosure requirements for bonds in SEC Rule 15c2-12.
Accounting and Financial Reporting ChallengesAccountability is the cornerstone of all financial reporting in governments. Annual financial statements provide a record of all public activities. Financial statements provide a retrospective look into the efficiency and execution of policy goals that
168 THE EVANS SCHOOL REVIEW
Financial implications oF Direct Bank lenDing anD carBon emissions traDing
have been outlined in government budgets; therefore, accountability and transpar-ency are important policy considerations. Inter-period equity is an important com-ponent of accountability. In the context of direct bank loans, consideration should be given to the ability of the government in future years to meet a debt obligation, as well as to comply with certain terms and conditions that can be found in loan agreements.
Governments’ financial reporting plays a key role in meeting the needs of financial statement users (GASB 1987). Since the users of a government’s financial re-ports are diverse, users’ needs may also vary. The type and amount of information disclosed in the financial statements should be based on the most common needs of these users (GASB 1987). Investors and creditors who lend or participate in the lending process, as well as the legislative and oversight officials who directly represent the citizens, would be the primary users of financial statements. Gener-ally, users employ the information disclosed in the financial statements to assess a government’s accountability or to make an independent credit assessment for a wide variety of reasons.
Investors and CreditorsDirect bank loans increase the outstanding debt of a government, and might pose a risk to a government’s credit record and influence a government’s capability to meet their obligations as they come due. Therefore, investors and creditors should have access to all important provisions of the direct bank loan that a government is engaged in, in order to assess a loan’s risks and impacts.
Some provisions of a direct bank loan might lead to liquidity concerns for the in-vestors. For example, the maturity and amortization of the bank loan, the extraor-dinary prepayment terms, as well as the put/call options are related to the risks that a government might encounter in paying back its debts. Thus, the disclosure of these kinds of clauses would contribute to overall transparency and an efficient market for direct bank loans. Providing this information could provide investors and creditors a better understanding of the existing and future financial resources, actual and contingent liabilities, as well as the debt condition of a government. Also, investors and creditors could use this information to assess the government’s ability to continue offering resources for debt service in the future, which helps the people who have invested or plan to invest in the government’s bonds make relevant decisions.
169VOL 5, SPRING 2015
Evans school DEEp DivE TEam
Legislative and Oversight OfficialsIn addition to investors and creditors, both legislative and oversight officials should have access to the information related to the direct bank loans in order to accurate-ly assess the overall financial condition of the government. This could include debt structure and funds available for appropriation (when developing capital and oper-ating budgets), and program recommendations. Legislators are usually concerned with the level and sources of resources so as to see whether the resources are used in accordance with appropriations (GASB 1987). Direct bank loans are one of the sources of revenue that a government could obtain, which would impact its overall financial condition. Therefore, information concerning the direct bank loans, spe-cifically the general terms of the loan, source of repayment, and the information about the amount of additional debt and its impact on overall debt position, could help legislators make important assessment of the government’s financial condition and decisions concerning resource allocation.
Conclusion and RecommendationsOur analysis of available data, conversations with market participants, and review of existing literature revealed an unmet need for disclosure of direct loan terms. An absence of disclosure guidelines has led to disparate reporting standards and a lack of market transparency, which contradicts the GASB’s mission of greater ac-countability in public sector financial reporting. We recommend the GASB consider some of these items for disclosure in local government financial statements:
• Amount of the loan and impact on overall debt position, • Purpose of the loan, • Source of repayment, • Interest rate and conditions under which it would change, • Cross-default provisions, acceleration clauses, “most favored nation” clauses,
and other terms or covenants that may impair the rights of existing bondhold-ers, and
• General loan terms (including maturity date, payment dates, lender, and amor-tization schedule).
Disclosure of each of these items in annual financial statements has the potential to increase transparency with regard to direct bank loans, particularly for users seeking a more holistic understanding of an entity’s long-term liabilities. Although disclosure of these items within the financial statements may not satisfy stakehold-ers demanding timely disclosure of loans, it would support the need for uniform disclosure and standard reporting in this quickly growing market.
170 THE EVANS SCHOOL REVIEW
Financial implications oF Direct Bank lenDing anD carBon emissions traDing
Accounting Implications of Carbon Emissions Trading
BackgroundAt the time of writing, there are two major emissions trading programs active in the United States. In New England, the Regional Greenhouse Gas Initiative (RGGI) is a multistate carbon market primarily aimed at curbing emissions from large single source emitters. In RGGI states, these emitters are, for the most part, coal fire power plants, and the market has generally remained relatively small. On the other coast, California is currently running an emissions exchange that is primarily contained to that one state. In 2007, the Western Climate Initiative was proposed as a sweeping carbon market that would include many states in the western US but was ultimately defeated in every state’s voting body save California. The resulting program is mostly based on the WCI’s proposed legislation and does include some elements from Quebec, Canada.
The challenge of integrating carbon emission mitigation strategies with economic realities has led many governments at both the national and state level to the solu-tion of emissions trading markets. Governments and regulating bodies can use car-bon markets as a strong source of revenue and private entities can find investment opportunities in well-structured carbon markets. These factors taken together allow for a convergence of environmental policy goals and economic advantages. Emissions trading schemes, also referred to as carbon markets, emissions markets, cap and trade systems, or right to pollute systems, are an attempt by govern-ment regulators to reconcile the often disparate goals of commercial ventures and environmental protection. In a typical emission trading scheme, a government actor will set an overall amount of polluting emissions they deem allowable in their jurisdiction. Upon arriving at this amount, they will begin distributing allowances or credits that represent the right for entities to produce and emit a predetermined amount of carbon dioxide, sulfur dioxide, or other greenhouse gas product.
These allowances are surrendered to the regulating body at a predetermined time, usually annually, and typically also have a set expiration date to prevent hoarding of excess allowances. Over time, the total emission limit is typically lowered so as to achieve a net reduction in total emissions. Depending on the system in question, allowances can be allocated free of cost to emitters, sold at auction, distributed at a reserve price, or some combination of these methods.When prices for allowances are higher, there is stronger pressure to emit less and
171VOL 5, SPRING 2015
Evans school DEEp DivE TEam
thus greater environmental gains are achieved.
While it greatly varies from scheme to scheme, emitters who bear the responsibil-ity of obtaining and surrendering emission allowances can be legally required to play a part in the system, can opt into the scheme’s coverage, or can be outside non-emitting parties seeking to take advantage of the secondary market. This secondary market is the trade half of cap and trade. Within the limits set by the regulating body, entities both large and small are allowed to trade their emissions allowances at whatever rate the market will bear. Outside investors can obtain credits with the intent to resell them later at a profit or simply retire the credits from circulation in order to help reduce greenhouse gas emission. While the ac-counting for these private entities who either consume or invest in emission credits is somewhat straight forward, the regulating government bodies face a very differ-ent and unique set of account challenges.
Current Disclosure PracticesCurrent GASB standards do not have any specific requirements for emission trad-ing programs. Aside from the potential challenges discussed in the case on Mas-sachusetts. However, existing GASB financial statement disclosure requirements work well for disclosing the emission trading programs in terms of the income statement impact. These requirements are mainly established by existing GASB statements, including Statements No. 34, No. 38 and No. 54, and they meet the characteristics of relevance, understandability, comparability, timeliness, consis-tency, and reliability. Disclosure from the perspective of balance sheet impact is discussed in other parts, such as the unused allowances.
California’s cap-and-trade program took effect in early 2012. Based on its Cap and Trade Auction Revenue Expenditure Plan, the proceeds are used for multiple purposes including clean transportation and energy efficiency.1 Therefore, we can infer that revenues of some governmental funds (Transportation Fund and Environ-mental and Natural Resources Fund) may be partly contributed by cap-and-trade proceeds. However, none of the currently held emission allowances are recognized on the governmental fund balance sheet and none of the relevant activities are dis-closed by California’s Comprehensive Annual Financial Report (CAFR).According to its 2013-2014 Budget Act, $500 million from the designated fund would be loaned to its general fund and $100 million will be repaid according to the Governor’s budget (California Legislative Analyst’s Office 2014). Nothing
1 Portions of this section are adapted from “Carbon Accounting Challenges: Are you Ready?” De-loitte Center for Energy Solutions 2009 (Washington, DC).
172 THE EVANS SCHOOL REVIEW
Financial implications oF Direct Bank lenDing anD carBon emissions traDing
directly related with the cap-and-trade program was shown on California’s CAFR in 2012 and 2013. However CAFR mentioned the proposed repayment of the cap-and-trade loan in 2014-2015. Since California hasn’t published its CAFR for fiscal year 2014, we may expect this inter-fund transfer to be shown on the coming report.
Among the RGGI member states, only Massachusetts has disclosed direct in-formation about its emission allowance program on its CAFR. As stated in the Regional Investment of RGGI CO2 Allowance Proceeds, 2012 report, the total cumulative fund generated from RGGI allowances up to 2012 was $984,763,052. $93,100,000 of this total was transferred to the general funds by some states (RGGI 2012).
Accounting and Financial Reporting ChallengesIn our assessment, carbon markets present four main challenges to government financial accounting and reporting. Here we detail each of those concerns.
Valuation of Carbon AllowancesThere is inherent volatility in the price of carbon. This uncertainty creates two main issues. The first and most obvious issue is that price fluctuations of allowances impact investor confidence. The second issue is that price volatility impacts the cost of production for private industry significantly. Regulated firms are subject to the greatest risk exposure considering past market variability. Governmental bodies additionally stand to sustain large variations in asset and liability accounts depend-ing on their allowance valuation methods.
There are two main allowance methods originally proposed by the International Accounting Standards Board’s (IASB) International Financial Reporting Interpre-tations Committee (IFRIC). In December of 2004 these organizations proposed that allowances are to be accounted for as intangible assets subject to the following definitions:• At cost (nominal amount), or the value of the allowance at the time of pro-
curement or,• Fair value, or the current value of the allowance on an active market.
While there is a general agreement on the use of fair-value accounting methods, there has been little research into the particular valuation methodologies that should be used when valuing carbon allowances. In accordance with prior GASB guidance, a fair-value accounting mode requires a government to determine “the
173VOL 5, SPRING 2015
Evans school DEEp DivE TEam
principal (or most advantageous) market for” the carbon allowance to be mea-sured. Considering the data used in fair-value accounting (depending on the level of accounting) this would entail determining the market with the most accurately quoted market prices, quoted prices for similar assets or liabilities, interest rates and yield curves, or credit spreads.
Level 1 accounting appears to be the most advantageous because it provides the most accurate representation of an asset’s fair value. In order to accurately mea-sure assets using the Level 1 method, a governmental entity must first determine the most accurate valuation method. IFRS 13 describes three valuation approaches (IFRS 13 B5–B33): the market approach, the income approach, and the cost ap-proach. As the IFRS implies, in order to accurately use a market-based valuation method, an active market must first be identified from which a transaction price paid for an identical or a similar instrument can be used to value the carbon allow-ance.
However, current markets are likely not stable enough to justify the use of Level 1 fair-value accounting. Furthermore, the external factors accounting for wide varia-tions in prices on secondary carbon markets can be limited to a few factors, such as:• Introduction of new renewable energy policies: Any added subsidies to state
or federal policies that offer incentives for the large emitters regulated under emissions trading systems (ETS) to install renewable energy sources have the potential to quickly and greatly reduce a firm’s carbon footprint. In response, many firms may need to purchase allowances to offset their carbon outputs, and those purchases can have a drastic effect on the spot price of carbon in the secondary markets, such as ICE, that governments use in determining their fair-value accounting.
• Vintage retirement: As one vintage of carbon allowances is retired and a new vintage is released most ETSs are structured to reduce the amount of available allowances as vintages progress. In preparation for this, ETSs assume firms will account for the rising cost of allowances as they become scarcer with each vintage.
• Economic recessions: Immediately after its inception, the EU ETS allowance spot price on secondary markets “fell from almost 30€/tCO2 in mid-2008 to less than 5€/tCO2 in mid-2013” (Koch 2014). There has been a dearth of research attempting to explain the factors leading to this sudden collapse of the EU ETS allowance price. While the factors listed above arguably have a large effect on prices within secondary markets, most of the research to come out in
174 THE EVANS SCHOOL REVIEW
Financial implications oF Direct Bank lenDing anD carBon emissions traDing
recent years have pointed to the Great Recession of 2008, which began in the US, as the primary driver of the EU ETS price collapse.
Unused Credits and AmortizationIn both of the carbon market models observed in the United States, RGGI and California, suppliers have and often exercise the ability to hold onto credits. That is, after the closing of an auction, some credits may remain in the possession of the government. Often, these credits are purposefully withheld to be sold at a later date, either to companies who could not afford the original price or to correct inaccurate pollution estimates. The California Air Resources Board also sets aside a certain number of credits for allowance price containment reserves and a voluntary renewable electricity program. Carbon credits in most models have a set period of time in which they must be “used”, a shelf life. After that time, they lose their value and their ability to count towards a company’s compliance within the carbon offset model.
In the markets that exist today, carbon credits expire after a period of time whether or not they have been used. Credits are also not required to be used on purchase, but are rather “held” until the emitter reaches a certain level of pollution. As a credit loses remaining time for use, it also loses its value to the emitter who must pollute at a certain level in order to use it. If not, the credit retires and counts sim-ply as a loss on the part of the emitter. As market prices change and credits move through the market with varying life spans remaining, setting a standard for valua-tion is imperative for knowing how much an older credit is worth. This will enable governments to properly account for their value if we do treat carbon credits as an asset on balance sheets.
Governments may decide to purposefully hold onto a carbon credit until it retires. Retirement normally refers to the purposeful withholding of a carbon credit until it reaches its expiration date. In this way, governments can force emitters to reduce pollution by denying them the option to purchase and allowing the credits to reach full maturity without ever being placed on the market. There is also precedent of purchasers other than the government holding onto credits until retirement, hop-ing to force emitters into reducing their greenhouse gas emissions.
Using fair-value accounting would accurately track the loss of value over time of carbon credits. However, this would require stable markets that react to external price factors. In the absence of a traditional market, setting up an amortization schedule may be the best way to track the loss of value over time. For example,
175VOL 5, SPRING 2015
Evans school DEEp DivE TEam
each quarter a carbon credit would drop in value. The asset would lose value on a balance sheet and the sale price would lessen.
Investing Carbon-Related RevenueWith the growth of emissions trading markets, it will undoubtedly become neces-sary for governments to consider how to manage and account for this new source of revenue. When revenue is recurring and is specifically earmarked for a pre-determined purpose, a trust fund is one tool governments have to manage these funds. There are certainly advantages to using trust funds: Namely, more protec-tion for these funds from the regular budgeting process and the ability to have a government engage in long term financial planning. There are, however, inherent weaknesses in trust funds that could be exacerbated in trusts that are incorporated through trading-based revenue.
The inherent weakness of trust funds is that by having revenue and appropriations that are indirectly controlled by legislatures, there is a level of disconnect from the voting populace over how their money is being spent. At the same time, trust funds are also not fully immune from the regular appropriations process despite their financial status. In essence, those who create funds can also undo them and create a false sense that these funds are more protected than they really are. Lastly, there is great differentiation in how trusts are reported and how transparent they are (Patashnik 1997).
These inherent shortcomings of government trusts may not require any new re-porting requirements if those trusts are long established and their funds allocated from a predictable source of revenue. However, emissions-based trusts may need to be held to a different standard. Trusts in this financial space are established from revenue earned from a new emerging market that is prone to great fluctuation in value and pricing. More robust and streamlined disclosure requirements may be needed to ensure that bond purchasers have the best
Governments as EmittersThe bulk of this report addresses financial reporting standards for governments as regulators. However, many public utilities and transportation agencies may find value in understanding and possessing standards as emitting entities. The struggles associated with this type of financial reporting have been well documented within the corporate sector, and these lessons should help address concerns for govern-mental entities as emitters.
176 THE EVANS SCHOOL REVIEW
Financial implications oF Direct Bank lenDing anD carBon emissions traDing
Offsets and Renewable Energy Credits (REC)Emission trading schemes are not the only newly developed program to address en-vironmental concerns. The growth of emission trading has also given rise to carbon offset markets, in which entities purchase carbon allowances and hold them to pre-vent emitters from purchasing the allowances. Renewable energy credits (RECs) are another popular government program. RECs provide emitters with incentives such as tax credits and grants in exchange for investing in renewable energy, and therefore decreasing their carbon use. Any proposed financial accounting standards pertaining to emission trading schemes may want to consider the implications these rules may have on these other programs.
Conclusion and RecommendationsAs these markets evolve and mature, the management and accounting for cor-responding revenue within the program proceed funds will become of consider-able importance. California’s cap-and-trade program raises $500 million per year, RGGI generated over $90 million in the most recent 2014 auction, and if passed, Washington State is estimated to raise up to $4 billion per year by 2030. States have thus established trust funds for proceeds. These funds may not require additional disclosure, but recent events suggest that funds such as these are often used to bal-ance budgets and routinely ignore their stated purposes. California’s cap-and-trade proceed funds of $500 million were recently loaned to the state’s general fund. Current disclosure requirements for these funds are inconsistent and not always easily accessible.
Public utilities and transportation agencies represent a large percentage of emitting entities, and it may be in GASB’s best interest to consider establishing accounting standards for governments, as emitters. Many recommendations appear to con-clude similar treatment for governments as regulators, but there are inherent dif-ferences that must be addressed. As previously mentioned, emitters view emission credits in a much less consistent context as regulators, which could cause confusion when determining the type of asset that the credit may be. Another unique aspect for emitters is the need to determine how many emission credits will be required for the current compliance period. Estimates are a popular option in practice, but measurement at a specific point in time may provide greater consistency.
The findings of this report attempt to provide GASB with direction to next steps required to determine accounting standards for emission trading schemes. Treat-ment of these programs appear to be repeatable for a number of similar programs, and consistency appears to suggest these markets are well established, enduring,
177VOL 5, SPRING 2015
Evans school DEEp DivE TEam
and in need of accounting standards.
178 THE EVANS SCHOOL REVIEW
Financial implications oF Direct Bank lenDing anD carBon emissions traDing
References
Jacobs, T., Cortez, R., & Patel, D. (2011). Direct Bank Loans Carry Credit Risks Similar to Variable Rate Demand Bonds for Public Finance Issuers. Moody’s Inves-tor Service.
Breckinridge Capital Advisors (2014) “The Impact of Private Placement Bonds and Direct Lending on the Municipal Market.” Available at: http://www.breckinridge.com/insights/whitepapers.html?id=1476
Bodek, David (2014). Alternative Financing: Disclosure Is Critical To Credit Analy-sis In Public Finance. Publication. Standard and Poor’s.
Buswick, Geoffrey (2015). “Standard & Poor’s Maintains Its Focus On Direct Loans After Evaluating $15.8 Billion In 2014.” Standard & Poor’s Americas. Standard and Poor’s. Web. 07 March 2015.
Municipal Market Advisors (2014) “Municipal Issuer Brief.” Available at: http://www.mma-research.com/MMA/ NonMembers/MMAIssuer/content/2014/MMA_Issuer_2014-08-18.pdf.
Governmental Accounting Standards Board (1987). “Concepts Statement No. 1 of the Governmental Accounting Standards Board.”
California Legislative Analyst’s Office (2014). Available at: http://www.lao.ca.gov/reports/2014/budget/cap-and-trade/auction-revenue-expendi-ture-022414.pdf
Regional Greenhouse Gas Initiative (2012). Available at: http://www.rggi.org/docs/Documents/2012-Investment-Report.pdf
Koch, Nicolas (2014). Causes of the EU ETS price drop: Recession, CDM, Renew-able Policies or a bit of everything? - New evidence. Available at: https://www.pik-potsdam.de/members/edenh/publications-1/CausesoftheEUETSpricedrop.pdf
Patashnik, Erik (1997). “Unfolding Promises: Trust Funds and the Politics of Pre-Commitment.” Political Science Quarterly 112(3): 432-452.
179VOL 5, SPRING 2015
Evans school DEEp DivE TEam
Federal Depository Insurance Corporation (2014). Assets and Liabilities of FDIC-Insured Commercial Banks and Savings Institutions. Available at: https://www2.fdic.gov/SDI/SOB/
California Debt Investment Advisory Commission (2014). Available at: http://www.treasurer.ca.gov/cdiac/