The evidence that isoniazid reduces the risk of developing active TB in PLHIV Planning workshop to accelerate the implementation of HIV/TB collaborative activities in selected African countries Addis Ababa, Ethiopia, 13-14 November 2008 Reuben Granich WHO HIV/AIDS Department
Transcript
The evidence that isoniazid reduces the
risk of developing active TB in PLHIV
Planning workshop to accelerate the implementation of
HIV/TB collaborative activities in selected African countries
Addis Ababa, Ethiopia,
13-14 November 2008
Reuben Granich
WHO HIV/AIDS Department
Towards Universal Treatment Access
IPT Policy
A. Establish NTP-NACP collaborative mechanisms Set up coordinating bodies for effective TB/HIV activities
at all levels
Conduct surveillance of HIV prevalence among TB cases
Carry out joint TB/HIV planning
Monitor and evaluate collaborative TB/HIV activities
B. Decrease burden of TB among PLHIV (the "Three I's") Establish intensified TB case finding
Introduce INH preventive therapy Ensure TB infection control in health care and congregate
settings
C. Decrease burden of HIV among TB patients Provide HIV testing and counselling
Introduce HIV prevention methods
Introduce co-trimoxazole preventive therapy
Ensure HIV/AIDS care and support
Introduce ARVs
WHO 2004 policy on collaborative TB/HIV activities
WHO/UNAIDS 1998 IPT Policy
WHO TB/HIV Clinical Manual
WHO Guidelines for National TB Programmes
for the Management of Children
WHO HIV/AIDS Department Priority
Interventions (IAS Mexico 2008)
IPT is recommended for PLHIV
Implementation progress
The boundaries and names shown and the designations used on this map do not imply the expression of any opinion whatsoever on the part of the World Health Organization
concerning the legal status of any country, territory, city or area or of its authorities, or concerning the delimitation of its frontiers or boundaries.
Dotted lines on maps represent approximate border lines for which there may not yet be full agreement.
WHO 2006. All rights reserved
Countries providing data on IPT
prophylaxis to PLWHIV 2005
No reported activity
Countries reporting IPT
Countries reporting on IPT
Prophylaxis activity
Key
The boundaries and names shown and the designations used on this map do not imply the expression of any opinion whatsoever on the part of the World Health Organization
concerning the legal status of any country, territory, city or area or of its authorities, or concerning the delimitation of its frontiers or boundaries.
Dotted lines on maps represent approximate border lines for which there may not yet be full agreement.
WHO 2006. All rights reserved
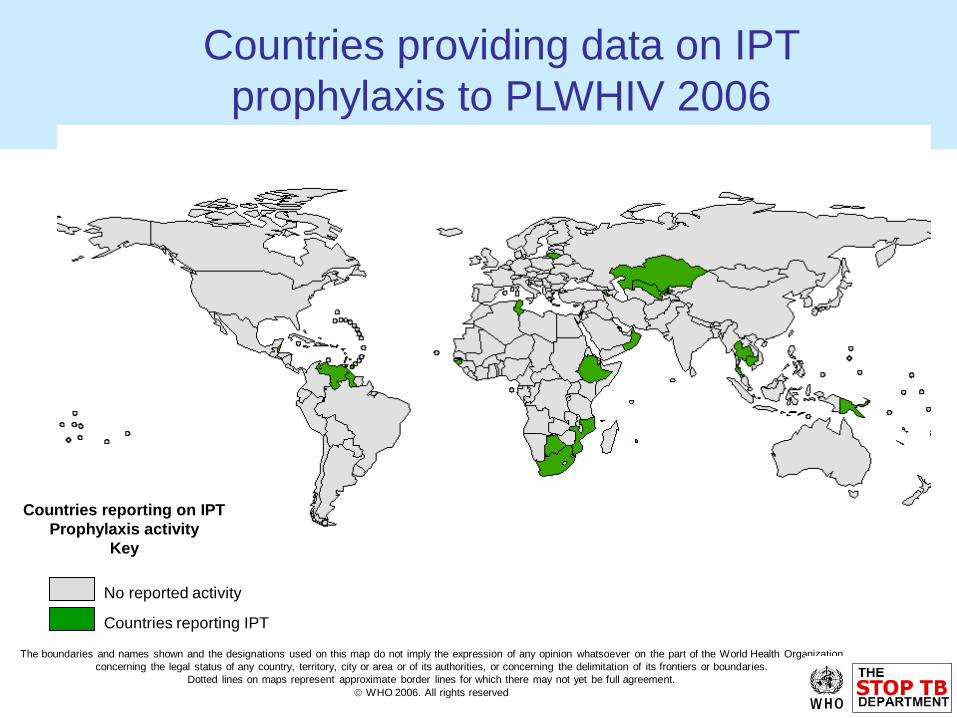
Countries providing data on IPT
prophylaxis to PLWHIV 2006
No reported activity
Countries reporting IPT
Countries reporting on IPT
Prophylaxis activity
Key
The boundaries and names shown and the designations used on this map do not imply the expression of any opinion whatsoever on the part of the World Health Organization
concerning the legal status of any country, territory, city or area or of its authorities, or concerning the delimitation of its frontiers or boundaries.
Dotted lines on maps represent approximate border lines for which there may not yet be full agreement.
WHO 2006. All rights reserved
Countries providing data on IPT prophylaxis to
PLHIV 2007 (provisional 7th Nov 2008)
No reported activity
Countries reporting IPT
Countries reporting on IPT
Prophylaxis activity
Key
Global progress in implementation of
TB/HIV interventions (2002-2007)
99 5 1
4 4 4
92
5627 47 3 3 5
84
72
2625
7
3 3
118
104
40
47
14
17 10
128
111
56
68
44
58
25
113
97
52
62
58
61
33
0.0
100.0
200.0
300.0
400.0
500.0
600.0
700.0
800.0
900.0
Tested for HIV HIV-positive CPT ART Screened for
TB
Diagnosed
with TB
IPT
Th
ou
sa
nd
s o
f p
atie
nts
2002
2003
2004
2005
2006
2007
Diagnosis and treatment of HIV in TB patientsDiagnosis, treatment and prevention of TB
Collaborative TB/HIV activities,
2002–2007,
GLOBAL PROGRESS
AFRO progress in implementation of
TB/HIV interventions (2002-2007)
32 45 2 3
12
12 7
2
5 3
9
8
7
9
13
8
0.0
50.0
100.0
150.0
200.0
250.0
300.0
350.0
Th
ou
sa
nd
s o
f p
atie
nts
2002
2003
2004
2005
2006
2007
2002 9.6 0.1 4.4
2003 0.8 0.0 7.9
2004 60.9 11.2 12.0
2005 47.6 24.3 22.2
2006 128.6 51.6 23.1
2007 322.3 153.0 15.4
Screened for TB Diagnosed with TB IPT
Diagnosis, treatment and prevention of TB in people with HIV
Collaborative TB/HIV activities, 2002–2007,
AFRICAN REGION
AFRO implementation of IPT, 2007
Countries with reported
policy on IPT (N=17)
Countries reported
provision of IPT (N=7)
• What's new in 2007?
•One more country in AFRO reporting (8)
•Only <1% of PLHIV put on IPT in AFRO
(and globally)
• Botswana reported 6042 (39%) of the
AFRO PLHIV on IPT
• Marked decrease from 19,034 in 2006
•South Africa is next on leader board with
5,642 up from 2,512
•Ethiopia Mozambique and South Africa
all recorded increases (1.5 fold to 5 fold)
in the numbers treated with IPT.
WHO Three I's Meeting
April 2008
• WHO HIV Department leadership
• Three I's are essential for quality HIV care
• Re-conceptualize WHO guidelines
• Make Three I's central to HIV care
• Develop new TB screening approach
• TB screening leads to IPT and IC
• IPT for those without TB symptoms
• HIV care and treatment should include
IC for TB
• WHO Three I's "push" and "pull" advocacy
0
100
200
300
400
500
600
700
800
1980 2000 2020 2040
Year
TB
Inc
ide
nc
e p
er
10
0,0
00
Baseline
TB Cure
TB Detection
TLTI to all HIV+
Lifelong TLTI to all HIV+
Reduced HIV Incidence
HAART 80% Adherence
HAART 100% Adherence
Modeled Trends in Impact of Interventions with
Increasing Coverage on TB Burden in Kenya,
1980 to 2030
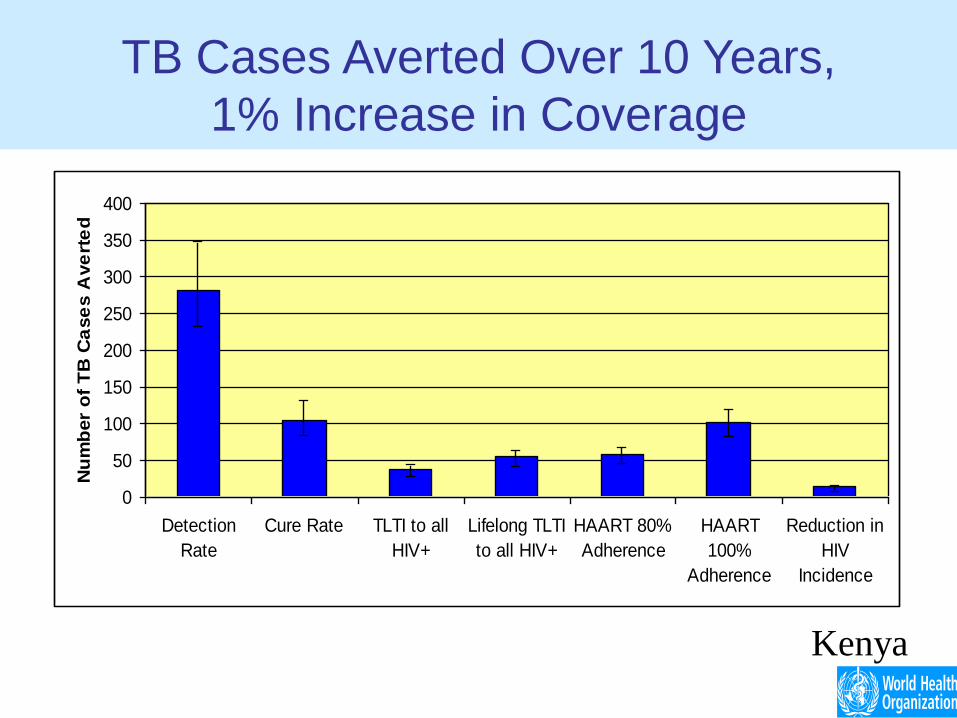
•Currie et al. AIDS 2003, 17:2501-2508
TB Cases Averted Over 10 Years,
100% Coverage
Kenya
0
5000
10000
15000
20000
25000
Detection
Rate
Cure Rate TLTI to all
HIV+
Lifelong TLTI
to all HIV+
HAART
80%
Adherence
HAART
100%
Adherence
Reduction in
HIV
Incidence
Nu
mb
er
of
TB
Ca
se
s A
ve
rte
d
Evidence for IPT
What the evidence tells us…..
•IPT reduces risk of TB in people living with HIV: • 62% reduction in PPD+
• 36% reduction overall
•IPT benefit may fade after 1-2 years in high prevalence settings
•HAART reduces TB risk, but still benefit of IPT
•Risk of selecting for resistance with IPT appears very low
•Active TB can be ruled out by clinical or laboratory screening in most patients
•No evidence of increased toxicity with IPT and HAART
1999 Bucher Systematic Review Duration of Protective Benefit for IPT
Results 2,367 Persons in the intervention (7 Studies)
RR for developing TB: 0.58 (CI: 0.43 – 0.80);
For TB-related death: 0.94 (CI: 0.83 – 1.07).
In TST+/-, RR for TB incidence 0.40 (CI: 0.24-0.65) and
0.84 (CI: 0.54 – 1.30), respectively
Protective benefit ranged from 0.4 - 37 months
Conclusion
Prophylaxis with IPT provides a sustained reduction against the risk
of contracting TB for persons with HIV infection
Source: Bucher H. Isoniazid Prophylaxis for Tuberculosis in HIV Infection: a meta-analysis of randomized controlled trials. AIDS. 13(4):501-507, March 11, 1999
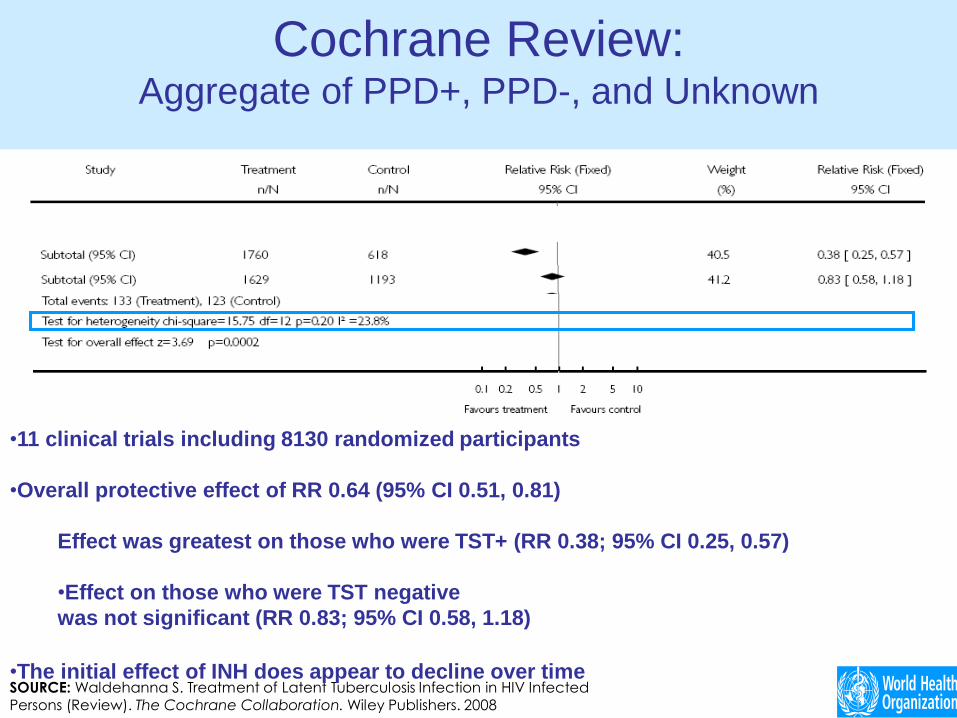
Cochrane Review: Aggregate of PPD+, PPD-, and Unknown
SOURCE: Waldehanna S. Treatment of Latent Tuberculosis Infection in HIV Infected Persons (Review). The Cochrane Collaboration. Wiley Publishers. 2008
•11 clinical trials including 8130 randomized participants
•Overall protective effect of RR 0.64 (95% CI 0.51, 0.81)
Effect was greatest on those who were TST+ (RR 0.38; 95% CI 0.25, 0.57)
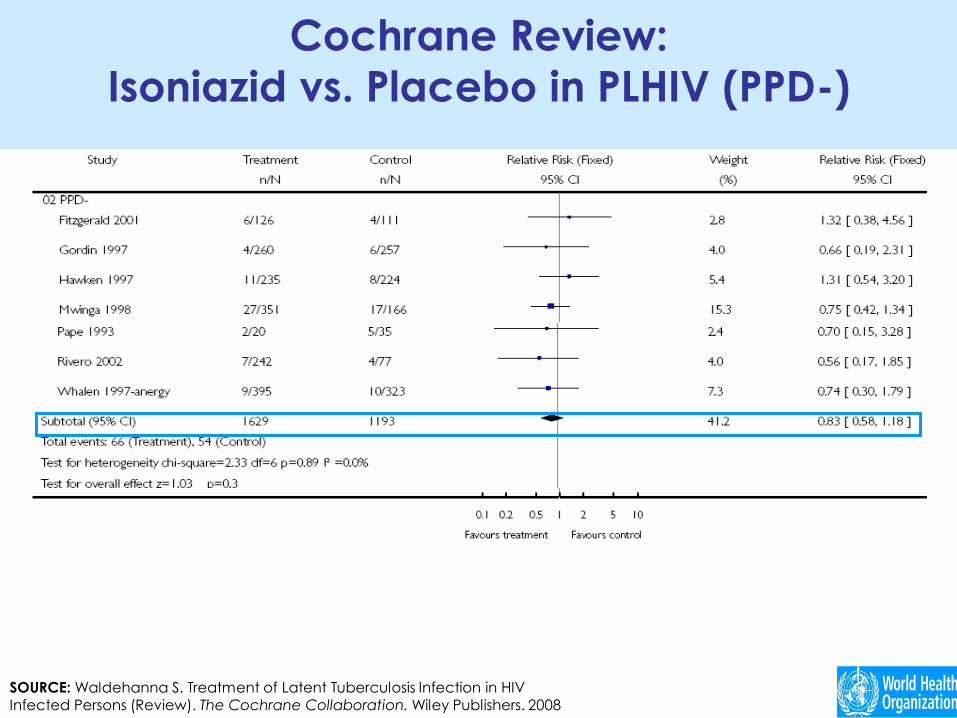
•Effect on those who were TST negative
was not significant (RR 0.83; 95% CI 0.58, 1.18)
•The initial effect of INH does appear to decline over time
How long does TB preventive
therapy work after randomization?
0
1
2
3
4
5
6
7
TB per 100 PY
0-6 6 to 18 18+
Months After Randomization
INH
RZ
Placebo
Mwinga et al., AIDS 1998;12:2447
TB rates by ARV and INH treatment status Rio de Janeiro, Brazil, 2003-2005
Exposure
category
Person-
Years
TB
cases
Incidence Rate
(per 100 PYs)
(95% CI)
Incidence
Rate Ratio
(95% CI)
Adjusted
Hazard Ratio*
(95% CI)
Naïve 3,865 155 4.01
(3.40-4.68) REF REF
HAART only 11,627 221 1.90
(1.66-2.17)
0.48
(0.39-0.59)
0.41
(0.31-0.54)
Isoniazid
only 395 5
1.27
(0.41-2.95)
0.32
(0.10-0.76)
0.57
(0.18-1.82)
Both 1,253 10 0.80
(0.38-1.47)
0.20
(0.09-0.91)
0.24
(0.11-0.53)
TOTAL 17,140 391 2.28
(2.06-2.52)
Golub JE, Saraceni V, Cavalcante SC et al. AIDS 2007
* Adjusted for age, sex, CD4, prior history of TB
Golub et al
Grant et al JAMA 2005
Work place study, 1999-2001
1655 SA mineworkers with HIV
38% reduction in TB overall
46% reduction in face of no history of
TB
TB incidence 9/100 person years
afterwards
Treatment of Latent TB in PLHIV
and Survival in Brazil
Pinho, AIDS 2001
IPT and Drug Resistant TB
(Balcell's 2006 meta-analysis)
SOURCE: Balcells M. Isoniazid Preventive Therapy and Risk for Resistant Tuberculosis. Emerging Infectious Diseases. www.cdc.gov/eid. Vol 12, No. 5. May 2006
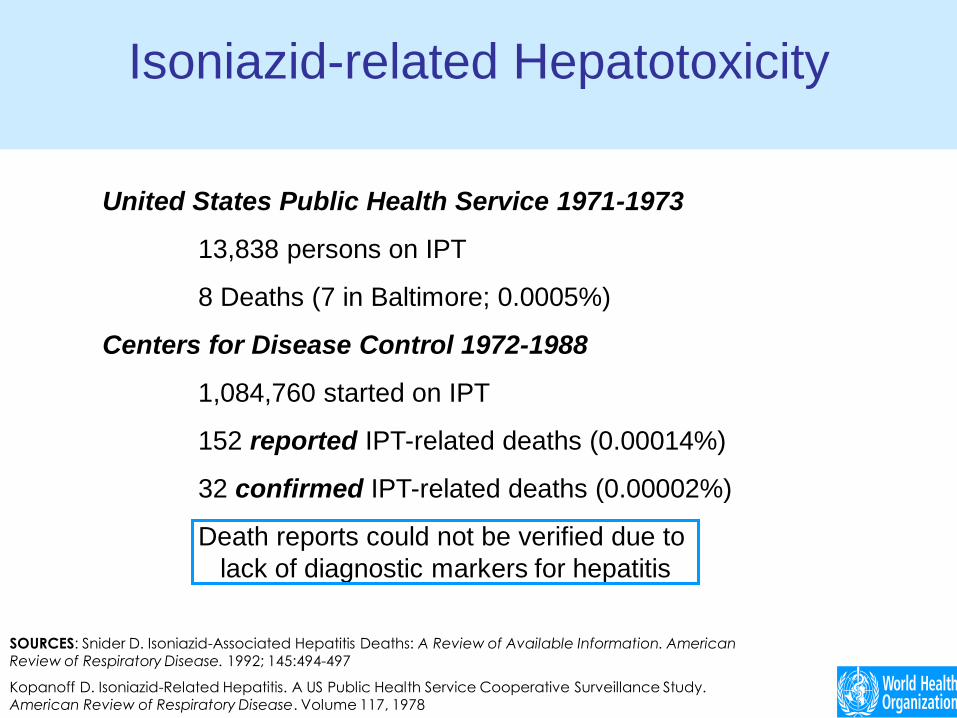
SOURCES: Snider D. Isoniazid-Associated Hepatitis Deaths: A Review of Available Information. American
Review of Respiratory Disease. 1992; 145:494-497
Kopanoff D. Isoniazid-Related Hepatitis. A US Public Health Service Cooperative Surveillance Study. American Review of Respiratory Disease. Volume 117, 1978
United States Public Health Service 1971-1973
13,838 persons on IPT
8 Deaths (7 in Baltimore; 0.0005%)
Centers for Disease Control 1972-1988
1,084,760 started on IPT
152 reported IPT-related deaths (0.00014%)
32 confirmed IPT-related deaths (0.00002%)
Death reports could not be verified due to
lack of diagnostic markers for hepatitis
Benefit of IPT following treatment
of active TB in PLHIV
0.45
0.3Haller (1999)
Fitzgerald (2000)
Churchyard (2002)
Reference
Incidence Rate Ratios & 95% CI
1.0
0.18
Woldehanna and Volmink, Cochrane Review 2006
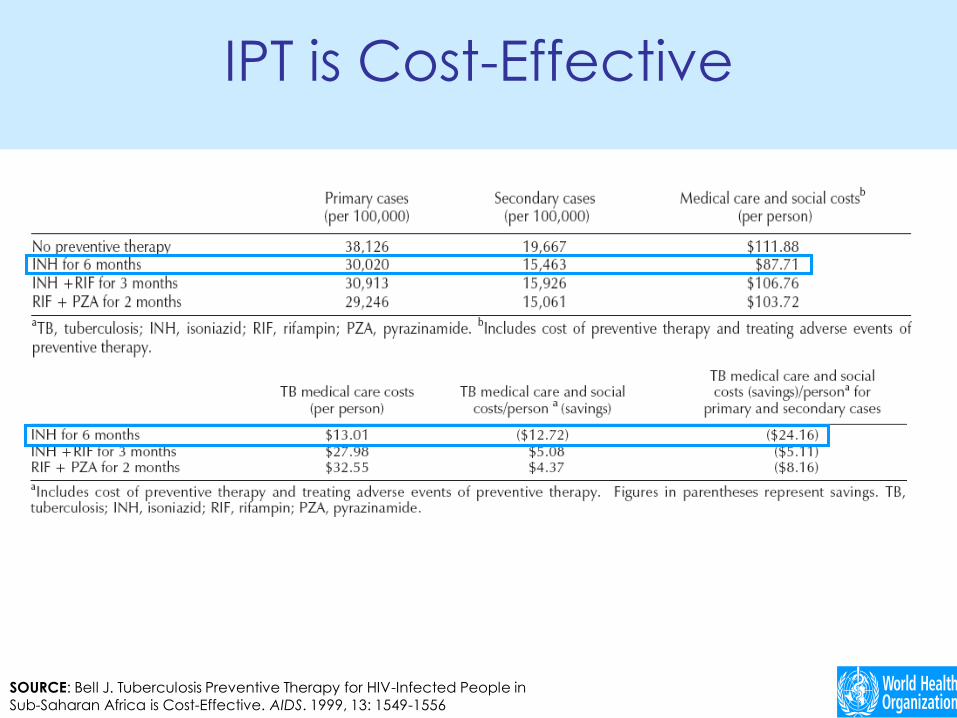
IPT is Cost-Effective
SOURCE: Bell J. Tuberculosis Preventive Therapy for HIV-Infected People in Sub-Saharan Africa is Cost-Effective. AIDS. 1999, 13: 1549-1556
Setting IPT Targets?
GLOBAL REPORTING of
HIV positive TB case detection and provision of CPT and ART
2007
42%
28%
15%
6%4%
28%
22%
8%3%1%
10%9%4%
-
100,000
200,000
300,000
400,000
500,000
600,000
700,000
800,000N
um
be
r o
f H
IV p
os
itiv
e T
B c
as
es
Estimated TB HIV 699,156 714,652 712,555 702,393 695,755
TB HIV detected 28,432 45,714 103,741 193,706 291,596
CPT provision 9,174 20,541 57,986 151,467 195,295
ART provision 10,186 9,823 28,864 65,330 70,939
2003 2004 2005 2006 2007
WHO-PEPFAR Collaboration:
Setting and achieving targets
Ethiopia
-HIV testing for 20,000 TB patients (>100% target)
-CPT to 5,000 HIV/TB patients (91% target)
-ART for 5,000 eligible HIV/TB patients (53% target)
Kenya
-HIV testing for at least 80% of new TB patients (84%)
-CPT for 80% of HIV/TB patients (90%)
-80% of HIV/TB patients access ART services (28%)
Rwanda
-HIV testing of 75% of TB patients (88%)
-CPT for 80% of HIV/TB patients registered (61%)
-ART for 40% of HIV-infected TB patients (36%)
Towards Universal Access to High Quality
HIV/TB Services
Number of people accessing high quality HIV/TB Services
Scaling up HIV/TB services in the
health sector
9
Global Demand for CTX/INH Co-Formulation
Based on 2004-2007 Data
Countries with > 1% of Global TB/HIV Burden # of People with HIV # of HIV/TB Cases
Total Eligibility for IPT/CPT
Brazil 620,000 8,947 611,052
Cote d'Ivoire 750,000 9,863 740,137
DRC 1,000,000 23,123 976,877
Ethiopia 1,000,000 18,488 981,511
India 5,700,000 26,989 5,673,011
Kenya 1,300,000 20,034 1,279,965
Lesotho 270,000 5,740 264,260
Malawi 940,000 15,548 924,451
Mozambique 1,800,000 26,304 1,773,696
Nigeria 2,900,000 43,895 2,856,105
Russian Fed. 940,000 8,312 931,687
South Africa 5,500,000 178,624 5,321,376
Swaziland 220,000 6,280 213,720
Tanzania 1,400,000 24,600 1,375,399
Uganda 1,000,000 19,441 980,559
Zambia 1,100,000 23,322 1,076,678
Zimbabwe 1,700,000 29,762 1,670,238
TOTAL 28,140,000 489,271 27,650,728
Global CTX/IPT Demand
Based on 2004-2007 Data
Countries with > 1% of Global TB/HIV Burden
Total Eligibility for IPT/CPT CD4 < 350 (40%) CD4 < 200 (25%)
Brazil 611,053 244,421 152,763
Cote d'Ivoire 740,137 296,055 185,034
DRC 976,877 390,751 244,219
Ethiopia 981,512 392,605 245,378
India 5,673,011 2,269,204 1,418,253
Kenya 1,279,966 511,986 319,991
Lesotho 264,260 105,704 66,065
Malawi 924,452 369,781 231,113
Mozambique 1,773,696 709,479 443,424
Nigeria 2,856,105 1,142,442 714,026
Russian Fed. 931,688 372,675 232,922
South Africa 5,321,376 2,128,550 1,330,344
Swaziland 213,720 85,488 53,430
Tanzania 1,375,400 550,160 343,850
Uganda 980,559 392,224 245,140
Zambia 1,076,678 430,671 269,170
Zimbabwe 1,670,238 668,095 417,560
TOTAL 27,650,729 11,060,292 6,912,682
Next steps
• Fast-track implementation of new WHO IPT/ICF
guidelines (2009)
• WHO and stakeholder technical support for
national governments to support Three I's
implementation
• Implement harmonized HIV/TB indicators
• Set national targets?
• Engage the community
• Strengthen engagement of country-level partners
WHO Three I's Meeting,
Geneva, April 2-4, 2008
Thank you
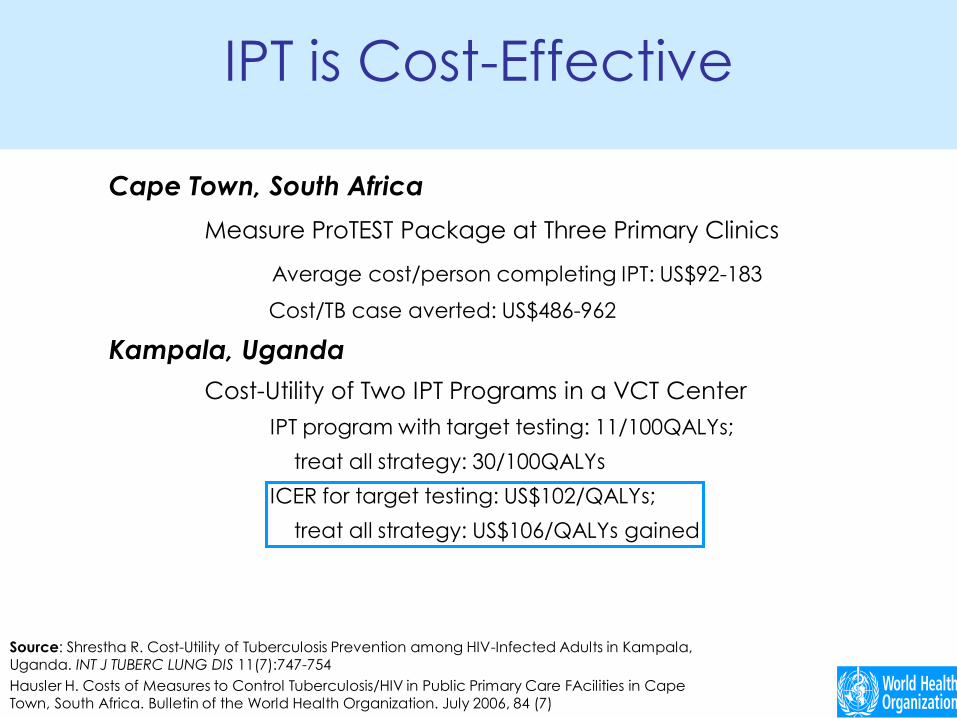
IPT is Cost-Effective
Cape Town, South Africa
Measure ProTEST Package at Three Primary Clinics
Average cost/person completing IPT: US$92-183
Cost/TB case averted: US$486-962
Kampala, Uganda
Cost-Utility of Two IPT Programs in a VCT Center
IPT program with target testing: 11/100QALYs;
treat all strategy: 30/100QALYs
ICER for target testing: US$102/QALYs;
treat all strategy: US$106/QALYs gained
Source: Shrestha R. Cost-Utility of Tuberculosis Prevention among HIV-Infected Adults in Kampala, Uganda. INT J TUBERC LUNG DIS 11(7):747-754
Hausler H. Costs of Measures to Control Tuberculosis/HIV in Public Primary Care FAcilities in Cape Town, South Africa. Bulletin of the World Health Organization. July 2006, 84 (7)
Resource mobilization:
What about Global Fund? PEPFAR?
Percentage of TB and HIV proposals with
TB/HIV component (R4-R6)
67
88 88
37
50
42
0
10
20
30
40
50
60
70
80
90
100
Round 4 Round 5 Round 6
TB Proposals with TB/HIV(%)
HIV proposals with TB/HIV(%)
Any one of the 12 collaborative TB/HIV activities mentioned in objectives or SDA of the proposal
%
%
%
%
%
%
Global Fund 18th Board Meeting:
decision point 12 (Delhi 2008)
PEPFAR’s TB/HIV Investments
•TB/HIV is a priority program area in PEPFAR
•PEPFAR support for TB/HIV programs has increased
almost 700% over four years – from $18.8 million in 2005,
to $48.6 million in 2006, to $130.9 million in 2007 and $169
million in 2008.
•Support efforts to mitigate the impact of TB/HIV need to be
integral across technical areas
•As of September 2007, PEPFAR had supported care for
approximately 367,000 TB/HIV co-infected people in the 15
focus countries
Cochrane Review:
Isoniazid vs. Placebo in PLHIV (PPD-)
SOURCE: Waldehanna S. Treatment of Latent Tuberculosis Infection in HIV Infected Persons (Review). The Cochrane Collaboration. Wiley Publishers. 2008
Cochrane Review: Isoniazid vs. Placebo in PLHIV (PPD Unknown)
SOURCE: Waldehanna S. Treatment of Latent Tuberculosis Infection in HIV Infected Persons (Review). The Cochrane Collaboration. Wiley Publishers. 2008